
Research on Ecological Compensation of National Parks Based on Tourism Concession Mechanism


Abstract
1. Introduction
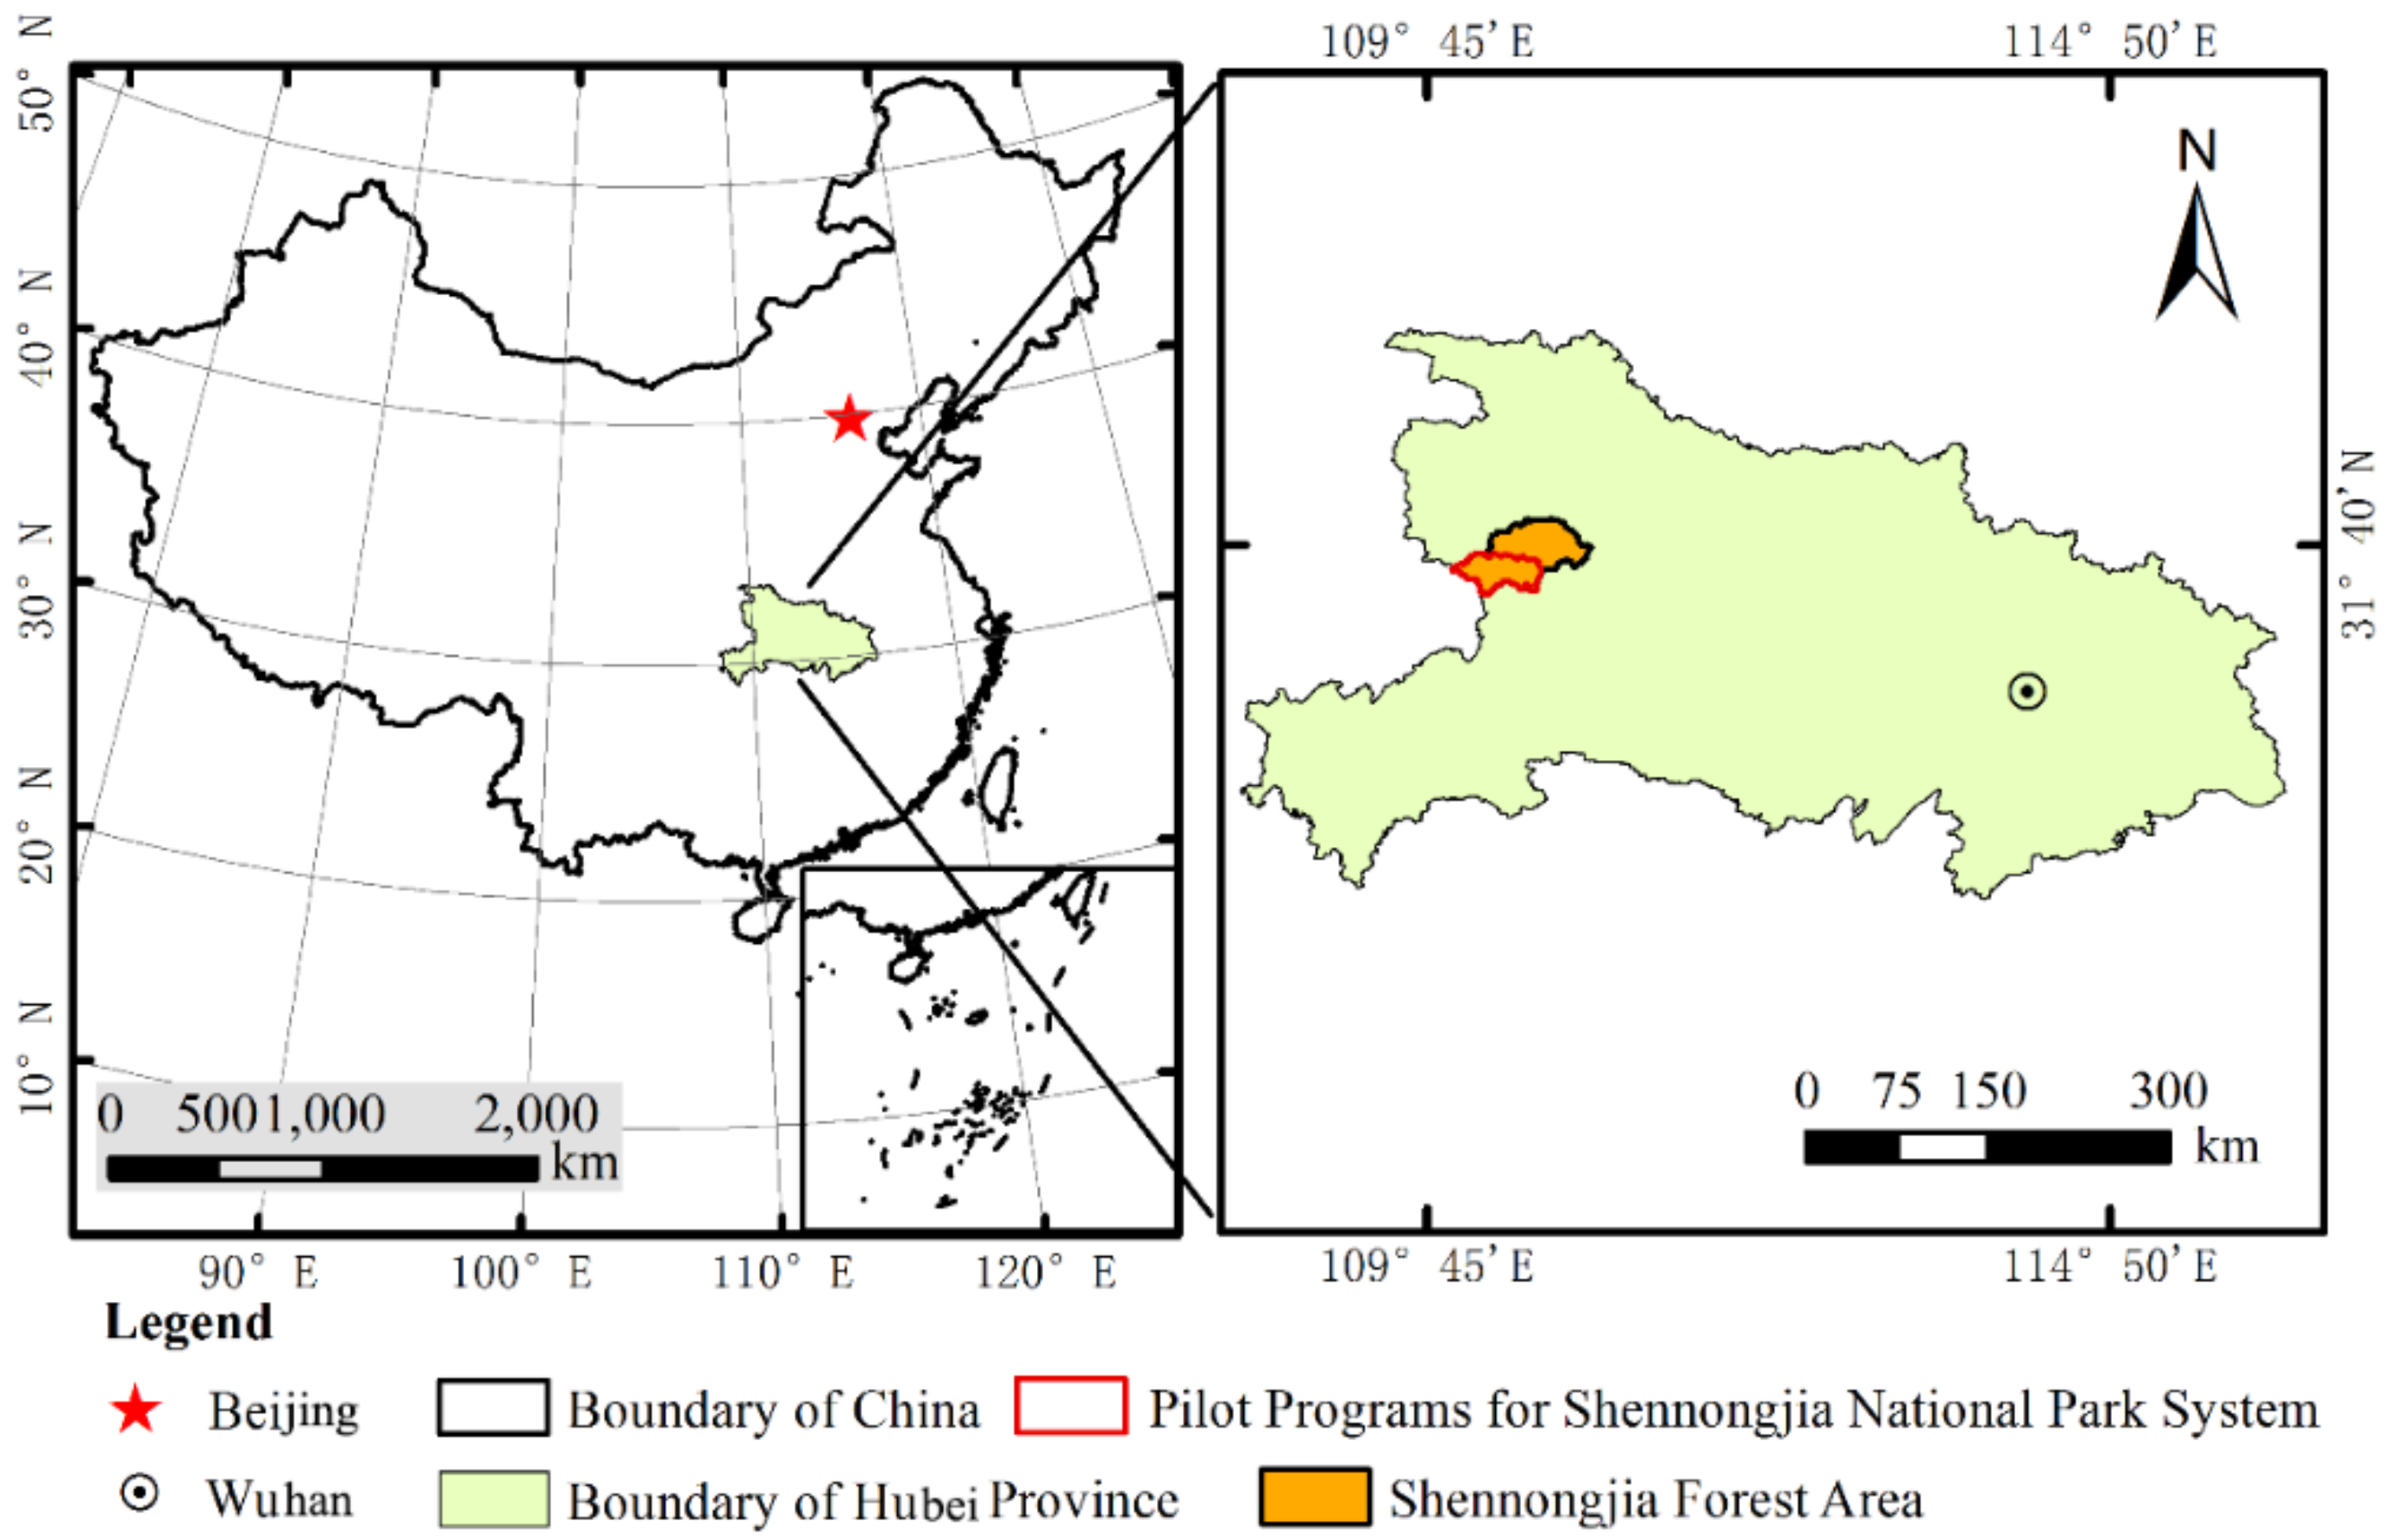
2. Study Area
3. Materials and Methods
3.1. Data Sources
3.2. Research Logic
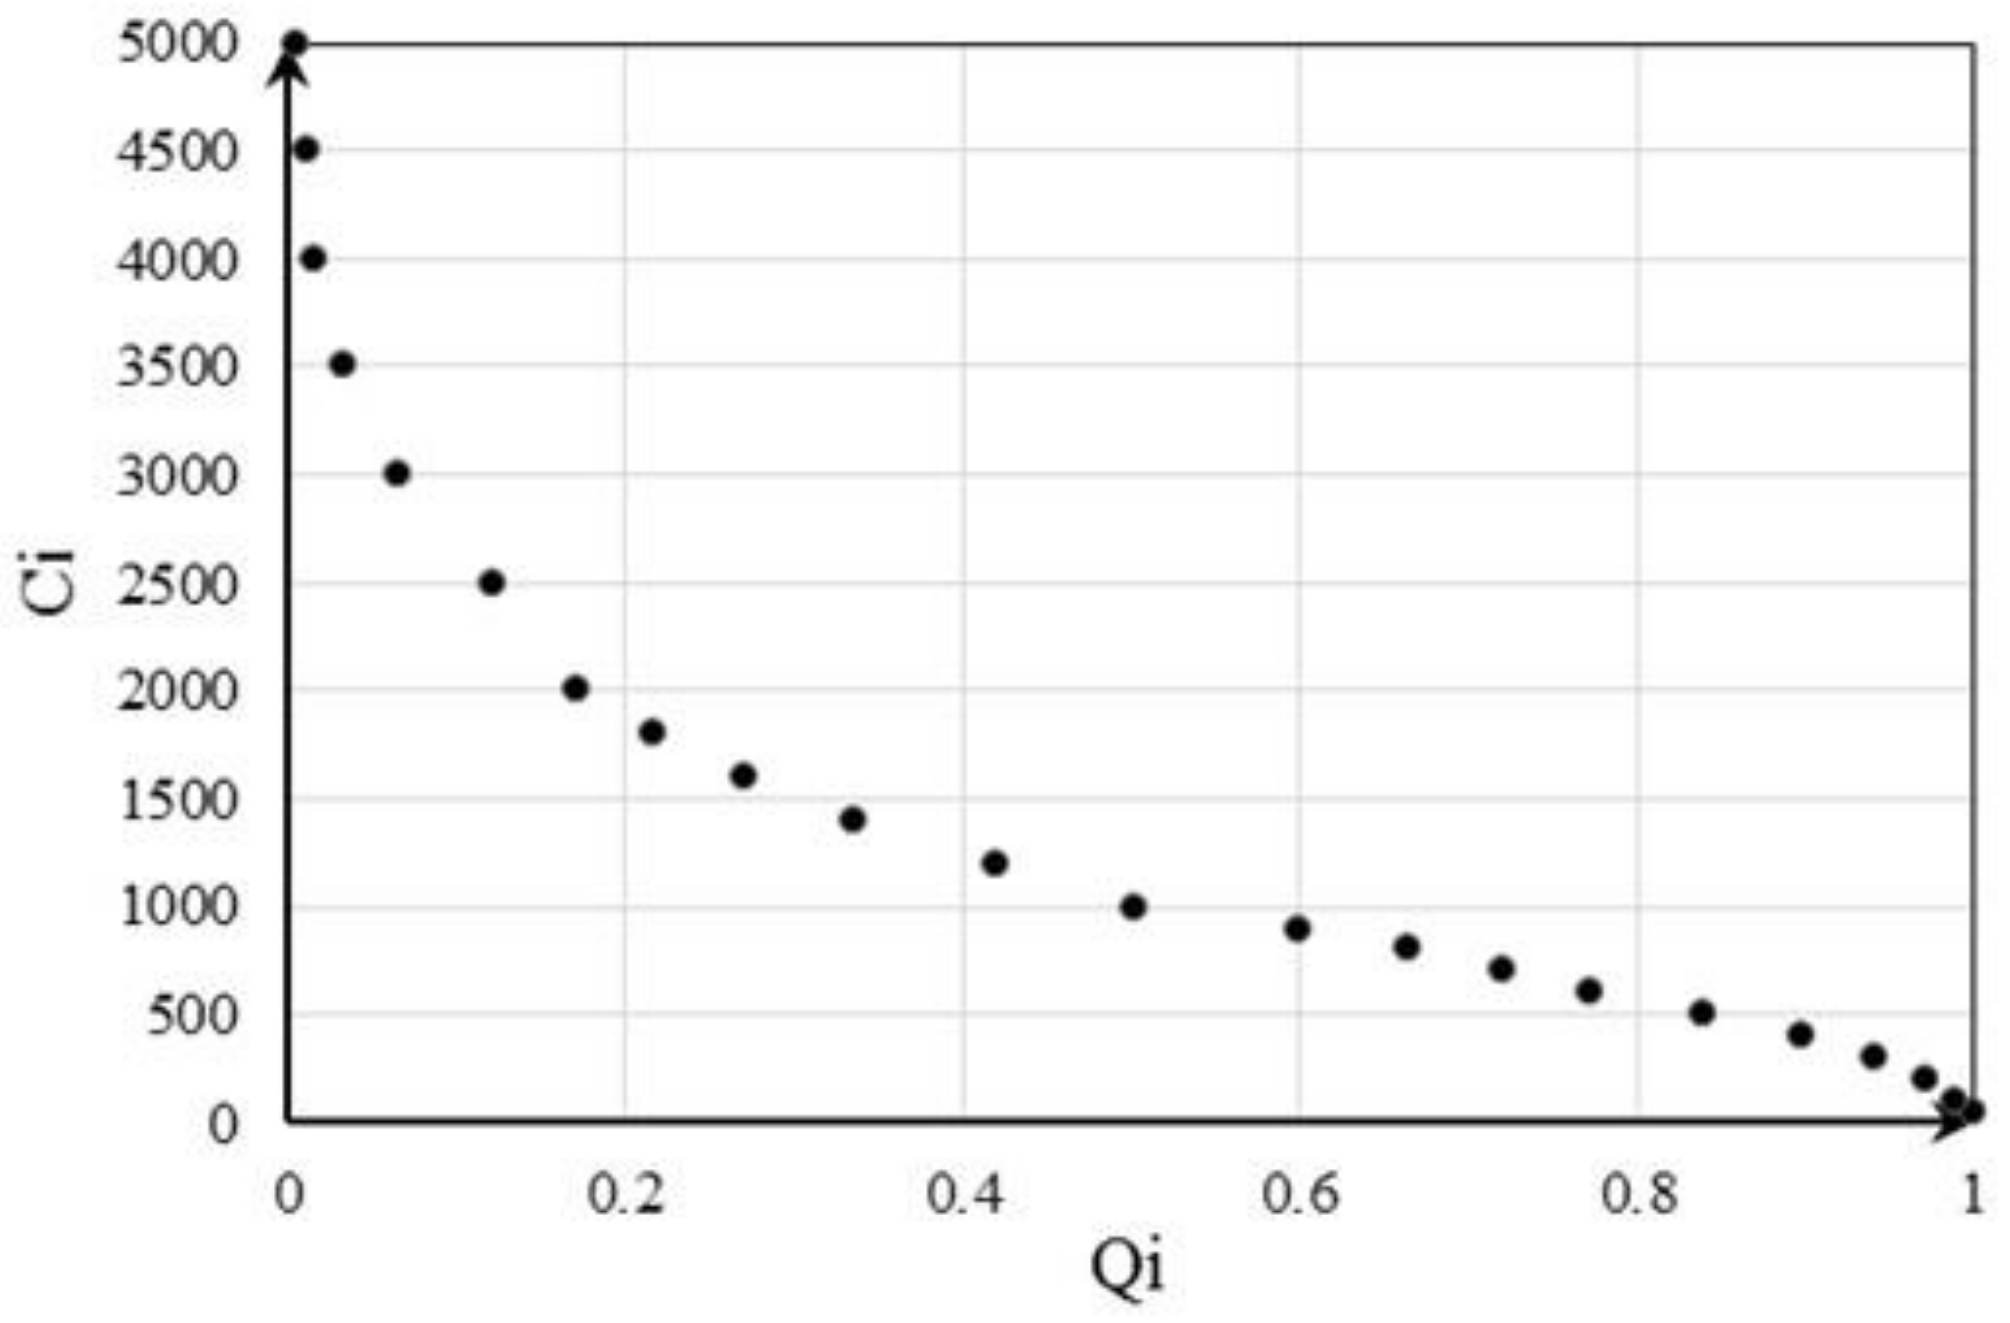
3.2.1. Calculating Landscape Use Value by TCIA
3.2.2. Calculating Landscape Non-Use Value by CVM
3.2.3. Calculating the Input Value of the Enterprise from Statistical Data
4. Results
4.1. Landscape Use Value
4.2. Landscape Non-Use Value
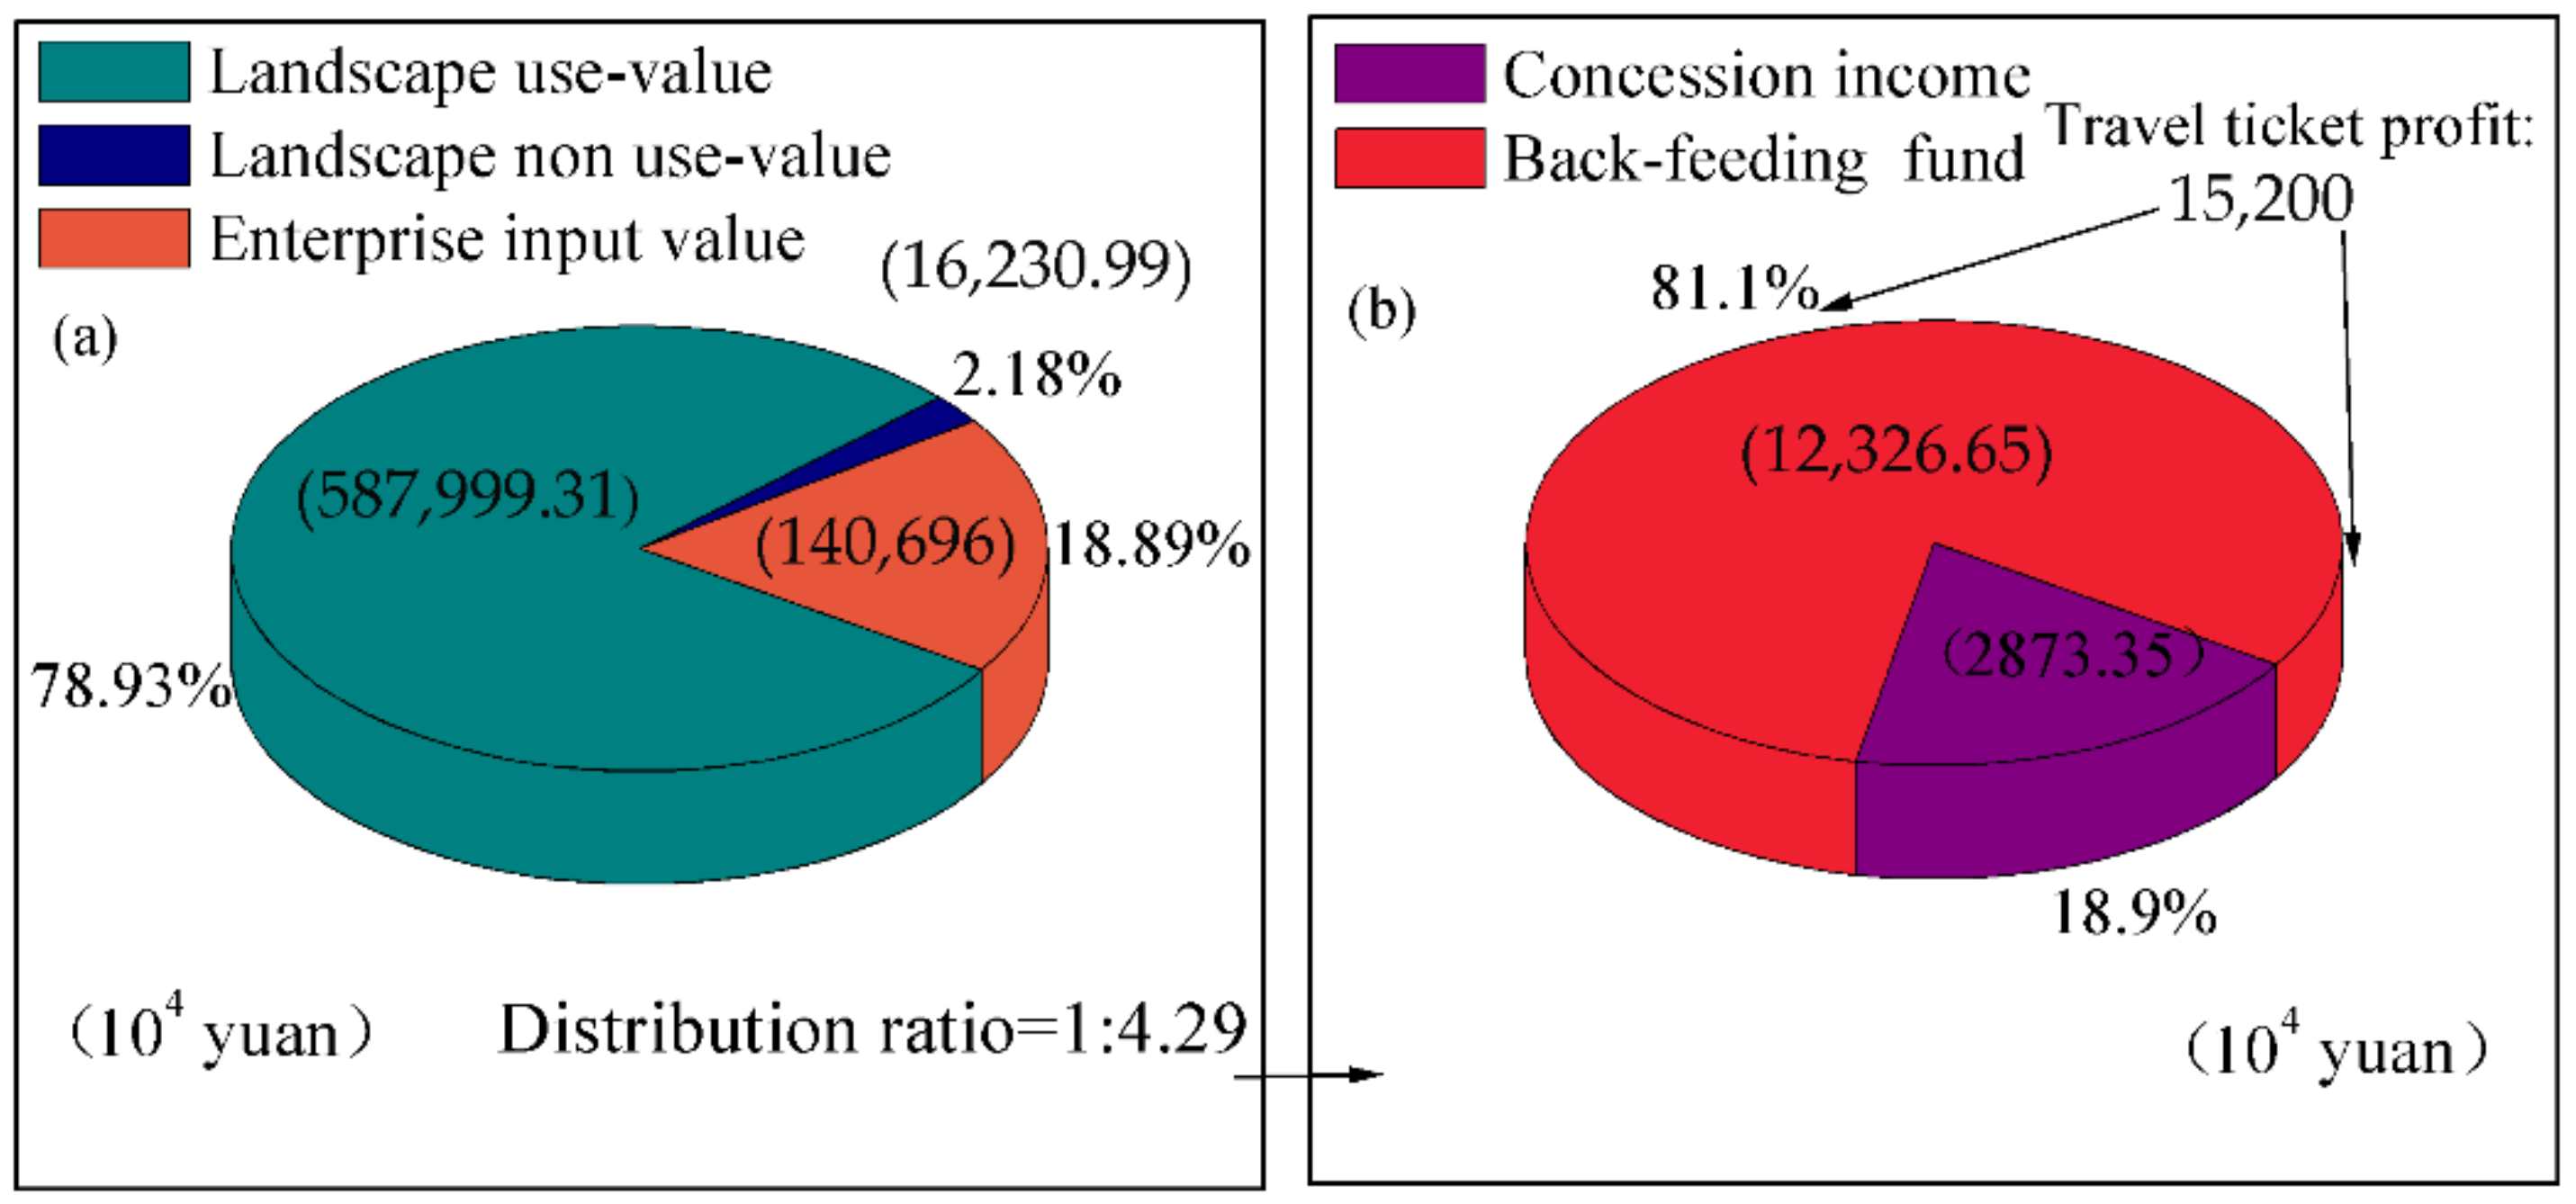
4.3. The Input Value of Concession Business, Travel Ticket Income Distribution Ratio, and Back-Feeding Fund Amount
5. Discussion and Conclusions
5.1. Discussion
5.2. Conclusions
- (1)
- This study constructed a long-term ecological compensation mechanism under the concession model of tourism back-feeding communities in PPSNPS. It is an effective technology to quantitatively evaluate the ecological compensation standard using the ecological compensation fund allocation ratio based on the input cost of the national park tourism concession enterprise and landscape value. The long-term ecological compensation scheme constructed in this paper clarifies that the SNPA and the STIC are the main bodies of ecological compensation. The calculation results show that the landscape value of PPSNPS in 2018 was 604,230.3 × 104 yuan, the input cost of STIC was 140,696 × 104 yuan, and the income after deducting tax from tourism tickets was 15,200 × 104 yuan. Thus, the allocation ratio of ecological compensation funds is 1:4.29, and the ecological compensation fund provided to SNPA from STIC is 12,326.65 × 104 yuan. This study provides an idea for the construction of a long-term ecological compensation mechanism for national park tourism concession.
- (2)
- TCIA and CVM are effective tools for the monetization and accounting of the national park tourism landscape value, and they can provide effective technologies for the distribution of the ecological compensation funds for the national park tourism concession.
- (3)
- Concession is an effective form for market participation in ecological compensation in national parks. The long-term ecological compensation mechanism in national parks cannot be limited to a single method and a single source. Multiple compensation methods should be encouraged, and multiple market entities and communities should participate. In the future, the construction of multiple long-term ecological compensation mechanisms for nature reserves should be further explored.
Author Contributions
Funding
Institutional Review Board Statement
Informed Consent Statement
Data Availability Statement
Acknowledgments
Conflicts of Interest
References
- Shang, W.X.; Gong, Y.C.; Wang, Z.J.; Stewardson, M.J. Eco-compensation in China: Theory, practices and suggestions for the future. J. Environ. Manag. 2018, 210, 162–170. [Google Scholar] [CrossRef] [PubMed]
- Buchanan, M.J.; Stubblebine, W.C. Externality. Economica 1962, 29, 371–381. [Google Scholar] [CrossRef]
- Kosoy, N.; Martinez-Tuna, M.; Muradian, R.; Martinez-Alier, J. Payments for environmental services in watersheds: Insights from a comparative study of three cases in Central America. Ecol. Econ. 2007, 61, 446–455. [Google Scholar] [CrossRef]
- Liu, M.C.; Min, Q.W.; Yang, L. Rice Pricing during Organic Conversion of the Honghe Hani Rice Terrace System in China. Sustainability 2018, 10, 183. [Google Scholar] [CrossRef]
- Wang, W.; Xin, L.J.; Du, J.H.; Chen, B.; Liu, F.Z.; Zhang, L.B.; Li, J.S. Evaluating conservation effectiveness of protected areas: Advances and new perspectives. Biodivers. Sci. 2016, 24, 1177–1188. [Google Scholar] [CrossRef]
- Nelson, E.; Mendoza, G.; Regetz, J.; Polasky, S.; Tallis, H.; Cameron, D.R.; Chan, K.M.A.; Daily, G.C.; Goldstein, J.; Kareiva, P.M.; et al. Modeling multiple ecosystem services, biodiversity conservation, commodity production, and tradeoffs at landscape scales. Front. Ecol. Environ. 2009, 7, 4–11. [Google Scholar] [CrossRef]
- Norton, D.A. Biodiversity Offsets: Two New Zealand Case Studies and an Assessment Framework. Environ. Manag. 2009, 43, 698–706. [Google Scholar] [CrossRef]
- Persson, J. Perceptions of environmental compensation in different scientific fields. Int. J. Environ. Stud. 2013, 70, 611–628. [Google Scholar] [CrossRef][Green Version]
- Lindberg, K.; Hawkins, D.E. Ecotourism: A Guide for Planners and Managers; The Ecotourism Society: Bennington, VT, USA, 1993. [Google Scholar]
- Zhang, J.P. Ecotourism and the Benefit of Local Residents—An Analysis of Successful Experience of Ecotourism in Kenya. Tour. Trib. 2003, 18, 60–63. [Google Scholar]
- Archabald, K.; Naughton-Treves, L. Tourism revenue-sharing around national parks in Western Uganda: Early efforts to identify and reward local communities. Environ. Conserv. 2001, 28, 135–149. [Google Scholar] [CrossRef]
- Liu, M.C.; Bai, Y.X.; Ma, N.; Rao, D.D.; Yang, L.; Min, Q.W. Blood transfusion or hematopoiesis? How to select between the subsidy mode and the long-term mode of eco-compensation. Environ. Res. Lett. 2020, 15, 9. [Google Scholar] [CrossRef]
- Huang, Y.; Yang, Y.; Yang, G. Comparative Study on Practice of Payment for Ecosystem Service (PES) in Tourism between China and Foreign Countries. Ecol. Econ. 2014, 30, 280–283. [Google Scholar]
- Li, W.H.; Zhang, B.; Xie, G.D. Research on Ecosystem Services in China:Progress and Perspectives. J. Nat. Resour. 2009, 24, 1–10. [Google Scholar] [CrossRef]
- Liu, M.C.; Wang, J.R.; Liu, W.W.; Yang, L.; Sang, W.G. Policy framework and key technologies of ecological protection compensation to national park. Acta Ecol. Sin. 2019, 39, 1330–1337. [Google Scholar] [CrossRef]
- Du, J.F.; Liu, X.L. Study on Long-Efficiency Mechanism of Eco-Compensation. Ecol. Econ. 2010, 303–305. Available online: https://kns.cnki.net/kcms/detail/detail.aspx?dbcode=CJFD&dbname=CJFD2010&filename=STJX201001077&uniplatform=NZKPT&v=1W_wLFu9PpF-7maAAKGUvQp8AE4HHdh-XuH4bcrrWXmgPj2iky1C0u2mF1dbZ8uK (accessed on 8 March 2022).
- Ouyang, Z.Y.; Zheng, H.; Yue, P. Establishment of ecological compensation mechanisms in China: Perspectives and strategies. Acta Ecol. Sin. 2013, 33, 686–692. [Google Scholar] [CrossRef]
- Sellars, R.W. Preserving Nature in the National Parks: A History; Yale University Press: New Haven, CT, USA, 2008. [Google Scholar]
- Zhang, Y.Q.; Yang, G.H. On the connotation of tourism eco-compensation. Chin. J. Ecol. 2012, 31, 477–482. [Google Scholar] [CrossRef]
- Task Force for Eco-Compensation Mechanisms and Policies. In Eco-Compensation Mechanisms and Policies in China; Science Press: Beijing, China, 2007.
- Li, W.; Li, W.J. Using a Modified Travel Cost Method to Evaluate the Recreational Benefits of Jiuzhaigou Nature Reserve. Acta Scicentiarum Nat. Univ. Pekinesis 2003, 39, 548–555. [Google Scholar] [CrossRef]
- Xu, S.; He, X. Estimating the recreational value of a coastal wetland park: Application of the choice experiment method and travel cost interval analysis. J. Environ. Manag. 2022, 304, 114225. [Google Scholar] [CrossRef]
- Yu, C.Y.; Liu, J. Research on the Willingness of Tourism Ecological Compensation in Shennongjia. Tour. Overv. 2017, 2, 1–43. [Google Scholar]
- Tang, X.P.; Luan, X.F. Developing a Nature Protected Area System Composed Mainly of National Parks. For. Resour. Manag. 2017, 6, 1–8. [Google Scholar] [CrossRef]
- Shennongjia National Park Protection Regulations. Available online: http://http://www.hubei.gov.cn/zwgk/hbyw/hbywqb/201711/t20171130_1487824.shtml (accessed on 30 November 2017).
- Li, W.H.; Liu, M.C. Several Strategic Thoughts on China’s Eco-compensation Mechanism. Resour. Sci. 2010, 32, 791–796. [Google Scholar]
- Chen, F.; Zhang, J. Analysis on Capialization Accounting of Travel Value—A Case Study of Jiuzhaigou Scenic Spot. J. Naijing Univ. 2001, 37, 296–303. [Google Scholar]
- Chen, Y.F. Travel cost method—The most popular method for assessing forest recreation value in foreign countries. Ecol. Econ. 1996, 35–38. Available online: https://kns.cnki.net/kcms/detail/detail.aspx?dbcode=CJFD&dbname=CJFD9697&filename=STJJ199604006&uniplatform=NZKPT&v=AgQPm6UE1bA7di4E8HxhMwLYD9832sLs3SGV8-29VIRdXaOeBtcoM11mCOCVvF-x (accessed on 8 March 2022).
- Cheng, C.; Xiao, Y.; Ouyang, Z.Y.; Rao, E.M. Natural landscape valuation of Wulingyuan Scenic Area in Zhangjiajie City. Acta Ecol. Sin. 2013, 33, 771–779. [Google Scholar] [CrossRef][Green Version]
- Mou, Z.; Yang, G. Forest Landscape Valuation of Libo World Natural Heritage Site. Ecol. Econ. 2014, 30, 135–140. [Google Scholar] [CrossRef]
- Randall, A.; Hoehn, J.P.; Brookshire, D.S. Contingent Valuation Surveys for Evaluating Environmental Assets. Nat. Resour. J 1983, 23, 635–648. [Google Scholar] [CrossRef]
- He, S.P.; Liu, J. The Study on Consumer Surplus In Western Economics. J. Harbin Univ. Commer. 2008, 2, 111–114. [Google Scholar] [CrossRef]
- Willis, K.G.; Benson, J.F. Recreational Values of Forests. Forestry 1989, 62, 93–110. [Google Scholar] [CrossRef]
- Blaine, T.W.; Lichtkoppler, F.R.; Bader, T.J.; Hartman, T.J.; Lucente, J.E. An examination of sources of sensitivity of consumer surplus estimates in travel cost models. J. Environ. Manag. 2015, 151, 427–436. [Google Scholar] [CrossRef] [PubMed]
- Bestard, A.B. Substitution patterns across alternatives as a source of preference heterogeneity in recreation demand models. J. Environ. Manag. 2014, 144, 212–217. [Google Scholar] [CrossRef] [PubMed]
- Hanley, N.; Koop, G.; Alvarez-Farizo, B.; Wright, R.E.; Nevin, C. Go climb a mountain: An application of recreation demand modelling to rock climbing in Scotland. J. Agric. Econ. 2001, 52, 36–52. [Google Scholar] [CrossRef]
- Tourkolias, C.; Skiada, T.; Mirasgedis, S.; Diakoulaki, D. Application of the travel cost method for the valuation of the Poseidon temple in Sounio, Greece. J. Cult. Herit. 2015, 16, 567–574. [Google Scholar] [CrossRef]
- Herath, G.; Kennedy, J. Estimating the economic value of Mount Buffalo National Park with the travel cost and contingent valuation models. Tour. Econ. 2004, 10, 63–78. [Google Scholar] [CrossRef]
- Li, X.G.; Miao, H.; Zheng, H.; Ouyang, Z.Y. Main methods for setting ecological compensation standard and their application. Acta Ecol. Sin. 2009, 29, 4431–4440. [Google Scholar] [CrossRef]
- Lai, L.; Huang, X.J.; Liu, W.L. Advances in theory and methodology of ecological compensation. Acta Ecol. Sin. 2008, 28, 2870–2877. [Google Scholar] [CrossRef]
- Bostan, Y.; Fatahi Ardakani, A.; Fehresti Sani, M.; Sadeghinia, M. A comparison of stated preferences methods for the valuation of natural resources: The case of contingent valuation and choice experiment. Int. J. Environ. Sci. Technol. 2020, 17, 4031–4046. [Google Scholar] [CrossRef]
- Liu, J.; Liu, N.; Zhang, Y.M.; Qu, Z.; Yu, J. Evaluation of the non-use value of beach tourism resources: A cas e study of Qingdao coastal scenic area, China. Ocean Coast. Manag. 2019, 168, 63–71. [Google Scholar] [CrossRef]
- Jiang, Y.Y.; Song, Z.Q.; Zhang, M. Tourism Ecological Compensation:Progress and Prospects. Resour. Sci. 2013, 35, 2194–2201. [Google Scholar]
- Xie, X.Z.; Ma, Z. Evaluating Recreation Value of Mount. Huang Using Travel Cost Method. Resour. Sci. 2006, 28, 128–136. [Google Scholar] [CrossRef]
- Lee, M.T.; Liu, J.M.; Borazon, E.Q. Evaluating the Effect of Perceived Value of Ecosystem Services on Tourists’ Behavioral Intentions for Aogu Coastal Wetland. Sustainability 2020, 12, 6214. [Google Scholar] [CrossRef]
- Ma, Y.; Hu, X.P. Tourism Ecological Compensation Mplementation System Construction of Shennongjia. Hum. Geogr. 2010, 5, 120–124. [Google Scholar] [CrossRef]
- Master Plan for the Establishment of National Parks. Available online: http://www.gov.cn/zhengce/2017-09/26/content_5227713.htm (accessed on 26 September 2017).


| Serial Number | [Ci, Ci + 1] | Ni | Mi | Pi/% | Qi |
|---|---|---|---|---|---|
| 1 | 0–50 | 6 | 516 | 100 | 1 |
| 2 | 50–100 | 9 | 510 | 98.84 | 0.9884 |
| 3 | 100–200 | 15 | 501 | 97.09 | 0.9709 |
| 4 | 200–300 | 22 | 486 | 94.19 | 0.9419 |
| 5 | 300–400 | 31 | 464 | 89.92 | 0.8992 |
| 6 | 400–500 | 34 | 433 | 83.91 | 0.8391 |
| 7 | 500–600 | 27 | 399 | 77.33 | 0.7733 |
| 8 | 600–700 | 29 | 372 | 72.09 | 0.7209 |
| 9 | 700–800 | 33 | 343 | 66.47 | 0.6647 |
| 10 | 800–900 | 51 | 310 | 60.08 | 0.6008 |
| 11 | 900–1000 | 42 | 259 | 50.19 | 0.5019 |
| 12 | 1000–1200 | 43 | 217 | 42.05 | 0.4205 |
| 13 | 1200–1400 | 34 | 174 | 33.72 | 0.3372 |
| 14 | 1400–1600 | 28 | 140 | 27.13 | 0.2713 |
| 15 | 1600–1800 | 23 | 112 | 21.71 | 0.2171 |
| 16 | 1800–2000 | 26 | 89 | 17.25 | 0.1725 |
| 17 | 2000–2500 | 29 | 63 | 12.21 | 0.1221 |
| 18 | 2500–3000 | 17 | 34 | 6.59 | 0.0659 |
| 19 | 3000–3500 | 9 | 17 | 3.29 | 0.0329 |
| 20 | 3500–4000 | 2 | 8 | 1.55 | 0.0155 |
| 21 | 4000–4500 | 3 | 6 | 1.16 | 0.0116 |
| 22 | 4500–5000 | 1 | 3 | 0.58 | 0.0058 |
| 23 | 5000~ | 2 | 2 | 0.39 | 0.0039 |
| Serial Number | Payment Amount (Yuan) | Absolute Frequency (Person-Time) | Relative Frequency (%) |
|---|---|---|---|
| 1 | 2.5 | 9 | 3.36 |
| 2 | 7.5 | 27 | 10.07 |
| 3 | 15 | 48 | 17.91 |
| 4 | 25 | 34 | 12.69 |
| 5 | 35 | 10 | 3.73 |
| 6 | 45 | 25 | 9.33 |
| 7 | 55 | 12 | 4.48 |
| 8 | 65 | 5 | 1.87 |
| 9 | 75 | 9 | 3.36 |
| 10 | 85 | 7 | 2.61 |
| 11 | 95 | 37 | 13.81 |
| 12 | 110 | 11 | 4.10 |
| 13 | 130 | 6 | 2.24 |
| 14 | 150 | 4 | 1.49 |
| 15 | 170 | 4 | 1.49 |
| 16 | 190 | 9 | 3.36 |
| 17 | 250 | 11 | 4.10 |
Publisher’s Note: MDPI stays neutral with regard to jurisdictional claims in published maps and institutional affiliations. |
© 2022 by the authors. Licensee MDPI, Basel, Switzerland. This article is an open access article distributed under the terms and conditions of the Creative Commons Attribution (CC BY) license (https://creativecommons.org/licenses/by/4.0/).
Share and Cite
Rao, D.; Wang, J.; Liu, M.; Ma, N.; Li, Z.; Bai, Y. Research on Ecological Compensation of National Parks Based on Tourism Concession Mechanism. Sustainability 2022, 14, 6463. https://doi.org/10.3390/su14116463
Rao D, Wang J, Liu M, Ma N, Li Z, Bai Y. Research on Ecological Compensation of National Parks Based on Tourism Concession Mechanism. Sustainability. 2022; 14(11):6463. https://doi.org/10.3390/su14116463
Chicago/Turabian StyleRao, Didi, Jiaran Wang, Moucheng Liu, Nan Ma, Zhidong Li, and Yunxiao Bai. 2022. "Research on Ecological Compensation of National Parks Based on Tourism Concession Mechanism" Sustainability 14, no. 11: 6463. https://doi.org/10.3390/su14116463
APA StyleRao, D., Wang, J., Liu, M., Ma, N., Li, Z., & Bai, Y. (2022). Research on Ecological Compensation of National Parks Based on Tourism Concession Mechanism. Sustainability, 14(11), 6463. https://doi.org/10.3390/su14116463