Article

The Evolution of Sustainability Ideas in China from 1946 to 2015, Quantified by Culturomics

1
School of Foreign Studies, South China Agricultural University, Guangzhou 510642, China
2
Quality Education Center, Zhongshan Polytechnic, Zhongshan 528400, China
3
Center for Ecolinguistics, South China Agricultural University, Guangzhou 510642, China
4
Guangdong Laboratory for Lingnan Modern Agriculture, College of Natural Resources and Environment, South China Agricultural University, Guangzhou 510642, China
5
College of Life Sciences, Zhejiang University, Hangzhou 310058, China
*
Authors to whom correspondence should be addressed.
Sustainability 2022, 14(10), 6038; https://doi.org/10.3390/su14106038
Submission received: 11 February 2022 / Revised: 9 May 2022 / Accepted: 13 May 2022 / Published: 16 May 2022
(This article belongs to the Special Issue Ecological Transition and Circular Economy)

Abstract

:
Economy and ecology are two main aspects of human sustainable development. However, a comprehensive analysis of the status and trends of economic and ecological cognition is still lacking. Here, we defined economic and ecological concepts as cultural traits that constitute a complex system representing sustainability ideas. Adopting a linguistic ecology perspective, we analysed the frequency distribution, turnover and innovation rates of 3713 concepts appearing in China’s mainstream newspaper, People’s Daily, from 1946 to 2015. Results reveal that: (1) In the whole historical period, there were more economic concepts than ecological concepts both in amount and category. Economic concepts experienced stronger cultural drift than ecological concepts tested by the neutral model of cultural evolution; (2) popular economic concepts became more diversified, but popular ecological concepts became more uniform; (3) both economic concepts and ecological concepts attained more variation in their own disciplinary domains than in cross-disciplinary domains; and (4) as a platform of both giving information and opinion, a newspaper is subjected to cultural selection, especially reflected in the change in ecological concepts under the context of Chinese ecological civilization construction. We concluded with a discussion of promoting vibrant and resilient ecological knowledge in fostering sustainability activities and behaviours.

1. Introduction

A core aim of sustainability science is to link sustainability knowledge with actions and behaviours that lead to real sustainability [1,2,3]. While over 30 years have passed since the Brundtland report [4], unsustainable behaviours and collective actions have resulted in ever-worsening environmental challenges, and practical actions are urgently needed. Recent studies on sustainability knowledge and concepts have found that, despite incremental progress in studies of sustainability science, the role of sustainability knowledge and concepts in affecting societal change remains uncertain [5]. Economy and ecology are two main dimensions in sustainable development. Despite the increasing understanding and improvement of the concept of sustainable development, a comprehensive analysis of the status and trends of economic and ecological cognition is still lacking [6]. In the discipline of human ecology, cultural evolutionary studies [7,8,9,10,11,12] have used concepts, tools and methods from evolutionary biology to interpret massive quantitative data by exploring the interaction between genes and cultures to explain human behaviours and have succeeded in offering insights into behaviour–culture–societal change [13,14]. Linguistic ecology is deeply rooted in human ecology and focuses on ‘the interactions between any given language and its environment’ [15]. Based on Darwin’s Selection analogies between language and species evolution [16], examining word creation and extinction in a language system [17,18] and analysing language transmission bias [19,20,21] could unravel the underlying forces and changing patterns of cultural evolution.
In the last two decades, the random-copying model of the neutral theory of population genetics [22,23] has been used as a null hypothesis and model in testing value-neutral cultural traits [24,25,26,27,28], cultural drift and selection forces. This model has already been applied to various cultural domains in tracking social change, such as baby names, dog breeds, music, commonly used words and public media in popular culture [25,29,30,31,32,33], and academic terminology, technological patents, cryptocurrency and colour terms in academic culture [32,34,35,36,37]. However, this approach has not been applied to the analysis of sustainable cultural dynamics.
Concepts, cultural behaviours, or artefacts in cultural evolution are regarded as cultural replicators [38]. Cultural selection is most likely to operate in the semantic dimension of language organization [39]. Concepts are ‘simple’ noun phrases composed of a determiner and head noun that represent human recognition and construction of the world [40]. Different concepts may occupy a specific niche, which may influence the frequency change and dynamics of concepts related to social identity [41]. Therefore, economic concepts reflect the fundamental activities of human survival and the essence of the Anthropocene. Ecological concepts emphasize well-being and sustainable development. The conflict between economic growth and ecological preservation has long existed in both developed and developing countries. Through an evolutionary analysis of ecological and economic concepts, we attempt to answer the following research questions (RQ): RQ 1, how have ecological and economic concepts changed throughout China’s different development phases? RQ 2, what changes have occurred in mainstream sustainability ideas? RQ 3, what is the underlying evolutionary force of sustainability ideas? and RQ 4, what approaches to policy and management might better transmit sustainability ideas to advance the role of sustainability?
In this paper, we tracked the dynamics of sustainable concepts for the past 70 years, covering the duration from the foundation of PR China to its establishment as the world’s second-largest economy. We used culturomics analysis to detect the drift and selection in ecological and economic concept usage in China. The concepts were drawn from the People’s Daily, the largest newspaper group (with a circulation of over 3 million) and mainstream media in China. The aim of this study is to determine the interactions among governmental policy and strategy, public opinion, and personal decisions at the population level, in dealing with the trade-off among ecological restoration, environmental protection, and economic growth.

2. Materials and Methods

2.1. Data Collection

Public media, as a transmitter [7], mirrors the shift in public attention and preferences, and accelerates the transmission of concepts. Assuming that no concept is intrinsically more valuable than another and envisioning the copying of concepts as ‘replication’ and the invention of new concepts as ‘mutation’, this process is analogous to the population-genetics mechanism of random drift [22,42,43] and transmission biases would indicate cultural selection [7,8,11]. If random copying is used as the null hypothesis, frequencies should exhibit a right-skewed distribution in which a few traits are very popular, and most traits remain rare [32,33,36]. In contrast to random copying, frequency-dependent copying generates an exponential decay distribution, or conformist bias, copying popular or rare traits. Frequency trimming or anti-conformist bias will produce irregular ‘humped’ distribution, avoiding the copying of popular traits or rare traits [44]. The latter becomes indistinguishable from random copying when trimming is applied to common traits [45]. As another neutral model, the turnover rate model can differentiate selection types and determine when cultural transmission is biased [32]. In addition, the diachronic dynamics of cultural variants can be analysed by coefficient of variation.
Public media has a close relationship with public opinion and governmental actions. A change in concepts might account for news attention being a ‘threshold event’ or ‘tipping point’ [43]. In this analysis, concepts were taken from the People’s Daily of China. This newspaper provides information on the policies and viewpoints of China and is also the best representation of the Chinese ecological philosophy and sociocultural tradition. A total of 3713 concepts and their frequency data were retrieved from the BLCU Corpus Center (BCC), representing a time span of 70 years, from 1946 to 2015 [46]. The BCC corpus is a large, full-text retrieval corpus with approximately 15 billion words, including 2 billion words from the People’s Daily. The query function in diachronic retrieval provides concepts’ occurrences data from the newspaper. A Boolean query of ‘Ecological + Noun’ AND ‘Noun + Ecology’ AND ‘Economic + Noun’ AND ‘Noun + Economy’, where N has the same function as Noun, was applied to all years from 1946 to 2015.

2.2. Caculations and Analysis

In this paper, we used both the progeny distribution and the turnover rate models. The progeny distribution model focuses on frequency and probability and, in our case, is defined as the cumulative fraction. In the calculation of the concept cumulative fraction, we first chose a single-year segment and calculated the concept frequency ( P i ) of that year,
P i = n i N
where n i is the occurrence of the concept, and N is the total occurrences of all concepts. The cumulative fraction ( P c i ) is given by
P c i = i = s s m P i
where s is the series number, which is ordered from low to high frequency ( P i ). For example, s1 is series one, with the lowest frequency; s2 is series two, with the second lowest frequency; …and sm is the series maximum with the highest frequency.
Turnover model: We followed the previous work by Evans and Giometto [38] in defining turnover z in the top y chart. The list of the y most-popular concepts is defined as the sum of the number of concepts existing in the top chart plus the number of new concepts entering the top chart at the same time step. The y list in this research varies from 14 to 35 (depending on the sufficiency of data).
The turnover can be described by generic function (3),
z = a y b
where a is constant value and b is turnover exponent. Exponent b = 0.86 is the judgment criteria of the neutral model [38].
Concept diachronic change: The least square method was used to carry out linear regression. Yearly concept frequency was calculated by dividing the concept occurrence with total number of phrases of the newspaper. Here, slope k serves as an indicator of growth rate in a certain time slice.
Concept mutation: Any concepts that did not appear in the previous year were considered new concepts, and the total number of phrases was retrieved from BCC [46]. The calculation began in 1975, with a time span of 5 years (data before 1975 were insufficient).
Concept coefficient of variation: Concepts with structures such as ‘noun + ecology’, ‘ecological + noun’, ‘noun + economy’, ‘economic + noun’ (semantically parallel to Chinese concepts) were retrieved from the British National corpus (BNC). To use BNC concept results as a reference for the international recognition of sustainability ideas, the most popular concepts in ecological and economic domains were selected based on their total occurrences across 70 years. By taking the overlapping concepts with BNC as a selection criterion, a hot-concept list of 5 concepts for each category (the above four conceptual structures) was formed respectively. The standard deviations σ of each concept occurrence from 2008 to 2013 was calculated by using the following equation,
σ = i = 1 n ( v v ¯ ) 2 n 1
where v is the occurrence of a concept from 2008 to 2013, v ¯ is the average occurrence of the concept from 2008 to 2013, and n is the observation year segment from 2008 to 2013. Using σ from Equation (4), the coefficient of variation (CV) of a concept was then calculated by
C V = σ v ¯

3. Results

3.1. Diachronically Change of Economic and Ecological Concepts

The diachronic frequency dynamics of concepts in the mainstream newspaper, People’s Daily, show that the popularity of China’s economic activities increased rapidly, with an average occurrence of 1689 concepts annually in the past 70 years, but with considerable changes (Figure 1a). From 1946 to 1953, the frequency of economic concepts showed a rapid growth trend, with an average annual growth of 4211 occurrences. The peak of word frequency in 1953 (55,566 occurrences) may relate to the first Five-Year Plan of the national economy. After that, from 1954 to 1967, the frequency of word use decreased by 1217 occurrences a year and fell to the bottom of the valley in 1966. This decline may be the consequences of economic downturn and the severe damage to economic development from natural disasters, such as droughts, floods and typhoons, in China from 1958 to 1961. The Four Modernization Goals strategy and the third Five-Year Plan boosted economic development and the word frequency increased again. It reached a peak in 1992 (185,942 occurrences), when China established the reform goal of the market economy system. In addition, from 1992 to 2004, it declined rapidly with a frequency decrease of 4345 occurrences a year. From 2005, it underwent a rapid growth, of 5233 occurrences a year (from 2005 to 2015), and finally reached 163,847 occurrences in 2010 before declining again.
For the dynamics of ecological concepts, the growth rate in ecological word frequency was very low in the early stage (Figure 1b). Within the 30 years after 1946, the average word frequency increased by only three occurrences a year. Since China’s reform and opening up in 1978, it increased slowly, at a rate of 120 occurrences a year from 1978 to 1992. After China’s attendance at the United Nations Conference on Environment and Development in 1992, the concept frequency began to rise rapidly again and had an increase of 2834 occurrences on average a year (from 1993 to 2006), then reached a peak (28,610 occurrences) in 2007. Ecological civilization was first written into the Report of 17th National Congress of the Communist Party of China (CPC) in 2007, which might account for the large amount of concept usage. In 2009, Ecological Civilization became an integral part of the national strategy and the frequency of ecological concepts increased again, by an average rate of 858 occurrences a year from 2010 to 2015. In 2015, it reached 26,105 occurrences. Overall, the growth rate of ecological concepts was only 1/6 of that of economic concepts. China’s economic activities were always hotter than its ecological activities.

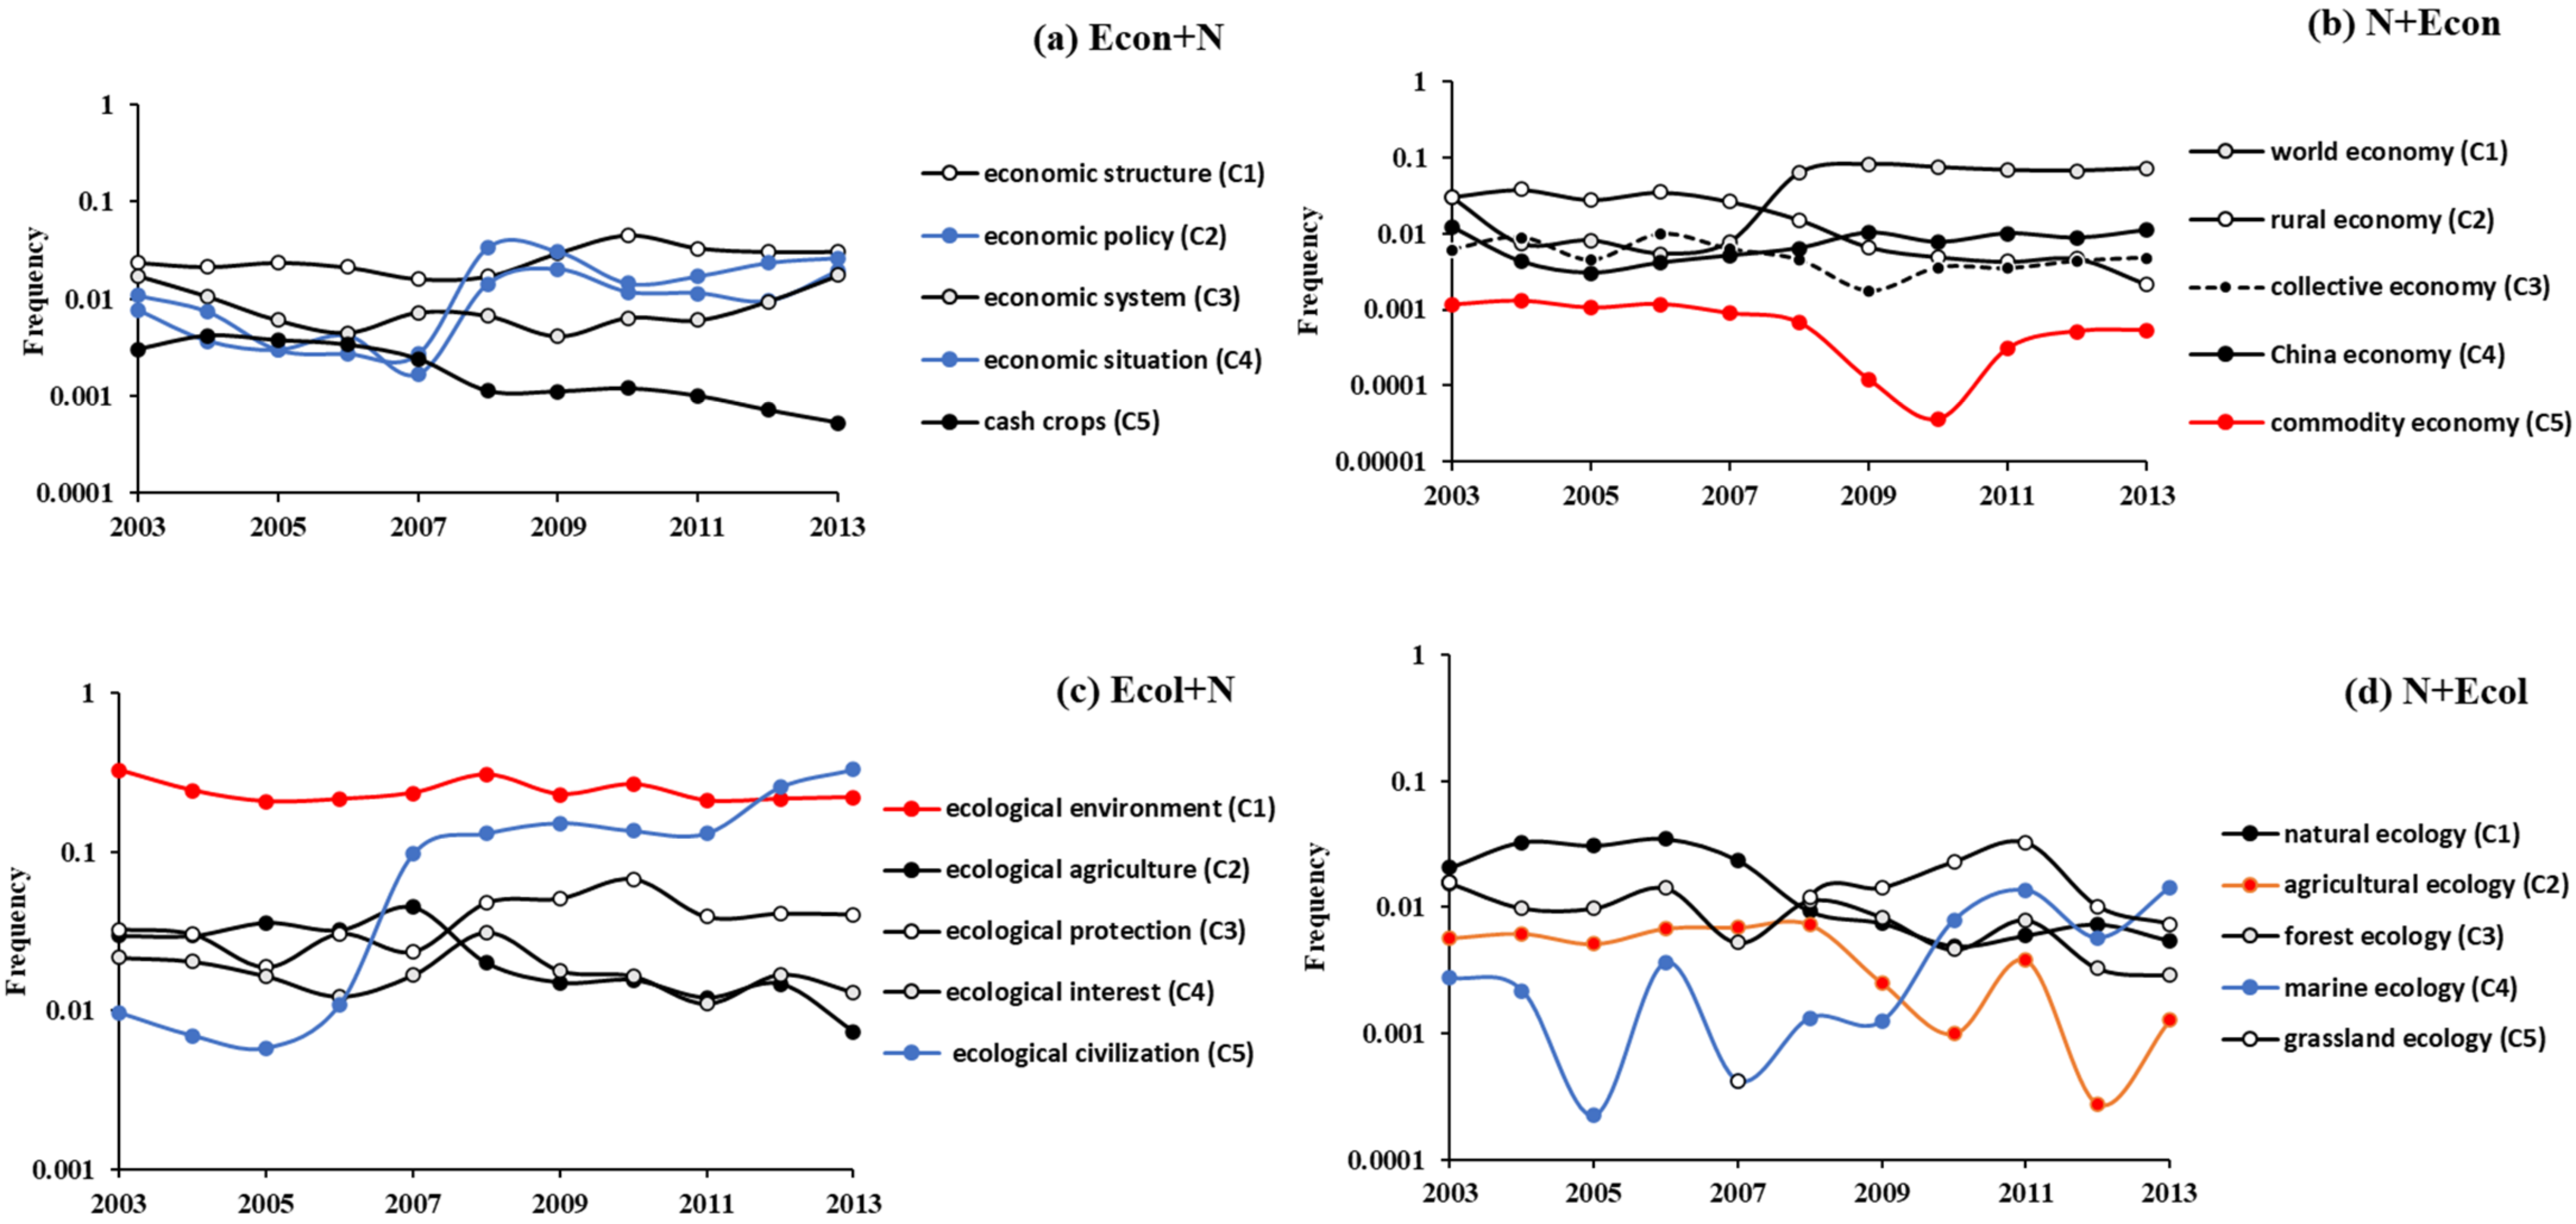
3.2. Dynamics of Hot Economic and Ecological Concepts

The top five high-frequency concepts show the differences in China’s economic and ecological concerns (Figure 2). In the economic field, the frequency of all popular concepts is higher than 10,000 occurrences. Economic policy and the economic situation (the blue line in Figure 2a) were essentially parallel in the first seven years. The occurrences of the economic structure (the black line with a white circle in Figure 2a) and economic system (the black line with a grey circle in Figure 2a) fluctuate by an order of magnitude. The concepts in Figure 2b show clear groupings: world economy, rural economy, collective economy and China economy in one group, and commodity economy (the red line in Figure 2b) in another, lower-frequency group. The CV value of commodity economy ranks the highest among all the hot economic concepts (Table 1). These popular concepts also reflect different foci in the economic field. Economic structure, economic policy, economic system and economic situation are elements of economic development, while world economy, rural economy, collective economy and China economy are concepts with different scales of economic observation. The fifth concepts in the two categories are cash crops and commodity economy, respectively. Cash crops (in Chinese, the concept cash crops shares the same characters with economic crop; however, the meanings of these two concepts are different. To avoid misunderstanding of the concept connotation, we use cash crops instead of economic crop in the analysis) are agricultural products with economic value and commodity economy is a sub-type of economy.
In contrast with the economic field, the ecological field shows stronger sensitivity to policies, such as ecological environment and ecological civilization, as well as to ecological problems that are people-oriented and affect human survival and development, such as agricultural ecology, marine ecology and forest ecology. In terms of historical changes, the frequency of the ecological environment (the red line in Figure 2c) is one order of magnitude higher than that of other concepts. Ecological environment first appeared in the 1960s and gradually increased since then. In 1981, it became the most popular concept and continued to rank first for the next almost 35 years (except for the years of 2012 and 2013). In contrast, ecological civilization did not exist before 1995 but increased significantly since 2005. After 2007, it experienced a four-year stable period and ranked first in 2012 and 2013 with yearly occurrences reaching 931 and 1023, respectively. The frequency of ecological civilization increased by two orders of magnitude in 10 years and resulted in high values of CV (Table 1). Despite such increases, no other concept attained a frequency as high as ecological environment. When ecology is the central term of the concept, the frequency fluctuation is varied. Concepts such as marine ecology (the blue line in Figure 2d) showed a stable and periodic increase in frequency and agricultural ecology (the red line in Figure 2d) declined continuously and periodically, with both resulting in high values of CV (Table 1).

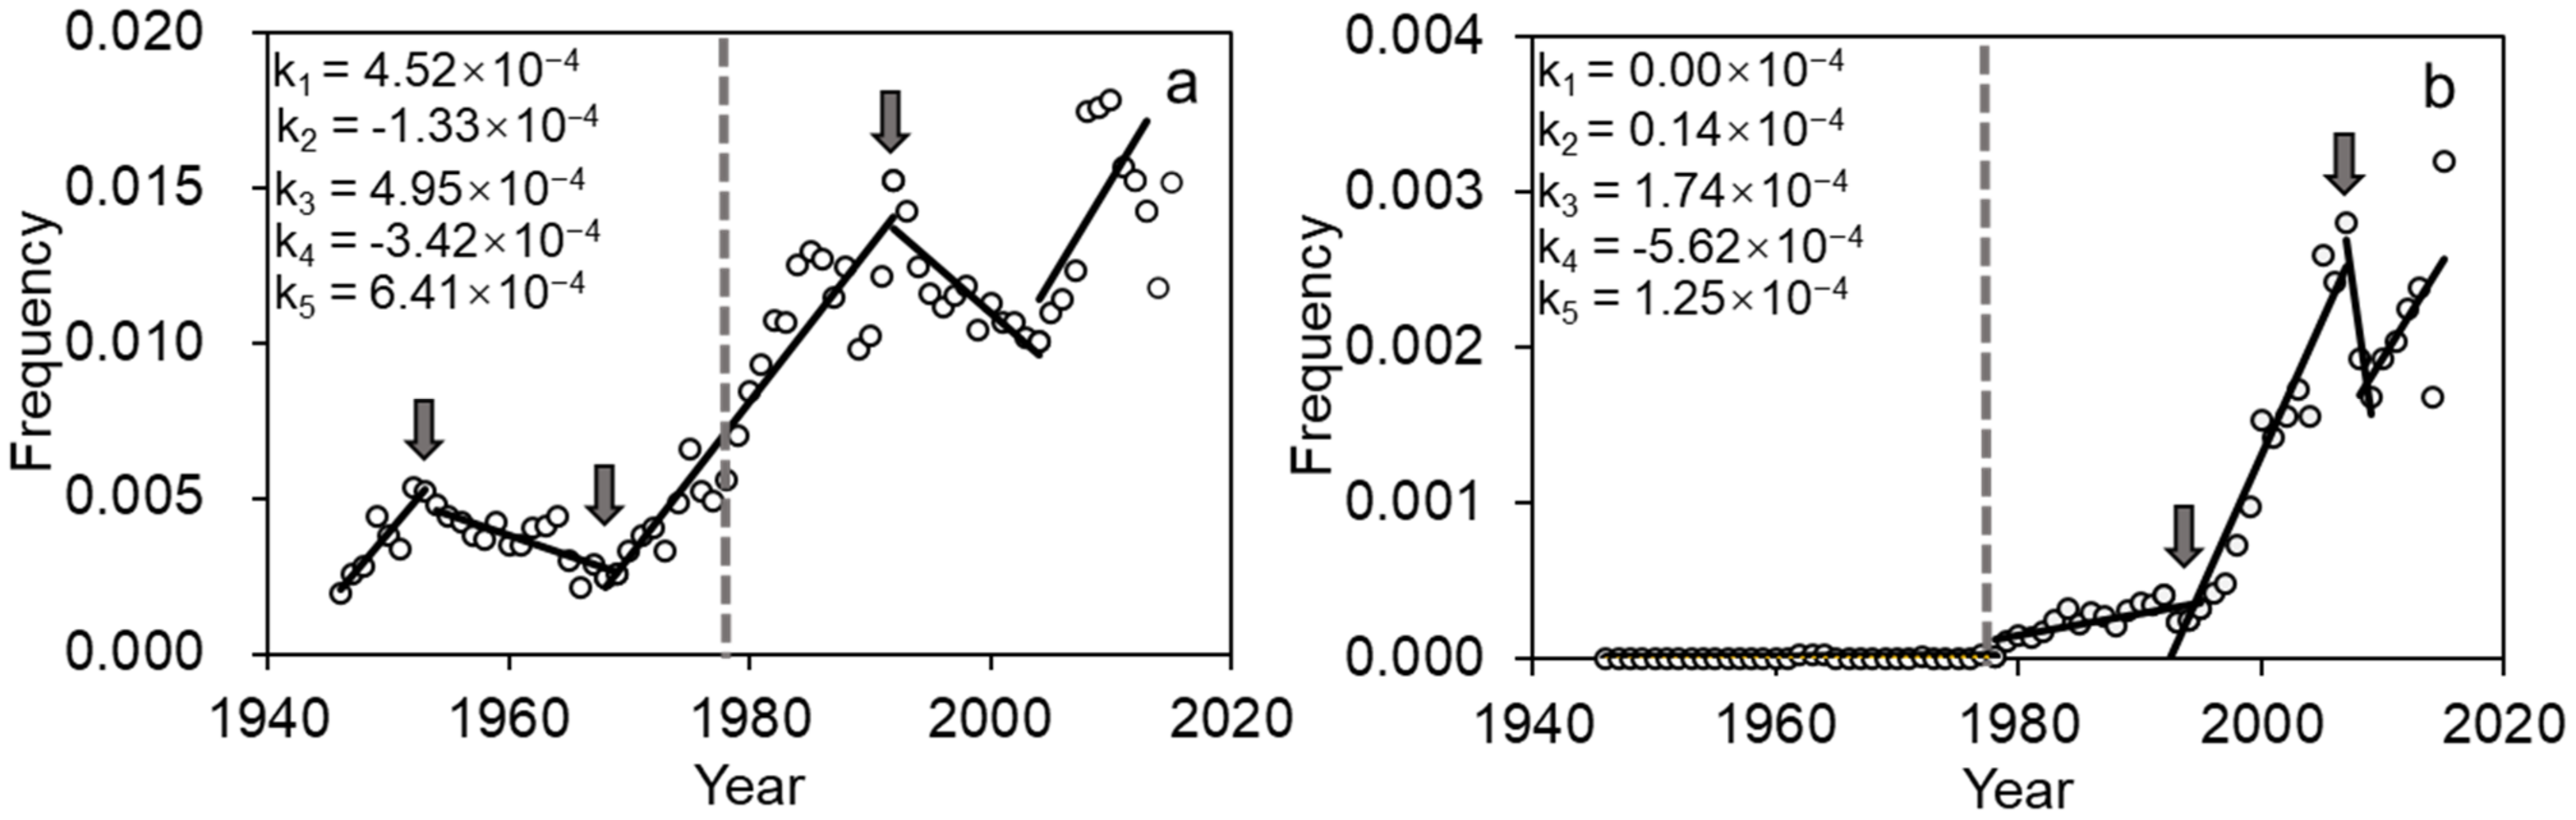
3.3. Mutation Rate of Economic and Ecological Concepts

New-concept mutation or concept innovation has an impact on turnover. Before proceeding to turnover, we calculated the concept mutation rate (μ) as a measurement of innovation. The mutation rate of concepts is always higher for the economy than for ecology, which indicates that new phenomena or new elements appear faster in the economic field (Table 2).
From 1975 to 2015, the mutation rate of both economic and ecological concepts increased as a whole. The mutation rates of both concepts reached the highest value in 2015, with 54 economic concepts and 38 ecological concepts per 100,000 phrases. After 2000, the difference between economic concepts and ecological concepts decreased. In 2000, the mutation rate of economic concepts (approximately 0.4 × 10⁻³) was twice that of ecological concepts (approximately 0.15 × 10⁻³) but decreased to only a 1.1-fold difference between these concepts in 2005. Before 2000, the number of mutations of the economic concepts increased rapidly and then decreased afterwards until 2015. The growth rate of economic concepts was the largest (309%) from 1980 to 1985. The mutation rate of ecological concepts changed unnoticeably before 1995 and increased rapidly thereafter, but then levelled off. The significant growths in ecological concepts from 1980 to 1985 (354%) and from 1995 to 2000 (232%) finally brought the ecological concepts’ usage to equal to economic concepts.

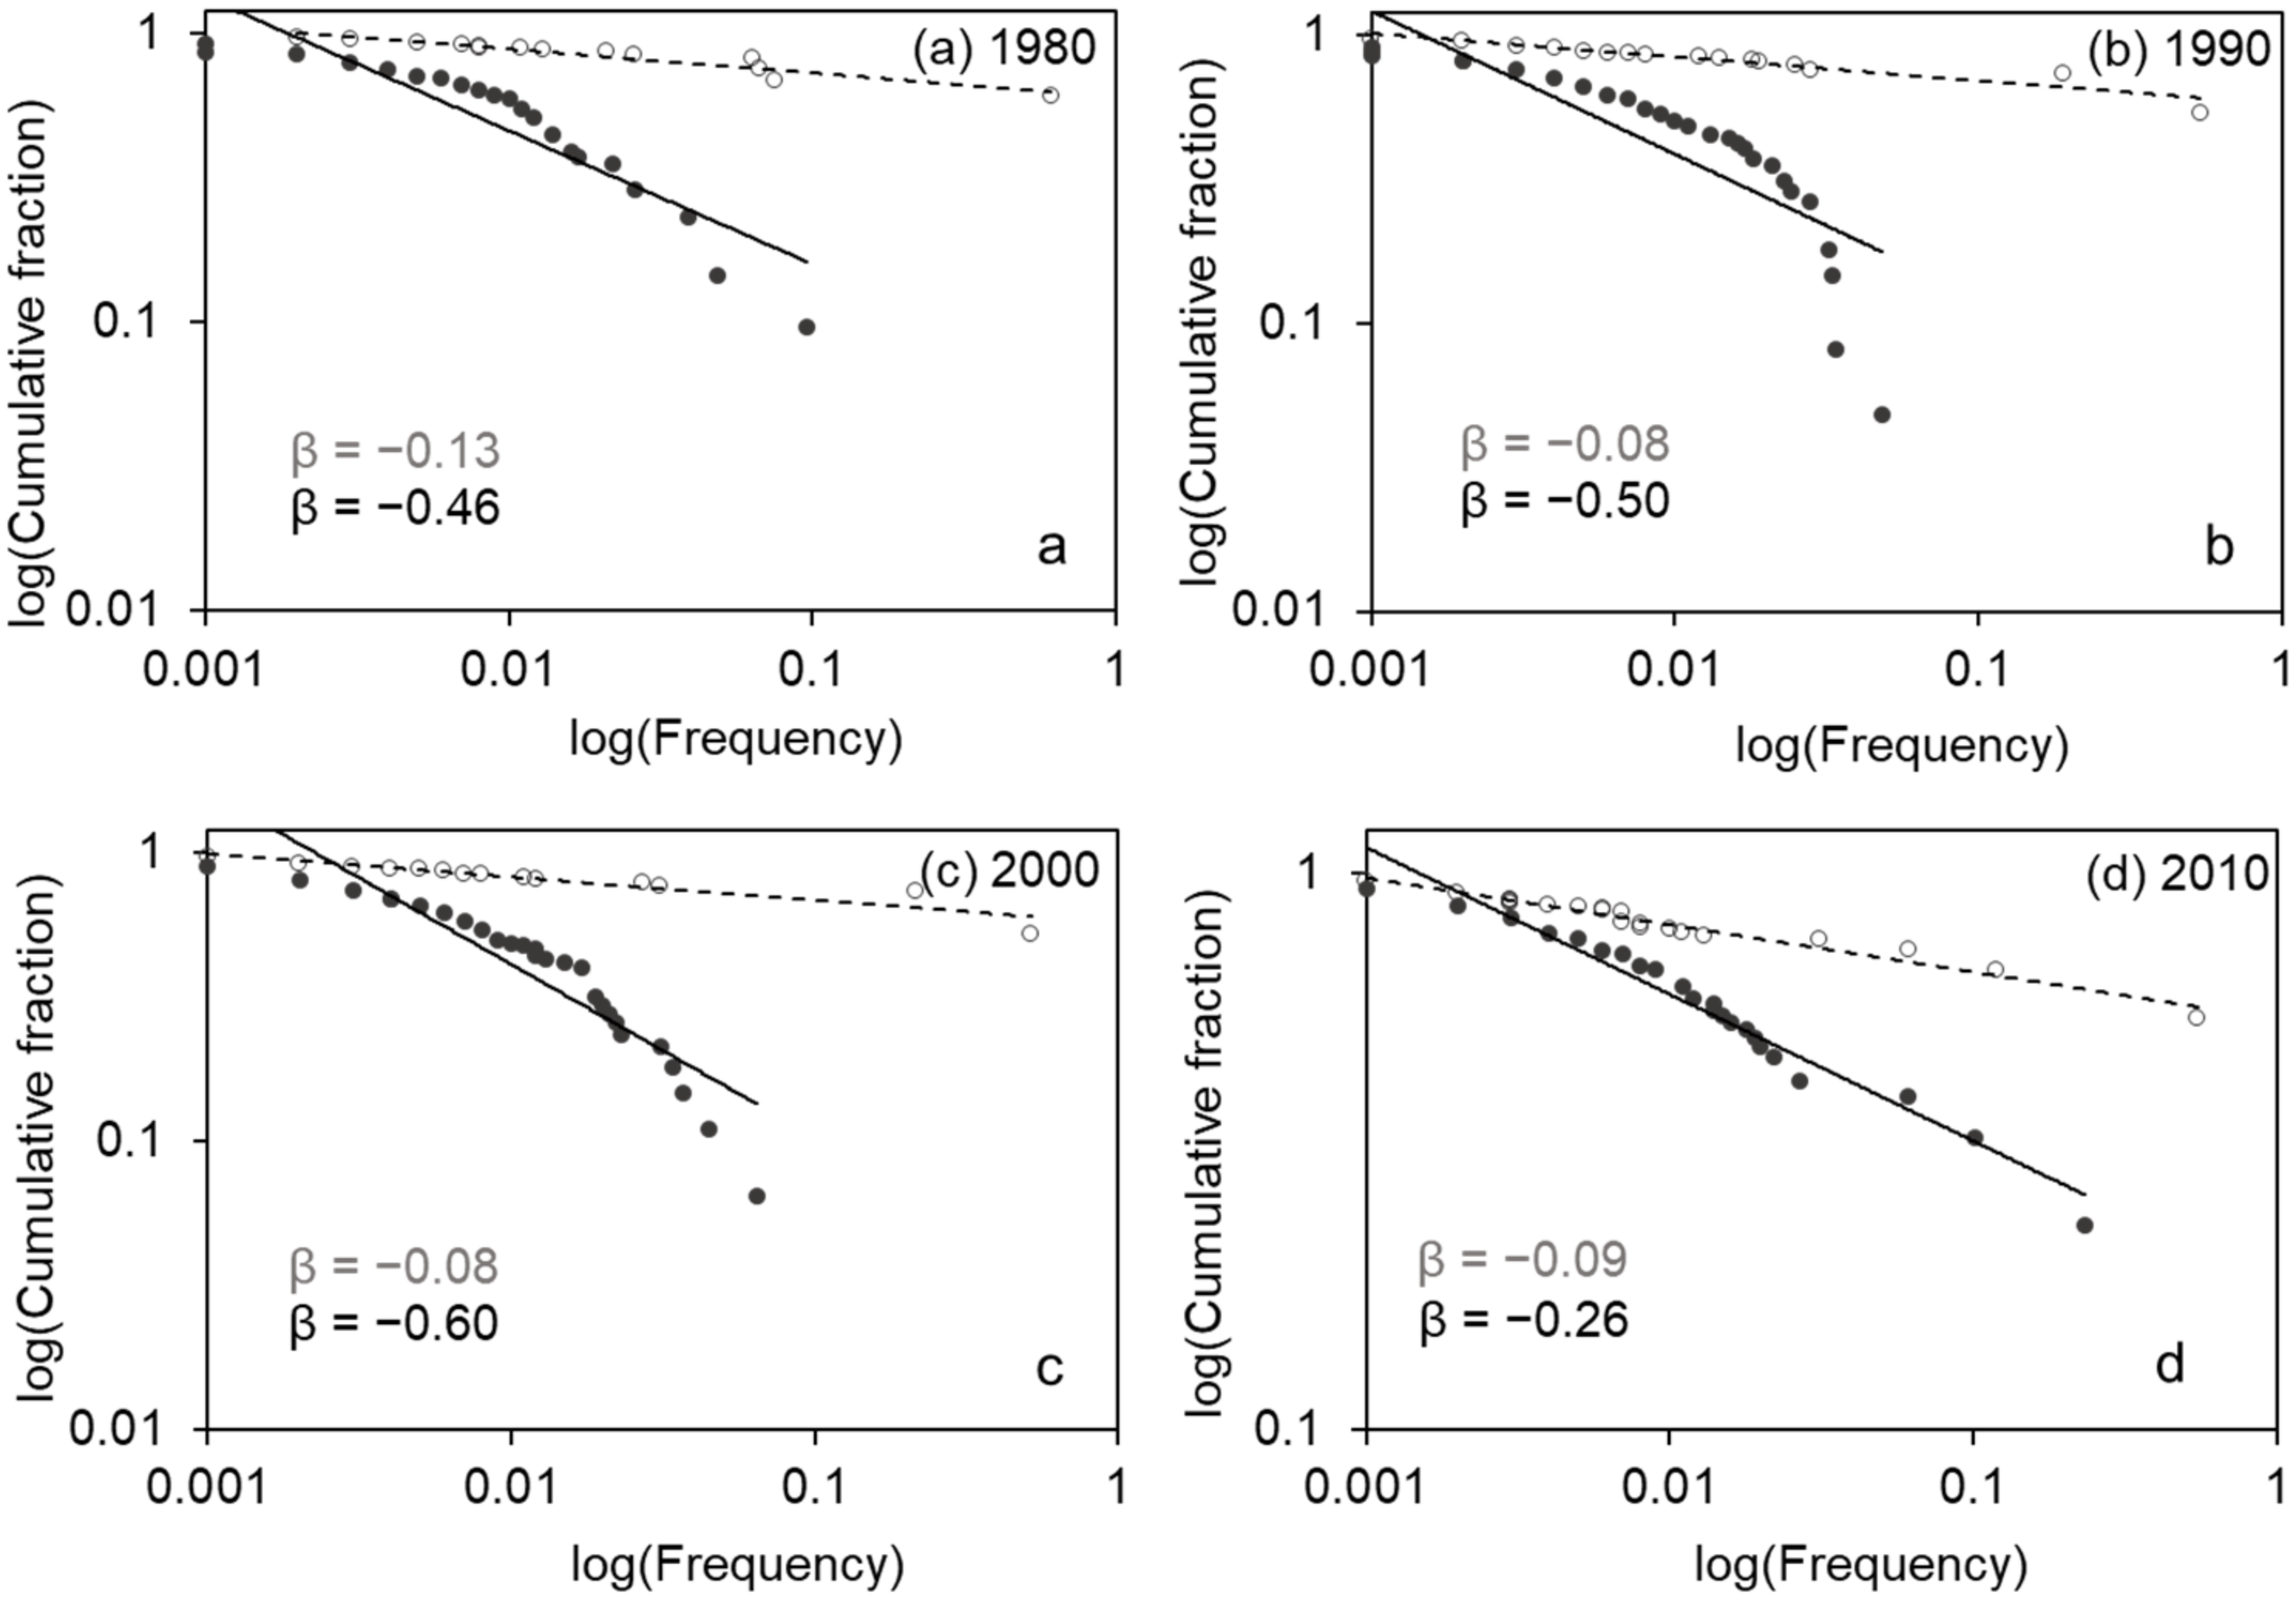
3.4. Cumulative Frequency Distribution of Economic and Ecological Concepts

From 1980 to 2010, the cumulative frequency distribution of economic concepts and ecological concepts in China was observed by fitting a power-law distribution over time in four time segments (Figure 3). In 1980, the power β of economic concepts was −0.46, showing a long tail distribution (Figure 3a); only a few economic concepts are highly popular (in frequencies approaching 10%), whereas most concepts are presented at low- and medium-frequencies (at or below 1%). High-frequency ecological concepts account for the large proportion of the cumulative frequency, which resembles a “winner-take-all” distribution. In 1990, the β of economic concepts decreased to −0.5 and further changed to −0.6 by 2000 (Figure 3b,c) with an decrease in both the frequency and proportion distribution of high-frequency concepts. However, the β of ecological concepts changed to −0.08 in both 1990 and 2000, indicating that the word-usage process was becoming increasingly closer to power-law distribution. By 2010, the power β of economic concepts increased to −0.26 (Figure 3d). The growth in both the number and frequency of economic popular concepts (in frequencies approaching 10%) and their reduction in cumulative frequency distribution show an increasing evenness in economic concepts’ usage, which may indicate a stronger neutral force of random copying. As for ecological concepts, the β value decreased to −0.09. Although there is a slight tendency toward a more even cumulative frequency distribution, more-segmented usage frequency implies that the selection of popular ecological concepts became stronger.

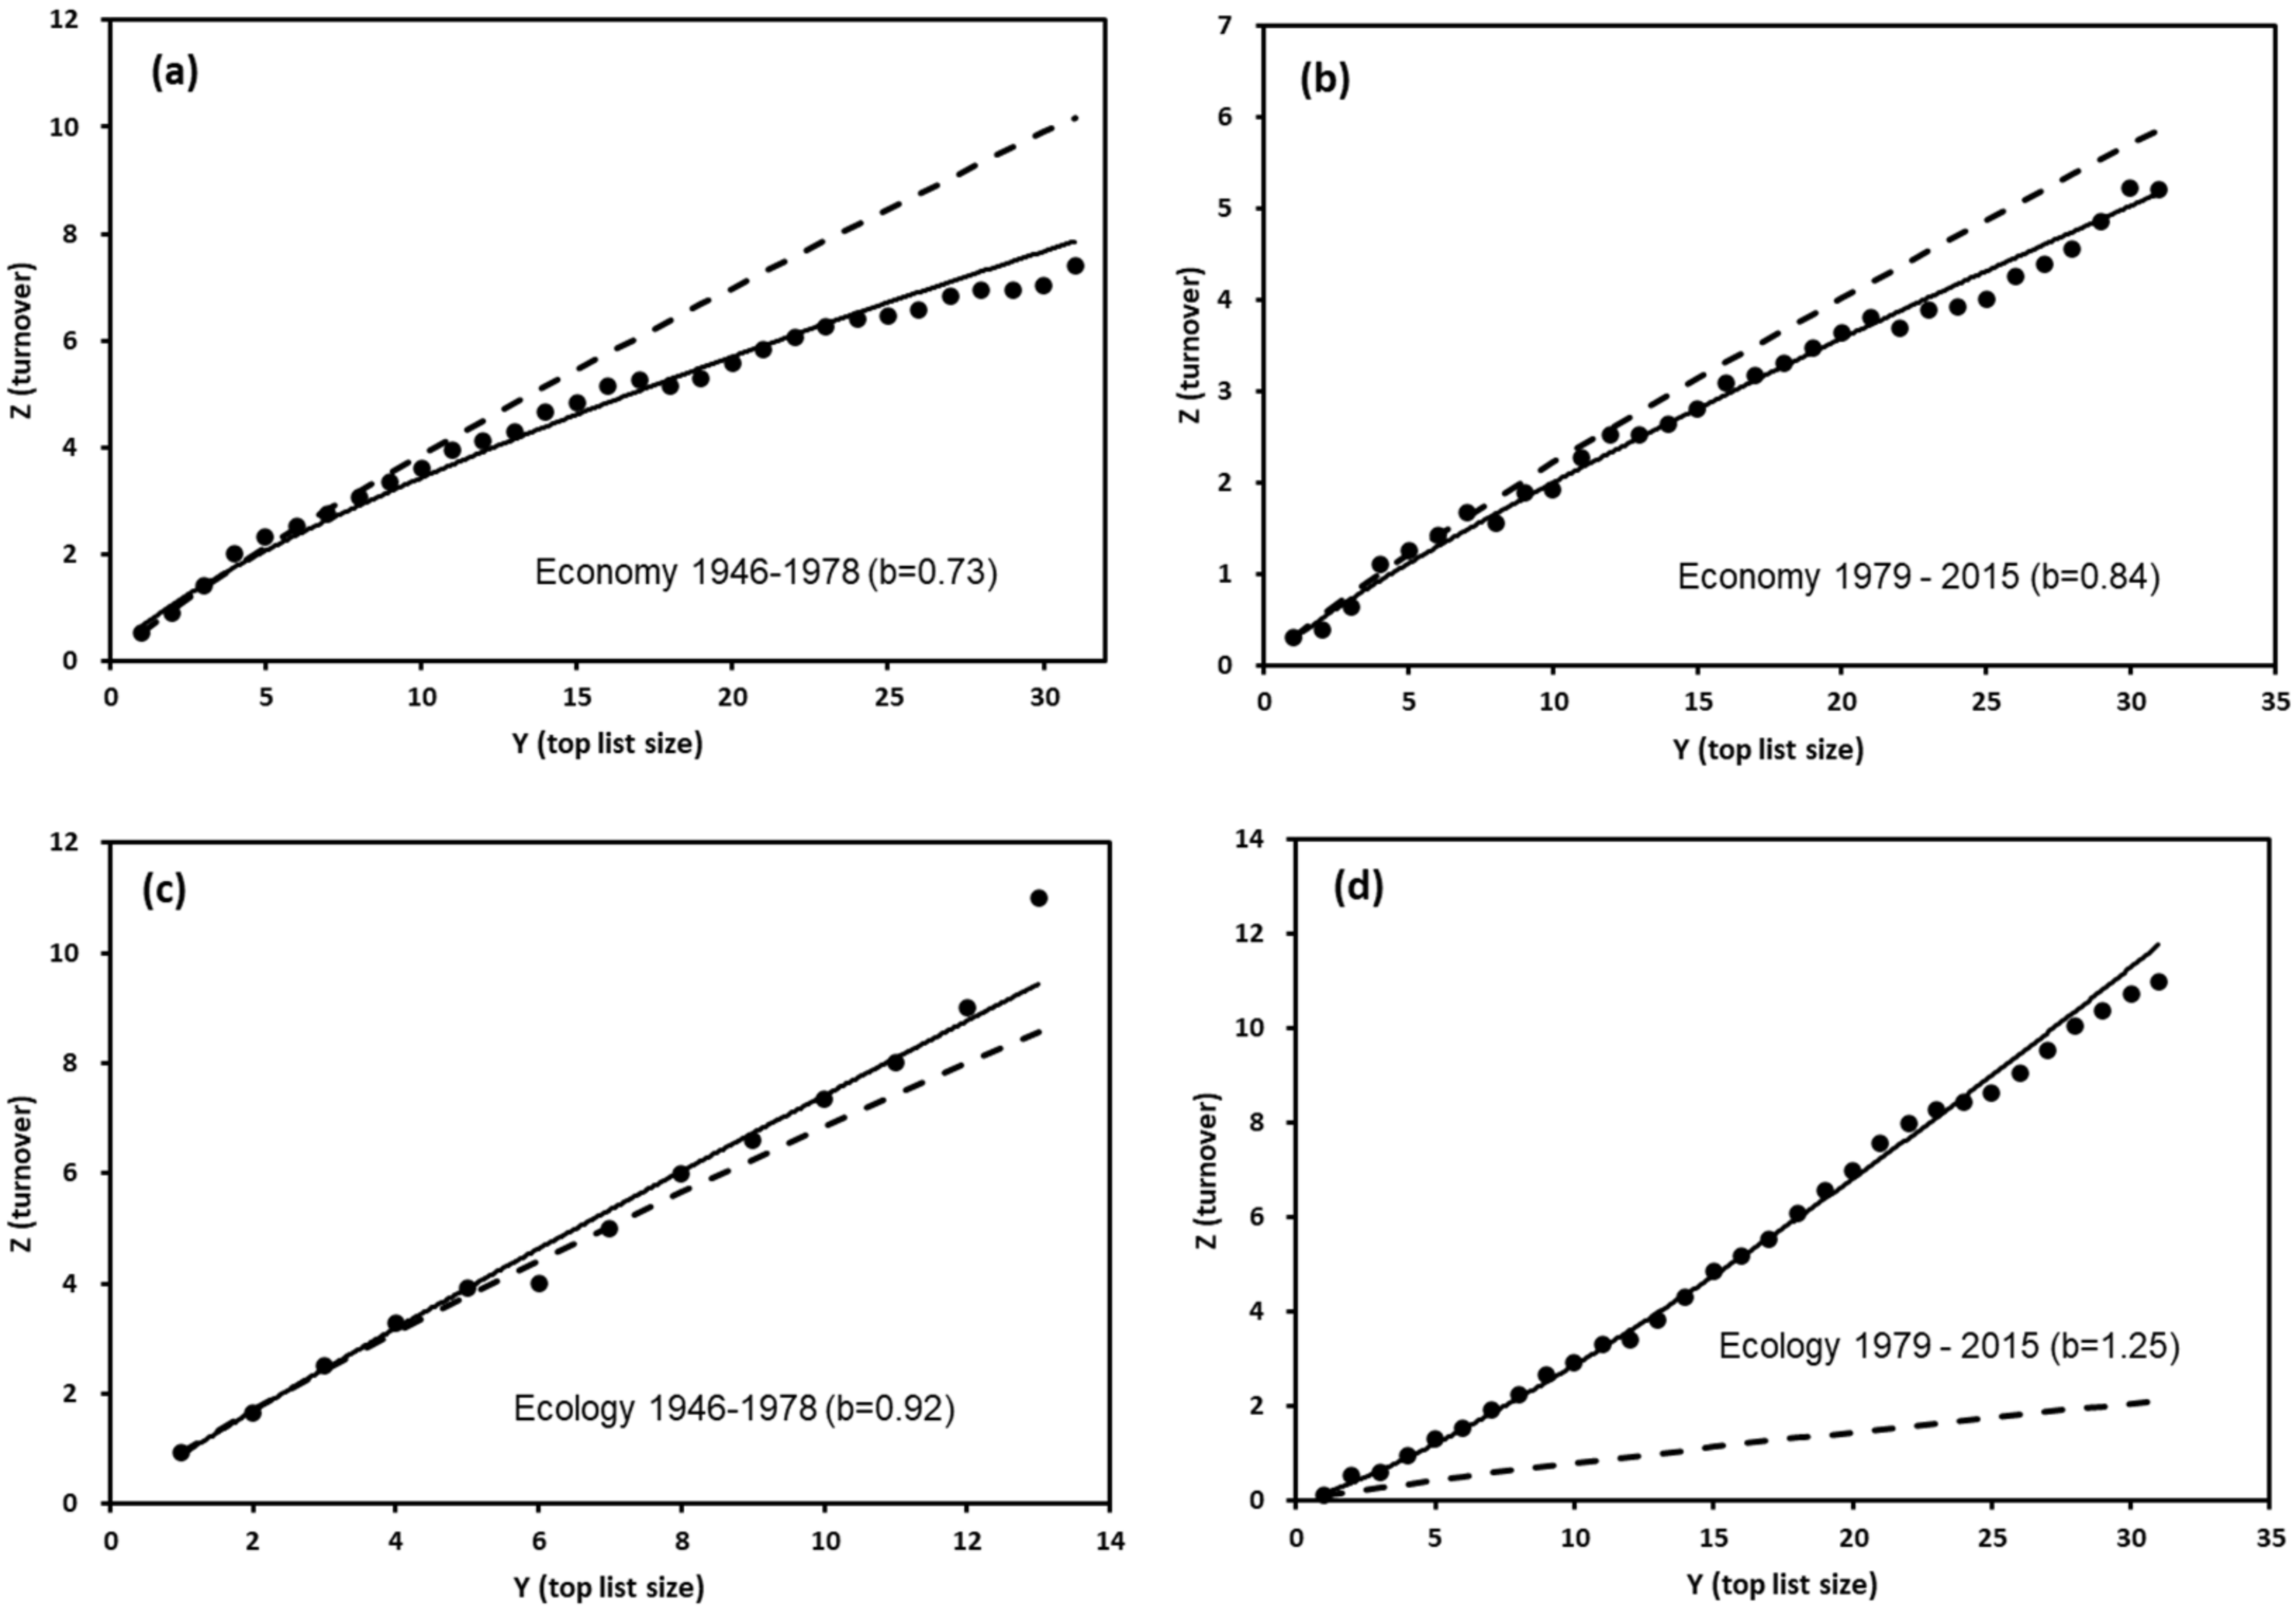
3.5. Turnover of Economic and Ecological Concepts

From 1946 to 1978, the turnover exponent of economic concepts was 0.73. The curve is below the theoretical line of the neutral model. At this stage, the change in high-frequency concepts was faster than that in medium- and low-frequency concepts (Figure 4a). In other words, the change in economic concepts was very active, and popular economic concepts were not ‘fixed’. Economic concepts were subjected to anti-conformist selection. There was no significant difference between the turnover profile of economic concepts and the neutral prediction value after the reform and opening-up in 1978 (Figure 4b). At this stage, the turnover profile of economic concepts was close to neutral. Notably, compared with the period prior to the year of reform and opening-up, the turnover of economic concepts decreased as a whole following the reform. The turnover exponent value of economic concepts in People’s Daily was lower than the neutral expectation (b = 0.86). The turnover exponent of ecological concepts before the reform and opening-up policy was 0.92 (Figure 4c). After the reform and opening-up, the b value of ecological concepts remained higher than the neutral value of 0.86 and increased to 1.25 (Figure 4d). In these two stages, the change in high-frequency ecological concepts was slower than that in medium- and low-frequency concepts. In other words, concepts with a high frequency, or popular ecological concepts, were ‘fixed’. The transmission of ecological concepts was affected by conformist bias.

4. Discussion

The frequency of ecological and economic concepts reflects social recognition and populational behaviour about sustainability. From a linguistic ecology perspective, a connection between China’s economic development and language usage can be established. From formal governmental documents and administrative policies to daily expressions about people’s livelihoods and social lives, developing the economy appears to be the top priority [47]. One phenomenon observed in this study was the ‘emergence’ of economic concepts within a short period, which manifests the vigour and creativity of China’s economy. The cultural dynamics underlying the usage of early economic concepts may be best described as anti-conformist bias and concepts maintained a high proportion of innovation rates since the foundation of PR China. With the further development of China’s economy and its gradual integration into the international market and world economic system, the innovation rate remained high but the entry and loss of concepts within a certain frequency range may imply the stabilization of concept niches. Although the overall average frequency did not appear to be maintained at a similar level, the turnover rate of popular concepts continued to move closer to the expected value of the neutral model, which indicates a stronger random copying process in economic-concept transmission. This finding does not nullify the intrinsic value of concepts but emphasizes the weakness of the selection intensity involved, which is caused by the mixed forces of national and international economic development and new understanding of economic growth. As in the neutral theory of population genetics, most evolutionary changes are caused by the random genetic drift of mutant alleles that are selectively nearly equivalent [23]. The evolutionary analysis of economic concepts demonstrated in these findings implies that these concepts have also experienced cultural drift and a neutral evolutionary process.
The blossoming of ecological ideas started four decades (around the 1980s) after the founding of PR China. Sustainable development ideas have emerged across the international community since the 1980s, and China has taken a series of actions to protect the environment and has brought forth a series of policies and regulations to strengthen its ecological civilization-construction strategy. Public media quickly responded in reporting governmental decisions and resonated with social preference and public attention. The growth rate of innovation in ecological concepts surpassed that of economic concepts in a short period and may potentially incubate a more-vigorous language-meaning system of ecological ideas than economic ideas. Despite the beneficial political environment and policies incentives, a slight downward trend appeared during 2007 to 2009 in ecological concepts (which also appeared from 1992 to 2003 in economic concepts) which may need a more in-depth observation in the future. Cumulative frequency distribution implies that the prevalent selection force underlining ecological concepts’ transmission dynamics is primarily conformity bias, which indicates the selection of a few popular concepts and a lower degree of diversity compared with economic ideas. These popular ecological concepts are directly derived from national strategic slogans and ecological construction priorities, and the frequencies of popular concepts are significantly higher than those of other concepts, resulting in a ‘winner-takes-all’ distribution [25,34]. The turnover rate in the later period indicates that the force of the frequency-dependent copying bias was stronger than in the earlier period, which means that more focused attention was being directed to a certain specific area year after year in the process of constructing an ecological civilization.
When ecology and economy serve as the head noun (N-ecol or N-econ), the CV values are substantially higher than when they function as the modifier (ecol-N or econ-N). This result indicates that concepts rooted in ecological and economic disciplines might have experienced greater ups and downs due to a stronger selection force. In the past 70 years, the higher CV value in the ecological domain than in the economic domain implies a stronger cultural selection force underlying ecological ideas’ development when taking the dynamic change into consideration (Figure 1). Combining with the result of the ecological turnover profile, a relation can be built between concept structure and context/content bias transmission. The higher value of the CV in Noun-ecology suggests content bias may account more for the transmission bias in ecological concepts than context bias, which reminds us to think of the influence that ecological science might have on public language usage and the understanding of sustainability.
The diachronic changes in popular concepts also differ in the top list of concepts. The government’s strategy and strong will to improve China’s ecology are expressed by concepts such as ecological environment and ecological civilization. The diversity and dynamics of economic concepts tend to experience negative frequency selection. In addition, popular concepts and their dynamics reflect that domestic culture exerts a stronger centripetal force, which leads to distinctive language-usage preferences, than the centrifugal… centrifugal force from overseas in ideas’ convergence. The low level of overlapping among high-frequency popular concepts fully demonstrates the unique nationality, regionalism, and sociality features of China. Meanwhile, different changing processes in concepts also reveal the evolution direction towards protecting the environment and developing the economy. Moreover, the evolutionary process of concept usage can lead to a new perspective on the social understanding of the trade-off between economy and ecology. In our case, both domains were strongly affected by the governmental policies, but ecological concepts appeared to experience conformity bias, which means that popular concepts might be copied from the governmental sphere to society and into public daily use. In contrast, economic concepts seemed to experience anti-conformist bias and neutral processes in the recent data, which indicates an abundance of innovation and unbiased transmission from all sectors of society and in people’s daily language usage.

5. Conclusions

In China, the dynamics of both economic and ecological concepts in mainstream newspapers reflect governmental and social activity hotspots for sustainability. The reform and opening-up policy profoundly changed the structure of the Chinese economy and incentivized a more diversified and vigorous economic-development system. The periodical and consistent emergence of abundant economy-related concepts after the reform and opening-up reflects an increasingly healthier and more resilient economic development pattern. The shifting of popular economic concepts reveals the mobility of the system and a greater innovation potential in economic areas. In comparison with economic concepts, the popular ecological concepts reveal a stronger conformist tendency and more force from political decisions than independent social forces in shaping their dynamics. A governmental initiative in ecological construction and protection accelerated the transmission of ecological concepts and enhanced the recognition of sustainability concepts in a much shorter period than that of economic concepts. However, the lower level of innovative and creative new concepts in ecological areas implies a shortage of vitality in developing ecological ideas. Nonetheless, we also assert that, if the data were expanded to include today, the result might be different due to the ecological restoration achievements that China has made in the intervening years. With the approaching of 2030 Agenda of Sustainable Development and China’s entry into a new phase of ecological civilization, stimulating and incubating more diversified and resilient ecological knowledge and ideas, and transferring them into daily usage, will facilitate the linkage between knowledge, action and will, and foster the transition to a sustainable society and the attainment of sustainable development goals.

Author Contributions

Conceptualization, D.Z., G.H. and J.Z.; methodology, D.Z., Y.G. and J.C.; validation, J.Z.; formal analysis, D.Z. and X.H.; data curation, D.Z.; writing—original draft, D.Z.; writing—review and editing, D.Z. and J.Z.; visualization, D.Z., T.Z. and X.C.; supervision, G.H. and J.Z.; funding acquisition, J.Z. All authors have read and agreed to the published version of the manuscript.

Funding

Guangdong Laboratory for Lingnan Modern Agriculture Project (Grant No. NK2021001).

Institutional Review Board Statement

Not applicable.

Informed Consent Statement

Not applicable.

Data Availability Statement

The data presented in this study are available on request from the corresponding authors.

Acknowledgments

We thank R. Alexander Bentley for comments on an early draft. D.Z. thanks Jiang Chang for Python data-science support and Zhaoji Shi for statistics analysis advice.

Conflicts of Interest

The authors declare no conflict of interest.

References

  1. Clark, W.C.; Dickson, N.M. Sustainability science: The emerging research program. Proc. Natl. Acad. Sci. USA 2003, 100, 8059. [Google Scholar] [CrossRef] [PubMed] [Green Version]
  2. Clark, W.C. Sustainability Science: A room of its own. Proc. Natl. Acad. Sci. USA 2007, 104, 173–1738. [Google Scholar] [CrossRef] [PubMed] [Green Version]
  3. Miller, T.R. Sustainability science. In Companion to Environmental Studies; Castree, N., Hulme, M., Proctor, J.D., Eds.; Routledge: London, UK, 2018; pp. 460–464. [Google Scholar]
  4. Brundtland, G.H. Our Common Future: Report of the World Commission on Environment and Development; UN-WCED: Geneva, Switzerland, 1987. [Google Scholar]
  5. Apetrei, C.I.; Caniglia, G.; von Wehrden, H.; Daniel, J. Lang Just another buzzword? A systematic literature review of knowledge-related concepts in sustainability science. Glob. Environ. Chang. 2021, 68, 102222. [Google Scholar] [CrossRef]
  6. Axelsson, R.; Angelstam, P.; Degerman, E.; Teitelbaum, S.; Andersson, K.; Elbakidze, M.; Drotz, M.K. Social and cultural sustainability: Criteria, indicators, verifier variables for measurement and maps for visualization to support planning. AMBIO 2013, 42, 215–228. [Google Scholar] [CrossRef] [PubMed] [Green Version]
  7. Cavalli-Sforza, L.L.; Feldman, M.W. Cultural Transmission and Evolution: A Quantitative Approach; Princeton University Press: Princeton, NJ, USA, 1981. [Google Scholar]
  8. Boyd, R.; Richerson, P.J. Culture and the Evolutionary Process; University of Chicago Press: Chicago, IL, USA, 1985. [Google Scholar]
  9. Neiman, F.D. Stylistic variation in evolutionary perspective. Am. Antiq. 1995, 60, 7–36. [Google Scholar] [CrossRef]
  10. Shennan, S. Genes, Memes and Human History: Darwinian Archaeology and Cultural Evolution; Thames & Hudson: London, UK, 2002. [Google Scholar]
  11. Richerson, P.J.; Boyd, R. Not by Genes Alone: How Culture Transformed Human Evolution; Chicago University Press: Chicago, IL, USA, 2005. [Google Scholar]
  12. Mesoudi, A. Cultural Evolution How Darwinian Theory Can Explain Human Culture and Synthesize the Social Sciences; Chicago University Press: Chicago, IL, USA, 2011. [Google Scholar]
  13. Kandler, A.; Creman, E.R. Analysing cultural frequency data: Neutral theory and beyond. In Handbook of Evolutionary Research in Archaeology; Prentiss, A.M., Ed.; Springer: Cham, Switzerland, 2019. [Google Scholar]
  14. Prentiss, A.M. Handbook of Evolutionary Research in Archaeology; Springer: Cham, Switzerland, 2019. [Google Scholar]
  15. Haugen, E. The Ecology of Language. In Proceedings of the Conference Toward the Description of the Languages of the World, Burg Wartenstein, Austria, 1–8 August 1970. [Google Scholar]
  16. Darwin, C. The Descent of Man, and Selection in Relation to Sex; Princeton University Press: Princeton, NJ, USA, 1981. [Google Scholar]
  17. Petersen, A.M.; Tenenbaum, J.N.; Havlin, S.; Stanley, H.E.; Perc, M. Languages cool as they expand: Allometric scaling and the decreasing need for new words. Sci. Rep. 2012, 2, 943. [Google Scholar] [CrossRef] [Green Version]
  18. Ruck, D.; Bentley, R.A.; Acerbi, A.; Garnett, P.; Hruschka, D.J. Role of neutral evolution in word turnover during centuries of English word popularity. Adv. Complex Syst. 2017, 20, 1750012. [Google Scholar] [CrossRef] [Green Version]
  19. Pagel, M.; Atkinson, Q.D.; Meade, A. Frequency of word-use predicts rates of lexical evolution throughout Indo-European history. Nature 2007, 449, 717–720. [Google Scholar] [CrossRef]
  20. Newberry, M.G.; Ahern, C.; Clark, R.; Plotkin, J.B. Detecting evolutionary forces in language change. Nature 2017, 551, 223–226. [Google Scholar] [CrossRef]
  21. Pagel, M.; Beaumont, M.; Meade, A.; Verkerk, A.; Calude, A. Dominant words rise to the top by positive frequency-dependent selection. Proc. Natl. Acad. Sci. USA 2019, 116, 7397–7402. [Google Scholar] [CrossRef] [Green Version]
  22. Crow, J.F.; Kimura, M. An Introduction to Population Genetics Theory; Harper & Row: New York, NY, USA, 1970. [Google Scholar]
  23. Kimura, M. The Neutral Theory of Molecular Evolution; Cambridge University Press: London, UK, 1983. [Google Scholar]
  24. Bentley, R.A.; Shennan, S.J. Cultural transmission and stochastic network growth. Am. Antiq. 2003, 68, 459–485. [Google Scholar] [CrossRef]
  25. Hahn, M.W.; Bentley, R.A. Drift as a mechanism for cultural change: An example from baby names. Proc. R. Soc. Lond. Ser. B Biol. Sci. 2003, 270 (Suppl. S1), S120–S123. [Google Scholar] [CrossRef] [PubMed] [Green Version]
  26. Bentley, R.A.; Lipo, C.P.; Herzog, H.A.; Hahn, M.W. Regular rates of popular culture change reflect random copying. Evol. Hum. Behav. 2007, 28, 51–158. [Google Scholar] [CrossRef]
  27. Reali, F.; Griffiths, T.L. Words as alleles: Connecting language evolution with Bayesian learners to models of genetic drift. Proc. Biol. Sci. 2010, 277, 429–436. [Google Scholar] [CrossRef] [PubMed] [Green Version]
  28. Leroi, A.M.; Lambert, B.; Rosindell, J.; Zhang, X.; Kokkoris, G.D. Neutral syndrome. Nat. Hum. Behav. 2020, 4, 780–790. [Google Scholar] [CrossRef]
  29. Herzog, H.A.; Bentley, R.A.; Hahn, M.W. Random drift and large shifts in popularity of dog breeds. Proc. R. Soc. Lond. B. 2004, 271, S353–S356. [Google Scholar] [CrossRef] [Green Version]
  30. Bentley, R.A. Random drift versus selection in academic vocabulary: An evolutionary analysis of published keywords. PLoS ONE 2008, 3, e3057. [Google Scholar] [CrossRef]
  31. Dediu, D.; Cysouw, M.; Levinson, S.C.; Baronchelli, A.; Christiansen, M.H.; Croft, W.; Evans, N.; Garrod, S.; Gray, R.; Kandler, A.; et al. Cultural Evolution of Language. In Cultural Evolution: Society, Technology, Language and Religion; Richerson, P.J., Christiansen, M.H., Eds.; The MIT Press: Cambridge, MA, USA, 2012; pp. 303–334. [Google Scholar]
  32. Acerbi, A.; Bentley, R.A. Biases in cultural transmission shape the turnover of popular traits. Evol. Hum. Behav. 2014, 35, 228–236. [Google Scholar] [CrossRef] [Green Version]
  33. Sindi, S.S.; Dale, R. Culturomics as a data playground for tests of selection: Mathematical approaches to detecting selection in word use. J. Theor. Biol. 2016, 405, 140–149. [Google Scholar] [CrossRef]
  34. Bentley, R.A.; Hahn, M.W.; Shennan, S.J. Random drift and culture change. Proc. R. Soc. Lond. B. 2004, 271, 1443–1450. [Google Scholar] [CrossRef] [Green Version]
  35. ElBahrawy, A.; Alessandretti, L.; Kandler, A.; Pastor-Satorras, R.; Baronchelli, A. Evolutionary dynamics of the cryptocurrency market. R. Soc. Open Sci. 2017, 4, 170623. [Google Scholar] [CrossRef] [PubMed] [Green Version]
  36. Carrignon, S.; Bentley, R.A.; Ruck, D. Modelling rapid online cultural transmission: Evaluating neutral models on Twitter data with approximate Bayesian computation. Palgrave Commun. 2019, 5, 83. [Google Scholar] [CrossRef] [Green Version]
  37. Brand, C.O.; Acerbi, A.; Mesoudi, A. Cultural evolution of emotional expression in 50 years of song lyrics. Evol. Hum. Sci. 2019, 1, e11. [Google Scholar] [CrossRef] [Green Version]
  38. Evans, T.; Giometto, A. Turnover Rate of Popularity Charts in Neutral Models. arXiv 2011, arXiv:1105.4044. Available online: https://arxiv.org/abs/1105.4044 (accessed on 10 January 2022).
  39. Biber, D.; Gray, B. Grammatical Complexity in Academic English Linguistic Change in Writing; CUP: Cambridge, UK, 2016. [Google Scholar]
  40. Altmann, E.G.; Pierrehumbert, J.B.; Motter, A.E. Niche as a determinant of word fate in online groups. PLoS ONE 2011, 6, e19009. [Google Scholar] [CrossRef] [Green Version]
  41. Gillespie, J.H. Population Genetics: A Concise Guide; Johns Hopkins University Press: Baltimore, MD, USA, 1998. [Google Scholar]
  42. Wright, S. Evolution in Mendelian populations. Genetics 1931, 16, 97–159. [Google Scholar] [CrossRef]
  43. Hansen, A. Environment and the news media. In Companion to Environment Studies; Castree, N., Hulme, M., Proctor, J.D., Eds.; Routledge: London, UK, 2018. [Google Scholar]
  44. Mesoudi, A.; Lycett, S.J. Random copying, frequency-dependent copying and culture change. Evol. Hum. Behav. 2009, 30, 41–48. [Google Scholar] [CrossRef]
  45. Michel, J.-B.; Shen, Y.K.; Aiden, A.P.; Veres, A.; Gray, M.K.; Pickett, J.P.; Hoiberg, D.; Clancy, D.; Norvig, P.; Orwant, J.; et al. Quantitative Analysis of Culture Using Millions of Digitized Books. Science 2011, 331, 176–182. [Google Scholar] [CrossRef] [Green Version]
  46. Xun, E.; Rao, G.Q.; Xiao, X.Y.; Zang, J.J. Construction of BCC corpus in the context of big data. Corpus Linguist. 2016, 3, 93–109. [Google Scholar]
  47. Liu, J. China’s Road to Sustainability. Science 2010, 328, 50. [Google Scholar] [CrossRef]
Figure 1. Changes in the frequency of economic concepts and ecological concepts from 1946 to 2015 in People’s Daily. (a) Economy-related concepts, (b) ecology-related concepts. Dotted line: China’s reform and opening up in 1978; Arrow: historical events (from left to right), the first Five-Year Plan in 1953 (1a), the third Five-Year Plan in 1966 (1a), the reform goal of the market economic system in 1992 (1a), United Nations Conference on Environment and Development in 1992 (1b), The 17th National Congress of the CPC in 2007 (1b). k-slope value.
Sustainability 14 06038 g001
Figure 2. Frequency of the top 5 concepts from 2003 to 2013. Shown are the four structures for the concepts: (a). Econ (economic) + Noun, (b) Noun + Econ (economy), (c) Ecol (ecological) + Noun, and (d) Noun + Ecol (ecology). Y axes are logarithmic. C in parentheses stands for concept.
Sustainability 14 06038 g002
Figure 3. Cumulative frequency distribution of all economic and ecological concepts in People’s Daily. Double logarithmic axes. The filled circle represents the distribution of economic concepts and the open circle represents the distribution of ecological concepts. (a) 1980, (b) 1990, (c) 2000, and (d) 2010. β-power exponent.
Sustainability 14 06038 g003
Figure 4. Turnover in the popularity of ecology-related and economy-related concepts. The dashed lines represent b = 0.86, and solid lines are fit lines to the data. (a) Economy-related concepts (including both Econ-N and N-Econ concepts) from 1946 to 1978, (b) economy-related concepts from 1979 to 2015, (c) ecology-related concepts (including both Ecol-N and N-Ecol concepts) from 1946 to 1978, and (d) ecology-related concepts from 1979 to 2015.
Sustainability 14 06038 g004
Table 1. Coefficient of variation of the top-five concepts during 2008–2013, tracked in Figure 2.
CategoryConcept 1Concept 2Concept 3Concept 4Concept 5
Econ-N0.450.320.430.260.40
N-Econ0.280.480.290.290.61
Ecol-N0.200.300.330.200.61
N-Ecol0.250.720.360.810.68
Concepts 1 to 5 can be identified in their respective category.
Table 2. The mutation of economic concepts and ecological concepts in People’s Daily, from 1975 to 2015.
Year
(Econ)

(Ecol)
N
(All Phrases)
μ
(Econ)
μ
(Ecol)
197511872036,589,8030.00%0.00%
1980311743745,310,4240.01%0.00%
198512,763198560,402,0110.02%0.00%
199015,717304363,133,2380.02%0.01%
199522,982363063,236,8920.04%0.01%
200033,41012,03876,579,9380.04%0.02%
200525,31321,14570,794,1060.04%0.03%
201019,96116,02943,465,3570.05%0.04%
201522,98316,42542,318,0240.05%0.04%
Econ denotes econ-N and N-econ, Ecol denotes ecol-N and N-ecol, is the number of new concepts, N is the total number of concepts of the year, and μ is mutation rate.
Publisher’s Note: MDPI stays neutral with regard to jurisdictional claims in published maps and institutional affiliations.

