Abstract
Access to adequate and appropriate transport options enables older people to continue as thriving community participants, to reach services and to maintain social connections. While transport needs are diverse, and tend to change over time, there is little information on current and future transport patterns, and the awareness, acceptance and adoption of new technologies. A national online survey was administered to current drivers in Australia. A sample of 705 drivers provided information on available travel modes and use of these modes, awareness of in-vehicle technologies and future use of vehicle technologies. The findings revealed high use of private vehicles, walking and taxis but little use of other travel modes (bicycles, motorcycles, rideshare, community services and public transport). Age, gender and residential location influenced the availability and use/potential use of some transport options. Overall awareness of in-vehicle technologies was generally low and particularly so amongst older and female participants. There was some appetite to use emerging technologies in the future. The findings inform the development of effective strategies and initiatives aligned with healthy ageing and wellbeing targets, increased sustainability, resilience and connectedness, creation of healthier travel choices and healthier environments to promote acceptance and use of a range of transport options and uptake of safer vehicles equipped with in-vehicle technologies to ultimately enhance safe and sustainable mobility of older road users.
Keywords:
older road users; mobility; safety; travel patterns; vehicle technologies; countermeasures 1. Introduction
Older adults are a vital part of the community through their continued engagement in family and community life and, increasingly, the workforce. Access to adequate and appropriate transport and mobility options enables older people to continue as thriving community participants, to reach services and to maintain social connectedness [1].
Accessibility is central to effective mobility. The personal vehicle stands supreme in offering almost limitless door-to-door access and has made travelling further and faster possible, making more destinations accessible [2]. There is evidence that the private motor vehicle is a preferred mode of transport for older adults (both as driver and passenger) and is likely to remain a key mode of transport for emerging cohorts of older drivers [3]. Travelling in private vehicles is one of the safest and most accessible travel modes. Furthermore, significant advances in vehicle technology such as the introduction of intelligent transport system (ITS) and advanced driver-assistance system (ADAS) technologies, and more recently, autonomous/driverless vehicles, have the potential to yield a new and sustainable wave of driving options. The promotion and use of newer, smarter vehicles can play a key role in sustaining the safe mobility of older adults, particularly by addressing functional decline, assistance with challenging driving activities and mitigating common older driver crash types [4,5].
As lifestyles, skills and abilities change, it is likely that at some point most drivers will consider restricting and transitioning away from driving [6]. This can be a difficult decision and has the potential to result in reduced mobility, social inclusion and overall well-being without adequate support, forward planning and access to alternative transport options. Marottoli and Coughlin suggested that there has been a reduction in private vehicle use and an increase in the use of other modes, including active travel (walking and cycling), car-share and rideshare schemes, community-based and volunteer services, public transport and informal transport offered by family and friends. For people who restrict or cease driving, the availability and accessibility of other forms of transport is critical to maintaining mobility [7]. Despite the high expense of motor vehicles, some sort of private vehicle has been (and is likely to continue to be) within reach of most people in affluent countries. Public transport, by contrast, is much more indirect, constrained by location and timetable and necessitates some form of trip planning. Public transport also constrains what and how much can be carried. Perceptions of comfort and vehicle fitness for purpose can also restrict trip accessibility. However, higher density living, especially in inner-city urban environments, a wider choice in modes such as ridesharing services and increasing progressive policies towards active travel modes and public vehicle design are demonstrable of a shift from motor car dominance as the ultimate means of accessibility [2].
Given the importance of travel and the diversity and changing transportation needs of older adults, an understanding of current and future transport needs is an important first step to maintaining safe mobility. To date, there is little information on older adults’ travel patterns and needs. Furthermore, there is little understanding of the levels of awareness and acceptance of alternative modes of transport to the car amongst the current population of older adults.
It is also noted that the impact of the global COVID-19 pandemic has been far reaching in all aspects of life, not least the constraints put upon travel. Modes of travel that rely upon shared space, such as public transport, have naturally experienced the biggest reductions in patronage. A return to the safety and isolation of the private car is attractive, especially to those who feel the most vulnerable to the virus. However, unlike previous momentous periods in history, contemporary and emerging technologies have gone some way in mitigating the migration back to motor cars. There is evidence of an increase in walking, cycling and telecommuting, as enabled by working from home online. The additional concern for climate change as caused by the burning of carbon-based fuels, as well as heavily congested cities, press governments and policy makers to reshape and restore viable alternative transport infrastructure away from private motor car use [8].
The UN SDG 11 focuses on making cities inclusive, safe, resilient and sustainable. More specifically, Target 11.2 is to provide access to safe, affordable transport systems for all and to improve road safety for vulnerable populations, including older people, by 2030. Aligned with the SDGs, the concepts of sustainable urban planning (SUMP) [9], age-friendly communities [1], smart, accessible and resilient cities [10], healthy ageing and active ageing all provide best-practice frameworks within which we can better understand current transportation needs, use of travel modes and potential barriers or facilitators to community accessibility and participation. Concepts aligned with better health (age-friendly communities, healthy and active ageing) encourage development of strategies that are inclusive and put structures and services in place that optimise the needs and capacities of an older population. Smart and resilient communities herald an information sharing and connected infrastructure more able to be responsive to its citizens’ needs, including the transportation needs of older adults. These more empathetic approaches position themselves to consider community accessibility from the perspective of older people. Furthermore, these concepts can guide the development of technologically smart and sustainable solutions to enhance safe mobility by integrating user needs and developing policies, programs, infrastructure and new vehicles.
A survey tool was designed based on broad theoretical elements of these frameworks and building on participatory approach to urban mobility planning [11] to interrogate key themes of the needs and diversity of users of particular types of travel modes and driver experience, along with the measurement of participant awareness of current and emerging technologies associated with driving. The survey also sought to determine what alternative transport options to driving were available and acceptable to participants.
The findings of this study will generate new information to enhance the effectiveness of existing planning instruments (such as SUMP) and guide the identification of smart and innovative approaches addressing the selection and design of future transport options that might not only extend the tenure of older Australians as drivers but also provide a greater range of viable post-driving options to sustain the active and healthy lives of older individuals while achieving greater safety and sustainability at a societal level.
2. Materials and Methods
Figure 1 provides a flowchart describing the research steps adopted for this study.
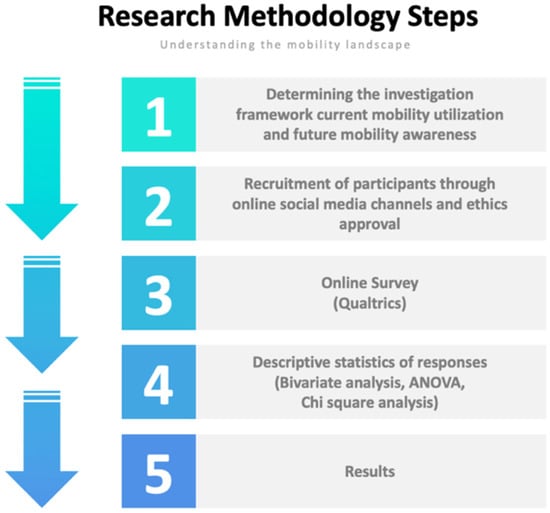
Figure 1.
The research methodology steps.
2.1. Participants
Participants were eligible to participate if they: (a) were aged 18 years and older; (b) had a valid driver’s license; (c) were an ‘active’ driver (i.e., drove at least once per week in the pre-COVID period) and (d) were currently living in Australia.
2.2. Materials
Participants completed an online survey (approximately 25 min) designed to capture information within six key themes, as shown in Figure 2 below.
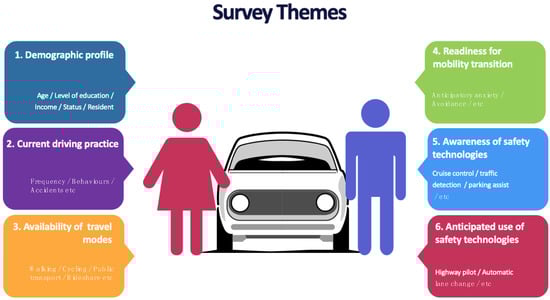
Figure 2.
Survey themes.
With regard to current driving practices, participants provided details on their current vehicle, including make, model and year of manufacture. Participants also provided information on their licensing history, annual mileage (participants were asked to estimate their pre-COVID annual mileage), frequency of driving (where 1 = Daily, 5 = Less than once per week (participants were asked to estimate their pre-COVID driving frequency), previous crash involvement and/or driving infringements and frequency of wearing their seatbelt while travelling in a motor vehicle (where 1 = Always, 6 = Never).
With regard to availability and use of travel modes, participants were presented with a range of travel modes (including passenger in a private vehicle, pedestrian, bicycle, e-bike, motorcycle, scooter, train, public bus, taxi, rideshare vehicle, etc.), and asked whether they are currently available in their community (Yes/No). If the travel modes were available in their community, participants were then asked: (1) if they used them (Yes/No/Not applicable) and (2) if they could use them if they wanted to (Yes/No/Not applicable).
Intent to transition from driving to non-driving was measured using the Assessment of Readiness for Mobility Transition (ARMT) [12]. The ARMT contains 24 items related to emotional and attitudinal readiness for mobility transition across four dimensions: (1) anticipatory anxiety; (2) perceived burden; (3) avoidance; and (4) adverse situations. Within the ARMT, participants were asked to consider each item related to mobility loss and indicate their level of agreement on a five-point Likert-type response scale (where 1 = Strongly Disagree, 5 = Strongly Agree), where higher scores represent a higher propensity for participants to feel quite threatened, fearful and worried about the prospect of mobility loss. Specifically, participants were classified as achieving a ‘high’ ARMT score if their average score was greater than 3.57 and a ‘low’ ARMT score if their average score was less than 2.30.
With regard to awareness and use of vehicle safety technologies, participants were presented with a list of current and future motor vehicle safety technologies which help the driver to avoid crashes by providing warnings or driving assistance when necessary. Participants were asked about their awareness of vehicle technologies, particularly those that are considered safety features, and to indicate whether: (1) they are aware of these technologies (Yes/No) and (2) their current vehicle has any of these technologies (Yes/No/Not sure). The total number of safety technologies of which participants were aware was calculated (maximum = 17). Participants were also presented with three relatively novel vehicle technologies (automatic lane change, highway pilot, traffic jam pilot) that were described to them, after which they were asked to indicate whether they would use them if they purchased a new vehicle (where 1 = Very likely, 5 = Very unlikely).
2.3. Procedure
The study was approved by the Monash University Human Research Ethics Committee (MUHREC). Participants were recruited through various online and social media advertising channels, such as the MUARC Facebook page and Twitter feed. The advertising directed participants to an online survey link. To improve recruitment, participants who completed the online survey were able to opt into a draw to win one of five $100 gift vouchers. The online survey was administered from September–October 2021.
2.4. Data Analysis
Descriptive statistics were generated to describe the sample and responses. Bivariate analyses (e.g., t tests, ANOVAs and chi-square analyses) were conducted to explore the relationships between variables of interest. These variables were chosen to explore parameters related to research question(s) and identified knowledge gaps. All statistical analyses were conducted using IBM SPSS v. 28.
Power analysis using G*power determined that a sample size of at least n = 400 was required (based on a medium effect size [0.25], 95% power, and p < 0.05).
3. Results
3.1. Participants’ Socio-Demographic Characteristics
Seven hundred and four participants completed the online survey. As shown in Table 1, the majority of participants: were aged between 55 and 74 years (55.7%; M = 56.2 years, SD = 15.3, range = 18–90 years); were male (51.1%); were in a married/de facto relationship (66.3%); had completed a postgraduate degree (32.1%); had a yearly household income of between AUD 25,001 and 50,000 before tax (18.3%); lived in the Australian state of Victoria (41.6%); and lived in a major city of Australia (69.5%).

Table 1.
Participants’ socio-demographic characteristics (n = 704).
3.2. Participants’ Driving and Licensing Characteristics
Many participants reported that they drove at least four times per week (69.3%), had driven between 5001 and 10,000 km in their vehicle over the past year (or pre-COVID) (28.6%) and ‘always’ wore their seatbelt while driving or travelling in a vehicle (95.7%, see Table 2). Over the past two years, many participants reported that they had not been involved in a motor vehicle crash (87.8%) or an at-fault crash (94.8%), had not been cited for failing to stop (96.4%), speeding (84.1%) or other driving infringements such as using a mobile phone illegally while driving (97.4%).
Table 2.
Participants’ driving characteristics (n = 704).
3.3. Participants’ Current and Available Travel Modes
Participants were presented with a range of travel modes and asked whether they are currently available in their community (Yes/No) (see Table 3). The travel modes that were most likely to be reported as being currently available included walking (97.6%), taxis (93.3%) and private vehicles (as a passenger) (91.5%).
Table 3.
Participants’ current and available travel modes (n = 704).
If the travel modes were available in their community, participants were also asked (1) if they used them (Yes/No/Not applicable) and (2) if they could use them if they wanted to (Yes/No/Not applicable). The available travel modes that were most likely to be used included walking (92.0%) and private vehicles (as a passenger) (88.0%). The available travel modes that could be used by participants were train (97.0%), walking (96.8%) and private vehicles (as a passenger) (95.5%).
Some relationships between availability of travel modes and participant demographics were found. Older participants reported higher availability of community bus services and volunteer drivers compared with younger participants (X2(2) = 13.72, p < 0.01, Cramer’s V = 0.140; X2(2) = 36.03, p < 0.001, Cramer’s V = 0.226, respectively). Male participants were more likely than female participants to report availability of private vehicles, eBikes, public bus and taxi (private vehicle: X2(2) = 4.72, p < 0.05, Cramer’s V = 0.082; eBikes: X2(1) = 5.52, p < 0.05, Cramer’s V = 0.089; public bus: X2(1) = 7.72, p < 0.01, Cramer’s V = 0.105; taxi: X2(2) = 4.98, p < 0.05, Cramer’s V = 0.085). Participants living in major cities were more likely to report availability of walking, eBikes, train, bus, taxis, rideshare and volunteer modes compared with those living in regional areas (walking: X2(1) = 10.74, p < 0.01, Cramer’s V = 0.129; eBikes: X2(1) = 7.95, p < 0.01, Cramer’s V = 0.111; train: X2(1) = 56.75, p < 0.001, Cramer’s V = 0.297; public bus: X2(1) = 80.94, p < 0.001, Cramer’s V = 0.340; taxi: X2(2) = 30.87, p < 0.001, Cramer’s V = 0.219; rideshare: X2(1) = 131.76, p < 0.001, Cramer’s V = 0.452; volunteer services: X2(1) = 8.39, p < 0.01, Cramer’s V = 0.114).
With regard to use of available travel modes, some relationships were found. Older participants were less likely than middle-aged participants to use a bike (X2(2) = 6.12, p < 0.05, Cramer’s V = 0.102), however were more likely than younger participants to use a taxi (X2(2) = 12.32, p < 0.01, Cramer’s V = 0.137). Male participants were more likely than female participants to use a bike, eBike and motorcycle (bike: X2(1) = 23.14, p < 0.001, Cramer’s V = 0.119; eBike: X2(1) = 5.98, p < 0.05, Cramer’s V = 0.155; motorcycle: X2(1) = 7.92, p < 0.01, Cramer’s V = 0.198). Participants living in major cities were more likely than those living in regional areas to walk, use a bus, rideshare and community bus services (walk: X2(1) = 6.04, p < 0.05, Cramer’s V = 0.098; public bus: X2(1) = 17.68, p < 0.001, Cramer’s V = 0.173; rideshare: X2(1) = 6.96, p < 0.01, Cramer’s V = 0.115; community bus: X2(1) = 5.93, p < 0.01, Cramer’s V = 0.153).
3.4. Participants’ Readiness for Mobility Transition
Participants’ responses to the ARMT were analysed. The mean AMRT score was 2.48 (SD = 0.55, range = 1.00–4.46) and had excellent internal consistency (Cronbach’s α = 0.90). There were no significant relationships between participant’s mean ARMT score and their age group (F(2,701) = 0.257, p = 0.774) or gender (t(692 = 0.525, p = 0.600)).
Participants’ average scores across the four ARMT dimensions are presented in Table 4.
Table 4.
Participants’ readiness for mobility transition (n = 704).
Less than 5% (4.1%) of the sample were classified as having a ‘high’ score (i.e., mean > 3.57), and 37.9 percent of the sample were classified as having a ‘low’ score (i.e., mean < 2.30). There were no significant relationships between participants ARMT score classification and age group (X2(4) = 1.920, p = 0.750, Cramer’s V = 0.052) or gender (X2(2) = 1.281, p = 0.527, Cramer’s V = 0.043).
3.5. Participants’ Awareness, Use and Anticipated Use of Safety Technologies
Participants were presented with a list of safety technologies and were asked to indicate whether they were aware of them (Yes/No). As shown in Table 5, participants were most likely to be aware of adaptive cruise control (81.5%) and least likely to be aware of intersection assistance (32.2%). If participants were aware of the technologies, they were then asked if their current vehicle was equipped with any of them (Yes/No/Not sure). Participants were most likely to report that their current vehicle had electronic stability control (60.8%) and least likely to report that an alcohol interlock was fitted (0.2%).
Table 5.
Participants’ awareness of safety technologies (n = 704).
Participants’ overall awareness of safety technologies was calculated. The average number of safety technologies that participants were aware of was 8.31 (SD = 7.10, range = 0.00–17.00). There was a significant relationship between participant’s awareness of safety technologies and their age group (F(2,701) = 3.441, p < 0.05). Middle-aged participants (aged 31–64 years) were more likely to be aware of safety technologies (M = 8.93, SD = 6.92) than older participants (aged 65+ years, M = 7.64, SD = 7.37) or younger participants (aged 18–30 years, M = 7.17, SD = 6.9). In addition, there was significant relationship between participant’s awareness of safety technologies and their gender (t(692 = 6.106, p < 0.001)), with males more likely to be aware of safety technologies (M = 9.82, SD = 7.14) than females (M = 6.62, SD = 6.65).
Participants’ expected use of technologies was examined, and ratings of likelihood were combined to form three groups: (i) very likely/likely; (ii) unlikely/very unlikely; and (iii) neither likely nor unlikely. In terms of the three new vehicle technologies (see Table 6), more than half of the participants reported that they were very likely/likely to use highway pilot (57.1%). Less than half of the participants reported that they would be very likely/likely to use traffic jam pilot (44.2%) or automatic lane change (39.3%).
Table 6.
Participants’ anticipated use of safety technologies in the future (n = 704).
There was a significant relationship between gender and participants’ anticipated use of safety technologies in the future. Male participants were more likely to report that they were ‘Very likely/Likely’ to use traffic jam pilot (51.9%), highway pilot (63.9%) and automatic lane change (45.8%) compared to female participants (36.2%, 50.0%, 32.6%, respectively) (traffic jam pilot: X2(2) = 17.869, p < 0.001, Cramer’s V = 0.160; highway pilot: X2(2) = 13.198, p < 0.01, Cramer’s V = 0.138; automatic lane change: X2(2) = 14.240, p < 0.001, Cramer’s V = 0.143).
There was also a significant relationship between age and participants’ anticipated use of automatic lane change. Older participants (aged 65+ years) were more likely to report that they were ‘Very likely/Likely’ to use this technology (46.4%) compared to middle-aged participants (aged 31–64 years, 35.7%) or younger participants (aged 18–30 years, 33.8%) (X2(4) = 9.932, p < 0.05, Cramer’s V = 0.119). However, there was no significant relationship between age and participants’ anticipated use of traffic jam pilot (X2(4) = 6.560, p = 0.161, Cramer’s V = 0.097) or highway pilot (X2(4) = 0.613, p = 0.962, Cramer’s V = 0.029).
4. Discussion
Mobility is essential for general independence as well as ensuring good health and quality of life, and the ability to travel is a key component of mobility. Comprehensive definitions of mobility encompass a number of broad elements, including the ability to travel where and when a person desires; being informed about travel options, knowing how and being able to use them and having the means to pay for them; and knowing that a trip could be made even if not actually made [13,14]. The viability, availability, affordability, accessibility and sustainability of all transport modes are critical to maintaining good mobility [15]. There is also strong evidence that, to continue to be active participants in their communities, to reach services and to maintain social connectedness, older adults require good access to safe, adequate and appropriate transport and mobility options [1].
In contrast, poor mobility places a substantial burden on the individual, family, community and society and there is a real need for consideration of the transportation needs of older adults at all levels to support ongoing mobility for older road users. Previous literature has highlighted the poor understanding of the mobility needs of older adults, and the lack of appropriate systems to manage their safe mobility [3,16].
The current study aimed to enhance our understanding of current and future transport needs of older adults. In particular, it investigated: (i) the availability and use of transport modes and (ii) awareness, acceptance of and anticipated use of vehicle technologies.
The findings of the survey of Australian drivers confirmed previous literature regarding travel mode use and awareness and acceptance of vehicle technologies. Overall, the sample was representative of metropolitan and regional/rural drivers, ranging in age from 18 to 85+ years. They were experienced, active and safe drivers, having few crashes or infringements. The findings also demonstrate that our sample were generally satisfied with their transport mobility and ability to reach services and social engagements when they required and less anxious and more prepared for mobility transition compared with US samples [12], regardless of age, gender and location of residence.
With regard to availability and use of a range of transport modes, participants indicated that a range of transport options were available to them and access was not an issue. While it was not surprising to find that participants were generally users of most transport modes, particularly as passengers in private vehicles, walking, taxis, and some public transport, there was little use of some transport modes such as scooters, eBikes, motorcycles, rideshare and community transport with a volunteer driver. Furthermore, there was some suggestion that age, gender and location of residence influenced availability and use/potential use of some transport options. For example, compared with city dwellers, many living in regional and rural areas indicated that rideshare, public and community-based transport options were unavailable. This supports the evidence regarding transport disadvantages in regional and rural Australia [17,18]. In addition, women were less likely than men to have access to and use a range of transport options. These findings also support previous literature addressing gender differences in transport [6,19,20].
While there was some awareness and use of some important in-vehicle technologies, such as adaptive cruise control, adaptive headlights, electronic stability control, forward collision warning, lane keeping and parking assist, overall awareness was generally low, and this was particularly so amongst older and female participants. Moreover, there was little knowledge of the presence of safety features in current vehicles. These findings also support previous literature addressing the awareness, acceptance and adaptability to in-vehicle technologies. Generally, the evidence suggests that, while there is some awareness and acceptance of new technologies [5,21,22,23,24], older adults (particularly older women) are less aware and accepting of new technologies compared with younger adults. Furthermore, it was encouraging to find that, when asked about three emerging technologies (descriptions were provided), for those who were aware of features, a substantial proportion (range 39–57%) indicated that they would consider these features when purchasing a new vehicle. In the longer term, the introduction of fully automated vehicles will alleviate the need of accepting new technologies; however, the issues surrounding the acceptance of and trust in these vehicles warrants further research [25].
5. Conclusions
The viability, affordability, accessibility and sustainability of alternative transport modes and safer vehicles are essential to maintain mobility, and the implications for transport utilisation by older road users will be significant. It is critical to understand the travel patterns and needs of older adults in order to develop and plan for a more mobile society in the future. The findings from this survey have enhanced our understanding of current and future transport options for Australian road users and awareness and use of in-vehicle technologies. This understanding can inform the development of effective strategies and initiatives to promote acceptance and use of a range of transport options and uptake of safer vehicles equipped with in-vehicle technologies to ultimately enhance safe mobility of older road users. Further research, building on this information, will centre around informed policies, programs and resources that will effectively assist older adults maintain safe mobility which align with healthy ageing and wellbeing targets, increased resilience and connectedness, and creation of healthier travel choices and healthier environments.
Author Contributions
Conceptualization, J.O., D.B.L., S.C. and S.K.; methodology, S.K.; formal analysis, S.K.; writing—original draft preparation, J.O., D.B.L., S.C. and S.K.; writing—review and editing, J.O., D.B.L., S.C. and S.K.; project administration, S.K. All authors have read and agreed to the published version of the manuscript.
Funding
This research received no external funding.
Institutional Review Board Statement
The study was approved by the Monash University Human Research Ethics Committee (MUHREC ID 30030).
Informed Consent Statement
Informed consent was obtained from all participants involved in the study.
Data Availability Statement
The dataset supporting the conclusions of this article is available from the corresponding author on reasonable request.
Conflicts of Interest
The authors declare no conflict of interest.
References
- World Health Organisation (WHO). World Report on Ageing and Health; WHO Press: Geneva, Switzerland, 2015.
- Coxon, S.; Napper, R.; Richardson, M. Urban Mobility Design; Elsevier: Amsterdam, The Netherlands, 2019; pp. 94–97. [Google Scholar]
- Organisation for Economic Co-Operation and Development (OECD). Ageing and Transport: Mobility Needs and Safety Issues; OECD: Paris, France, 2001.
- Yue, L.; Abdel-Aty, M.; Wuc, Y.; Wang, L. Assessment of the safety benefits of vehicles’ advanced driver assistance, connectivity and low level automation systems. Accid. Anal. Prev. 2018, 117, 55–64. [Google Scholar] [CrossRef] [PubMed]
- Classen, S.; Jeghers, M.; Morgan-Daniel, J.; Winter, S.; King, L.; Struckmeyer, L. Smart In-Vehicle Technologies and Older Drivers: A Scoping Review. OTJR Occup. Particip. Health Spec. Issue Robot. AI Autom. Relatsh. Health Occup. Ther. 2019, 39, 97–101. [Google Scholar] [CrossRef] [PubMed]
- O’Hern, S.; Oxley, J. Understanding travel patterns to support safe active transport for older adults. J. Transp. Health 2015, 2, 79–85. [Google Scholar] [CrossRef]
- Marottoli, R.A.; Coughlin, J.F. Walking the tightrope: Developing a systems approach to balance safety and mobility for an aging society. J. Aging Soc. Policy 2011, 23, 372–383. [Google Scholar] [CrossRef] [PubMed]
- Habib, M.; Anik, M. Impacts of COVID-19 on Transport Modes and Mobility Behavior: Analysis of Public Discourse in Twitter. Transp. Res. Rec. J. Transp. Res. Board 2021, 1–14. [Google Scholar] [CrossRef]
- European Union; Wefering, F.; Rupprecht, S.; Bührmann, S.; Böhler-Baedeker, S. Guidelines—Developing and Implementing a Sustainable Urban Mobility Plan. European Platform on Sustainable Urban Mobility Plans; European Union: Brussels, Belgium, 2014.
- Ramirez Lopez, L.; Grijalba Castro, A. Sustainability and resilience in smart city planning: A review. Sustainability 2021, 13, 181. [Google Scholar] [CrossRef]
- Campisi, T.; Mrak, I.; Errigo, M.; Tesoriere, G. Participatory planning for better inclusive urbanism: Some considerations about infrastructural obstacles for people with different motor abilities. AIP Conf. Proc. 2021, 2343, 090006. [Google Scholar]
- Meuser, M.T.; Berg-Weger, M.; Chibnall, J.T.; Harmon, A.C.; Stowe, J.D. Assessment of readiness for mobility transition (ARMT) A tool for mobility transition counseling with older adults. J. Appl. Gerontol. 2013, 32, 484–507. [Google Scholar] [CrossRef] [PubMed]
- Suen, S.L.; Sen, L. Mobility options for seniors. In Transportation in an Ageing Society: A Decade of Experience, Proceedings 27; Transportation Research Board: Washington, DC, USA, 2004; pp. 97–113. [Google Scholar]
- Giuliano, G.; Hu, H.; Lee, K. Travel Patterns of the Elderly: The Role of Land Use; Metrans Project 00-8; School of Policy, Planning and Development, University of Southern California: Los Angeles, CA, USA, 2002. [Google Scholar]
- Kerschner, H.; Aizenberg, R. Focus group participants reflect on transportation. In Transportation in an Aging Society: A Decade of Experience; Transportation Research Board: Washington, DC, USA, 2004. [Google Scholar]
- Kerschner, H.; Silverstein, N. Introduction to Senior Transportation Enhancing Community Mobility and Transportation Services; Routledge, Taylor and Francis Group: Oxfordshire, UK, 2018. [Google Scholar]
- Rosier, K.; McDonald, M. The Relationship between Transport and Disadvantage in Australia; Australian Institute of Family Studies, Australian Government: Melbourne, Australia, 2011.
- Australian Bureau of Statistics (ABS). Research Paper: A Review of Regional Development Australia Committee Regional Plans; Report 1381.0; Australian Bureau of Statistics: Canberra, Australia, 2013.
- Pollard, T.; Wagnild, J. Gender differences in walking (for leisure, transport and in total) across adult life: A systematic review. BMC Public Health 2017, 17, 341–352. [Google Scholar] [CrossRef] [Green Version]
- Gauvin, L.; Tizzoni, M.; Piaggesi, S.; Young, A.; Adler, N.; Verhulst, S.; Ferres, L.; Cattuto, C. Gender gaps in urban mobility. Humanit. Soc. Sci. Commun. 2020, 7, 11–23. [Google Scholar] [CrossRef]
- Koppel, S.; Charlton, J. Behavioural Adaptation and Older Drivers; CRC Press: Boca Raton, FL, USA, 2013. [Google Scholar]
- Musselwhite, C.; Haddad, H. Prolonging the Safe Driving of Older People through Technology; Centre for Transport & Society: Bristol, UK, 2007; p. 155. [Google Scholar]
- Eby, D.; Molnar, L.; Zakrajsek, J.; Ryan, L.H.; Zanier, N.; St. Louis, R.M.; Stanciu, S.C.; LeBlanc, D.; Kostyniuk, L.P.; Smith, J.; et al. Prevalence, attitudes, and knowledge of in-vehicle technologies and vehicle adaptations among older drivers. Accid. Anal. Prev. 2018, 113, 54–62. [Google Scholar] [CrossRef] [PubMed]
- Oxley, J.; Charlton, J.; Logan, D.; O’Hern, S.; Koppel, S.; Mueleners, L. Safer vehicles and technology for older adults. Traffic Inj. Prev. 2020, 20, S176–S179. [Google Scholar] [CrossRef] [PubMed]
- Bansal, P.; Kockelman, K.M. Are we ready to embrace connected and self-driving vehicles? A case study of Texans. Transportation 2018, 45, 641–675. [Google Scholar] [CrossRef]
Publisher’s Note: MDPI stays neutral with regard to jurisdictional claims in published maps and institutional affiliations. |
© 2022 by the authors. Licensee MDPI, Basel, Switzerland. This article is an open access article distributed under the terms and conditions of the Creative Commons Attribution (CC BY) license (https://creativecommons.org/licenses/by/4.0/).