Article

A High-Resolution Wind Farms Suitability Mapping Using GIS and Fuzzy AHP Approach: A National-Level Case Study in Sudan

1
Electrical Power and Machines Engineering Department, Faculty of Engineering, Tanta University, Tanta 31511, Egypt
2
School of Mechanical and Electrical Engineering, University of Electronic Science and Technology of China (UESTC), Chengdu 611731, China
3
Department of Architectural Engineering, Faculty of Engineering, Tanta University, Tanta 31511, Egypt
4
Department of Civil Engineering, Faculty of Engineering, Taif University, Taif 21944, Saudi Arabia
*
Author to whom correspondence should be addressed.
Sustainability 2022, 14(1), 358; https://doi.org/10.3390/su14010358
Submission received: 20 November 2021 / Revised: 26 December 2021 / Accepted: 27 December 2021 / Published: 29 December 2021

Abstract

:
Wind energy is one of the most attractive sustainable energy resources since it has low operation, maintenance, and production costs and a relatively low impact on the environment. Identifying the optimal sites for installing wind power plants (WPPs) is considered an important challenge of wind energy development which requires careful and combined analyses of numerous criteria. This study introduces a high-resolution wind farms suitability mapping based on Fuzzy Analytical Hierarchy Process (FAHP) and Geographic Information System (GIS) approaches considering technical, environmental, social, and spatial aspects, representing eight different criteria. First, a multi-criteria decision-making analysis based on the FAHP method is employed to assign appropriate weights for the addressed criteria with respect to their relative importance. Since the traditional AHP method, which was found employed in the majority of the relative case-studies, is not efficient in dealing with uncertainty when experts use a basic scale (0 to 1) for their assessments, the FAHP provides more flexible scales through the utilized fuzzy membership functions and the natural linguistic variables. Consequently, this helps to facilitate the assessments made by experts and increases the precision of the obtained results (weights). Next, the high-resolution GIS is used to carry out a spatial analysis and integrate various factors/criteria throughout the proposed index to produce the final suitability map and identify the unsuitable areas. The presented study emphasizes investigating the lightning strike flash rate due to its significant influences on the wind turbine’s safety and operation, yet this crucial factor has been seldomly investigated in previous studies. The obtained findings revealed that the wind speed, the land slope, and the elevation had the highest weighted criteria with 33.1%, 24.8%, and 12.2%, respectively. Besides, the final-developed suitability map revealed that 23.22% and 8.31% of the Sudanese territory are of high and very high suitability, respectively, for wind farms installation which are considered sufficient to cover the electricity needs. The difficulty of acquiring real data and resources for the addressed location was the main challenge of the presented work. The work outlook addresses the suitability mapping of hybrid photovoltaic-wind turbine energy systems, which will require addressing new and significant criteria in the applied methodology.

1. Introduction

Sudan is located in the northern part of the Africa continent. It has two tributaries of the River Nile (the White Nile and the Blue Nile), making it a sizeable agricultural area where millions of people are concentrating. About 54% of Sudan’s population suffers from electricity shortage, where most of them are supplied by standalone diesel generators [1,2]. The electrical energy supply in Sudan mainly depends on fossil fuels, which negatively impacts the environment and humans. Sudan is facing many energy development challenges brought about by high electricity subsidy levels and climate-induced impacts on hydroelectric generation, which has been decreasing at a rate of about 4% per year. Improving access to modern and affordable energy is a development priority for Sudan [3]. Therefore, the Sudanese government seeks to achieve a clean and reliable electrical energy supply since Sudan has high wind and solar potential.
Wind energy is one of the newest and fast-developing renewable energy sources since it is a clean, renewable, and has a low impact on humans and the environment [4]. In addition, wind turbines (WTs) are easy to install and require low operation and maintenance costs [5]. The newly-installed capacity of wind energy in 2018 have reached 51.3 GW worldwide [6]. For the development of wind energy projects, many factors that affect the wind project’s outcome must be considered. One of the essential factors is finding a suitable investment site for a wind power plant (WPP) considering the preliminary assessment for economic, technical, environmental, and land-use implementation conditions. Additionally, some essential factors must be considered when selecting wind farm locations, such as the negative impacts of WTs on birds and wildlife, shadow flickering, visual impacts, and electromagnetic interference [7]. Hence, the locations with the highest wind speed do not need to be the best sites, but a trade-off must be made between various economic, physical, and ecological factors to select the optimal locations [8].
Multi-criteria decision-making (MCDM) techniques identify suitable locations for installing wind farms. There are different techniques used for MCDM which can be combined with the Geographic Information Systems (GIS) environment such as rating method, weighted sum method (WSM), ranking method, Weighted Linear Combination (WLC), analytical hierarchy process (AHP), Boolean overlay operation, trade-off analysis method, analytic network process (ANP), trade-off analysis method, concordance analysis, Order Weighted Average (OWA), ELimination Et Choice Translating Reality (ELECTRE), Full Consistency Method (FUCOM), Technique for Order Preference by Similarity to Ideal Solution (TOPSIS), Best-Worst Method (BWM) and Simple Additive Weighting (SAW) [9]. The WSM is commonly used for single-dimensional decision-making problems, but it is difficult to be applied in multi-dimensional problems [10]. In addition, the ELECTRE method is mostly suitable when decision-making problems have some criteria with a large number of alternatives. However, it sometimes cannot identify the most preferred alternative [11]. The AHP is considered the most commonly used MCDM technique in the literature for assessing renewable energy location as it is simple, intuitive, and can check the consistency of the decision. It has the advantage of reducing the complexity of decision-making problems which need a high level of reliability and flexibility. In addition, it has the ability to combine quantitative and qualitative criteria in the same framework. AHP is a mathematical approach used to make a pairwise criteria comparison where it specifies a weight of relative importance to each criterion according to the experts’ opinions of decision-makers [12,13]. On the other hand, if the uncertainty between various criteria is considered, the AHP can be integrated with fuzzy set theory to give more accurate results [14].
Many researchers widely used GIS-based MCDM to select the optimal location of WPP s [7,14,15,16,17,18,19,20]. A framework was proposed before [7] to select suitable locations for wind farm installation in Greece at the regional level. The GIS-based MCDM analysis was implemented in the study, where the fuzzy set approach was used to represent the evaluation criteria. Moreover, the suitable sites of wind farms in a province in Iran were assessed using the ANP and decision-making trial and evaluation laboratory (DEMATEL) method in the GIS environment [15]. The ANP was used to calculate the weights of criteria, where the criteria relationships were determined using the DEMATEL method. Also, the TOPSIS method combined with an intuitionistic fuzzy set (IFS) has been used to determine the suitable location for wind farms [21], and FUCOM was used in another research for the same goal [22]. Furthermore, BWM has been used to assess the sustainability performances of existing onshore wind plants [23]. Also, the suitable locations for the wind farms installation in the province of Vojvodina, Serbia, were identified based on the ANP technique, the Decision-Making Trial and Evaluation Laboratory (DEMATEL) technique, and Multi-Attributive Border Approximation Area Comparison (MABAC) method in the environment of GIS [16]. The authors considered the economic, social, and environmental aspects for site assessment, classified into eleven constraints and eleven evaluation criteria.
The criteria weights were calculated using the ANP-DEMATEL, and the selected viable locations were ranked using the MABAC methodology. Furthermore, the best sites for wind turbines in Murcia, Spain, were selected and evaluated before [17]. The locations were assessed using two techniques; the lexicographic order filtering method based on the chosen criteria, and the ELECTRE-TRI method is used as an MCDM technique. Another work [18] built a framework to select the best locations for offshore WTs in China using the ELECTRE-III technique based on the intuitionistic fuzzy set. The AHP methodology was implemented with GIS to determine the optimal locations of WPPs in an area in Germany [19]. In the study, nine criteria were used, including techno-economic, socio-political, and environmental aspects, where several experts were asked to make the pairwise comparison and derive the relative weights. In addition, the optimal locations of WPPs on an island in Greece were assessed using the AHP methodology combined with the GIS [20]. Different criteria were used in the study comprising the wind power potential, land cover type, visual impact, power consumption, the land value, and the distance from the power grid, then the complete suitability map of the island was created. Additionally, the AHP method has been used to determine the suitable sites for wind-solar energy plants [24]. In another research, AHP has been combined with the stochastic approach (SMAA-2) to determine the best location for wind farms [25]. Another work conducted a strategy using the fuzzy set combined with AHP to identify the best locations of wind farms in Turkey based on wind speed, slope, building, and vegetation criteria [14]. In addition, the sites with minimum negative impacts on the rural areas were determined.
In this work, the area of study is in Sudan, where no previous research was conducted to select the optimal sites of WPPs. In this study, an MCDM framework based on the fuzzy-AHP method is performed to identify the optimal wind farm installation sites using GIS software. The best locations are identified considering various criteria such as wind speed, slope, distance from transmission lines (TLs) and power grids (PG), distance from urban/major cities, distance from airports, elevation, distance from major roads and railways, and the lightning strike flash rate. Therefore, the areas with a lower lightning flash rate must be considered when selecting places for installing WPPs. The main contributions and novelty of this study can be summarized as follows:
-
Proposing a high-resolution wind farms suitability mapping-based Fuzzy Analytical Hierarchy Process (FAHP) and Geographic Information System (GIS) approaches considering technical, environmental, social, and spatial aspects in the Sudanese territory where, as to the best of authors’ knowledge, there no research investigations were conducted to select optimal locations of constructing WPPs.
-
The presented FAHP approach provides more flexible scales through the utilized fuzzy membership functions and the natural linguistic variables. Consequently, facilitate the assessments made by experts and increase the precision of the obtained weights.
-
The presented study emphasizes investigating the lightning strike flash rate due to its significant influences on wind turbine’s safety and operation, yet this crucial factor has been seldomly investigated in previous studies. The main concern of examining this factor is that when lightning hits WTs, large overvoltages are generated on their bodies, damaging different parts of the WTs.
The presented research is structured as follows: the materials and methodology of the study are described in Section 2, Section 3 presents the results and related discussions, and finally, the study conclusions are stated in Section 4.

2. Materials and Methodology

Since this research aims to develop a methodology that can divide the available land for implementing wind farm projects to different levels in terms of suitability, several steps have been obtained to achieve this goal, as shown in Figure 1. The research begins by selecting the case study and investigating the extent of the need for such projects and the appropriateness of location for these projects through a literature review. Next, choose the most influential factors in land suitability for wind farms, according to the technical issues and nature of the case study. Consequently, specific weights are determined for each factor to develop an index to identify land suitability. The FAHP has been used to calculate these weights. Then, GIS is used for spatial analysis and integrating various factors through the proposed index to produce the final suitability map and identify unsuitable areas.

2.1. Case Study

Sudan is one of the largest African countries characterized by its important and vital location on the Red Sea, and the Nile River passes as a major resource for water and energy in the region. Sudan suffers from a severe shortage of energy production, where about 70% of the population does not have access to electricity. Different energy production alternatives are costly, such as building dams on the Nile, and many other options, such as diesel generators, are associated with pollution problems and adverse environmental impacts. The Sudanese government has activated an initiative to exploit renewable energy and aims to reach 38% of electricity production by 2030 and achieve 100% production by 2050 [26,27]. Sudan contains potentials for many renewable energy projects such as solar energy, wind energy, etc. Sudan includes large desert lands characterized by high solar radiation and an appropriate potential of wind speed [28].

2.2. Factors Used for Land Suitability Assessment

To define the areas that should be considered as the ones excluded from the wind power development, several constraint criteria will be determined. These criteria should describe Sudan’s environmental, social, technical, and cultural characteristics that need to be preserved. A total number of eleven constraint factors and eight evaluation factors were identified and used as input to the GIS software to perform the spatial analysis and allocate the optimal sites for WT installation in Sudan.

2.2.1. Wind Speed

Wind speed is considered the most important criterion for WPPs planning. Increasing the wind speed within appropriate ranges denotes higher power output from WTs. There are different threshold values for wind speed recommended by previous research studies. In this work, the locations with average wind speed <3 m/s are considered unsuitable for wind farm sitting. In addition, the sites with wind speeds >20 m/s are excluded to the WT equipment due to possible damage [29].

2.2.2. Slope

The slope is a critical technical index for wind farms construction. The accessibility of maintenance and installation equipment is affected by the high slope and increases the installation cost. Hence, selecting flat areas and locations with lower slopes for wind farm installation is highly-recommended. In this work, the areas with slopes greater than 15% are excluded from the final suitability map [30]. The Sudanese digital elevation model (DEM) data has been used for the slope factor in this study.

2.2.3. Distance from Urban Areas

Wind farms have various adverse impacts on nearby human beings, such as mechanical and aerodynamic noise, visual disturbances, and shadow flickering. To reduce the negative impacts of wind farms, it is essential to consider the minimum distance from urban and residential areas. On the other hand, a reasonable distance from settlements should be considered in order not to increase the transmission power losses and transmission cost. Therefore, the distance from urban and residential areas should be selected carefully. In this paper, the areas of distances >1 km from residential areas are considered suitable sites for wind farms installation [31]. In this study, the map has been generated using the LULC map and extracts the urban areas using the “extract by value” tool; then, the map has been converted to a polygon.

2.2.4. Elevation

The wind direction and speed are greatly affected by the site elevation. WTs are usually installed on highly elevated areas to capture more wind speeds [32]. However, this increases the construction cost and the difficulty of installation and maintenance operations. Therefore, the appropriate site for wind farms should be selected wisely. In this study, the highest elevation is 1250 m, and the lowest elevation is 0 m, in which the elevation map was extracted from DEM data of Sudan.

2.2.5. Distance from Transmission Lines and Power Grid

The distance from power transmission lines and the power grid is an important criterion for selecting wind farms. A minimum distance should be considered to mitigate the effect of electromagnetic fields generated by TLs, which could hurt human health. In addition, the closeness of WPPs from TLs improves the efficiency as the losses decrease and reduces the cost of constructing new TLs near the farm [30]. This minimum distance from power TLs and the power grid is considered 0.5 km in this work [33].

2.2.6. Distance from Airports

During the wind farm installation, an appropriate distance from airports should be considered since the WTs may be influenced by the aviation routes, leading to collisions. In addition, WTs may influence communication systems and navigation in airports. This study’s recommended minimum distance from the main airports is 3 km [16].

2.2.7. Distance from Major Roads and Railways

The wind farm locations should be close to the major road network and railways to reduce the WTs transportation cost and facilitate the access for the different employees. In addition, the cost of constructing new roads and maintenance will be minimized. On the other hand, decreasing the distance between the wind farm and the roads negatively impacts road transportation because of loud noises. Moreover, the roads will be shadowed because of the WTs’ blades rotation and some changes in the visual landscape [19]. Hence, this work’s assigned minimum distance from major roads and railways is 0.5 km [34].

2.2.8. Lightning Strike Flash Rate

The lightning strike flash rate criterion is considered a significant factor while identifying the optimal locations of wind farms; despite this fact, previous papers have not considered such factors in their investigations. Lighting strikes may lead to several problems for WTs, electrical equipment, and people living near the struck object. The possibility of WTs being struck by lightning is very high as they are usually installed in highly elevated locations and open areas to capture higher wind speeds and increase the output power. When the WT blade is subjected to a lightning strike, a large current flows throw the WT’s body, which results in large potential across the WT parts [35]. This large potential may result in severe damage for the WT body and the electronic and control devices. Based on statistical data, some recorded lightning incidents that occurred to WTs were reported in some countries, especially during the winter season, causing failures for some WTs and outages for a long time for maintenance. Therefore, considering the lightning strike flash rate of the studied region is essential to avoid the locations with higher flash rates to protect wind farms from the damage associated with lightning strikes [36]. Hence, while selecting the optimal location for wind farm installation, the lightning strike flash rate must be considered. The annual flash rate of lightning strikes is selected between 2.5 and 80 fl.km−2y−1, where the areas with an annual flash rate greater than 80 fl.km−2y−1 are excluded [37].

2.3. Multi-Criteria Decision-Making Using Fuzzy Analytical Hierarchy Process (FAHP) Method

In the multi-criteria decision-making (MCDM) problems, the AHP is the most widespread criterion weighting technique [38,39]. However, it cannot handle vagueness in human reasoning. To solve the imprecision in AHP, exact numbers are replaced with fuzzy linguistic expressions known as FAHP, giving more accurate and adequate judgment [12,40]. Figure 2 demonstrates the phases of the applied FAHP method while the derailed steps of the FAHP procedure can be summarized as follows [39]:
  • Develop a hierarchical structure with a top-level goal, selecting middle-level criteria and the different alternatives at the bottom level.
  • Each expert or decision-maker (DM) establishes a fuzzy pairwise comparison matrix based on his ratings. This matrix exemplifies the relative importance of different criteria concerning the goal with the help of the scale of relative importance, which is indicated in Table 1 [39].
Figure 2. Flowchart of the FAHP procedure.
Sustainability 14 00358 g002
3.
Test the consistency of each comparison matrix. The matrix is judged consistent if the inconsistencies amongst the pairwise comparisons are within a fixed limit known as consistency ratio (CR = 0.1) [41]. Otherwise, the DMs need to re-assess their ratings. CR can be calculated from Equation (1), where CI is the consistency index; λm is the principal eigenvalue of the comparison matrix; RI is the random index which depends on the matrix size (n), which can be found in [12].
CR = CI RI ,   CI = λ m n n 1
4.
Synthesize the ‘DMs’ ratings in a single fuzzy pairwise comparison matrix since the ratings of various DMs could differ. Their thoughts should be aggregated to generate a single result. To explain, let (DM1, DM2, …, DMn) be the n DMs, (F1, F2, …, Fx) be the x KPC, and F~ij(n) = (lij(n), mij(n), hij(n)) be a triangular fuzzy number representing the relative importance of Fi over Fj judged by DMn, be the aggregated relative importance of Fi over Fj. Using the geometric mean method represented in Equation (2) [39], the different judgments of DMs can be aggregated.
F ij ˜ =   l ij , m ij , h ij   = k = 1 n F ij ( k ) ˜ 1 n = ( F ij 1 ˜ F ij 2 ˜ F ij n ˜ ) 1 n = k = 1 n l ij ( k ) 1 n , k = 1 n m ij ( k ) 1 n , k = 1 n h ij ( k ) 1 n
5.
Determine the fuzzy weights of each criterion by accumulating the various fuzzy sets in the matrix computed in step-4 into a single fuzzy set. The fuzzy weights are calculated using the Geometric mean method illustrated by Equation (3) [42].
F i ˜ = ( F i 1 ˜ F i 2 ˜ F ix ˜ ) 1 x W i ˜ = F i ˜ j = 1 x F j ˜
6.
Defuzzify the fuzzy weights into crisp weights for further comparison since the fuzzy sets are hard to accurately evaluate as they are partly instructed instead of stringently arranged crisp values. The center of area (CAO) method shown in Equation (4) [39] is employed to defuzzify the fuzzy weights.
W = l + m + h 3
7.
Normalize the obtained weights as a final step to ascertain that the totality of all weights is exactly equal to 1.
Table 1. Linguistic variables for pairwise evaluations of every criterion.
Linguistic VariablesTriangular Fuzzy Number
Extremely important(9,9,9)
Very important(6,7,8)
Important(3,5,7)
Moderately important(1,3,5)
Equally important(1,1,1)
Intermediate(1,2,3), (3,4,5), (5,6,7), (7,8,9)

2.4. GIS Processing

This is the first spatial suitability analysis study for wind farms allocation in Sudan based on a combined FAHP-GIS approach. According to the developed weights and ranking for different criteria, the suitability map is conducted using ArcGIS Desktop 10.8, and the used geo-information data have been collected from freely available resources on the web, as shown in Table 2. This study employs eleven constraints representing eight evaluation factors to ascertain the unsuitable and suitable locations for establishing wind farms. The selection of both groups of factors, which have been adopted in the spatial analysis model, was conducted based on experts’ assessments, attributes of the study area, and literature studies as given in Table 3 and Table 4.

2.5. Generation of the Restrictive Map and Suitable Area

According to the proposed approach, the restriction maps are equivalent to locations that have some impediments for installing the wind farm, which were firstly generated according to the threshold and buffer values given in Table 3 with the aid of ArcGIS software. All maps corresponding to the considered factors were organized and pro-ceded with 250 m (9 arc-sec). Herewith, the individual restriction maps were created using different spatial analysis tools such as classification for wind speed, slope, elevation, land use, and lightning strike where the buffer tool has been used to determine the re-striction of the distance from TLs and PG, airports urban read and major roads.

2.6. Generation of Standardized Suitability Maps

The classified map of each criterion has been generated using the GIS software to generate the suitability map. The produced maps represent the considered criteria and their ranks. All maps have been collected and prepared in a raster format with a resolution of 250 m (9 arc-sec) and classified into a relative class, as shown in Table 4.
The classified map for each criterion has been produced. The wind speed map has been conducted by applying the reclassifying process for the wind speed map in ArcMap using the specified ranges in Table 4. Additionally, the digital elevation model (DEM) has been used for the slope and elevation criteria. The “Slope” tool in ArcGIS is used to develop the slope map. Next, the map is classified using the reclassification tool. In addition, the elevation map has been classified for the elevation criteria rank.
Furthermore, the distribution map of different lightning strikes levels in Sudan has been generated using the reclassifying tool in ArcMap for the LIS/OTD Total Flash Density Map. The reclassification process is conducted according to selected ranges in Table 4; the map is resampled to a resolution of 250 m. In addition, the classification map of distance from urban areas has been generated using LULC map and extracts the urban areas using “extract by value” tool then the map has been converted to polygon and the “buffer” tool has been used to determine the different distance buffers. Additionally, the buffer tool has been used to develop the distance from the road network and distance from power transmission lines using the maps provided by the open street map website.
After the constraints areas were excluded from the total land of Sudan and reclassified suitability maps of evaluation factors were prepared, the remainder is the perform weighted overlay analysis using the Map Algebra spatial analyst tool. In this stage, each suitability evaluation map was assigned a certain weight as obtained from FAHP results, then all maps were combined and then subtracted from the constraints map.
The implementation of the fuzzy system in this work is different from the usually implemented fuzzy logic in control systems. In the multi-criteria decision-making problems, after selecting and setting up the fuzzy numbers which will be used for solving the problem (fuzzy triangular numbers in this study), the assessments carried out by decision-makers in their nature language (linguistic assessments) are converted to a fuzzy environment according to the previously selected fuzzy numbers (as stated in Table 1). Following, a number of fuzzy pairwise matrices are generated based on the number of decision-makers. Next, a set of mathematical processes in the fuzzy environment are accomplished to obtain the final weights of criteria. Finally, the final weights produced in the fuzzy system are defuzzified to obtain the final crisp values as final weights of criteria.

3. Results and Discussion
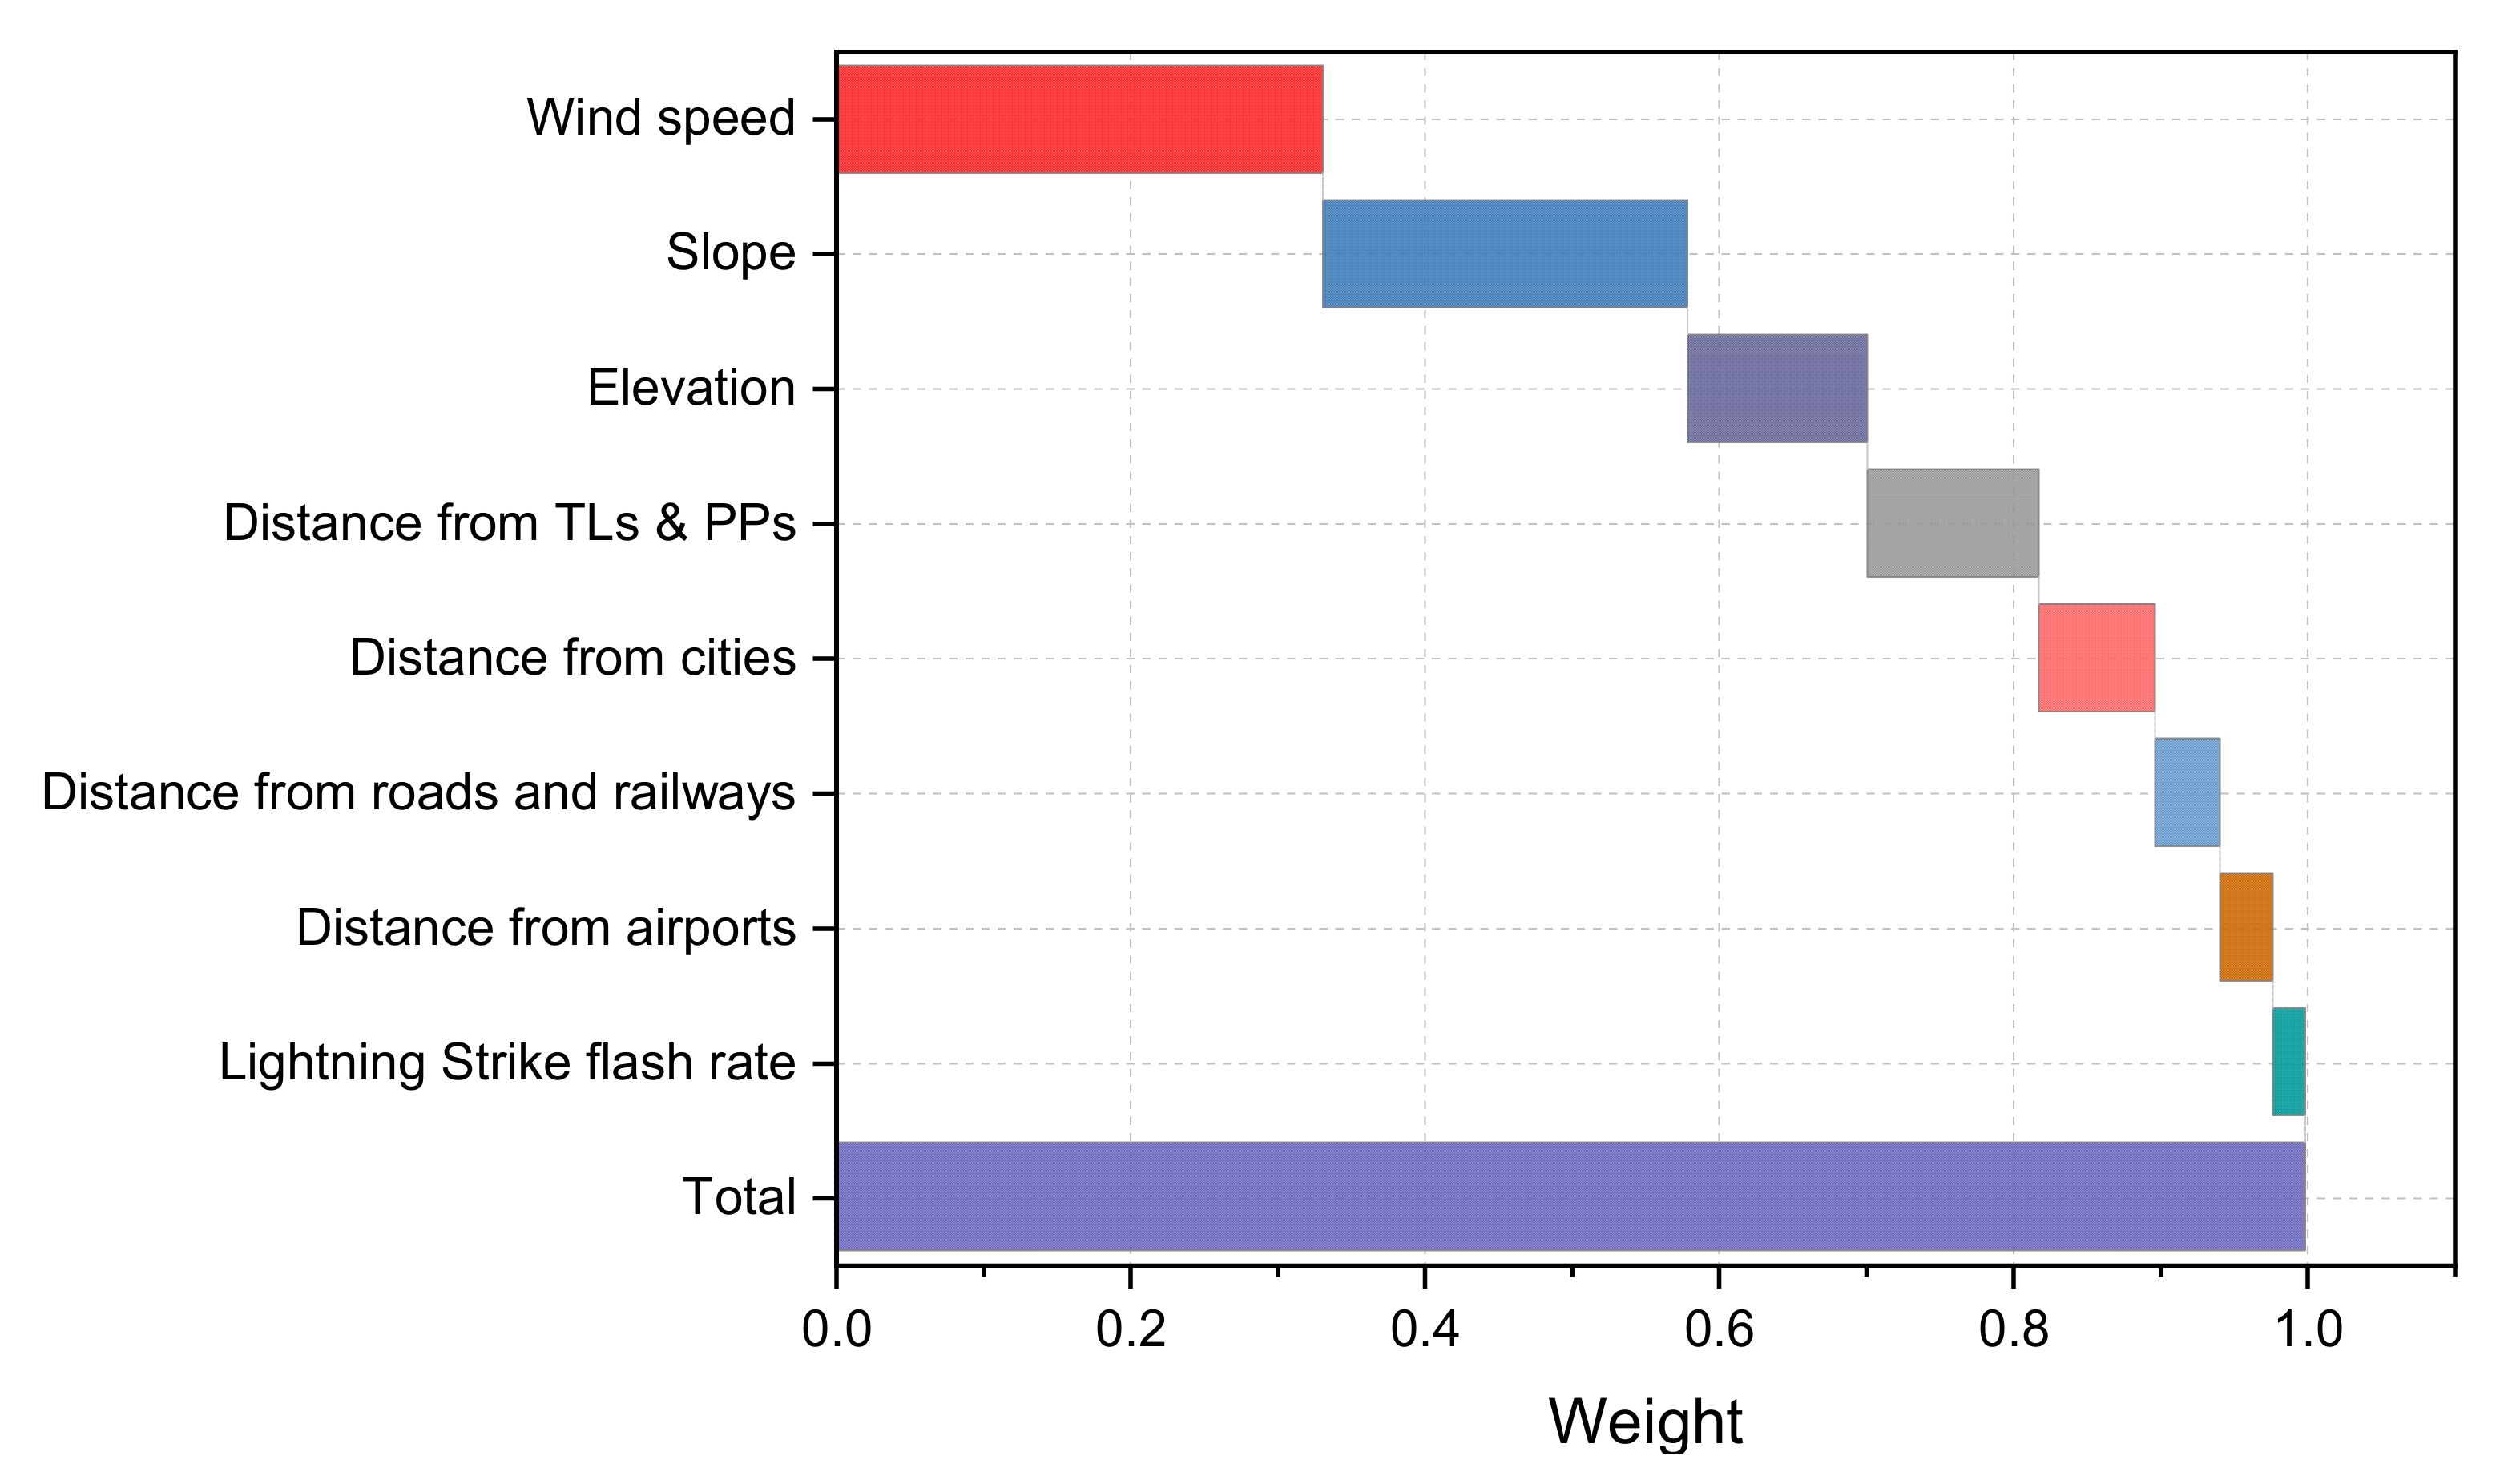
Herein, the findings on the FAHB-GIS aided spatial analysis of wind energy system locations in Sudan are summarized and analyzed. This includes the numerical values of the optimal weight of the evaluation factors and the final suitability map of the feasible sites.

3.1. FAHP Results

In this study, the optimal weights of the eight evaluation criteria factors (C#1: wind speed; C#2: slope; C#3: elevation; C#4: distance from TLs & PPs; C#5: distance from cities; C#6: distance from roads and railways; C#7: distance from airports; C#8: lightning strike flash rate) are obtained using FAHP-based MCDM with the aid of the judgment of three experts. The pairwise comparison matrices extracted from experts’ judgment using a (1–9) point scale are given in Table A1, Table A2 and Table A3 in the Appendix A. These matrices define the importance of each factor to others, which is considered the kick start of the weighting calculations. Before synthesizing the experts’ assessment in the FAHP method, each expert’s consistency ratio (CR) of each pairwise comparison matrix should be tested, as illustrated in the FAHP procedure (step 3). Obviously, the CR value of each pairwise comparison matrices was found below the critical CR as 0.075, 0.054, and 0.077 for experts 1, 2, and 3, respectively. Next, based on the linguistic description of each point scale and its transformation to fuzzy numbers (see Table 5), the assessment of each expert is then converted into a fuzzy environment as indicated in Table 6, Table 7 and Table 8. Finally, the three fuzzy pairwise comparison matrices were aggregated into a single matrix to obtain the final numerical weights of each factor as indicated in Table 9 and visualized in Figure 3.
From the obtained results, the wind speed factor (C#1) had the highest priority weight while deciding on the suitable locations for WT development in Sudan, with a weight percentage of 33.13%. This is followed by the slope (C#2), land elevation (C#3) and distance from TLs and PPs (C#4). Furthermore, distance from cities (C#5) was fourth, and the fifth preferred factor following as distance from roads and railways (C#6). On the other side, distance from airports (C#7) and the lightning strike flash rate (C#8) were the least important factors with seventh and eighth priority rankings, respectively.

3.2. Land Suitability Mapping Results

The overall unsuitability raster map is displayed in Figure 4, revealing the unfavorable zones in the southern part of the Sudanese territory. The outcomes signify that 48.20% of the total land area (893,678.61 km2) is unsuitable for establishing wind farms, while the others have no restrictions and are nominated as possible locations to install wind farms. The major occasions behind this can be demonstrated from the unsuitability map, which reveals that most of these lands are agricultural areas where wind farms cannot be established. Additionally, the wind speed activity is very low (less than 3 m/s) in most southern parts of the country and the western section. The west section of the country also has elevation restrictions since it contains mountains and hills higher than 1 km, and roads and airports buffer restrictions.
Moreover, the southern parts of the White Nile and Sennar provinces have road buffer restrictions that prevent the possibility of a wind farms establishment. The land slope restrictions appear obviously in the northeast of the land since these areas have a slope of 12–15% or above. Finally, following the path of the Nile River and its tributaries, the urban areas’ buffer restrictions can be easily recognized since these areas are considered the most populated places.
In the next step, the evaluation factors were implemented to determine the appropriateness degree of the land for hosting wind farms in Sudan. By considering the statistical data and the frequency distribution of the values, land categories were presented in 6 degrees (very high, high, moderate, low, very low, and unsuitable) according to the boundary values given above in Table 4.
For further demonstration of each layer, Figure 5a describes the wind speed map in which it can be recognized that about 64% of the land area is suitable for establishing wind farms. The previous ratio comprises 4.4% of the land area with a very high wind speed, 25.57% with high wind speed, and 34.41% with moderate wind speed (4–5 m/s). Besides, most unsuitable zones (35.5% of land area) gather south of the country. The land slope is also considered a crucial factor since it can accelerate the wind speed by the venturi effect. Figure 5b shows the slope map in which it can be recognized that nearly the entire land of Sudan (98.6%) is highly suitable for establishing wind farms.
The distance from the TLs map shown in Figure 5c indicates that most of the land area (90.34%) is far from the national grid TLs since most of the populations are concentrated on the banks of the Nile River tributaries. Besides, the map shown in Figure 5d displays the distance from urban areas, which reveal that about 6.09% of the land area is (1–5 km) away from the major cities or urban areas while 8.56% of the area is (5–10 km) away, which considered that as the most suitable places to establish the wind farms. Besides, 16.8% of the land is located (10–20 km) away from the major cities, which is also considered a potential spot for wind energy investments. Moreover, the map reveals that more than half of the land is far from major cities or urban areas since it is more than 30 km away.
The distance from the airports’ map is shown in Figure 5e, which reveals that the majority of the land (85.17%) is very far from the country’s airports with more than 50 km while only a few land zones (about 2.86%) are far from the airport with less than 20 km. The distance from airports is seen from different perspectives by researchers; some see that the distance from airports is essential for the construction and the frequent maintenance of wind farms which will facilitate these purposes and save money and time. On the other hand, some researchers believe that wind farms can produce irretrievable obstacles in navigation, communication, and transmission systems utilized in air travel control and associated with air shipping security. The proximity to roads and railways map is displayed in Figure 5f; about 22.53% of the land area is (0.5–5 km) away from the roads and railways, which is considered a potential spot for establishing wind farms. Besides, about 29% of the land area is (5–20 km) away from the roads and railways, which can also be suitable for wind energy investments, while 48.57% of the land is considered less suitable or unsuitable for establishing wind farms.
Another important factor that has a vital influence on wind farms’ positioning is displayed in Figure 5g, which is the land elevation or the shape of the land and refers to the vertical height of a point above the sea level. From Figure 5g, it can be recognized that more than 50% of the land area is suitable for establishing wind farms since its elevation is less than 0.5 km. Since the western section of the land has an elevation above 1 km, this area is considered low suitable or unsuitable for wind farms locations. Since WTs are considered high installations, they can be directly damaged due to lightning strikes. Thus, Figure 5h indicated the lightning strikes rate map in which it can be noticed that the northern section of the whole land, which represents 40% of the land area, is exposed to the least number of lightning strikes per year while the middle section of the country exposed to a higher number of lightning strikes than the northern part. The southern part of the land, representing 30% of the total land, is exposed to (10–40) lightning strikes per year; thus, the southern section is considered of moderate suitability to establish wind farms.
The output represents the decisive suitability map for wind farms’ locations, as given in Figure 6. Furthermore, the numerical results of each suitability class and its percentages to the total area are tabulated in Table 10.
The outcomes reveal that 8.31% (154,076.12 km2) of the investigated land has very high suitability, 23.22% (430,523.18 km2) has high suitability, 17.28% (320,389.34 km2) with moderate suitability, 2.37% (43,942.28 km2) with low suitability, 0.62% (11,495.45 km2) with very low suitability, against 48.20% (893,678.61 km2) unsuitable for wind farms placement. The high and suitable areas, which represent 31.53% of the total land, would be appraised as contender zones for wind energy projects; thus, investing development and policies should be established for these zones. The suitability map shows that the most suitable zones are located in the northern middle areas of the land, particularly in the Northern and Nile provinces. Additionally, the eastern section of the Red Sea province is considered very suitable for wind farms establishment. Moreover, the capital province (Khartoum) and the Northern Kordofan province contain small suitable areas for wind energy investments. These areas have high suitability since they share a set of considerations that allow the establishment of wind farms such as a perfect land slope and elevation, high wind activity, proximity to the grid TLs, and northern airports, their distant location from the urban and rural settlements, and the low exposure of lightning strikes.
The utilization of the FAHP approach has several advantages over the traditional AHP approach, which was found not efficient in dealing with uncertainty when decision-makers/experts select a scale from a particular basic scale (1 to 9), known as crisp values, for accomplishing their assessments. To signify the uncertainty, decision-makers/experts need more flexible scales by using fuzzy membership functions (represented in the type of the utilized fuzzy numbers) and linguistic variables (e.g., good, very good, poor, very poor) rather than crisp values. Despite that, the traditional AHP method considers data validity with inconsistency limits, the considerable uncertainty, and skepticism in providing an assessment/decision will influence the precision and correctness of the data and the achieved findings. Based on this, the FAHP is utilized. The FAHP procedure sets the AHP scale into the fuzzy triangle scale (or the selected fuzzy numbers) to access priority. Besides, the fuzzy-based methods are used due to the inaccuracy in evaluating the relative importance of criteria and the ratings of alternatives regarding criteria. This inaccuracy may occur due to unquantifiable information, incomplete data, unattainable information, and subjective ignorance. The proposed methodology considers the lightning strikes flash rate, which is a critical criterion that greatly influences the operation and safety of WTs. According to the relevant literature, most studies have seldomly examined the lightning strike flash rate, which exposes wind turbine projects to different kinds of risk. Based on the above, the proposed methodology, which uses the FAHP approach in the GIS environment, offers an efficient and precise way to identify the suitable locations of WTs construction projects.

3.3. Policy Implications

This research is considered a preliminary step towards applying wind energy on several levels in Sudan. The results of this research can be beneficial for the targeted stakeholders, namely the regulatory authority, investors, and individuals [48]. In addition, the work contributes to developing strategic plans for the distribution of wind energy projects on a national level. Additionally, investors can benefit from these results in conducting feasibility studies for renewable energy projects and encouraging to construct them in the areas with high potential energy output. Likewise, community members should be targeted to raise their awareness regarding the importance of clean energy. The economic feasibility study for renewable energy projects is based mainly on the amount of energy produced, and the methodology used in this research allows to select the optimum areas that will be economically feasible through a balance between the construction cost, the cost of energy transfer, the maintenance cost by considering the expected risks and the quantity of energy produced as best as possible. Moreover, the methodology can be further enlarged to assess the suitability mapping for establishing hybrid PV-wind energy projects.

4. Conclusions

The main goal of this work is identifying the suitable locations for wind farms installation in Sudan where no previous research was reported in the existing literature to cover this research gap. This target was achieved by integrating the implementation of the FAHP analysis and the GIS system. Eight criteria were used to assess the optimal sites of wind farms combining economic, social, environmental, and technical aspects. The lightning strike flash rate was considered in the criteria selection, which was seldomly investigated in previous studies despite its significant influences on WT’s safety and operation. The addressed criteria used in the study includes the wind speed, slope, distance from transmission lines and power plants, distance from urban/major cities, distance from airports, elevation, distance from major roads and railways, and lightning strike flash rate. Based on the experts’ opinions and the criteria prioritization, the assessment provided a comprehensive analysis of wind farms’ site suitability.
The spatial analysis indicated that 48.2% of the country areas are unsuitable for wind farms construction. The majority of these sites belonged to the southern part of the country and are unsuitable because of the low potential of wind resources and agriculture areas’ restrictions. On the other side, a total of 51.8% of the country area was found feasible (0.62% a very low, 2.37% is low, 17.28% is moderate, 23.22% is high, and 23.78.314% is very high suitable) for installation of wind farms. Additionally, the results revealed that both the Northern and the Nile’s provinces enjoy an excellent capacity to invest in wind energy projects to cover the current and future electricity needs in Sudan. The obtained findings are expected to reduce the investments, construction time, and resources for developing and implementing wind energy projects in Sudan.
This research faces some limitations, such as using free available data on the internet, some of which have low resolution and cannot be verified due to the lack of field measurements which requires a high cost. In addition, some factors can affect the construction of such projects, such as soil investigations and the paths of migratory birds, for which data could not be obtained. Likewise, a number of points need to be studied, such as the economic feasibility study and its impact on choosing the most appropriate locations. This study is considered a preliminary study for the distribution of renewable energy projects to assist decision-makers in setting future urban development and renewable energy projects plans. Implementing such studies on a smaller scale, such as governorates and cities, can also provide detailed plans for the construction of wind turbine projects. It would be interesting to integrate other renewable energy sources as well, such as photovoltaics with wind energy towards addressing the suitability mapping of hybrid energy systems, which requires addressing new and significant criteria in the applied methodology.

Author Contributions

Conceptualization, Methodology, Data Curation, Original draft preparation, A.S.Z., B.E., K.M.K. and M.R.E.; Revision, Writing—Review & editing Reviewing, Y.H., A.H.A. and R.M.H.A.; Funding acquisition, A.H.A. and R.M.H.A. All authors have read and agreed to the published version of the manuscript.

Funding

This research was funded by Taif University, Researchers Supporting Project grant number (TURSP-2020/252).

Institutional Review Board Statement

Not applicable.

Informed Consent Statement

Not applicable.

Data Availability Statement

Not applicable.

Acknowledgments

The author would like to acknowledge the financial support provided by Taif University Researchers Supporting Project Number (TURSP-2020/252).

Conflicts of Interest

The authors declare no conflict of interest.

Appendix A

Table A1. Pairwise comparison for assessment criteria by expert 1.
CriteriaC#1C#2C#3C#4C#5C#6C#7C#8
C#112347579
C#21/21356777
C#31/31/3113355
C#41/41/5112357
C#51/71/61/31/21357
C#61/51/71/31/31/3113
C#71/71/71/51/51/5114
C#81/91/71/51/71/71/31/41
CR = 0.075.
Table A2. Pairwise comparison for assessment criteria by expert 2.
CriteriaC#1C#2C#3C#4C#5C#6C#7C#8
C#112535377
C#21/21323575
C#31/51/3112453
C#41/31/2112335
C#51/51/31/21/21135
C#61/31/51/41/31114
C#71/71/71/51/31/3112
C#81/71/51/31/51/51/41/21
CR = 0.054.
Table A3. Pairwise comparison for assessment criteria by expert 3.
CriteriaC#1C#2C#3C#4C#5C#6C#7C#8
C#113457859
C#21/31434775
C#31/41/4122635
C#41/51/31/212455
C#51/71/41/21/21247
C#61/81/71/61/41/2113
C#71/51/71/31/51/4113
C#81/91/51/51/51/71/31/31
CR = 0.077.

References

  1. International Energy Agency WEO-2017 Special Report: Energy Access Outlook. Available online: https://www.iea.org/data-and-statistics/data-products (accessed on 27 July 2021).
  2. Elkadeem, M.R.; Wang, S.; Sharshir, S.W.; Atia, E.G. Feasibility analysis and techno-economic design of grid-isolated hybrid renewable energy system for electrification of agriculture and irrigation area: A case study in Dongola, Sudan. Energy Convers. Manag. 2019, 196, 1453–1478. [Google Scholar] [CrossRef]
  3. UNDP. Empowering Sudan: Renewable Energy Addressing Poverty & Development; UNDP: New York, NY, USA, 2020; p. 52. [Google Scholar]
  4. Kotb, K.M.; Elkadeem, M.R.; Elmorshedy, M.F.; Dán, A. Coordinated power management and optimized techno-enviro-economic design of an autonomous hybrid renewable microgrid: A case study in Egypt. Energy Convers. Manag. 2020, 221, 113185. [Google Scholar] [CrossRef]
  5. Ismail, M.M.; Bendary, A.F. Protection of DFIG wind turbine using fuzzy logic control. Alex. Eng. J. 2016, 55, 941–949. [Google Scholar] [CrossRef] [Green Version]
  6. Rehman, S.; Baseer, M.A.; Alhems, L.M. GIS-Based Multi-Criteria Wind Farm Site Selection Methodology. FME Trans. 2020, 48, 855–867. [Google Scholar] [CrossRef]
  7. Latinopoulos, D.; Kechagia, K. A GIS-based multi-criteria evaluation for wind farm site selection. A regional scale application in Greece. Renew. Energy 2015, 78, 550–560. [Google Scholar] [CrossRef]
  8. Jamshed, A.; Saleem, A.A.; Javed, S.; Riffat, M. Site Suitability Analysis for Developing Wind Farms in Pakistan: A GIS-Based Multi-Criteria Modeling Approach. Sci. Technol. Dev. 2018, 37, 195–201. [Google Scholar] [CrossRef]
  9. Elkadeem, M.R.; Younes, A.; Sharshir, S.W.; Campana, P.E.; Wang, S. Sustainable siting and design optimization of hybrid renewable energy system: A geospatial multi-criteria analysis. Appl. Energy 2021, 295, 117071. [Google Scholar] [CrossRef]
  10. Pohekar, S.D.; Ramachandran, M. Application of multi-criteria decision making to sustainable energy planning—A review. Renew. Sustain. Energy Rev. 2004, 8, 365–381. [Google Scholar] [CrossRef]
  11. Triantaphyllou, E. Multi-Criteria Decision Making Methods: A Comparative Study; Springer: Boston, MA, USA, 2000; ISBN 9781441948380. [Google Scholar]
  12. Saaty, R.W. The analytic hierarchy process-what it is and how it is used. Math. Model. 1987, 9, 161–176. [Google Scholar] [CrossRef] [Green Version]
  13. Elkadeem, M.R.; Kotb, K.M.; Ullah, Z.; Atiya, E.G.; Dán, A.; Wang, S. A two-stage multi-attribute analysis method for city-integrated hybrid mini-grid design. Sustain. Cities Soc. 2021, 65, 102603. [Google Scholar] [CrossRef]
  14. Uzar, M.; Şener, Z. Suitable map analysis for wind energy projects using remote sensing and GIS: A case study in Turkey. Environ. Monit. Assess. 2019, 191, 459. [Google Scholar] [CrossRef]
  15. Azizi, A.; Malekmohammadi, B.; Jafari, H.R.; Nasiri, H.; Amini Parsa, V. Land suitability assessment for wind power plant site selection using ANP-DEMATEL in a GIS environment: Case study of Ardabil province, Iran. Environ. Monit. Assess. 2014, 186, 6695–6709. [Google Scholar] [CrossRef] [PubMed]
  16. Gigović, L.; Pamučar, D.; Božanić, D.; Ljubojević, S. Application of the GIS-DANP-MABAC multi-criteria model for selecting the location of wind farms: A case study of Vojvodina, Serbia. Renew. Energy 2017, 103, 501–521. [Google Scholar] [CrossRef]
  17. Sánchez-Lozano, J.M.; García-Cascales, M.S.; Lamata, M.T. Identification and selection of potential sites for onshore wind farms development in region of murcia, Spain. Energy 2014, 73, 311–324. [Google Scholar] [CrossRef]
  18. Wu, Y.; Zhang, J.; Yuan, J.; Geng, S.; Zhang, H. Study of decision framework of offshore wind power station site selection based on ELECTRE-III under intuitionistic fuzzy environment: A case of China. Energy Convers. Manag. 2016, 113, 66–81. [Google Scholar] [CrossRef]
  19. Höfer, T.; Sunak, Y.; Siddique, H.; Madlener, R. Wind farm siting using a spatial Analytic Hierarchy Process approach: A case study of the Städteregion Aachen. Appl. Energy 2016, 163, 222–243. [Google Scholar] [CrossRef]
  20. Tegou, L.I.; Polatidis, H.; Haralambopoulos, D.A. Environmental management framework for wind farm siting: Methodology and case study. J. Environ. Manag. 2010, 91, 2134–2147. [Google Scholar] [CrossRef]
  21. Daneshvar Rouyendegh, B.; Yildizbasi, A.; Arikan, Ü.Z.B. Using Intuitionistic Fuzzy TOPSIS in Site Selection of Wind Power Plants in Turkey. Adv. Fuzzy Syst. 2018, 2018, 6703798. [Google Scholar] [CrossRef]
  22. Ecer, F. An analysis of the factors affecting wind farm site selection through FUCOM subjective weighting method. Pamukkale Univ. J. Eng. Sci. 2021, 27, 24–34. [Google Scholar] [CrossRef]
  23. Ecer, F. Sustainability assessment of existing onshore wind plants in the context of triple bottom line: A best-worst method (BWM) based MCDM framework. Environ. Sci. Pollut. Res. 2021, 28, 19677–19693. [Google Scholar] [CrossRef]
  24. Koc, A.; Turk, S.; Şahin, G. Multi-criteria of wind-solar site selection problem using a GIS-AHP-based approach with an application in Igdir Province/Turkey. Environ. Sci. Pollut. Res. 2019, 26, 32298–32310. [Google Scholar] [CrossRef] [PubMed]
  25. Arı, E.S.; Gencer, C. The use and comparison of a deterministic, a stochastic, and a hybrid multiple-criteria decision-making method for site selection of wind power plants: An application in Turkey. Wind. Eng. 2020, 44, 60–74. [Google Scholar] [CrossRef]
  26. Fadlallah, S.O.; Benhadji Serradj, D.E. Determination of the optimal solar photovoltaic (PV) system for Sudan. Sol. Energy 2020, 208, 800–813. [Google Scholar] [CrossRef]
  27. Elsayed, H.I.; Khadam, A.; Elhassan, O.H. Plans and challenges of the renewable energy in Sudan. In Proceedings of the International Conference on Computer, Control, Electrical, and Electronics Engineering 2019, ICCCEEE 2019, Khartoum, Sudan, 21–23 September 2019; pp. 1–5. [Google Scholar] [CrossRef]
  28. Saeed, T.M.; Tayeb, B.M.; Osman, G. Sustainable energy potential in Sudan. SUST J. Eng. Comput. Sci. 2019, 20, 1–10. [Google Scholar]
  29. Pamucar, D.; Gigovic, L.; Bajic, Z.; Janoševic, M. Location selection for wind farms using GIS multi-criteria hybrid model: An approach based on fuzzy and rough numbers. Sustainability 2017, 9, 1315. [Google Scholar] [CrossRef] [Green Version]
  30. Xu, Y.; Li, Y.; Zheng, L.; Cui, L.; Li, S.; Li, W.; Cai, Y. Site selection of wind farms using GIS and multi-criteria decision making method in Wafangdian, China. Energy 2020, 207, 118222. [Google Scholar] [CrossRef]
  31. Tercan, E. Land suitability assessment for wind farms through best-worst method and GIS in Balıkesir province of Turkey. Sustain. Energy Technol. Assess. 2021, 47, 101491. [Google Scholar] [CrossRef]
  32. Zalhaf, A.S.; Abdel-Salam, M.; Mansour, D.E.A.; Ookawara, S.; Ahmed, M. Assessment of wind turbine transient overvoltages when struck by lightning: Experimental and analytical study. IET Renew. Power Gener. 2019, 13, 1360–1368. [Google Scholar] [CrossRef]
  33. Kotb, K.M.; Elkadeem, M.R.; Khalil, A.; Imam, S.M.; Hamada, M.A.; Sharshir, S.W.; Dán, A. A fuzzy decision-making model for optimal design of solar, wind, diesel-based RO desalination integrating flow-battery and pumped-hydro storage: Case study in Baltim, Egypt. Energy Convers. Manag. 2021, 235, 113962. [Google Scholar] [CrossRef]
  34. Ullah, Z.; Elkadeem, M.R.; Kotb, K.M.; Taha, I.B.M.; Wang, S. Multi-criteria decision-making model for optimal planning of on/off grid hybrid solar, wind, hydro, biomass clean electricity supply. Renew. Energy 2021, 179, 885–910. [Google Scholar] [CrossRef]
  35. Zalhaf, A.S.; Mansour, D.-E.A.; Han, Y.; Yang, P.; Yang, P.; Darwish, M.M.F. Numerical and Experimental Analysis of the Transient Behavior of Wind Turbines when Two Blades are Simultaneously Struck by Lightning. IEEE Trans. Instrum. Meas. 2021, in press. [Google Scholar] [CrossRef]
  36. Zalhaf, A.S.; Abdel-Salam, M.; Mansour, D.-E.A.; Ahmed, M.; Ookawara, S. An Experimental Study of Lightning Overvoltages on a Small-scale Wind Turbine Model. Energy Procedia 2019, 156, 442–446. [Google Scholar] [CrossRef]
  37. Said, R.K.; Murphy, M.J. GLD360 Upgrade: Performance Analysis and Applications. In Proceedings of the 24th International Lightning Detection Conference, San Diego, CA, USA, 18–21 April 2016. [Google Scholar]
  38. Alzouby, A.M.; Nusair, A.A.; Taha, L.M. GIS based Multi Criteria Decision Analysis for analyzing accessibility of the disabled in the Greater Irbid Municipality Area, Irbid, Jordan. Alex. Eng. J. 2019, 58, 689–698. [Google Scholar] [CrossRef]
  39. Liu, Y.; Eckert, C.M.; Earl, C. A review of fuzzy AHP methods for decision-making with subjective judgements. Expert Syst. Appl. 2020, 161, 113738. [Google Scholar] [CrossRef]
  40. Galankashi, M.R.; Helmi, S.A.; Hashemzahi, P. Supplier selection in automobile industry: A mixed balanced scorecard-fuzzy AHP approa ch. Alex. Eng. J. 2016, 55, 93–100. [Google Scholar] [CrossRef] [Green Version]
  41. Abdel Khalek, H.A.; Aziz, R.F.; Abdeen, A.H. Identify and prioritize the major influencing causes of automated concrete mixing system for mega construction projects using analytic hierarchy process. Alex. Eng. J. 2018, 57, 3451–3461. [Google Scholar] [CrossRef]
  42. Torfi, F.; Farahani, R.Z.; Rezapour, S. Fuzzy AHP to determine the relative weights of evaluation criteria and Fuzzy TOPSIS to rank the alternatives. Appl. Soft Comput. J. 2010, 10, 520–528. [Google Scholar] [CrossRef]
  43. Konstantinos, I.; Georgios, T.; Garyfalos, A. A Decision Support System methodology for selecting wind farm installation locations using AHP and TOPSIS: Case study in Eastern Macedonia and Thrace region, Greece. Energy Policy 2019, 132, 232–246. [Google Scholar] [CrossRef]
  44. Giamalaki, M.; Tsoutsos, T. Sustainable siting of solar power installations in Mediterranean using a GIS/AHP approach. Renew. Energy 2019, 141, 64–75. [Google Scholar] [CrossRef]
  45. Ayodele, T.R.; Ogunjuyigbe, A.S.O.; Odigie, O.; Munda, J.L. A multi-criteria GIS based model for wind farm site selection using interval type-2 fuzzy analytic hierarchy process: The case study of Nigeria. Appl. Energy 2018, 228, 1853–1869. [Google Scholar] [CrossRef]
  46. Ali, S.; Taweekun, J.; Techato, K.; Waewsak, J.; Gyawali, S. GIS based site suitability assessment for wind and solar farms in Songkhla, Thailand. Renew. Energy 2019, 132, 1360–1372. [Google Scholar] [CrossRef]
  47. Noorollahi, Y.; Yousefi, H.; Mohammadi, M. Multi-criteria decision support system for wind farm site selection using GIS. Sustain. Energy Technol. Assess. 2016, 13, 38–50. [Google Scholar] [CrossRef]
  48. Atici, K.B.; Simsek, A.B.; Ulucan, A.; Tosun, M.U. A GIS-based Multiple Criteria Decision Analysis approach for wind power plant site selection. Util. Policy 2015, 37, 86–96. [Google Scholar] [CrossRef]
Figure 1. Proposed framework for assessment of suitable sites of wind farms in Sudan.
Sustainability 14 00358 g001
Figure 3. Priority weights of the eight-evaluation factor for site selection of WT.
Sustainability 14 00358 g003
Figure 4. Constraints map of wind farm locations in Sudan.
Sustainability 14 00358 g004
Figure 5. Maps of the evaluation criteria and suitability percentages (a) wind speed, (b) slope, (c) distance from TLs, (d) distance from urban, (e) distance from airports, (f) distance from roads, (g) elevation, and (h) lightning strike flash rate.
Sustainability 14 00358 g005aSustainability 14 00358 g005bSustainability 14 00358 g005c
Figure 6. Final suitability map of wind farms’ locations.
Sustainability 14 00358 g006
Table 2. Collected data maps and sources.
DataTypeResolutionSource
Mean wind speedRaster data9 kmhttps://globalwindatlas.info/ (accessed on 10 November 2021)
Digital elevation modelRaster data90 mhttps://earthdata.nasa.gov/ (accessed on 10 November 2021)
Power Transmission Lines mapVector data--www.openstreetmap.org (accessed on 10 November 2021)
Land Cover map of AfricaRaster data20 mhttps://2016africalandcover20m.esrin.esa.int/
(accessed on 10 November 2021)
Road mapVector data--www.openstreetmap.org/ (accessed on 10 November 2021)
Airport’s location mapVector data--https://data.humdata.org/dataset/global-airports
(accessed on 10 November 2021)
LIS/OTD total flash density mapRaster data55 mhttps://ghrc.nsstc.nasa.gov/pub/lis/climatology/LIS-OTD/HRFC/
(accessed on 10 November 2021)
Table 3. Threshold/Buffer values of constraint factors to identify exclusion areas.
No.Constraint FactorValueRef.Area Ratio in Sudan
1Wind speed<3 m/s[43]7.93%
2Slope>15%[30]0.22%
3Elevation>1.25 km[44]0.43%
4TLs and PG<0.5 km [45]0.28%
5Urban/Major cities<1 km[46]1.43%
6Airports<3 km [16]0.07%
7Major roads and railways<0.5 km[47]5.45%
8Lightning strike>80 fl.km−2y−1[37]0%
Table 4. Suitability classes and weights of each selected evaluation factor.
Evaluation FactorSuitability ClassScoreRangeArea Ratio
in Sudan %
Wind Speed (m/s)Very low13–3.512.99
Low23.5–414.69
Moderate34–534.41
High45–625.57
Very high5>64.40
Slope (%)Very low112–150.16
Low29–120.31
Moderate36–90.17
High43–60.55
Very high5>698.60
Distance from transmission lines and power grid (km)Very low150–10078.26
Low220–5011.80
Moderate310–204.73
High45–102.51
Very high50.5–52.41
Distance from Urban/Major cities (km)Very low130–5054.46
Low220–3012.63
Moderate310–2016.83
High45–108.56
Very high51–56.09
Distance from airports (km)Very low150–10085.17
Low220–5011.90
Moderate310–202.17
High45–100.57
Very high53–50.12
Elevation (km)Very low11–1.252.08
Low20.75–19.07
Moderate30.5–0.7536.71
High40.25–0.549.34
Very high50–0.252.36
Distance from major roads and railways (km)Very low150–10021.19
Low220–5021.93
Moderate310–2015.77
High45–1013.13
Very high50.5–522.53
Lightning Strike flash rate (fl.km−2y−1)Very low180–1000
Low240–800
Moderate310–4030
High42.5–1030
Very high50.625–2.540
Table 5. Description of the (1–9) point scale and their fuzzy transformation.
Point ScaleLinguistic DescriptionTriangular Fuzzy Number
1Equally strong(1,1,1)
2Intermediate(1,2,3)
3Moderately strong(2,3,4)
4Intermediate(3,4,5)
5Strong(4,5,6)
6Intermediate(5,6,7)
7Very strong(6,7,8)
8Intermediate(7,8,9)
9Extremely strong(9,9,9)
Table 6. The fuzzy pair-wise comparison matrix of expert-1.
CriteriaC#1C#2C#3C#4C#5C#6C#7C#8
C#1(1.0,1.0,1.0)(1.0,2.0,3.0)(2.0,3.0,4.0)(3.0,4.0,5.0)(6.0,7.0,8.0)(4.0,5.0,6.0)(6.0,7.0,8.)(9.0,9.0,9.0)
C#2(0.333,0.5,1.0)(1.0,1.0,1.0)(2.0,3.0,4.0)(4.0,5.0,6.0)(5.0,6.0,7.0)(6.0,7.0,8.0)(6.0,7.0,8.0)(6.0,7.0,8.0)
C#3(0.25,0.333,0.5)(0.25,0.333,0.5)(1.0,1.0,1.0)(1.0,1.0,1.0)(2.0,3.0,4.0)(2.0,3.0,4.0)(4.0,5.0,6.0)(4.0,5.0,6.0)
C#4(0.2,0.25,0.333)(0.167,0.2,0.25)(1.0,1.0,1.0)(1.0,1.0,1.0)(1.0,2.0,3.0)(2.0,3.0,4.0)(4.0,5.0,6.0)(6.0,7.0,8.0)
C#5(0.125,0.143,0.167)(0.143,0.167,0.2)(0.25,0.333,0.5)(0.333,0.5,1.0)(1.0,1.0,1.0)(2.0,3.0,4.0)(4.0,5.0,6.0)(6.0,7.0,8.0)
C#6(0.167,0.2,0.25)(0.125,0.143,0.167)(0.25,0.333,0.5)(0.25,0.333,0.5)(0.25,0.333,0.5)(1.0,1.0,1.0)(1.0,1.0,1.0)(2.0,3.0,4.0)
C#7(0.125,0.143,0.167)(0.125,0.143,0.167)(0.167,0.2,0.25)(0.167,0.2,0.25)(0.167,0.2,0.25)(1.0,1.0,1.0)(1.0,1.0,1.0)(3.0,4.0,5.0)
C#8(0.111,0.111,0.111)(0.125,0.143,0.167)(0.167,0.2,0.25)(0.125,0.143,0.167)(0.125,0.143,0.16)(0.25,0.333,0.5)(0.2,0.25,0.333)(1.0,1.0,1.0)
Table 7. The fuzzy pair-wise comparison matrix of expert-2.
CriteriaC#1C#2C#3C#4C#5C#6C#7C#8
C#1(1.0,1.0,1.0)(1.0,2.0,3.0)(4.0,5.0,6.0)(2.0,3.0,4.0)(4.0,5.0,6.0)(2.0,3.0,4.0)(6.0,7.0,8.0)(6.0,7.0,8.0)
C#2(0.333,0.5,1.0)(1.0,1.0,1.0)(2.0,3.0,4.0)(1.0,2.0,3.0)(2.0,3.0,4.0)(4.0,5.0,6.0)(6.0,7.0,8.0)(4.0,5.0,6.0)
C#3(0.167,0.2,0.25)(0.25,0.333,0.5)(1.0,1.0,1.0)(1.0,1.0,1.0)(1.0,2.0,3.0)(3.0,4.0,5.0)(4.0,5.0,6.0)(2.0,3.0,4.0)
C#4(0.25,0.333,0.5)(0.333,0.5,1.0)(1.0,1.0,1.0)(1.0,1.0,1.0)(1.0,2.0,3.0)(2.0,3.0,4.0)(2.0,3.0,4.0)(4.0,5.0,6.0)
C#5(0.167,0.2,0.25)(0.25,0.333,0.5)(0.333,0.5,1.0)(0.333,0.5,1.0)(1.0,1.0,1.0)(1.0,1.0,1.0)(2.0,3.0,4.0)(4.0,5.0,6.0)
C#6(0.25,0.333,0.5)(0.167,0.2,0.25)(0.2,0.25,0.333)(0.25,0.333,0.5)(1.0,1.0,1.0)(1.0,1.0,1.0)(1.0,1.0,1.0)(3.0,4.0,5.0)
C#7(0.125,0.143,0.167)(0.125,0.143,0.167)(0.167,0.2,0.25)(0.25,0.333,0.5)(0.25,0.333,0.5)(1.0,1.0,1.0)(1.0,1.0,1.0)(1.0,2.0,3.0)
C#8(0.125,0.143,0.167)(0.167,0.2,0.25)(0.25,0.333,0.5)(0.167,0.2,0.25)(0.167,0.2,0.25)(0.2,0.25,0.333)(0.333,0.5,1.0)(1.0,1.0,1.0)
Table 8. The fuzzy pair-wise comparison matrix of expert-3.
CriteriaC#1C#2C#3C#4C#5C#6C#7C#8
C#1(1.0,1.0,1.0)(2.0,3.0,4.0)(3.0,4.0,5.0)(4.0,5.0,6.0)(6.0,7.0,8.0)(7.0,8.0,9.0)(4.0,5.0,6.0)(9.0,9.0,9.0)
C#2(0.25,0.333,0.5)(1.0,1.0,1.0)(3.0,4.0,5.0)(2.0,3.0,4.0)(3.0,4.0,5.0)(6.0,7.0,8.0)(6.0,7.0,8.0)(4.0,5.0,6.0)
C#3(0.2,0.25,0.333)(0.2,0.25,0.333)(1.0,1.0,1.0)(1.0,2.0,3.0)(1.0,2.0,3.0)(5.0,6.0,7.0)(2.0,3.0,4.0)(4.0,5.0,6.0)
C#4(0.167,0.2,0.25)(0.25,0.333,0.5)(0.333,0.5,1.0)(1.0,1.0,1.0)(1.0,2.0,3.0)(3.0,4.0,5.0)(4.0,5.0,6.0)(4.0,5.0,6.0)
C#5(0.125,0.143,0.167)(0.2,0.25,0.333)(0.333,0.5,1.0)(0.333,0.5,1.0)(1.0,1.0,1.0)(1.0,2.0,3.0)(3.0,4.0,5.0)(6.0,7.0,8.0)
C#6(0.111,0.125,0.143)(0.125,0.143,0.167)(0.143,0.167,0.2)(0.2,0.25,0.333)(0.333,0.5,1.0)(1.0,1.0,1.0)(1.0,1.0,1.0)(2.0,3.0,4.0)
C#7(0.167,0.2,0.25)(0.125,0.143,0.167)(0.25,0.333,0.5)(0.167,0.2,0.25)(0.2,0.25,0.333)(1.0,1.0,1.0)(1.0,1.0,1.0)(2.0,3.0,4.0)
C#8(0.111,0.111,0.111)(0.167,0.2,0.25)(0.167,0.2,0.25)(0.167,0.2,0.25)(0.125,0.143,0.167)(0.25,0.333,0.5)(0.25,0.333,0.5)(1.0,1.0,1.0)
Table 9. The aggregated fuzzy pairwise comparison matrix of all experts and criteria weights.
CriteriaC#1C#2C#3C#4C#5C#6C#7C#8Weight
C#1(1.0,1.0,1.0)(1.26,2.289,3.302)(2.884,3.915,4.932)(2.884,3.915,4.932)(5.241,6.257,7.268)(3.826,4.932,6.0)(5.241,6.257,7.268)(7.862,8.277,8.653)0.331350632
C#2(0.303,0.437,0.794)(1.0,1.0,1.0)(2.289,3.302,4.309)(2.0,3.107,4.16)(3.107,4.16,5.192)(5.241,6.257,7.268)(6.0,7.0,8.0)(4.579,5.593,6.604)0.248247216
C#3(0.203,0.255,0.347)(0.232,0.303,0.437)(1.0,1.0,1.0)(1.0,1.26,1.442)(1.26,2.289,3.302)(3.107,4.16,5.192)(3.175,4.217,5.241)(3.175,4.217,5.241)0.122391656
C#4(0.203,0.255,0.347)(0.24,0.322,0.5)(0.693,0.794,1.0)(1.0,1.0,1.0)(1.0,2.0,3.0)(2.289,3.302,4.309)(3.175,4.217,5.241)(4.579,5.593,6.604)0.11661812
C#5(0.138,0.16,0.191)(0.193,0.24,0.322)(0.303,0.437,0.794)(0.333,0.5,1.0)(1.0,1.0,1.0)(1.26,1.817,2.289)(2.884,3.915,4.932)(5.241,6.257,7.268)0.079234519
C#6(0.167,0.203,0.261)(0.138,0.16,0.191)(0.193,0.24,0.322)(0.232,0.303,0.437)(0.437,0.55,0.794)(1.0,1.0,1.0)(1.0,1.0,1.0)(2.289,3.302,4.309)0.044137266
C#7(0.138,0.16,0.191)(0.125,0.143,0.167)(0.191,0.237,0.315)(0.191,0.237,0.315)(0.203,0.255,0.347)(1.0,1.0,1.0)(1.0,1.0,1.0)(1.817,2.884,3.915)0.036096026
C#8(0.116,0.121,0.127)(0.151,0.179,0.218)(0.191,0.237,0.315)(0.151,0.179,0.218)(0.138,0.16,0.191)(0.232,0.303,0.437)(0.255,0.347,0.55)(1.0,1.0,1.0)0.021924565
Table 10. Areas of each suitability class and their percentages to the total land area of Sudan.
ClassMap ColourArea (km2)Percentage (%)
UnsuitableGray893,678.6148.20
Very LowRed11,495.450.62
LowOrange43,942.282.37
ModerateYellow320,389.3417.28
HighLight green430,523.1823.22
Very HighDark Green154,076.128.31
Publisher’s Note: MDPI stays neutral with regard to jurisdictional claims in published maps and institutional affiliations.

