Article

Behavior of Steel Fiber Reinforced Concrete Panels under Surface Pressure

Department of Civil Engineering, Pamukkale University, Denizli 20160, Turkey
*
Author to whom correspondence should be addressed.
Sustainability 2022, 14(1), 298; https://doi.org/10.3390/su14010298
Submission received: 3 November 2021 / Revised: 14 December 2021 / Accepted: 20 December 2021 / Published: 28 December 2021
(This article belongs to the Special Issue Sustainability of Retrofit Actions in Great Buildings)

Abstract

:
In this study, it is aimed to investigate the importance of the affecting parameters on the pressure–displacement relationship of steel fiber reinforced concrete panels. Among these parameters, panel thickness, panel dimensions, material type, and boundary conditions of the panels are the parameters that were examined. In this context, the effects of surface pressure on the steel fiber reinforced concrete panels were investigated. It was observed that as the thickness and the fiber ratio increased, the ultimate bearing capacity increased. It was determined that it may not be enough to support the panels only at the corner points, and intermediate supports are needed. As the support spacing decreased, the absorbed surface pressure increased. In addition, it was concluded that the increase in the amount of steel fiber in the concrete material increased the strength, deflection, and ductility values.

1. Introduction

Concrete is the most preferred building material due to its durability, fire resistance, water resistance, economical production, energy efficiency, and on-site manufacturing. The researchers tried to eliminate and/or reduce the negative features of concrete (among which the most important is lower tensile strength) with some developments. One of these developments is the addition of fibers to the concrete mixture.
Fibers may consist of metallic, polymeric, mineral, or natural materials. The most important factors affecting the properties of concrete with fiber are the slenderness ratio, the amount of fiber, the homogeneous distribution of the fiber in the concrete matrix, the type and geometry of the fiber. It was presented in the literature that the effect of steel fiber on the modulus of elasticity, flexural strength, and fracture toughness of concrete is highly significant. The fiber amount, distribution, and orientation increase the shear and the load-deformation capacity of steel fiber reinforced members [1,2,3,4,5,6,7,8,9,10,11]. Smaller crack openings were observed with steel fiber reinforcement [12,13,14]. Analytical models were proposed to generate both the ascending and descending parts of the stress–strain curve of steel fiber reinforced concrete [15,16,17]. In studies examining the difference between fiber reinforced concrete mixed by adding different fiber types (amorphous metallic, polypropylene, synthetic, etc.) and normal concrete, the energy absorption, bearing capacity, and deflection capabilities were investigated [7,18,19,20]. In an optimization study, an optimum mix design was obtained for steel fiber reinforced concrete slabs, maximizing slab durability, and minimizing mixing costs, creating the optimum aspect ratio and volume fraction [21]. One of the most critical points in steel fiber reinforced concrete (SFRC) theory is measuring residual stresses. Due to the interaction of the fibers with the concrete, a cracked section can bear a significant portion of the tensile stresses, called residual stresses [22]. The ultimate shear capacity of the fiber reinforced concrete beams also differs from regular reinforced and non-reinforced concrete beams. Hence, ultimate shear capacity of the fiber reinforced concrete beams was also a point of investigation. While developing estimation tools, it was showed that soft-computing tools can also be used. Results of the investigations by using soft-computing tools (hybrid machine learning algorithms that combine neural networks with two distinct optimization techniques) showed that the web width, effective depth, and a clear depth ratio were the most important parameters in modeling the shear capacity of steel fiber-reinforced concrete beams [23].
In recent years, steel fiber concretes have been widely used in repair and reinforcement works, airports and ports, dam constructions, concrete conduit pipes, tunnels, slope stability studies and explosion-proof structures, due to their positive contribution to bearing capacity and high energy absorption capacity. In the studies, it was stated that the positive effects of steel fibers on the mechanical properties of concrete, when compared with normal concrete, will also provide safety against burst loads [10,24,25,26,27,28]. In some studies, the behavior of concrete elements was investigated by firing a hard bullet at concrete targets with a launcher for the simulation of concrete targets exposed to impact loading [29,30]. Protecting critical infrastructures from bomb attacks requires more attention. An effective solution to reduce this effect is to protect them with a foam material coating that can absorb a very high explosion energy [31]. Studies in the literature showed that the explosive load mass and the safety distance have a great effect on the response of the reinforced concrete panels, the maximum displacement in the middle of the panel is greatly affected by the choice of the explosive load mass and the safety distance, and the bending of the reinforced concrete panel can also be reduced by increasing the panel thickness and reinforcement ratio [32]. In order to retrofit and strengthen the existing members, some researchers also focused on jacketing applications. High strength steel fiber reinforced concrete (HSFC) and ultra-high strength steel fiber reinforced concrete (UHSFC) jackets were experimentally proven to be much more effective than other reinforcement schemes in improving the performance of existing reinforced concrete structural members. In a study, an existing analytical model for the estimation of shear capacity of RC beam-column connections reinforced with HSFC or UHSFC jacket was extended to provide the design formulation of these innovative HSFC and UHSFC jackets. The design and application of the proposed fiber-reinforced concrete jackets in deficient existing RC beam–column joints provide a sustainable strengthening technique by contributing to a reduction in the cost and labor-intensive construction requirements of common jackets by completely replacing the installation of reinforcement [33]. Although some researchers focused on using FRC in jacketing and retrofit applications of existing members, the focus of the presented research is aimed at steel fiber reinforced concrete behavior.
The review on the literature showed that while there are numerous studies on SFRC beams, there are only a few either experimental or numerical studies on SFRC panels; however, there are not any studies on panels subjected to surface pressure (out of plane loading). Hence, in this presented study, it was aimed to investigate the importance of the affecting parameters on the pressure–displacement relationship of steel fiber reinforced concrete panels. After the material model was developed in accordance with the RILEM recommendations (which is based on residual flexural tensile strength parameters of beams that are subjected to three-point loading), the experimental study from the literature was used in order to validate the model. In the reference study, SFRC panels (with two different steel fiber ratios) in 600 mm × 600 mm dimensions and having a thickness of 100 mm were subjected to a point load at mid-span, and mid-span deflections were measured. Since a moderate validation was obtained, the parametric study was conducted with regard to the characteristics of reference study and by applying variations in thickness, boundary conditions, and aspect ratios (by keeping one dimension of the panel constant and changing the other dimension).

2. Materials and Methods

In order to estimate the behavior of a structural member, first the material behavior needs to be clearly defined. Within the scope of the presented study, first design codes and guidelines were examined to establish the stress–strain behavior of steel fiber reinforced concrete. Since establishing the stress–strain behavior depends on some material characteristics, the experimental results that already took place in the literature were also considered together with material test recommendations. After determination of main characteristic parameters, the compression and tension behavior models were obtained. Finally, the sensitivity of established analytical model was checked by making comparisons with the experimental studies from the literature.
As one of the most commonly used design guides, ACI-544.4R-18 (Guide to Design with Fiber-Reinforced Concrete) defines flexural performance of steel fiber reinforced concrete. Figure 1 shows the flexural stress–strain curves for fiber reinforced concrete with two different dosages of steel fibers. The dotted line, which corresponds to the unreinforced concrete, shows a brittle failure right after ultimate bearing capacity is reached. The green line corresponds to FRC with relatively low fiber dosage; there is no such brittle failure, but right after the first crack occurs, the load-carrying capacity is gradually decreased (softening behavior). The blue line represents the behavior of FRC with relatively high fiber dosage; after the cracking load is reached, concrete will sustain the loads, and fibers make it possible to carry increasing loads (hardening branch) until a maximum stress value (ultimate load) is reached in the post-peak region, which is higher than the cracking load of concrete. After that, load-carrying capacity gradually decreases (final softening branch). Because of the contribution of fibers, the material is capable of absorbing a great deal of additional deformation energy (shadowed region under the curve) compared to its unreinforced counterpart [34]. Concrete is a brittle material with low tensile strength and low tensile strain capacity. It is the numerous micro-cracks in the structure of the concrete that provide this brittleness. These micro-cracks, which are formed in the concrete due to segregation, expansion, and thermal effects, are dispersed in the concrete and are generally collected at the aggregate–cement matrix interface. The main reason for the accumulation of microcracks in this region is the difference in stiffness between the cementitious matrix and the aggregates. Aggregate is the material with the highest modulus of elasticity in concrete. This stiffness difference makes the aggregate and cement-matrix interface a weak zone. Microcracks formed here grow and spread with the effect of stresses. Brittle cementitious materials collapse as a result of this sudden crack growth. With the addition of steel fibers, the propagation of these cracks is stopped. In this way, even if cracks occur and expand in the concrete matrix surrounding the fibers, stress transfer in the composite continues over the fibers. In this way, the toughness of the material that gains ductility increases.
It is a major fact that the flexural behavior of fiber reinforced concrete is related with tensile behavior, which changes with the fiber dosage, the bond between fibers and the concrete. It is observed that numerous experimental studies were conducted to determine the stress–strain curve of FRC in direct tension; however, there is no standard test method that is recognized by ASTM. The idealized tensile stress–strain diagram of RILEM TC 162-TDF (2003) (which is shown in Figure 2) was used in this presented study. The values that define this constitutive model are based on average or characteristic values that are, in turn, used in the design process. The key points of the compression side of the diagram are obtained directly from the standard compressive cylinder test. For the tension side of the diagram, the key points can be indirectly obtained from a three-point flexural test [34].
Here, σ1 and ε1 are the tensile stress and related deformation at the beginning of the first cracking; σ2 and ε2 show the stress and strain at the beginning of the softening branch, and σ3 and ε3 show the stress and strain at the end of the softening branch. The values of these key parameters can be calculated with regarding the RILEM [35] as presented in Table 1.
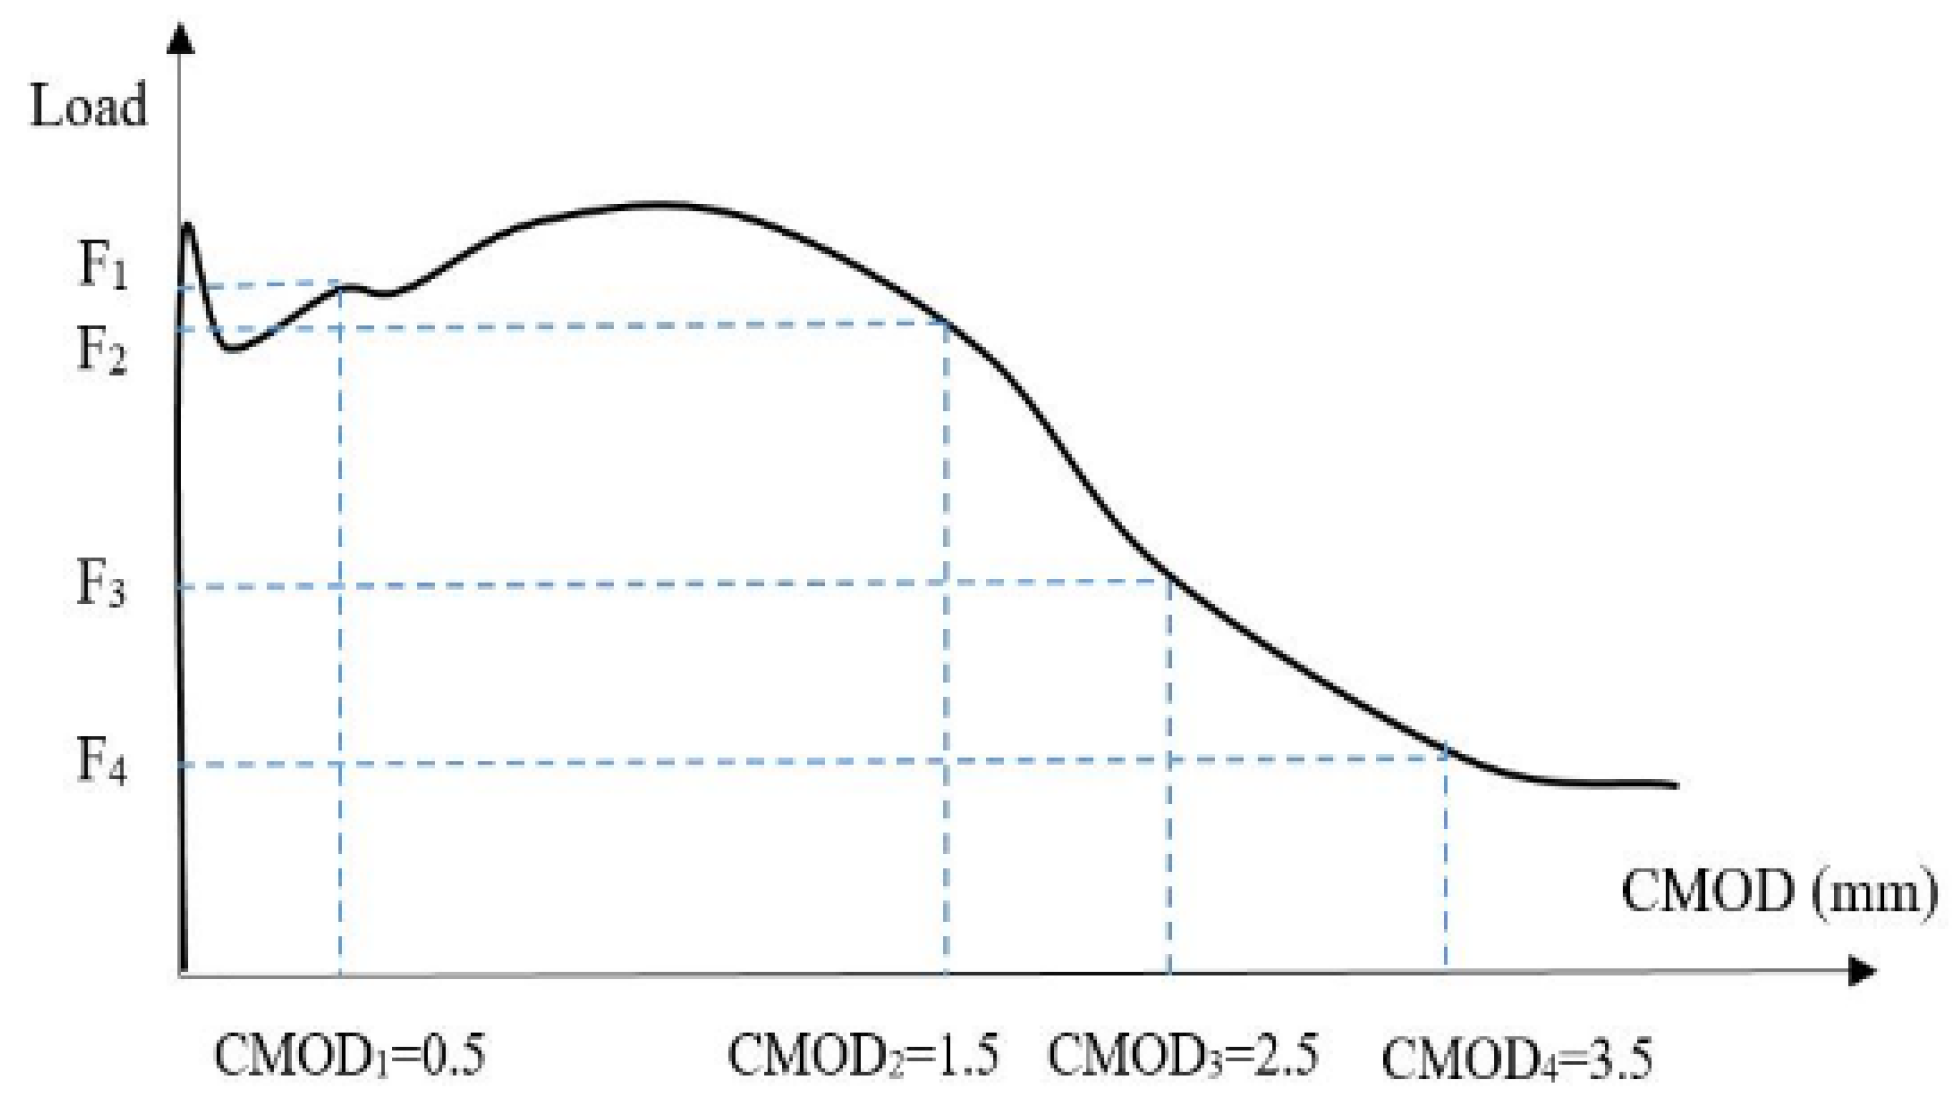
The FRC design can be performed by using the moment–crack width relationship that can be obtained from BS EN 14651:2005 test on notched beams. By using Model Code 2010 (fib 2013) design guidelines summarized herein [34], the nominal characteristics can be determined. In order to determine the nominal characteristics, three-point flexure test on a notched beam according to EN 14, 651 can be used. The diagram of the applied force (F) versus the deformation is shown in Figure 3. According to the EN14651, the deformations are expressed in terms of Crack Mouth Opening Displacement (CMOD). The Model Code 2010 defines the residual flexural tensile strength parameters, fRj, in accordance with the defined F-CMOD relationship [36].
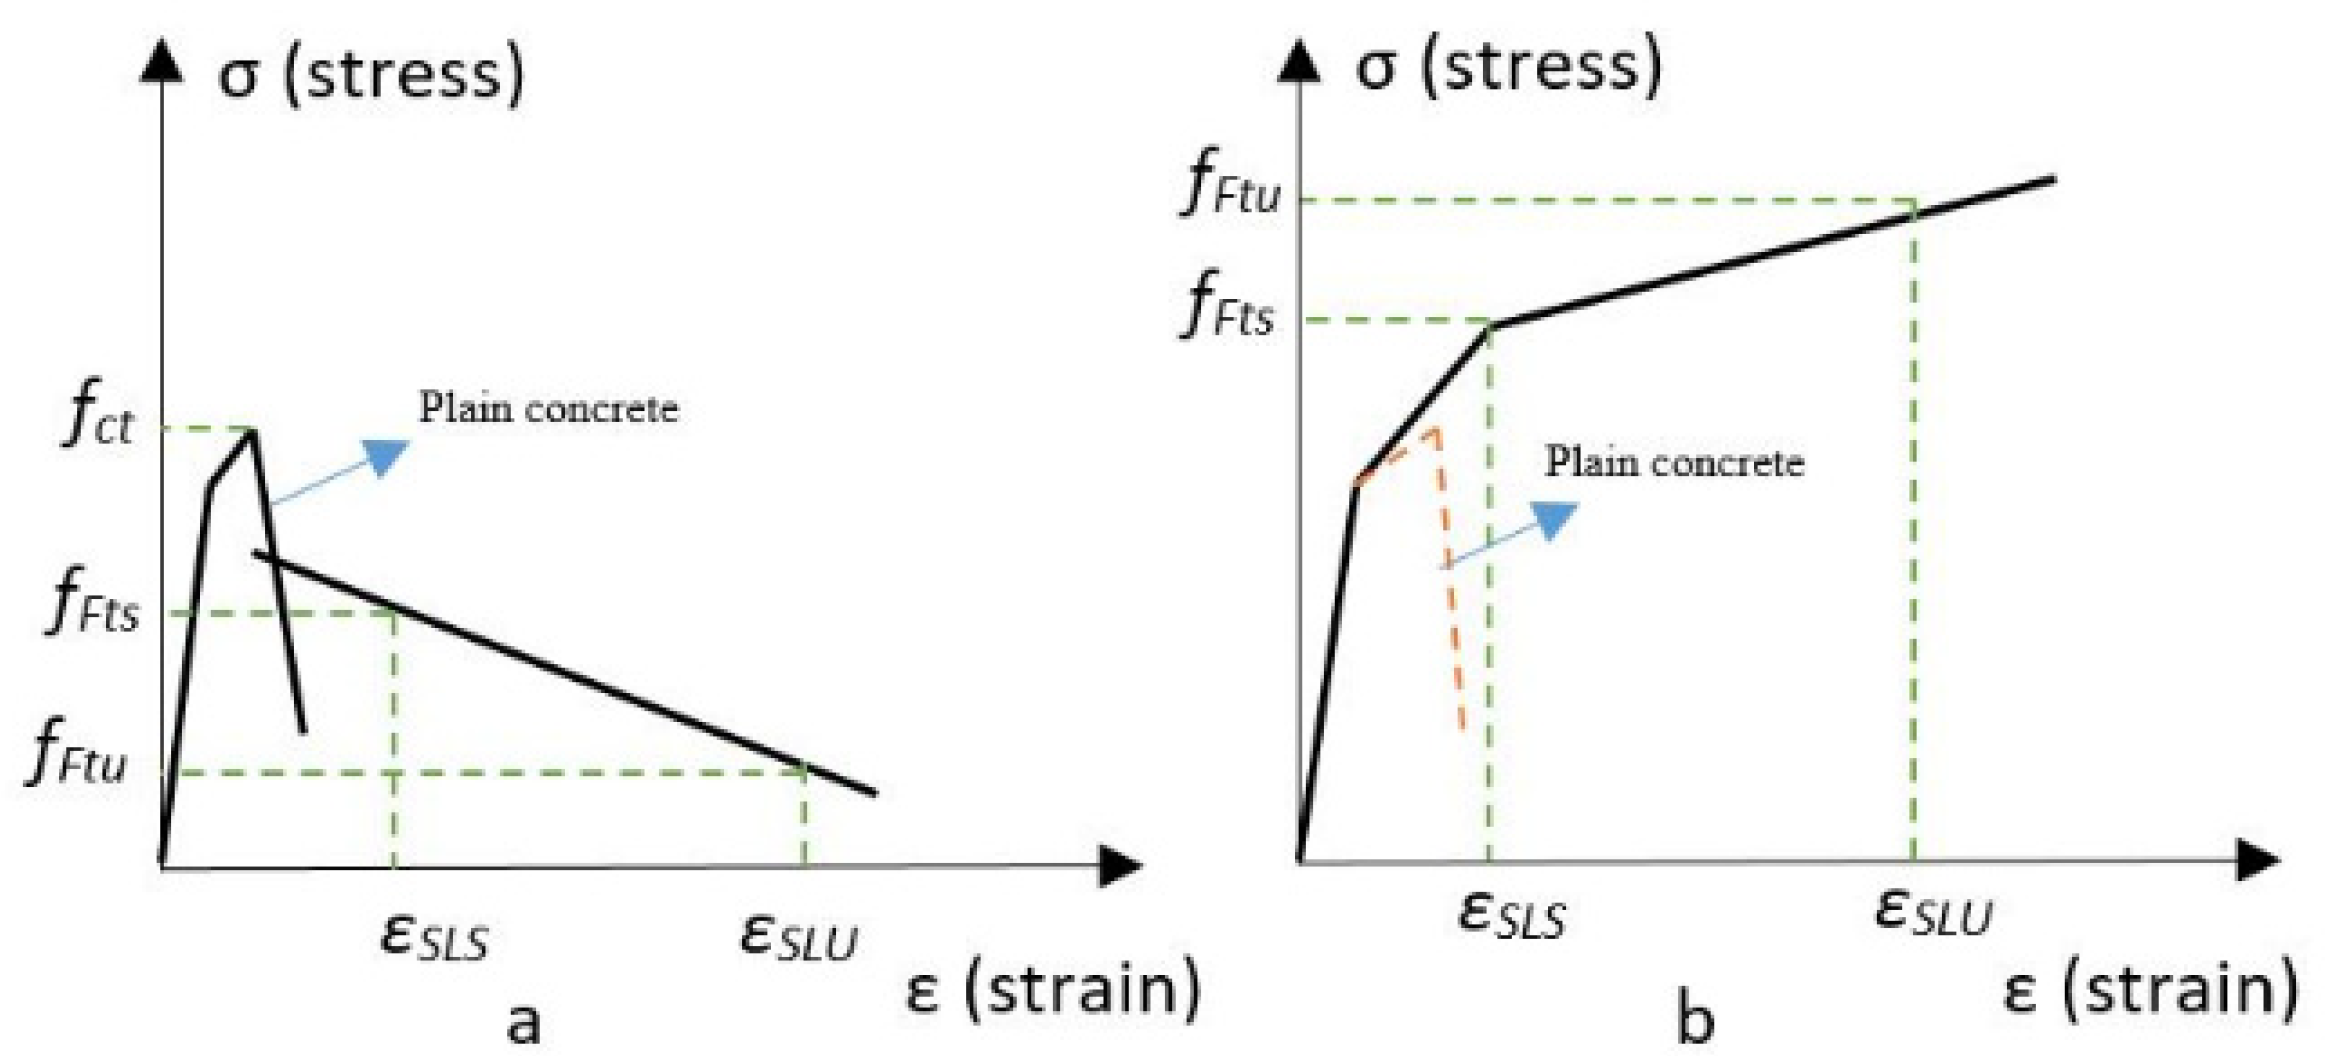
The following two simplified stress–crack opening constitutive laws may be deduced from the following bending test results: a plastic rigid behavior, or a linear post cracking behavior (hardening or softening) as schematically shown in Figure 4, where fFts represents the serviceability residual strength, defined as the post-cracking strength for serviceability crack openings, and fFtu represents the ultimate residual strength [36].
The rigid-plastic model identifies a unique reference value, fFtu, based on the ultimate behavior. Such a value is determined as:
f F t u = f R 3 3
The linear model identifies two reference values, fFts and fFtu. They have to be defined through residual values of flexural strength by using the following equations:
f F t s = 0.45 f R 1
f F t u = f F t s w u C M O D 3 ( f F t s 0.5 f R 3 + 0.2 f R 1 ) 0
For the SLS (serviceability limit state) the same constitutive relationship adopted for plain concrete in uniaxial tension is used up to the peak strength fct (Figure 5). In the post-cracking stage, a bilinear relation applies. For softening material, the residual strength (second branch) is defined by two points corresponding to (εSLS, fFtsd) and (εULS, fFtud) where:
ε S L S = C M O D 1 / l c s
ε U L S = w u / l c s = min ( f F u , 2.5 / l c s = 2.5 / y ) C M O D 1 / l c s
The second branch suggested in the pre-peak constitutive relationship corresponds to that for plain concrete until an intersection between the residual post-cracking behavior and the unstable crack propagation branch for plain concrete is available [36].
According to the fib-supported experimental and parametric study that was conducted [37], the characteristics of the material model can be calculated using the equations given in Table 2 in order to be substituted in the equations given in the design guides and test method.
In order to conduct a finite element analysis, a well-developed material model is required. There are numerous presented material models that already took place in the literature. In order provide consistency the material model that was defined in RILEM was used [35]. The SFRC material model (Figure 6) of RILEM is based on residual flexural tensile strength parameters of beams that are subjected to three-point loading; however, estimations of residual flexural tensile strength parameters with regarding the material characteristics are not defined in RILEM. Hence, in order to estimate the residual flexural tensile strength parameters, a recommended methodology in the literature was followed [
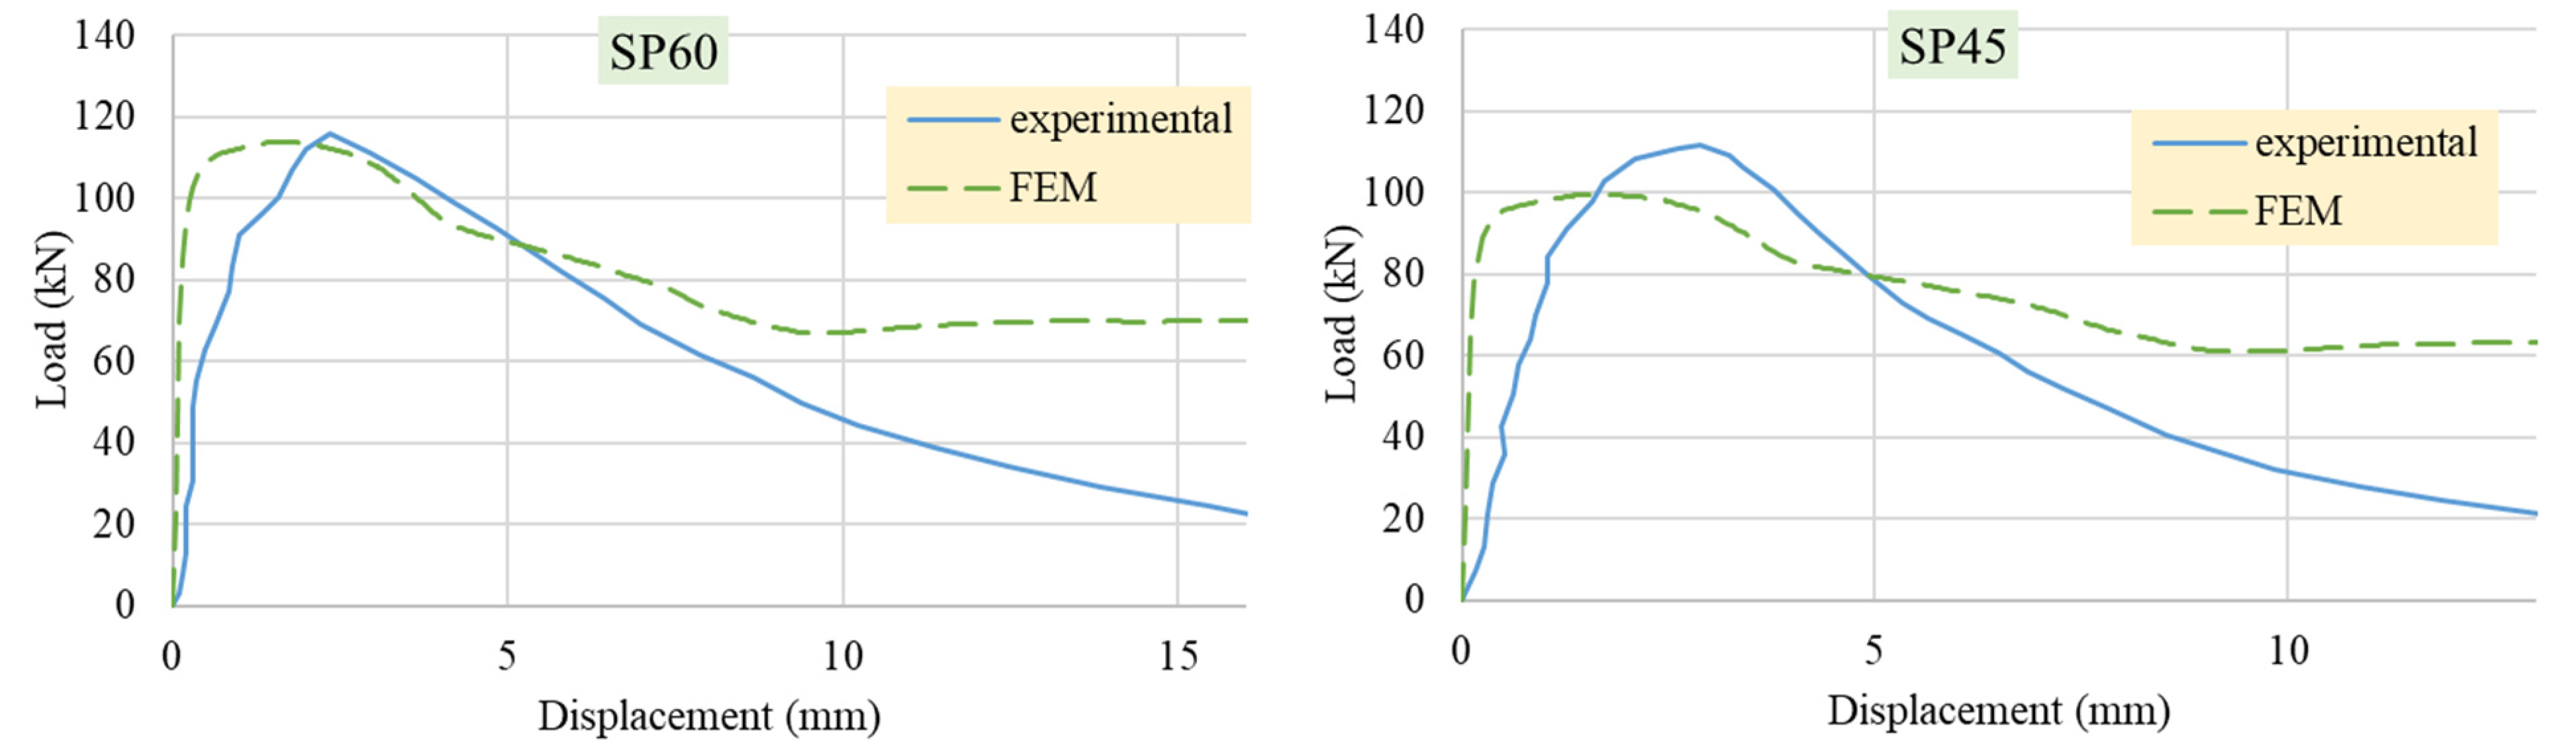
37]. There are only a few either experimental or numerical studies on SFRC panels; however, there are not any studies on panels subjected to surface pressure (out of plane loading). Hence, after the material model was developed, the experimental study from the literature was used in order to validate the model. In the reference study SFRC panels (with two different steel fiber ratios, Table 3) in 600 × 600 mm dimensions and having a thickness of 100 mm were subjected to a point load at mid-span and deflections were measured. Since a moderate validation was obtained, the parametric study was conducted with regarding the characteristics of reference study (Table 4) and by applying variations in thickness, boundary conditions, and aspect ratios (by keeping one dimension of the panel constant and changing the other dimension). The established material model (
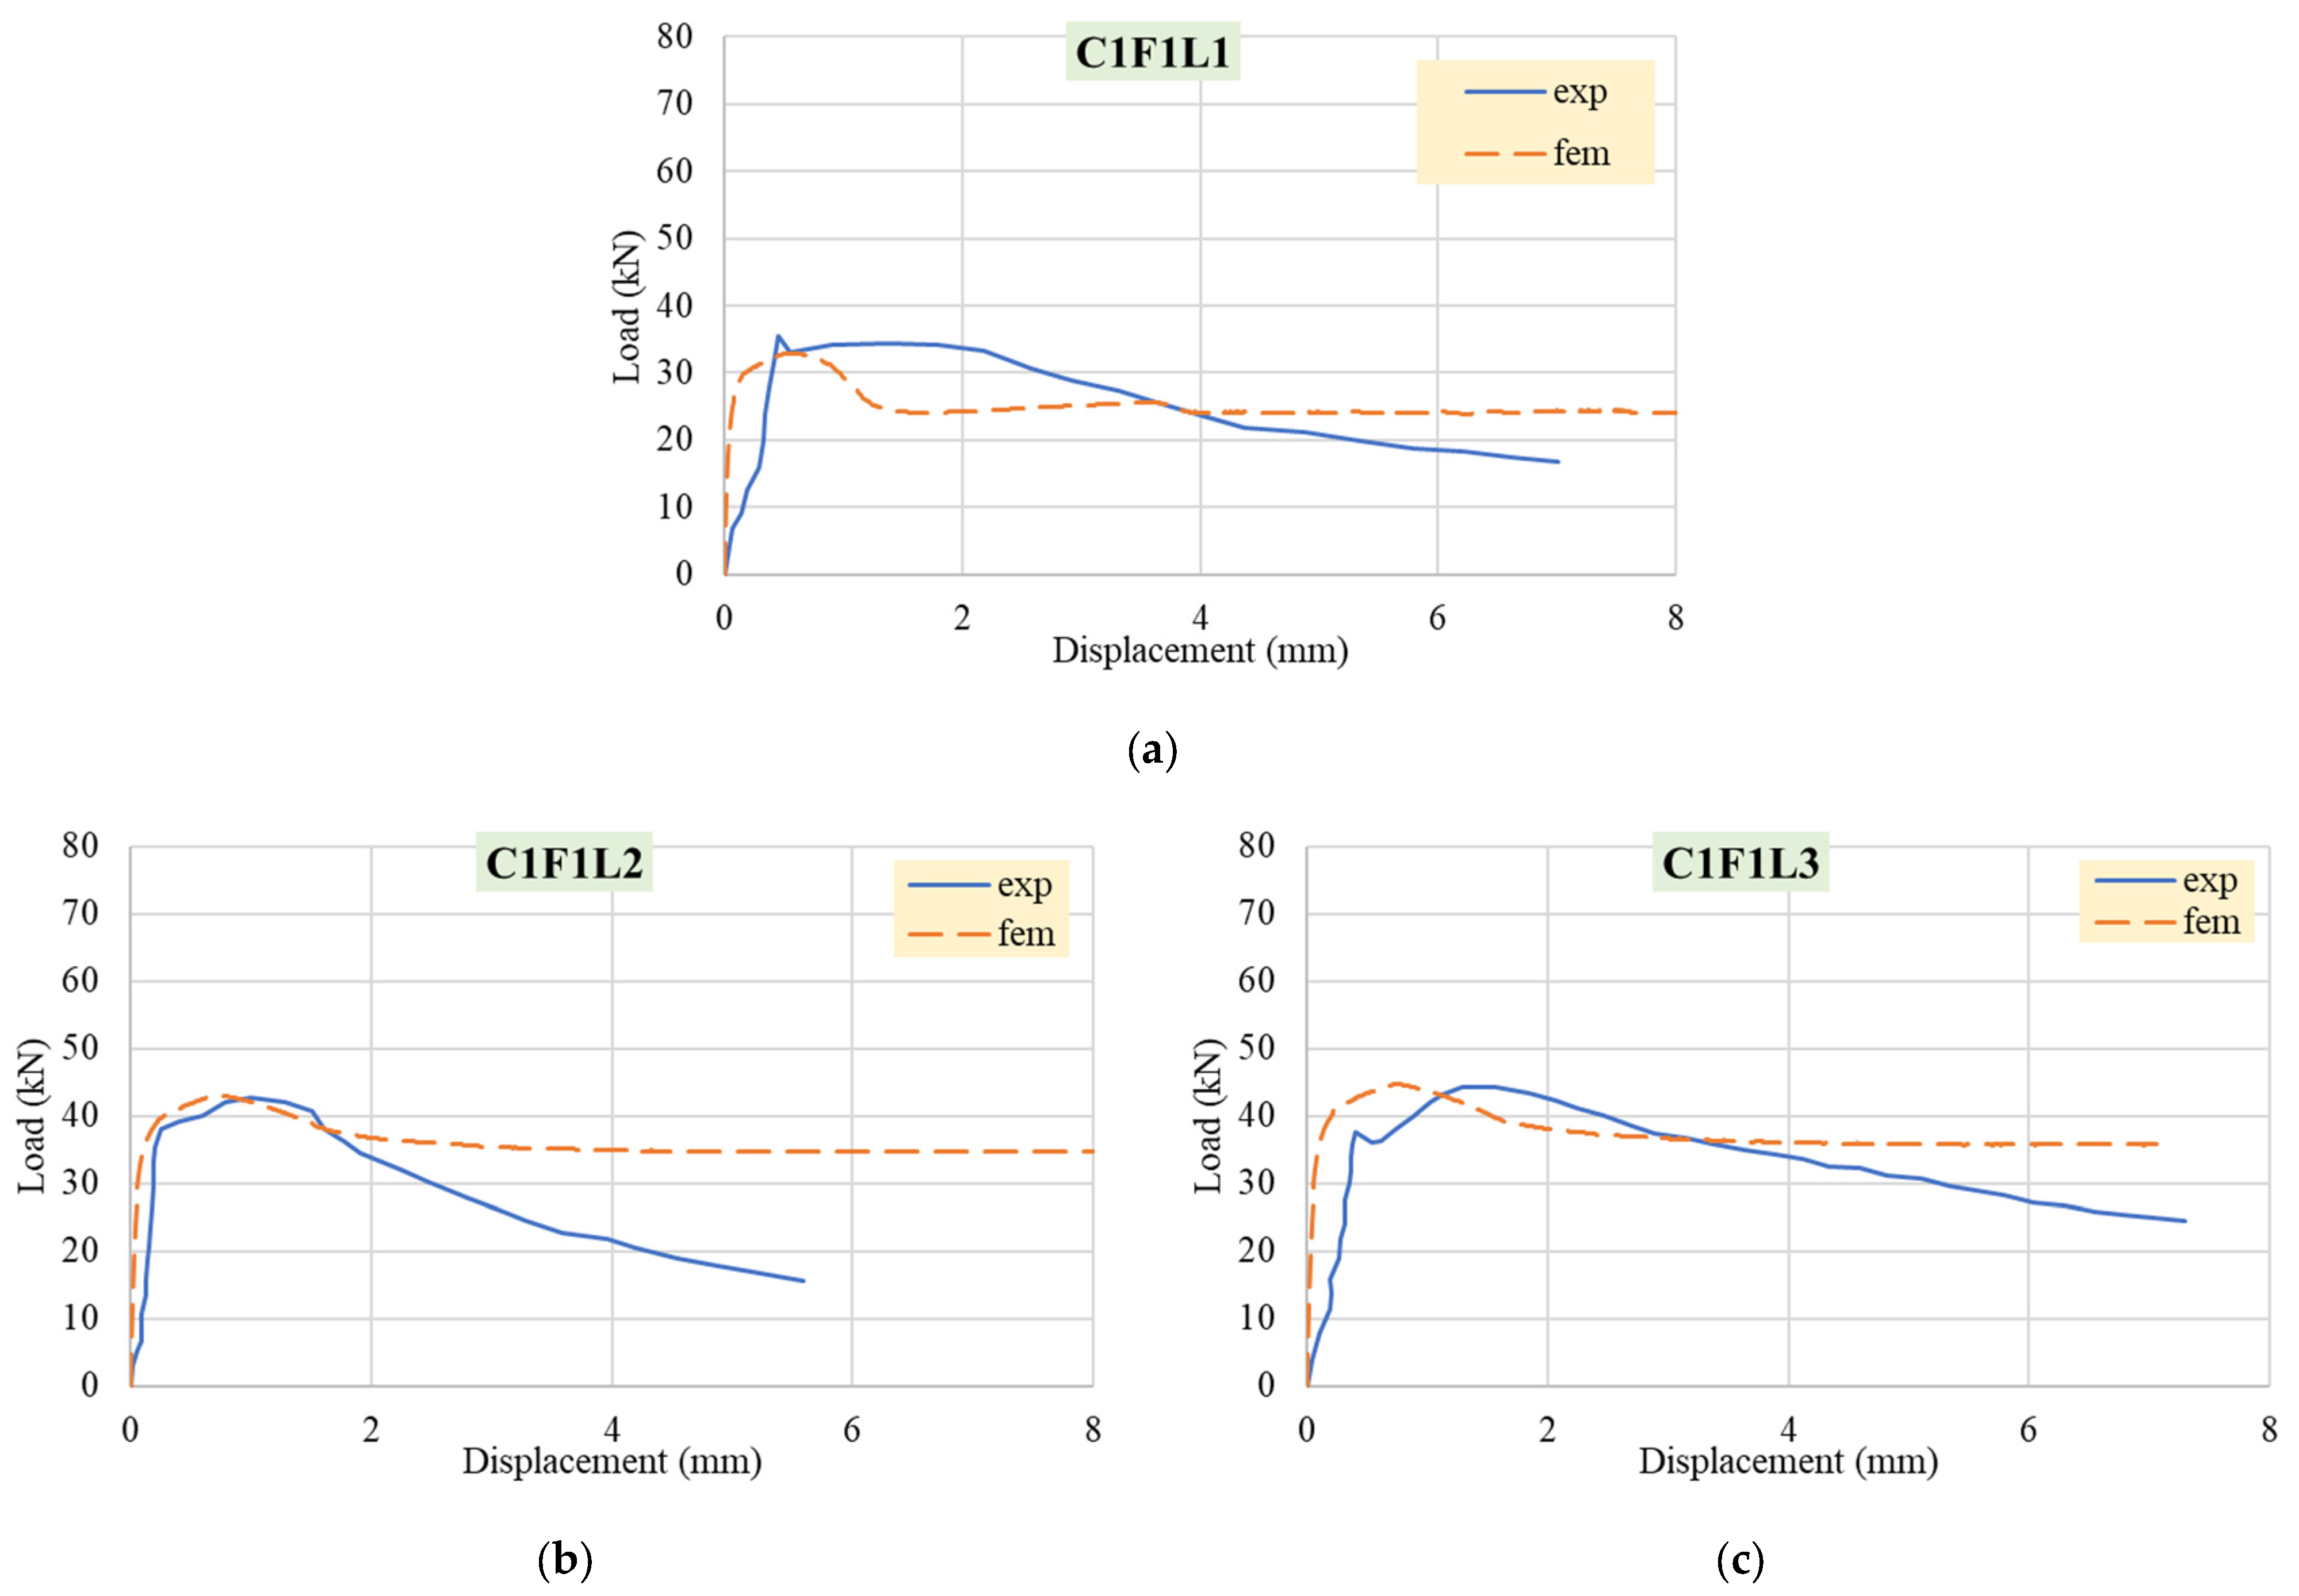
Table 5) was verified with the results of two different experimental study [17,38]. Concrete parameters used in finite element analysis was shown in Table 5. The comparisons of established finite element model and experimental results are presented in Figure 7 and Figure 8, respectively, for each reference study from the literature. The acronym C1 in Figure 7 denotes to a W/C ratio of 0.45 and F1 denotes to a fiber ratio of 0.5%. The acronyms L1, L2, and L3 in Figure 7 denotes to 40-, 50-, and 60-mm-long fibers, respectively. The acronyms SP45 and SP60 in Figure 8 denote to concrete mixtures with 45 and 60 kg/m3 fibers, respectively. The acronym exp (Figure 7) and experimental (Figure 8) denotes to experimental result of the reference studies and FEM denotes to finite element analysis that was conducted to validate the material model that was used within this presented study.
Material data from the experimental study [17], in which fiber contents were 45 kg/m3 and 60 kg/m3, was used as a reference in this study. Hooked-end steel fibers had a length of 33 mm (lf), a diameter of 0.55 mm (df), an aspect ratio of 60 mm (lf/df), and a yield strength of around 1300 MPa.
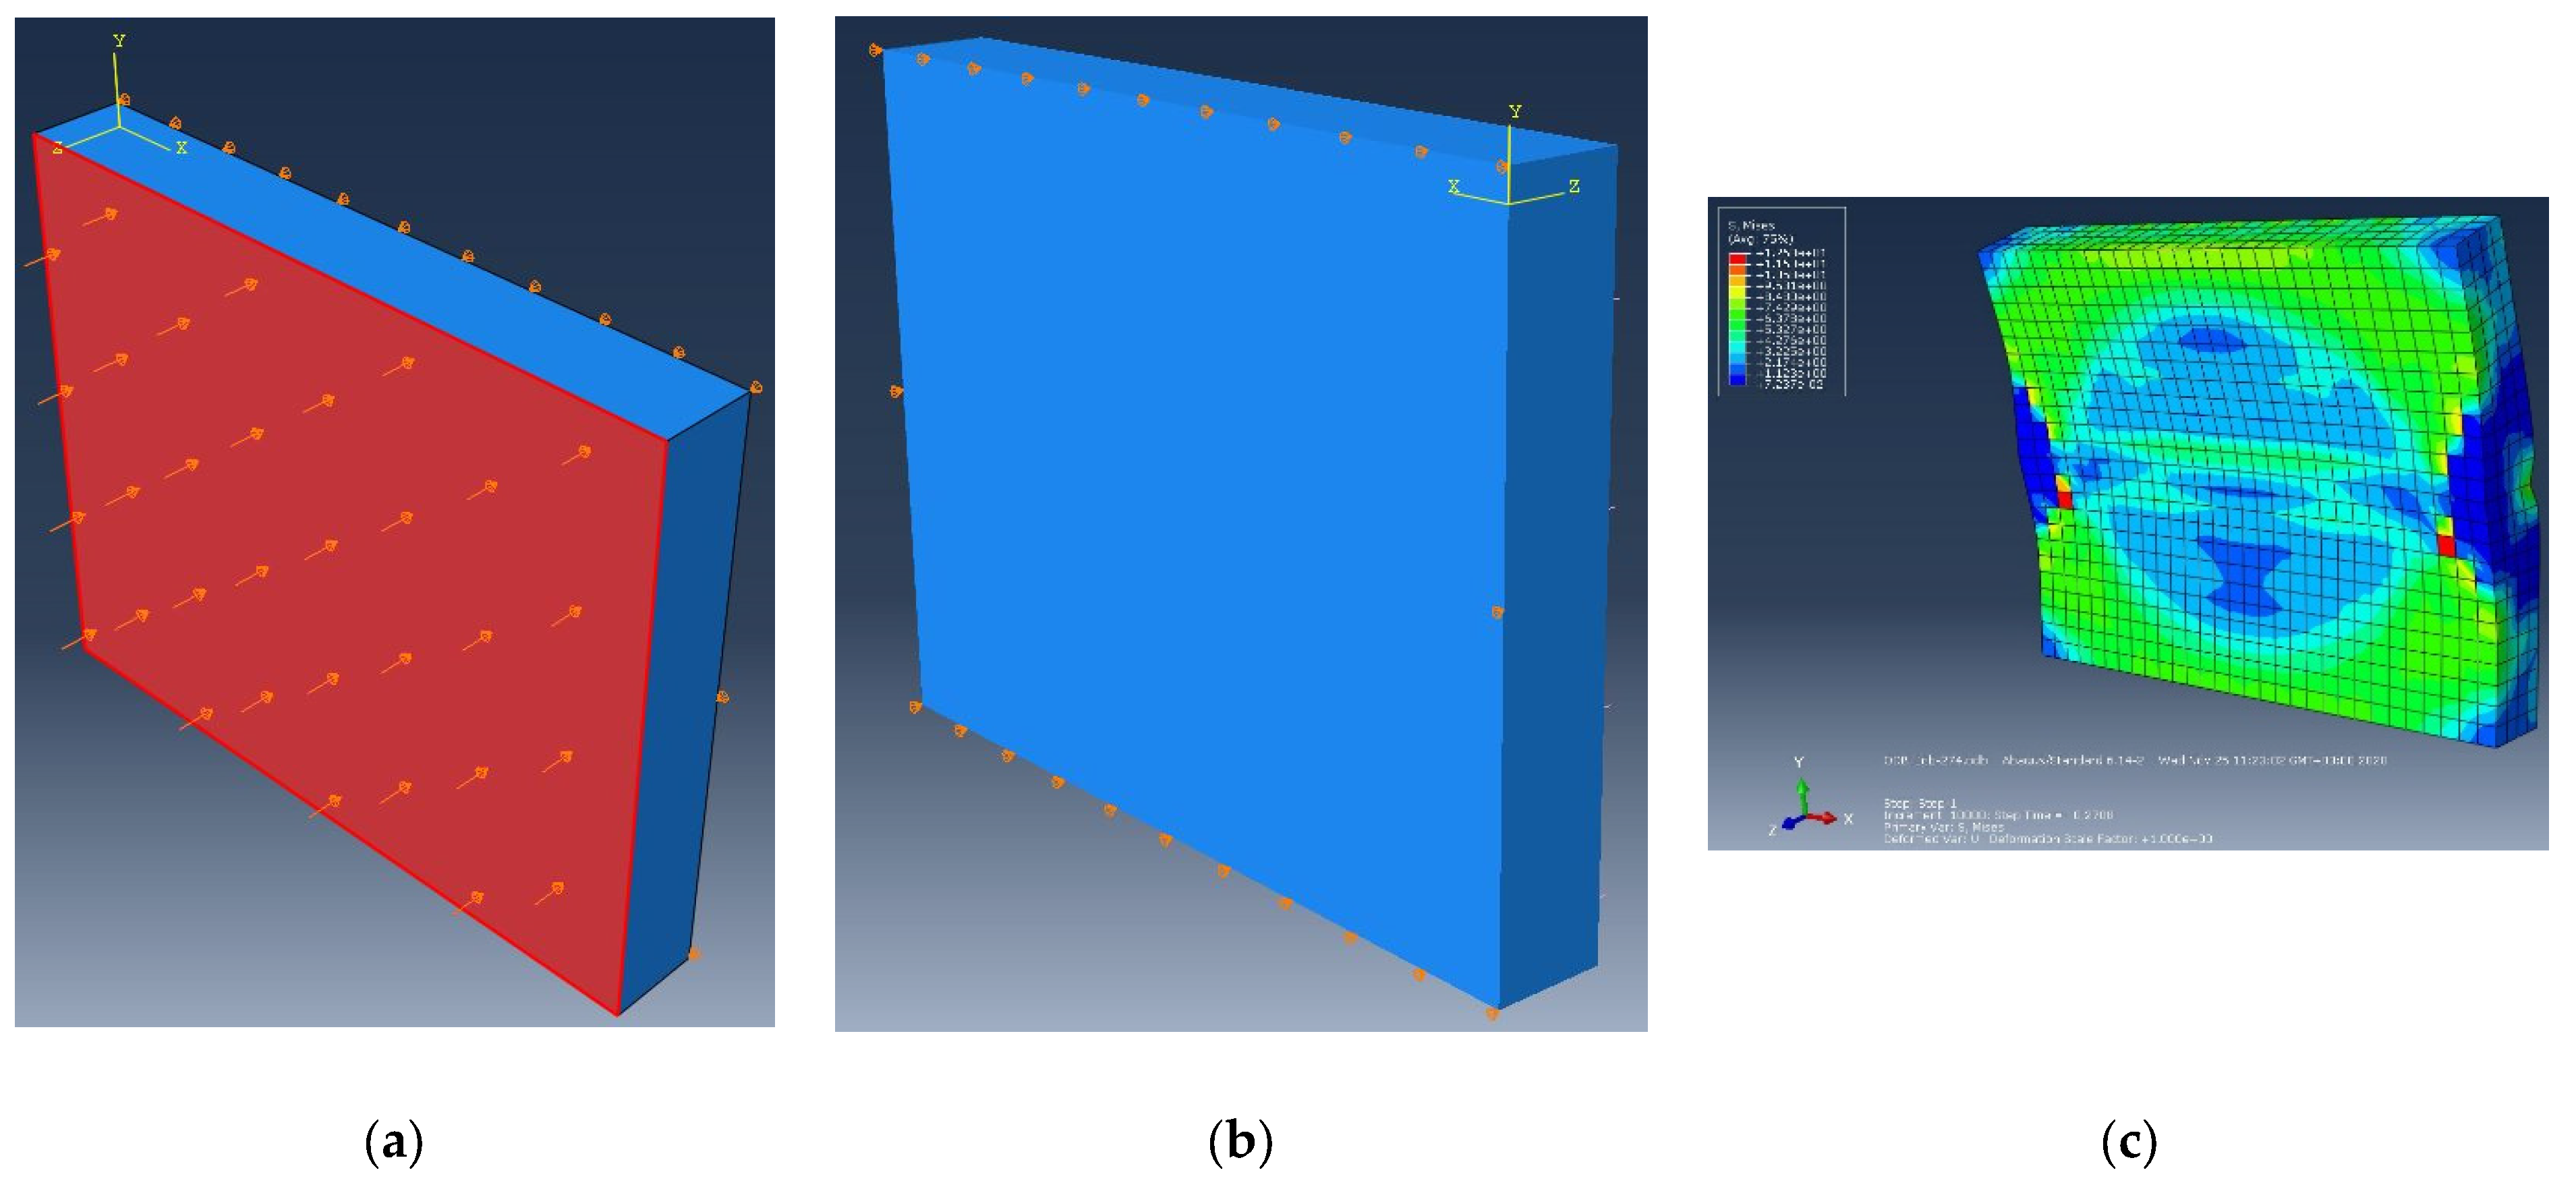
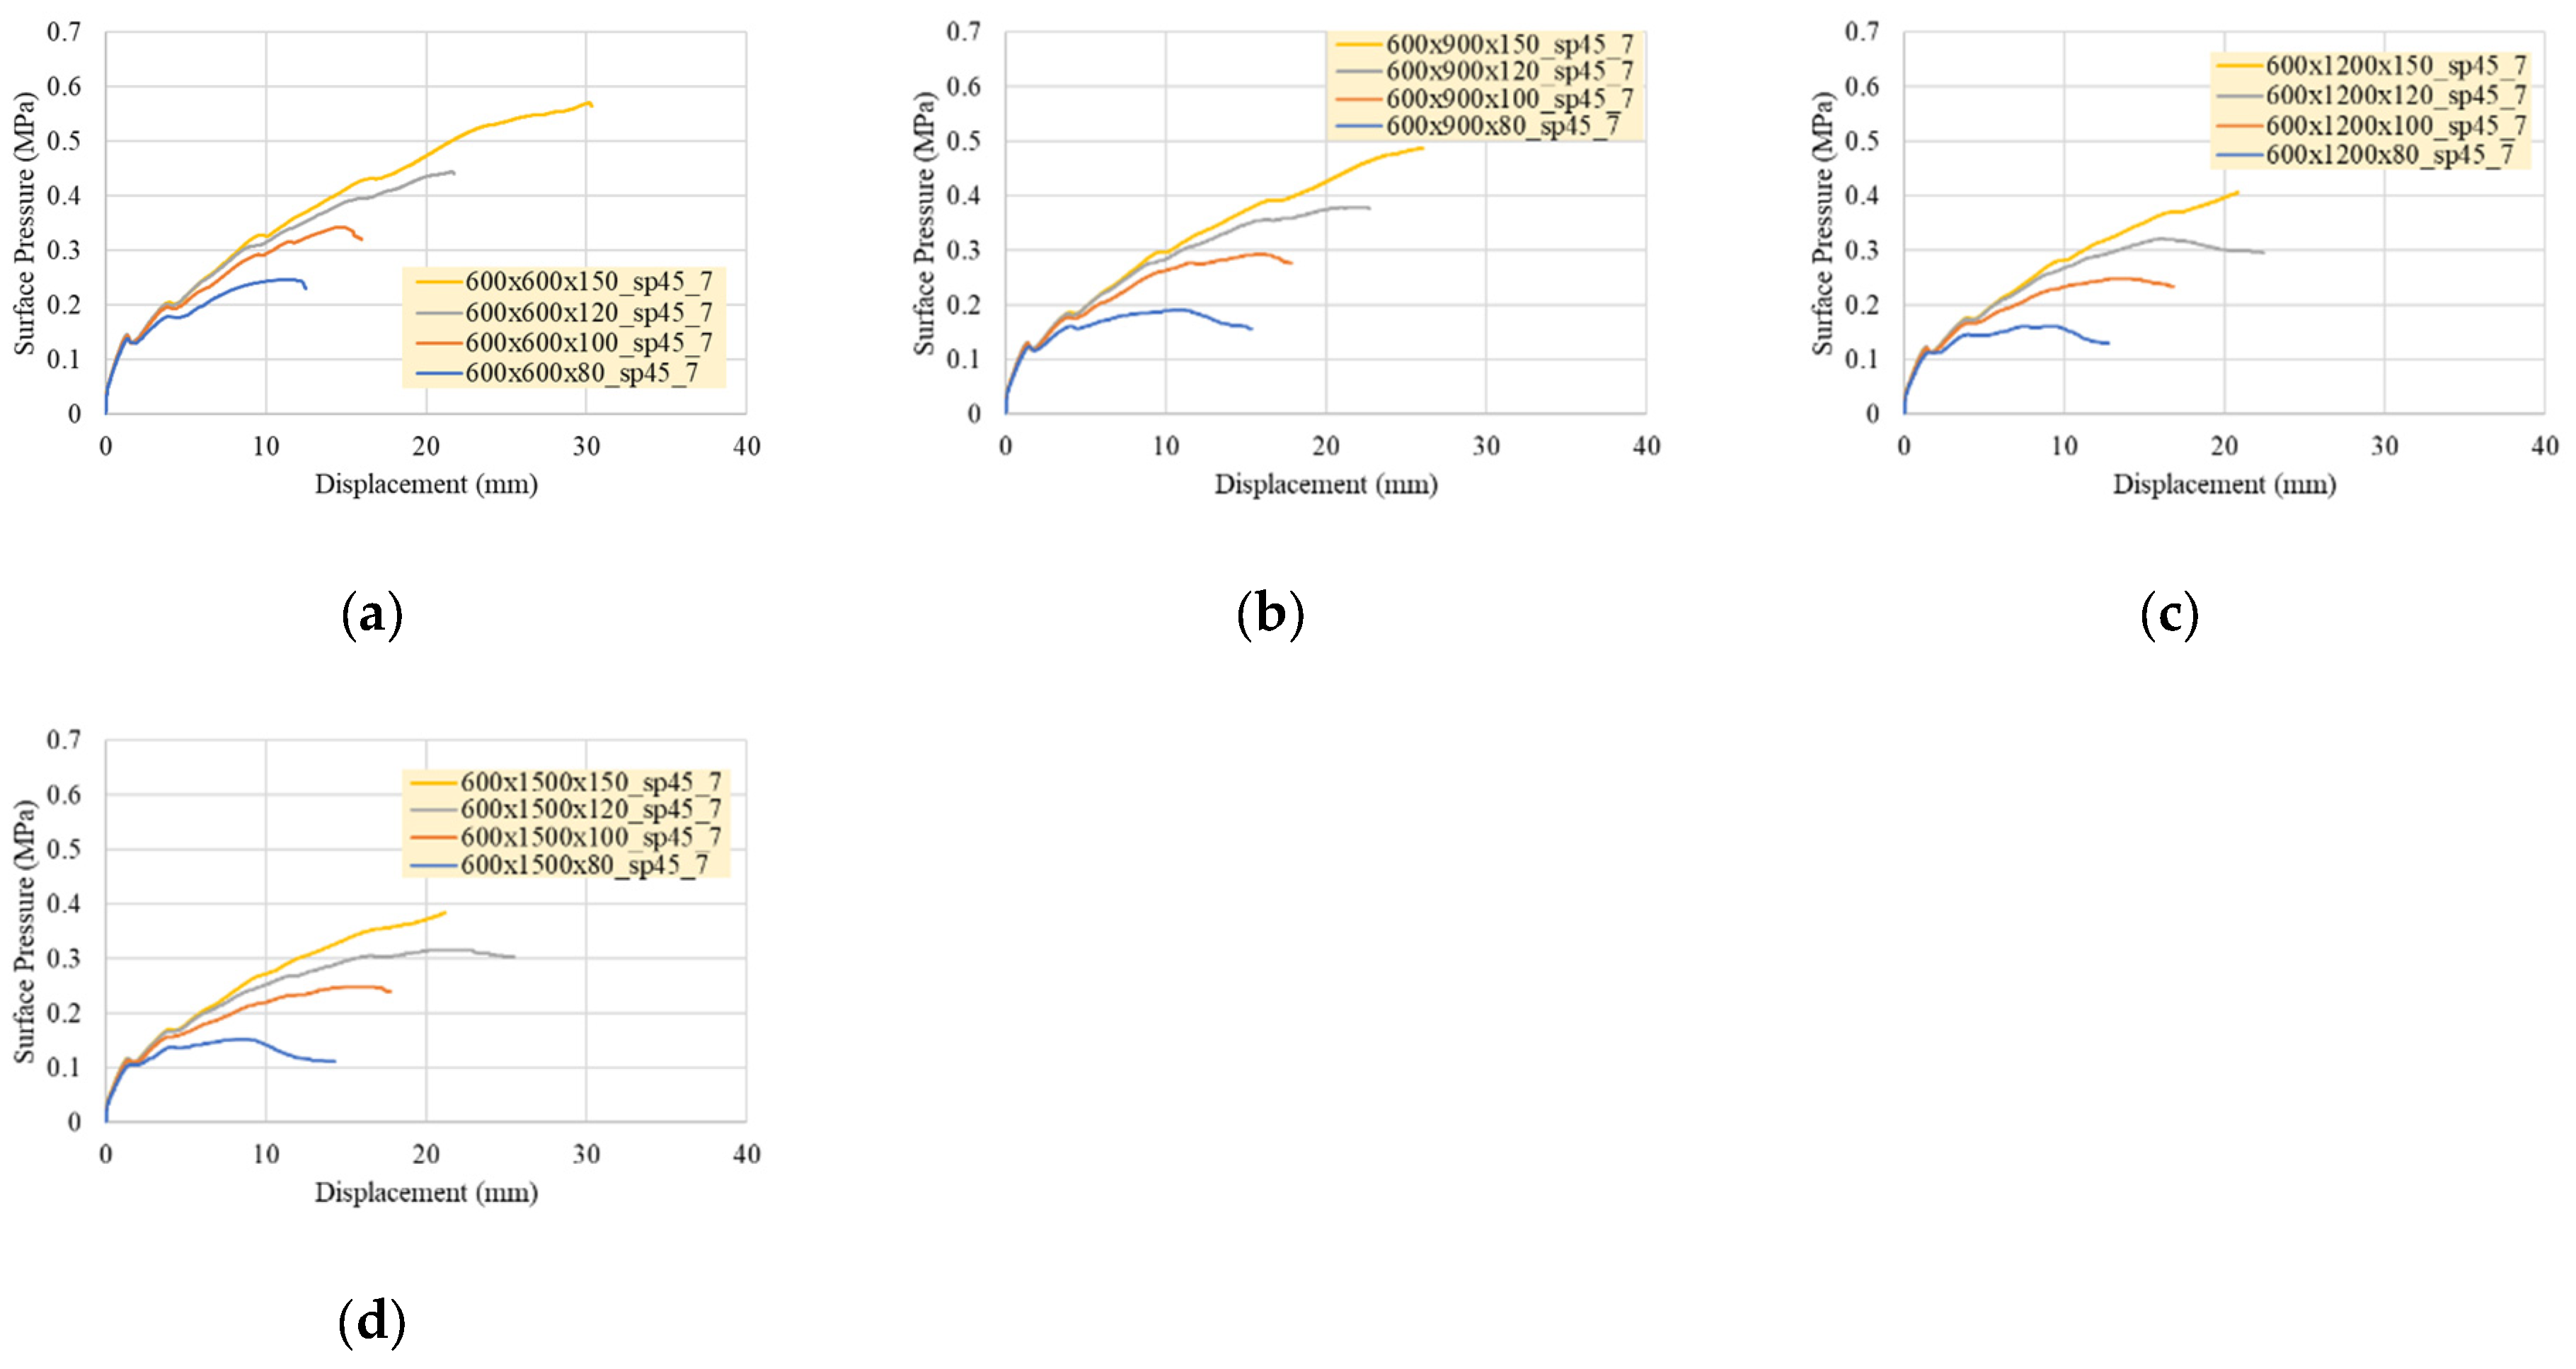
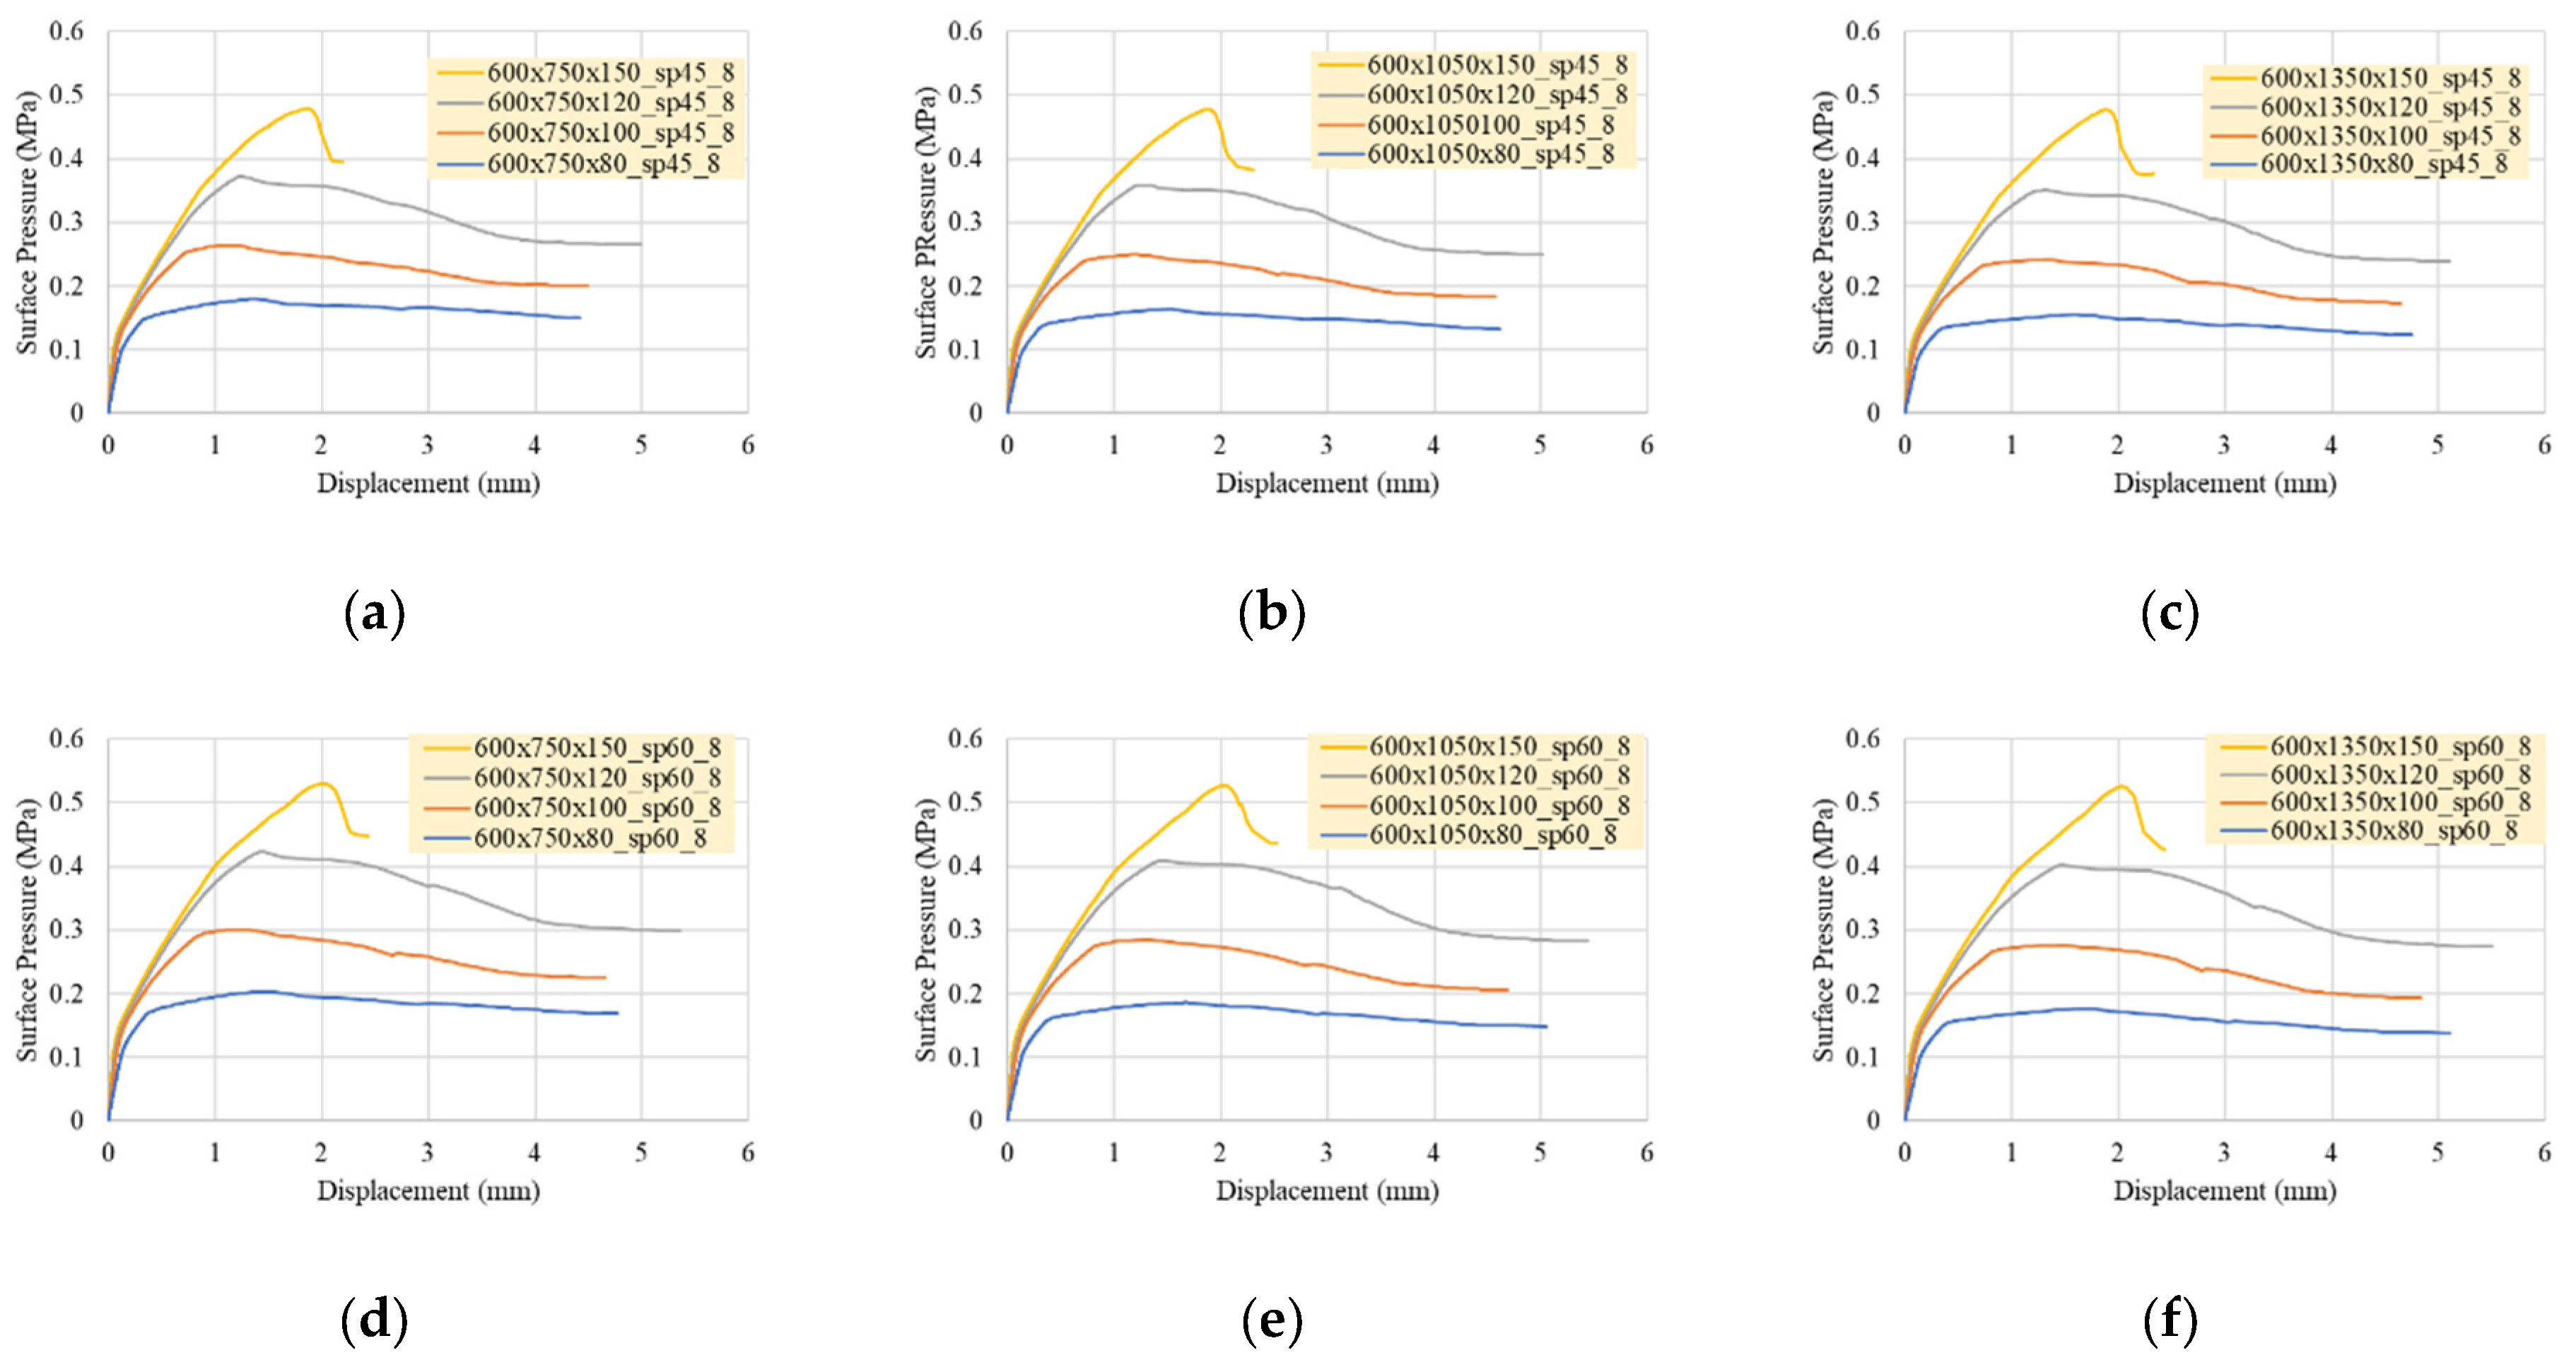
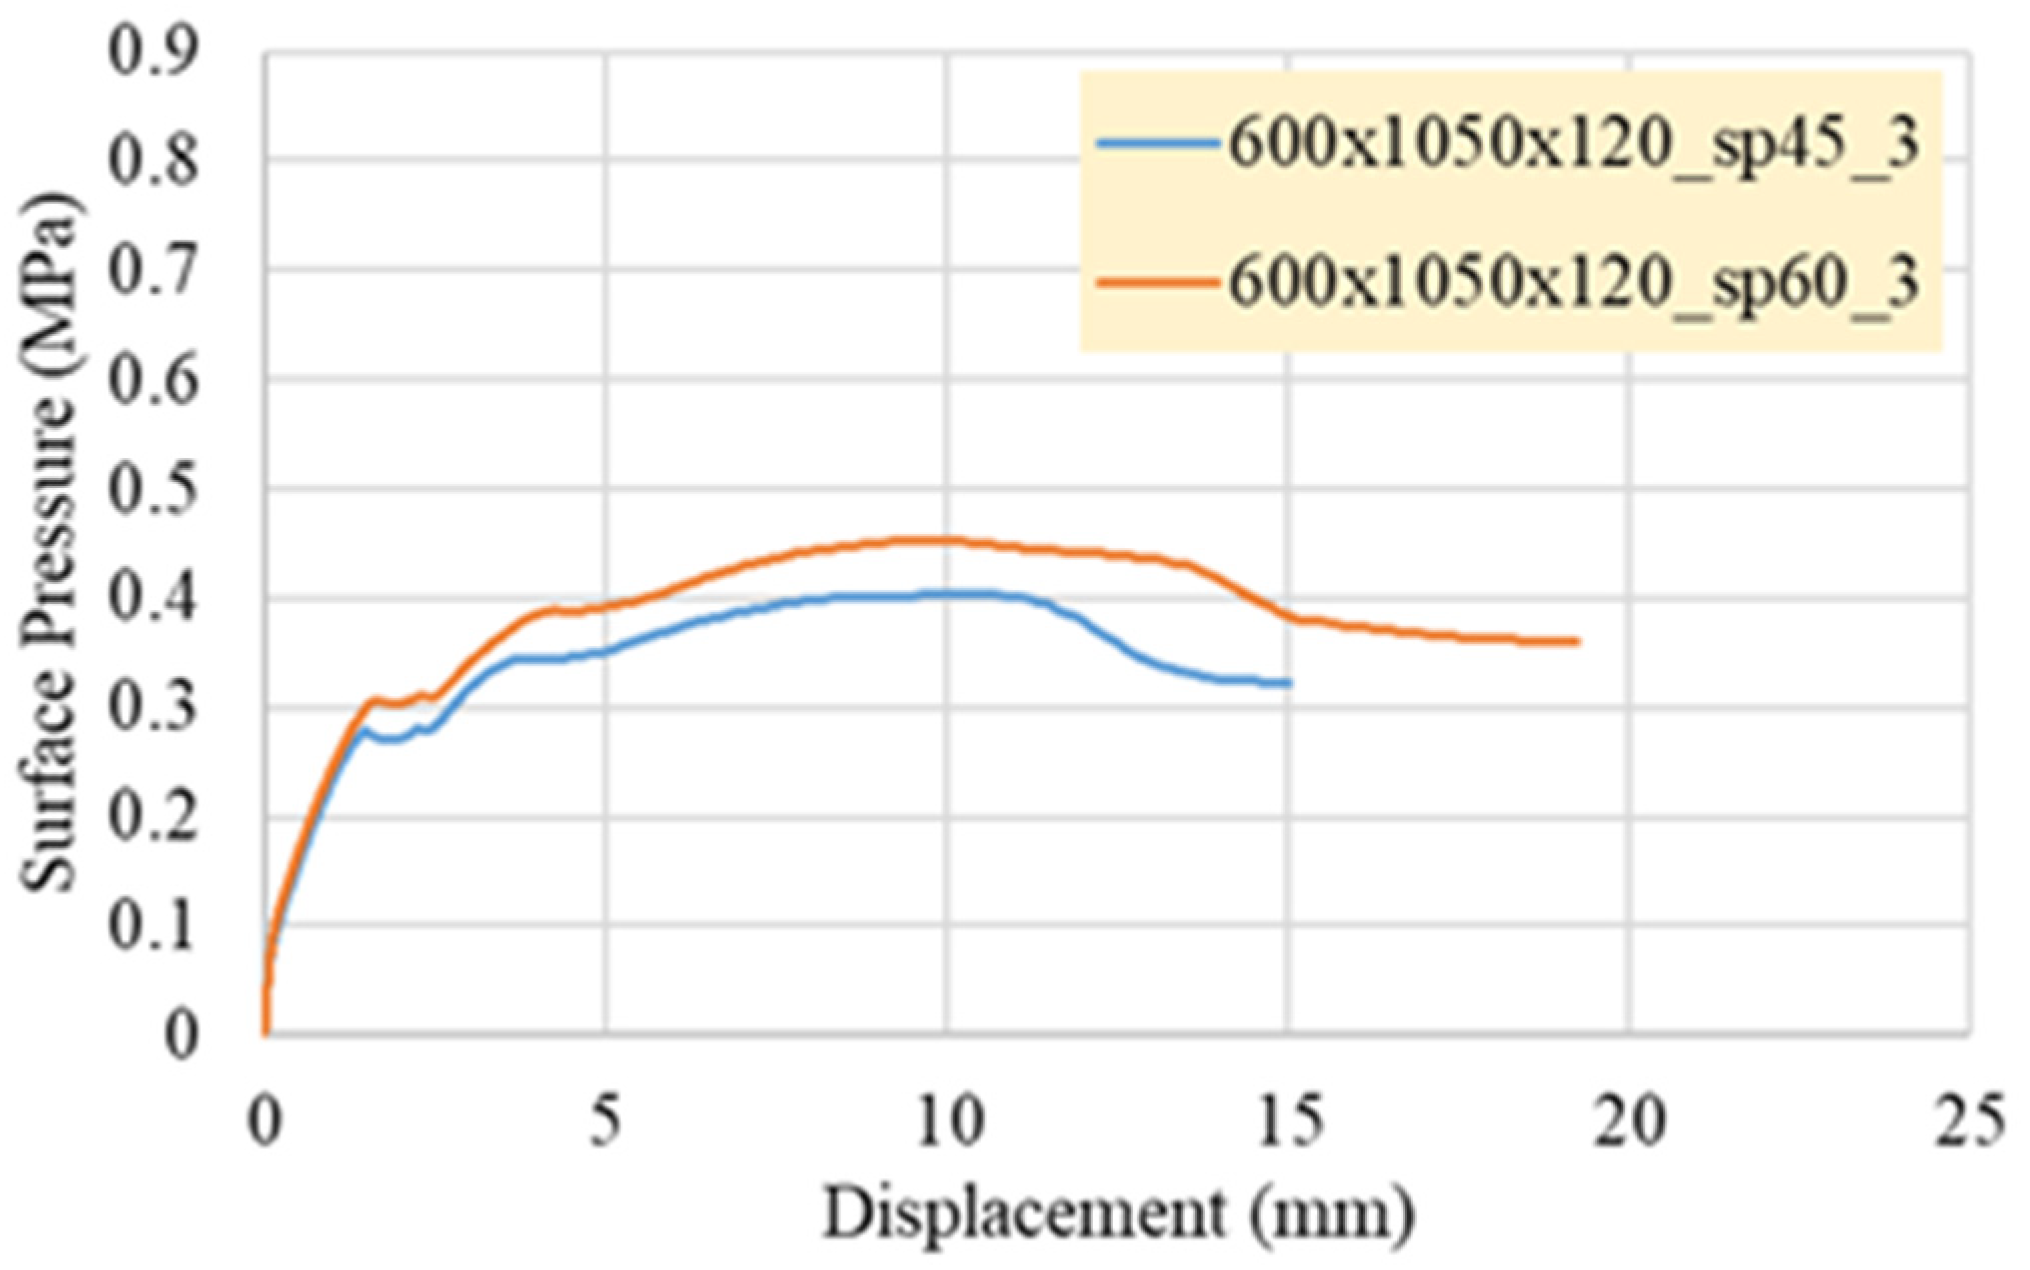
Within the scope of the presented study, a series of analyses were carried out in order to determine the important parameters that affect the behavior of steel fiber reinforced concrete panels under out of plane surface pressure. In the analyses, panel thickness, panel aspect ratios, steel fiber amount, and support conditions of the panels were varied. finite element analyses were conducted through the ABAQUS.

3. Detail of Finite Element Analyses

In total, 328 cases were analyzed by using the ABAQUS software, which is based on the finite element method. The thickness, aspect ratio (length/width), volumetric ratio of steel fiber content, and support intervals on the panels constituted the parameters that were examined. The steel fiber reinforced panels subjected to the surface pressure and nonlinear behavior of panels were observed. In the analyses, the surface pressure was applied from the front surface of the panels. The displacement on the edges of panels were restrained only in the direction of the applied surface pressure by using moment-released roller supports at the back surface (Figure 9).
As presented in Table 6, there are four different panel thicknesses (t), seven different panel lengths (L), and two different material types (SP45 symbols will be used for concrete containing 45 kg/m3 steel fiber, SP60 symbols will be used for concrete containing 60 kg/m3 steel fiber). The panel width, which was chosen to be 600 mm, was chosen to be constant for all analyzed cases. The analyzed nine different support cases (Figure 10) are detailed in Table 7. The whole matrix that regards the 41 different combinations of 9 boundary conditions and 7 aspect ratios is listed in Table 8.

4. Results and Discussions

The mid-span deflections of the panels, which were subjected to surface pressure, were obtained and compared to point out the importance of each investigated parameter. The abbreviations described in Figure 11 were used in Figure 12, Figure 13, Figure 14 and Figure 15. Some of the observed surface pressure-mid-span deflection behaviors for different boundary conditions are presented in Figure 12, Figure 13, Figure 14 and Figure 15. For each case, the observed ultimate bearing capacity of panels and observed midspan deflections at ultimate bearing capacity are respectively listed in Table 9 and Table 10.

4.1. Thickness

As expected, due to the basics of mechanics, the increase in the thickness of the panel resulted in an increase in the ultimate strength (surface pressure that can be carried) no matter what the boundary condition or the aspect ratio was. As the thickness of the panel increased, the ultimate bearing capacity was observed at smaller the mid-span deflections as an expected result of the change in the stiffness (Figure 12, Figure 13, Figure 14 and Figure 15). However, for larger aspect ratios, it was observed that the increase in the thickness of the panel resulted in larger mid-span deflections at ultimate bearing (Figure 16). The panels that were supported according to the case 1 and case 7 exhibited the maximum mid-span deflection at ultimate bearing capacity, and failed right after the ultimate bearing capacity. The effect of boundary conditions at edges were evaluated separately to see the effects in detail.

4.2. Aspect Ratio (Area)

In the presented study, the aspect (length/width) ratio of the panels varied by keeping the width of the panels constant. Hence, as the aspect ratio increased, the surface area of the panels also increased (Table 9). As a result, the increase in the aspect ratio makes panels softer. As it can be expected from basic mechanics, under similar conditions (material, thickness, boundary conditions) the increase in the aspect ratio resulted in a decrease in the ultimate bearing capacity of the panel (Figure 12, Figure 13, Figure 14, Figure 15 and Figure 17). Due to the basics of mechanics, a decrease in the aspect ratio makes panels stiffer; hence, in general, a decrease in the mid-span deflections at ultimate bearing capacity was an expected result. As expected, the majority of the analyzed cases resulted in an increasing tendency as the aspect ratio increases, except for the panels that had a thickness of 80 mm and were supported under boundary conditions 5 and 6 (Figure 18). However, a clear conclusion for the effect of aspect ratio (area) on the ultimate deflection capability of the panels was not able to be drawn since boundary conditions play a vital role (Table 10). Even for similar investigated parameters (boundary conditions, thickness, material type), the mid-span deflection at ultimate bearing capacity and ultimate mid-span deflection can have a varying relationship with the aspect ratio. It was noticed that the combined effect of boundary condition, aspect ratio, and thickness comes front and center, hence a more detailed investigation on the combined effects are discussed with Figure 18 and Figure 19.

4.3. Supporting on Short Edge

As presented in Figure 20, the highest resistance to the surface pressure was observed when the panels were restrained at minimum distances (support case2). As it can be expected from basic mechanical behavior, the largest mid-span deflection was observed when the panels were supported only from the corners (support case1). Support case 1 and 2 can be named as the lower and upper limit cases for the strength of the panel; however, mid-span deflection showed variation. (Figure 21).
Although the maximum surface pressure was not affected significantly, decreasing the supported length at short side (case 6 and 9) of the panel increased the strength of the panel at lower deflections. Additionally, decreasing the supported length at short side also limited the maximum mid-span deflection of the panel.

4.4. Supporting on Long Edge

Decreasing the supported length at the long side significantly increases the load carrying capacity of the panels (case 6 and 5 in Figure 20). However, any significant changes in the ultimate midspan deflection capability were not observed. In addition, when the short side support spacing is examined by keeping the long side support spacing constant, the decrease in the short side support spacing as the panel thickness increases reduces the amount of displacement caused by the increase in size. For example, when the panels with 100 mm thickness were examined for the 5 and 6 supports, it was noticed that the displacement increases as the panel size increases in the support case 6. Although the above-mentioned results were valid for the first three thickness values (80, 100, and 120 mm), the opposite behavior was observed for the 150-mm-thick panel. The reason for this may be that the behavior of the panel converts to the beam behavior due to the increase in thickness.

4.5. Material Type

The mix designs that were considered in this study were not significantly different from each other by means of the compressive strength. However, they differ from each other in the amount of steel fiber. The increase in the steel fiber amount resulted in higher ductility and higher tensile strength as expected. It was observed that the increase in steel fiber ratio (without changing the compressive strength) increased the ultimate mid span deflection capability with a slight increase in the ultimate capacity (Figure 22).
The comparison of panels that have the same thicknesses showed that the increase in the aspect ratio caused a decrease in the maximum strength. However, it was observed that the effect of the aspect ratio on the decrease in the panels’ ultimate bearing capacity became more significant as the number of supported locations decreased. It was seen that support conditions at the short edge were more effective on the variation of the ultimate bearing capacity of the panels when compared to the support conditions on the long edge. Support conditions on the long edge affects the stiffness of the panel against surface pressure without a significant change in the ultimate bearing capacity.
The effects of the investigated parameters on the ultimate bearing capacity and the mid-span deflection at ultimate bearing capacity were able to be observed clearly. However, the variations in maximum mid-span deflections, due to the variations in the investigated parameters, were in mixed manner. Similar tendency was also observed in an experimental investigation on SFRC panels that were subjected to point load at mid-span as well. Clear relationships between the investigated parameters and the ultimate mid-span deflection were not able to be pointed out.
The evaluation of results in terms of mid-span deflection showed that the panels, which were only supported at corners (support case 1), exhibited the maximum mid-span deflections with lower resistance to the surface pressure.
When the effect of size change on the energy absorption capacity was examined, various analyses were made by keeping the thickness and support condition constant. Considering the results of these analyses, the smallest size panel gave the largest energy absorption.
There are graphs showing the distribution of the maximum surface pressure, the mid-span deflection at maximum surface pressure, and the maximum mid-span deflection according to the panel dimensions, in Figure 17, Figure 18 and Figure 19. The ultimate bearing capacity and the mid-span deflection at ultimate bearing capacity of all panels are given in Table 9 and Table 10, respectively. In Figure 17, Figure 18 and Figure 19, the observed ultimate bearing (maximum surface pressure), the mid-span deflection at ultimate bearing capacity, and the ultimate mid-span deflections were plotted, respectively. For each figure, the data were plotted in two groups and the data was grouped also with regard to the boundary conditions. Both the first and second group data were also sub-grouped for each thickness (80, 100, and 120 mm) and for each panel size (aspect ratio). In the first group, boundary conditions 2, 5, and 8 were plotted. In this data group, the long edges were supported at every 75 mm, while the short edges were supported at every 75, 100, and 300 mm, for boundary conditions 2, 5, and 8, respectively. In the second group, boundary conditions 5, 6, 8, and 9 were plotted together. In this data the short edges were supported at every 100 mm (boundary condition 5 and 6) and 300 mm (boundary condition 8 and 9), while the long edges were supported at every 75 mm (boundary condition 5 and 8) and 150 mm (boundary condition 6 and 9).
The ultimate bearing capacity of panels are presented in Figure 17. It can be clearly observed that the increase in the aspect ratio decreases the ultimate bearing regardless the other investigated parameters. For the thinnest panels, the ultimate bearing capacity was not affected by the change of the distance in between supports on the long edges. The effect of the variation of the distance in between supports on the short edge was more significant on the thickest panels that have smaller aspect ratios. As the aspect ratio increases the effect of boundary conditions became more negligible.
In Figure 18, the observed mid-span deflection of panels at ultimate bearing capacity are plotted. It was observed that the mid-span deflection at ultimate bearing capacity was the lowest for boundary condition 8 when compared with boundary condition 2 and 5. In general for boundary condition 8, the increase in the aspect ratio slightly increased the observed mid-span deflection at ultimate bearing capacity. For boundary condition 5, the observed mid-span deflection increased with the increase in the aspect ratio when the panel thickness was 100 and 120 mm, but for 80 mm panel thickness, the increase in the aspect ratio resulted in a decrease in the midspan deflection. For the smallest panel thickness, which was 80 mm, a clear tendency on the aspect ratio can not be drawn. For both boundary conditions 5 and 8, the increase in the thickness of the panel decreased the mid-span deflection. However, for boundary condition 2, the increase in the panel thickness decreased the mid-span deflection for smaller aspect ratios, but increased the mid-span deflection for higher aspect ratios. The comparison in second data group showed that among boundary conditions 5, 6, 8, and 9, the boundary condition 6 resulted with the highest mid-span deflections and the boundary condition 8 resulted with the lowest mid-span deflection. For the similar boundary conditions on the short edges, it was observed the supporting at shorter distances on long edges resulted with limitations on mid-span deflections (comparison of 5 with 6, and 8 with 9). Supporting the short edges at shorter distances clearly limited the mid-span deflection when the long edges were supported at every 75 mm, for each panel size and thickness. For the panels that had a thickness of 80 and 100 mm, the mid-span deflection was limited with the increase in support distances on short edges when the long edges were supported at every 150 mm. However, the mid-span deflections of panel that have 120 mm thickness and that were supported at every 150 mm on long edges were in an increasing tendency with the aspect ratio when the short edges were supported at every 100 mm, but opposingly it was in a decreasing tendency with the aspect ratio when the short edges were supported at every 300 mm.
The observed ultimate mid-span deflections of the panels are presented in Figure 19. In general, the boundary condition 5 resulted in the smallest ultimate mid-span deflections, for panels having a thickness of 100 mm. As can be seen from Figure 19, a clear relevance in between the ultimate mid-span deflection and investigated parameters (boundary conditions, panel thickness, aspect ratio) can not be highlighted. For panels that have 100 and 120 mm thickness, increasing the distance in between the supports on long edges increased the observed ultimate mid-span deflection.

5. Conclusions

In this study, analyses were conducted in the ABAQUS program based on the finite element program on 328 panels, which varied according to four parameters. The parameters examined are panel dimensions, panel thickness, material type, and distances in between supports. When the data obtained in this context were evaluated, the following conclusions were reached.
If we consider the results in general:
  • Since the increase in thickness increases the stiffness of the panel, a higher ultimate bearing capacity can be observed at smaller mid-span deflections. However, the boundary condition and the aspect ratio of the panel may result in ultimate bearing capacity being observed at a higher mid-span deflection.
  • Since the increase in the aspect ratio decreases the stiffness of the panel, lower ultimate bearing capacity can be observed at higher mid-span deflections. However, boundary conditions can significantly limit the mid-span deflections at ultimate bearing capacity, but similar boundary conditions may result in different behavior for the panels that have different aspect ratios.
  • It is not sufficient for the panels to be held only at the corners, and intermediate supports are absolutely needed. Supports on the short edge have a vital role in the ultimate bearing capacity of the panels and carry the observed mid-span deflection at ultimate bearing capacity to higher deformation levels in most cases. The support conditions on the long edge affects the mid-span deflection at ultimate bearing capacity no matter what the support condition on the short edge is. However, the effect of boundary condition on maximum mid-span deflection can either be positive or negative depending on the boundary condition on the short edge.
  • Since the increase in the amount of steel fiber increases the tensile strength with or without increasing the compressive strength, an increase in the ultimate bearing capacity of members that are subjected to bending is an expected result. It was observed with the presented study that the variation in fiber amount does not change the tendency of the general behavior of SFRC. For similar boundary conditions, aspect ratios, and thicknesses, the increase in fiber amount results in the observation of higher ultimate bearing capacity at higher mid-span deflections, and results in higher ultimate mid-span deflections.

Author Contributions

Conceptualization, methodology, validation, investigation, and data curation, O.E.C. and F.C.; resources, software, writing—original draft preparation, and visualization O.E.C.; writing—review and editing, and supervision F.C. All authors have read and agreed to the published version of the manuscript.

Funding

This research received no external funding.

Institutional Review Board Statement

Not applicable.

Informed Consent Statement

Not applicable.

Data Availability Statement

The data presented in this study are available on request from the corresponding author.

Acknowledgments

Not applicable.

Conflicts of Interest

The authors declare no conflict of interest.

References

  1. Gao, J.; Suqa, W.; Morino, K. Mechanical Properties of Steel Fiber-Reinforced, High-Strength, Lightweight Concrete. Cem. Concr. Compos. 1997, 19, 307–313. [Google Scholar] [CrossRef]
  2. Song, P.S.; Hwang, S. Mechanical Properties of High-Strength Steel Fiber-Reinforced Concrete. Constr. Build. Mater. 2004, 18, 669–673. [Google Scholar] [CrossRef]
  3. Ou, Y.-C.; Tsai, M.-S.; Liu, K.-Y.; Chang, K.-C. Compressive Behavior of Steel-Fiber-Reinforced Concrete with a High Reinforcing Index. J. Mater. Civ. Eng. 2012, 24, 207–215. [Google Scholar] [CrossRef]
  4. Susetyo, J.; Gauvreau, P.; Vecchio, F.J. Steel Fiber-Reinforced Concrete Panels in Shear: Analysis and Modeling. ACI Struct. J. 2013, 110, 285–296. [Google Scholar]
  5. Abrishambaf, A.; Barros, J.A.O.; Cunha, V.M.C.F. Relation between Fibre Distribution and Post-Cracking Behaviour in Steel Fibre Reinforced Self-Compacting Concrete Panels. Cem. Concr. Res. 2013, 51, 57–66. [Google Scholar] [CrossRef] [Green Version]
  6. Islam, M.M.; Chowdhury, M.A.; Sayeed, M.A.; Al Hossain, E.; Ahmed, S.S.; Siddique, A. Finite Element Analysis of Steel Fiber-Reinforced Concrete (SFRC): Validation of Experimental Tensile Capacity of Dog-Bone Specimens. Int. J. Adv. Struct. Eng. 2014, 6, 63. [Google Scholar] [CrossRef] [Green Version]
  7. Kim, H.; Kim, G.; Nam, J.; Kim, J.; Han, S.; Lee, S. Static Mechanical Properties and Impact Resistance of Amorphous Metallic Fiber-Reinforced Concrete. Compos. Struct. 2015, 134, 831–844. [Google Scholar] [CrossRef]
  8. Iqbal, S.; Ali, A.; Holschemacher, K.; Bier, T.A. Mechanical Properties of Steel Fiber Reinforced High Strength Lightweight Self-Compacting Concrete (SHLSCC). Constr. Build. Mater. 2015, 98, 325–333. [Google Scholar] [CrossRef]
  9. Pikus, G.A. Steel Fiber Concrete Mixture Workability. Procedia Eng. 2016, 150, 2119–2123. [Google Scholar] [CrossRef] [Green Version]
  10. Jeon, S.J.; Jin, B.M. Improvement of Impact-Resistance of a Nuclear Containment Building Using Fiber Reinforced Concrete. Nucl. Eng. Des. 2016, 304, 139–150. [Google Scholar] [CrossRef]
  11. Nehme, S.G.; László, R.; El Mir, A. Mechanical Performance of Steel Fiber Reinforced Self-Compacting Concrete in Panels. Procedia Eng. 2017, 196, 90–96. [Google Scholar] [CrossRef]
  12. Barros Auxiliar, J.A.O.; Figueiras, J.A. Experimental Analysis of Fiber Reinforced Concrete Slabs; Laboratório Nacional de Engenharia Civil (LNEC): Lisboa, Portugal, 1997. [Google Scholar]
  13. Susetyo, J.; Gauvreau, P.; Vecchio, F.J. Effectiveness of Steel Fiber as Minimum Shear. ACI Struct. J. 2011, 108, 488–496. [Google Scholar] [CrossRef]
  14. Meskenas, A.; Gelazius, V.; Kaklauskas, G.; Gribniak, V.; Rimkus, A. A New Technique for Constitutive Modeling of SFRC. Procedia Eng. 2013, 57, 762–766. [Google Scholar] [CrossRef] [Green Version]
  15. Nataraja, M.C.; Dhang, N.; Gupta, A.P. Stress ± strain Curves for Steel-Fiber Reinforced Concrete under Compression. Cem. Concr. Compos. 1999, 21, 383–390. [Google Scholar] [CrossRef]
  16. Olivito, R.S.; Zuccarello, F.A. An Experimental Study on the Tensile Strength of Steel Fiber Reinforced Concrete. Compos. Part B Eng. 2010, 41, 246–255. [Google Scholar] [CrossRef]
  17. Salehian, H.; Barros, J.A.O.; Taheri, M. Evaluation of the Influence of Post-Cracking Response of Steel Fibre Reinforced Concrete (SFRC) on Load Carrying Capacity of SFRC Panels. Constr. Build. Mater. 2014, 73, 289–304. [Google Scholar] [CrossRef] [Green Version]
  18. Vossoughi, F.; Ostertag, C.P.; Monteiro, P.J.M.; Johnson, G.C. Resistance of Concrete Protected by Fabric to Projectile Impact. Cem. Concr. Res. 2007, 37, 96–106. [Google Scholar] [CrossRef]
  19. Park, S.H.; Kim, D.J.; Ryu, G.S.; Koh, K.T. Tensile Behavior of Ultra High Performance Hybrid Fiber Reinforced Concrete. Cem. Concr. Compos. 2012, 34, 172–184. [Google Scholar] [CrossRef]
  20. Bheel, N.; Tafsirojjaman, T.; Liu, Y.; Awoyera, P.; Kumar, A.; Keerio, M.A. Experimental Study on Engineering Properties of Cement Concrete Reinforced with Nylon and Jute Fibers. Buildings 2021, 11, 454. [Google Scholar] [CrossRef]
  21. Koksal, F.; Ilki, A.; Tasdemir, M.A. Optimum Mix Design of Steel-Fibre-Reinforced Concrete Plates. Arab. J. Sci. Eng. 2013, 38, 2971–2983. [Google Scholar] [CrossRef]
  22. Gribniak, V.; Kaklauskas, G.; Hung Kwan, A.K.; Bacinskas, D.; Ulbinas, D. Deriving Stress-Strain Relationships for Steel Fibre Concrete in Tension from Tests of Beams with Ordinary Reinforcement. Eng. Struct. 2012, 42, 387–395. [Google Scholar] [CrossRef]
  23. Ly, H.; Le, T.; Vu, H.; Tran, V.; Le, L.; Pham, B. Computational Hybrid Machine Learning BasedPrediction of Shear Capacity for Steel FiberReinforced Concrete Beams. Sustainability 2020, 12, 2709. [Google Scholar] [CrossRef] [Green Version]
  24. Vandenberghe, M.; Zwevegem, B. Steel Fibres for the Construction of Military Shelters. In Proceedings of the IV. International Dramix Conference, Brussels, Belgium, 2 November 1990. [Google Scholar]
  25. Corley, W.G. Applicability of Seismic Design in Mitigating Progressive Collapse. In Proceedings of the National Workshop on Prevention of Progressive Collapse, Multihazard Mitigation Council of the National Institute of Building Sciences, Rosemont, IL, USA, 18 July 2002. [Google Scholar]
  26. Abolhassan, A.A.; Casey, H.; Qiuhong, Z. Analysis of Car-Bomb Effects on Buildings Using MSC-Dytran Software and Protective Measures. In Proceedings of the MSC Software Virtual Product Development Conference, Dearborn, MI, USA, 3 October 2003; pp. 1–10. [Google Scholar]
  27. Pantelides, C.P.; Garfield, T.T.; Richins, W.D.; Larson, T.K.; Blakeley, J.E. Reinforced Concrete and Fiber Reinforced Concrete Panels Subjected to Blast Detonations and Post-Blast Static Tests. Eng. Struct. 2014, 76, 24–33. [Google Scholar] [CrossRef] [Green Version]
  28. Li, Q.M.; Reid, S.R.; Wen, H.M.; Telford, A.R. Local Impact Effects of Hard Missiles on Concrete Targets. Int. J. Impact Eng. 2005, 32, 224–284. [Google Scholar] [CrossRef]
  29. Tai, Y.S. Flat Ended Projectile Penetrating Ultra-High Strength Concrete Plate Target. Theor. Appl. Fract. Mech. 2009, 51, 117–128. [Google Scholar] [CrossRef]
  30. Abdel-Kader, M.; Fouda, A. Effect of Reinforcement on the Response of Concrete Panels to Impact of Hard Projectiles. Int. J. Impact Eng. 2014, 63, 1–17. [Google Scholar] [CrossRef]
  31. Wu, C.; Sheikh, H. A Finite Element Modelling to Investigate the Mitigation of Blast Effects on Reinforced Concrete Panel Using Foam Cladding. Int. J. Impact Eng. 2013, 55, 24–33. [Google Scholar] [CrossRef]
  32. Lin, X.; Zhang, Y.X.; Hazell, P.J. Modelling the Response of Reinforced Concrete Panels under Blast Loading. Mater. Des. 2014, 56, 620–628. [Google Scholar] [CrossRef]
  33. Tsonos, E.D.; Kalogeropoulos, G. Analytical Model for the Design of HSFC and UHSFC Jackets with Various Steel Fiber Volume Fraction Ratios for the Retrofitting of RC Beam-Column Joints. Sustainability 2021, 13, 11209. [Google Scholar] [CrossRef]
  34. ACI Committee 544. Guide to Design with Fiber-Reinforced Concrete; ACI: Farmington Hills, MI, USA, 2018; ISBN 9781641950190. [Google Scholar]
  35. Rilem, T.C. 162-TDF Final Recommendation of RILEM 162-TDF: Test and Design Methods for Steel Fibre Rein-Forced Concrete σ-ε Design Method. Mater. Struct. 2003, 36, 560–567. [Google Scholar] [CrossRef]
  36. CEB-FIB-Model Code 2010: First Complete Draft; Feédeération Internationale du Beéton: Lausanne, Switzerland, 2010; ISBN 9782883940956.
  37. Venkateshwaran, A.; Tan, K.H.; Li, Y. Residual Flexural Strengths of Steel Fiber Reinforced Concrete with Multiple Hooked-End Fibers. Struct. Concr. 2018, 19, 352–365. [Google Scholar] [CrossRef]
  38. Abbass, W.; Khan, M.I.; Mourad, S. Evaluation of Mechanical Properties of Steel Fiber Reinforced Concrete with Different Strengths of Concrete. Constr. Build. Mater. 2018, 168, 556–569. [Google Scholar] [CrossRef]
Figure 1. Fiber contribution to tensile/flexural performance, obtained from flexural test, showing softening and hardening behaviors.
Sustainability 14 00298 g001
Figure 2. Schematics of a typical stress–strain diagram for FRC in uniaxial tension and compression, according to RILEM TC 162-TDF (2003) and Vandewalle (2003).
Sustainability 14 00298 g002
Figure 3. Inverse analysis of beam in bending performed to obtain stress–crack opening relation.
Sustainability 14 00298 g003
Figure 4. Simplified post-crack constitutive laws: stress–crack opening (continuous and dashed lines refer to softening and hardening post-crack behavior, respectively).
Sustainability 14 00298 g004
Figure 5. Stress–strain relations for the SLS for softening (a) and hardening (b) behavior of FRC.
Sustainability 14 00298 g005
Figure 6. Material behavior input.
Sustainability 14 00298 g006
Figure 7. Comparison of the experimental study [38] with the established material model (w/c = 0.45, Vf = %0.5 and fiber length (Lf) is, respectively (a) 40, (b) 50, (c) 60 mm).
Sustainability 14 00298 g007
Figure 8. Comparison of the experimental study [17] with the established material model (SP60 and SP45 contains 60 kg/m3 and 45 kg/m3 steel fiber, respectively).
Sustainability 14 00298 g008
Figure 9. (a) surface pressure applied to the panel, (b) support details on the back surface of the panel, (c) von Misses stresses.
Sustainability 14 00298 g009
Figure 10. Boundary conditions.
Sustainability 14 00298 g010
Figure 11. Description of abbreviations used in graphics.
Sustainability 14 00298 g011
Figure 12. Surface pressure–displacement graphs of panels with boundary condition-1 and SP45 material. (a) 600 mm long panel (b) 750 mm long panel (c) 900 mm long panel (d) 1050 mm long panel (e) 1200 mm long panel (f) 1350 mm long panel (g) 1500 mm long panel.
Sustainability 14 00298 g012
Figure 13. Surface pressure–displacement graphs of panels with boundary condition-2 and SP45 material. (a) 600 mm long panel (b) 750 mm long panel (c) 900 mm long panel (d) 1050 mm long panel (e) 1200 mm long panel (f) 1350 mm long panel (g) 1500 mm long panel.
Sustainability 14 00298 g013
Figure 14. Surface pressure–displacement graphs of panels with boundary condition-7 and SP45 material (a) 600 mm long panel. (b) 900 mm long panel (c) 1200 mm long panel (d) 1500 mm long panel.
Sustainability 14 00298 g014
Figure 15. Surface pressure–displacement graphs of panels with boundary condition-8 and SP45 and SP60 material. (a) SP45-750 mm long panel (b) SP45-1050 mm long panel (c) SP45-1350 mm long panel (d) SP60-750 mm long panel (e) SP60-1050 mm long panel (f) SP60-1350 mm long panel.
Sustainability 14 00298 g015
Figure 16. Effect of thickness on the mid-span deflection at ultimate bearing capacity.
Sustainability 14 00298 g016
Figure 17. The variation in the observed ultimate bearing capacity.
Sustainability 14 00298 g017
Figure 18. The variation in the observed mid-span deflection at ultimate bearing capacity.
Sustainability 14 00298 g018
Figure 19. The variation in the observed ultimate mid-span deflection.
Sustainability 14 00298 g019
Figure 20. Comparison of 600 × 750 × 120 sized SP45 panel according to different boundary conditions.
Sustainability 14 00298 g020
Figure 21. Effects of aspect ratio on 2 different boundary conditions.
Sustainability 14 00298 g021
Figure 22. Comparison of the behavior of panels (which have similar boundary conditions and dimension) with different steel fiber content.
Sustainability 14 00298 g022
Table 1. Stress-strain values and size factor κh for FRC in uniaxial tension.
σ 1 = 0.7 f f c t m , f l ( 1.6 d ) ε 1 = σ 1 / E c
σ 2 = 0.45 f R , 1 κ h ε 2 = ε 1 + 0.1
σ 3 = 0.37 f R , 4 κ h ε 3 = 25
κ h = 1.0 0.6 h [ cm ] 12.5 47.5   12 h 60 [ cm ] E c = 9500 ( f f c m ) 1 / 3
Table 2. Empirical equations for LOP and residual flexural strengths.
Mean Flexural Strengths
f L = 0.637 ( f c , ) 0.5 + 1.295 ( R I )
f r , 1 = φ [ 0.320 ( f c , ) 0.5 + 6.214 ( R I ) + 0.034 N 2 ]
f r , 2 = φ [ 0.353 ( f c , ) 0.5 + 7.337 ( R I ) + 0.300 N 2 ]
f r , 3 = φ [ 0.300 ( f c , ) 0.5 + 7.629 ( R I ) + 0.373 N 2 ]
f r , 4 = φ [ 0.284 ( f c , ) 0.5 + 7.018 ( R I ) + 0.343 N 2 ]
φ = (1 + Lf/100)0.5, where Lf is the fiber length in mm.
Table 3. Concrete mixture proportions of the SFRC used in the experimental program (per 1 m3) [17].
MaterialFRC45/SP45 Mass (kg)FRC60/SP60 Mass (kg)
Cement401.7413
Water117.3128
Super-plasticizer 7.77.83
Limestone filler344.3353
Fine river sand178.3176.9
Coarse river sand688.1644.2
Table 4. Calculated material data.
ParametersSP45SP60
fL5.5381135.302593
fR15.4381339.708583
fR26.49150911.58575
fR36.20168211.60656
fR45.77890410.73836
fts2.447164.368862
ftu2.0672273.868854
εsls0.0050.005
εslu0.0250.025
fc6464
ε00.002650.00265
fsfrc65.9084366.54569
ε0,sfrc0.0027390.002769
Table 5. Concrete parameters used in finite element analyses.
Elastic
Young’s modulus (MPa)40,000
Poisson’s ratio0.2
Concrete Damaged Plasticity
PlasticityDilation Angle30
Eccentricity0.1
fb0/fc01
K0.667
Viscosity Parameter0
Dilation Angle30
Compressive Behavior *
Tensile Behavior *
* as presented in Figure 6.
Table 6. Varied parameters.
Panel Thickness (mm)Panel Length (mm)Material Type
80600SP45
100750SP60
120900
1501050
1200
1350
1500
Table 7. Boundary conditions and identification labels.
Boundary ConditionIdentification Label
Only the corners are supported1
Corners, long and short edges are supported every 75 mm2
Corners, long and short edges are supported every 150 mm3
Corners, long and short edges are supported every 100 mm4
Corners, short edges are supported every 100 mm, long edges are supported every 75 mm5
Corners, short edges are supported every 100 mm, long edges are supported every 150 mm6
Corners, long and short edges are supported every 300 mm7
Corners, short edges are supported every 300 mm, long edges are supported every 75 mm8
Corners, short edges are supported every 300 mm, long edges are supported every 150 mm9
Table 8. Test matrix.
Panel DimensionsBoundary Condition: 1Boundary Condition: 4Boundary Condition: 7
Distance between SupportsDistance between SupportsDistance between Supports
Short EdgeLong EdgeShort EdgeLong EdgeShort EdgeLong EdgeShort EdgeLong Edge
600600600600100100300300
600750600750N.A.N.A.
600900600900100100300300
60010506001050N.A.N.A.
60012006001200100100300300
60013506001350N.A.N.A.
Panel DimensionsBoundary Condition: 2Boundary Condition: 5Boundary Condition: 8
Distance between SupportsDistance between SupportsDistance between Supports
Short EdgeLong EdgeShort EdgeLong EdgeShort EdgeLong EdgeShort EdgeLong Edge
6006007575N.A.N.A.
60075075751007530075
6009007575N.A.N.A.
600105075751007530075
60012007575N.A.N.A.
600135075751007530075
Panel DimensionsBoundary Condition: 3Boundary Condition: 6Boundary Condition: 9
Distance between SupportsDistance between SupportsDistance between Supports
Short EdgeLong EdgeShort EdgeLong EdgeShort EdgeLong EdgeShort EdgeLong Edge
600600150150N.A.N.A.
600750150150100150300150
600900150150N.A.N.A.
6001050150150100150300150
6001200150150N.A.N.A.
6001350150150100150300150
For each case 4 different thicknesses (80, 100, 120, 150 mm) and 2 different material types (SP45, SP60) were analyzed. N.A.—Not Analyzed. All dimensions are in mm.
Table 9. Ultimate bearing capacity of panels (SP45).
Thickness (mm)Dimensions (mm)Boundary Condition
123456789
80600 × 6000.072530.328740.274200.31766--0.24633--
600 × 7500.057790.267620.23627-0.264680.25382-0.179370.17748
600 × 9000.048030.230940.215130.22786--0.19106--
600 × 10500.039490.207410.19969-0.205180.20234-0.163500.16202
600 × 12000.030410.191430.187580.18921--0.16131--
600 × 13500.024060.180580.17710-0.179070.17802-0.154670.15349
600 × 15000.019590.172510.169330.17154--0.15292--
Boundary condition
123456789
100600 × 6000.104060.512420.401310.43663--0.31618--
600 × 7500.082830.429520.34566-0.384120.31623-0.263940.26808
600 × 9000.068750.376680.303730.34172--0.29325--
600 × 10500.058880.341810.29285-0.326550.31475-0.249170.25092
600 × 12000.049940.317760.283680.30401--0.24871--
600 × 13500.041160.300800.27522-0.294260.28683-0.241210.24130
600 × 15000.033410.288000.268220.28265--0.24884--
Boundary condition
123456789
120600 × 6000.132770.663750.570720.60517--0.44387--
600 × 7500.105480.571330.47868-0.505860.37945-0.372210.38651
600 × 9000.087570.520880.393590.45882--0.37900--
600 × 10500.074910.486760.40453-0.446930.34863-0.358540.36627
600 × 12000.065240.460190.403800.42214--0.32166--
600 × 13500.057880.439600.39437-0.417270.39423-0.350530.35524
600 × 15000.050500.423780.383570.39813--0.31681--
Boundary condition
123456789
150600 × 6000.171280.833210.733610.74019--0.57018--
600 × 7500.131010.739590.65260-0.640210.62937-0.478900.51539
600 × 9000.113090.648930.560740.58087--0.48797--
600 × 10500.093280.590410.50379-0.585100.41330-0.477660.49321
600 × 12000.081550.551860.472780.49752--0.40727--
600 × 13500.072410.526110.46814-0.533140.39028-0.477110.47976
600 × 15000.065150.508970.458590.44456--0.38442--
Table 10. Mid span deflections of panels at ultimate bearing capacity (SP45).
Thickness (mm)Dimensions (mm)Boundary Condition
123456789
80600 × 60012.911514.60569.4916317.3274--12.4798--
600 × 75013.080713.46557.482-14.848813.5287 4.41574.93346
600 × 90013.374514.28810.58819.86791--15.3179--
600 × 105032.639915.98939.84735-15.471510.3811-4.613433.57038
600 × 120025.726116.86299.210868.2418--12.7707--
600 × 135026.02676.3084310.4836-7.634069.27586-4.755535.26666
600 × 150033.01616.1451911.2388.87702--14.3139--
Boundary condition
123456789
100600 × 60019.952611.927711.73399.89674--15.9611--
600 × 75019.98758.515715.9838-4.037325.72087-4.494027.04968
600 × 90019.981611.73758.716036.18919--17.8297--
600 × 105020.436819.94928.91479-4.0485711.2884-4.578378.12949
600 × 120021.297619.96379.378857.33391--16.8023--
600 × 135088.739518.71599.23104-4.2383212.4873-4.641937.29243
600 × 150032.580421.40979.218619.02847--17.7593--
Boundary condition
123456789
120600 × 60027.479310.361519.1728.48535--21.7452--
600 × 75028.054311.335319.3954-6.141795.40568-4.985711.3457
600 × 90028.03474.862028.442698.43198--22.6803--
600 × 105029.07486.5493715.0341-5.451298.03219-5.0069912.3047
600 × 120028.21537.152413.361311.4847--22.4359--
600 × 135033.67478.6466914.4583-3.9111911.4328-5.1089912.9379
600 × 150067.46819.4351813.326710.4921--25.5155--
Boundary condition
123456789
150600 × 60038.70922.27569.724034.27386--30.344--
600 × 75032.21692.7554315.0296-2.2433711.593-2.199789.44288
600 × 90035.40022.9724713.00584.36278--26.0382--
600 × 105032.15763.181629.31729-2.878957.96021-2.313979.73859
600 × 120032.23122.9054213.58134.53668--20.861--
600 × 135032.03012.9724210.5497-2.802148.14878-2.332869.75593
600 × 150032.61022.8227911.09324.37111--21.1793--
Publisher’s Note: MDPI stays neutral with regard to jurisdictional claims in published maps and institutional affiliations.

