
Determinants of Inclusive Growth in the Context of the Theory of Sustainable Finance in the European Union Countries


Abstract
:1. Introduction
- (1)
- Economic growth, globally and per capita, is no longer used as a basic measure of the wealth of states and nations;
- (2)
- Economic growth is no longer able to stop the stratification of the population in terms of wealth, nor does it guarantee universal access to economic benefits, reduction of the poverty sphere, or a noticeable improvement in the standard of living of the whole society;
- (3)
- There is still an insufficient number of publications on inclusive growth research;
- (4)
- The need to pay attention in research and literature to the modification of the currently implemented model of economic development, and inclusion in the research of measures of exclusion as more and more people take advantage of the benefits of economic growth;
- (5)
- The need to pay attention to the necessity of engaging economic policy decision makers in shaping inclusive growth in a given country. It is the decisions of economic authorities that have a direct impact on improving the quality of life of societies, improving employment opportunities for citizens, managing free time, ensuring proper social and environmental security, health protection, development of the human spiritual sphere, and meeting a number of other conditions for social inclusion of citizens;
- (6)
- Emphasizing the importance of sustainable finances or governance in the process of studying inclusive growth.
2. Literature Review
3. Background Section
- GDP per capita growth (%);
- Median income growth and level (%; USD PPP);
- S80/20 share of income as a ratio;
- Bottom 40% wealth share and top 10% wealth share (% of household net wealth);
- Life expectancy (number of years);
- Mortality from outdoor air pollution (deaths per million inhabitants); and
- Relative poverty rate (%).
- Annual labor productivity growth and level (%, USD PPP);
- Employment-to-population ratio (%);
- Earnings dispersion (inter-decile ratio);
- Female wage gap (%);
- Involuntary part-time employment (%);
- Digital access (businesses using cloud computing services as %); and
- Share of SME loans in total business loans (%).
- Variation in science performance explained by students’ socioeconomic status (%);
- Correlation of earnings outcomes across generations (coefficient);
- Childcare enrolment rate (children aged 0–2) as %;
- Young people neither employed nor in education and training (18–24)%;
- Share of adults who score below Level 1 in both literacy and numeracy (%);
- Regional life expectancy gap (% difference);
- Resilient students (%).
- Confidence in government (%);
- Voter turnout (%);
- Female political participation (%).
- Income per capita (measured by GDP per capita logarithm and the squared term to capture a potential Kuznets curve hypothesis stating that inequalities will grow along with the income in the initial stage of development, and will decrease at higher levels of development [35]);
- Human capital (as an indicator of gross enrollment rate in secondary schools—based on the research that indicates that improved level of education is significantly related to the re-education of the poor and economic growth [36];
- Public spending (as public spending on education and healthcare in % of GDP; its increase should help to reduce income inequalities and poverty);
- Basic needs (as a percentage of population with access to better sanitary conditions, which means that better access to sanitary conditions affects the reduction of poverty);
- Inflation (as a change in consumer price index understood as a factor deepening poverty [40]);
- Financial development and openness (measured by a M2 cash aggregate and Chinn–Ito index that is an indicator of openness to the flows in capital markets [41]; choosing this measure—financial development and openness—was an attempt to examine the relationship between development of financial sector and economic growth, which was described in the economic literature [42,43,44,45,46]);
- Voice and accountability
- Political stability and absence of violence/terrorism
- Government effectiveness
- Regulatory quality
- Rule of law
- Control of corruption
- Policy performance (in this respect, it is checked whether governments care for social, economic, and environmental conditions. The objectives in specific policy areas are monitored here:
- ✓
- Economic policies—economy; labor markets; taxes; budgets; research, innovation and infrastructure; global Financial System;
- ✓
- Social policies—education; social inclusion; health; families; pensions; integration; safe living; global inequalities;
- ✓
- Environmental policies—environment; global environmental protection.
- Democracy (in this respect, trust in governance mechanisms and institutions is examined). In this area the tested features include:
- ✓
- Quality of democracy—electoral processes; access to information; civil rights and political liberties; rule of law.
- Governance (in this area the long-term vision of public policy is examined and the extent to which the institutional solutions of a given country increase the capacity of the public sector to act. This area takes into account:
- ✓
- Executive capacity—strategic capacity; interministerial coordination; evidence-based instruments; societal consultation; policy communication; implementation; adaptability; organizational reform;
- ✓
- Executive accountability—citizens’ participatory competence; legislative actors’ resources; media; parties and interest associations; independent supervisory bodies.
4. Materials and Methods
- Economic,
- Financial,
- Non-wage.
5. Results
6. Discussion
- The inclusive growth rate can be extended to include factors from the climatic area;
- More advanced statistical-econometric research methods can be applied;
- It is worth focusing more on using the digital revolution to promote sustainable development;
- It is also important to strengthen the social model and focus of public authorities on societal welfare.
7. Conclusions
- EU countries are economically and politically diverse;
- The level of economic integration of EU countries is also diversified;
- There is an asymmetry in budgetary and practical cycles in the EU countries;
- There is a divergent approach by economic authorities to the erosion of social protection and exclusion across the EU;
- In the developed index of inclusive growth, factors of significant importance for its level may have been omitted.
Author Contributions
Funding
Data Availability Statement
Acknowledgments
Conflicts of Interest
Appendix A

| Country | Voice and Accountability | Political Stability and Absence of Violence/Terrorism | Government Effectiveness | |||
|---|---|---|---|---|---|---|
| Governance (−2.5 to +2.5) | Percentile Rank | Governance (−2.5 to +2.5) | Percentile Rank | Governance (−2.5 to +2.5) | Percentile Rank | |
| Austria | 1.40 | 95.7 | 0.85 | 74.5 | 1.66 | 94.7 |
| Belgium | 1.28 | 90.8 | 0.59 | 64.6 | 1.12 | 83.7 |
| Bulgaria | 0.26 | 56.0 | 0.47 | 60.8 | −0.07 | 50.5 |
| Croatia | 0.58 | 64.3 | 0.61 | 65.6 | 0.44 | 68.8 |
| Cyprus | 0.91 | 75.4 | 0.29 | 56.1 | 0.88 | 77.4 |
| Czech Republic | 0.98 | 79.2 | 0.92 | 79.2 | 0.96 | 78.8 |
| Denmark | 1.52 | 97.6 | 0.94 | 81.6 | 1.89 | 98.1 |
| Estonia | 1.17 | 88.4 | 0.71 | 70.3 | 1.34 | 88.5 |
| Finland | 1.62 | 99.5 | 0.94 | 82.1 | 1.95 | 99.0 |
| France | 1.07 | 82.6 | 0.31 | 56.6 | 1.25 | 86.5 |
| Germany | 1.38 | 94.2 | 0.67 | 68.9 | 1.36 | 88.9 |
| Greece | 0.97 | 78.7 | 0.13 | 51.4 | 0.44 | 69.2 |
| Hungary | 0.39 | 58.9 | 0.86 | 75.0 | 0.58 | 72.1 |
| Ireland | 1.39 | 95.2 | 0.98 | 83.0 | 1.48 | 90.9 |
| Italy | 1.06 | 82.1 | 0.44 | 59.9 | 0.40 | 67.3 |
| Latvia | 0.87 | 73.4 | 0.46 | 60.4 | 0.88 | 76.9 |
| Lithuania | 1.01 | 80.2 | 0.87 | 75.5 | 1.06 | 82.7 |
| Luxembourg | 1.50 | 96.6 | 1.23 | 93.9 | 1.84 | 97.1 |
| Malta | 1.12 | 84.5 | 0.95 | 82.5 | 1.04 | 81.7 |
| Netherlands | 1.53 | 98.1 | 0.85 | 74.1 | 1.85 | 97.6 |
| Poland | 0.62 | 66.7 | 0.57 | 63.2 | 0.38 | 66.3 |
| Portugal | 1.26 | 89.9 | 1.03 | 85.8 | 1.02 | 81.3 |
| Romania | 0.58 | 65.2 | 0.59 | 63.7 | −0.22 | 42.8 |
| Slovak Republic | 0.88 | 74.9 | 0.64 | 67.5 | 0.54 | 71.6 |
| Slovenia | 0.94 | 78.3 | 0.71 | 69.8 | 1.17 | 85.6 |
| Spain | 1.01 | 80.7 | 0.40 | 58.0 | 0.89 | 77.9 |
| Sweden | 1.50 | 97.1 | 1.02 | 85.4 | 1.72 | 95.7 |
| Country | Regulatory Quality | Rule of Law | Control of Corruption | |||
|---|---|---|---|---|---|---|
| Governance (−2.5 to +2.5) | Percentile Rank | Governance (−2.5 to +2.5) | Percentile Rank | Governance (−2.5 to +2.5) | Percentile Rank | |
| Austria | 1.40 | 90.9 | 1.81 | 97.1 | 1.51 | 90.9 |
| Belgium | 1.35 | 88.9 | 1.37 | 88.9 | 1.48 | 89.9 |
| Bulgaria | 0.52 | 69.7 | −0.09 | 51.4 | −0.27 | 46.2 |
| Croatia | 0.43 | 65.9 | 0.29 | 62.0 | 0.20 | 61.5 |
| Cyprus | 1.00 | 80.8 | 0.58 | 70.7 | 0.38 | 65.9 |
| Czech Republic | 1.24 | 86.5 | 1.06 | 83.2 | 0.59 | 71.2 |
| Denmark | 1.79 | 97.6 | 1.86 | 98.1 | 2.27 | 100.0 |
| Estonia | 1.54 | 92.8 | 1.38 | 89.4 | 1.61 | 92.3 |
| Finland | 1.85 | 99.0 | 2.08 | 100.0 | 2.20 | 99.5 |
| France | 1.20 | 85.6 | 1.33 | 88.0 | 1.15 | 84.6 |
| Germany | 1.58 | 93.3 | 1.56 | 91.3 | 1.86 | 95.2 |
| Greece | 0.55 | 72.1 | 0.32 | 63.0 | 0.06 | 58.7 |
| Hungary | 0.48 | 67.8 | 0.51 | 67.8 | 0.10 | 60.6 |
| Ireland | 1.47 | 91.8 | 1.50 | 90.4 | 1.57 | 91.3 |
| Italy | 0.50 | 68.3 | 0.24 | 60.6 | 0.54 | 69.2 |
| Latvia | 1.19 | 85.1 | 0.96 | 81.3 | 0.72 | 75.5 |
| Lithuania | 1.09 | 83.2 | 0.99 | 81.7 | 0.81 | 79.8 |
| Luxembourg | 1.84 | 98.6 | 1.79 | 95.7 | 2.06 | 96.6 |
| Malta | 1.22 | 86.1 | 0.92 | 78.8 | 0.37 | 64.9 |
| Netherlands | 1.75 | 96.6 | 1.76 | 94.7 | 2.03 | 96.2 |
| Poland | 0.89 | 76.4 | 0.54 | 69.2 | 0.65 | 73.1 |
| Portugal | 0.83 | 75.5 | 1.18 | 85.1 | 0.75 | 76.9 |
| Romania | 0.38 | 64.4 | 0.37 | 64.4 | −0.03 | 54.8 |
| Slovak Republic | 0.78 | 74.5 | 0.68 | 73.6 | 0.44 | 66.3 |
| Slovenia | 0.92 | 77.4 | 1.07 | 83.7 | 0.81 | 79.3 |
| Spain | 0.77 | 73.6 | 0.90 | 78.4 | 0.74 | 76.4 |
| Sweden | 1.68 | 95.2 | 1.81 | 96.6 | 2.13 | 98.1 |
| Country | Policy Performance | Democracy | Governance | |||
|---|---|---|---|---|---|---|
| Economic Policies | Social Policies | Environmental Policies | Quality of Democracy | Executive Capacity | Executive Accountability | |
| Austria | 6.5 | 6.3 | 5.8 | 7.4 | 6.0 | 7.5 |
| Belgium | 6.2 | 6.4 | 5.8 | 7.3 | 5.5 | 7.6 |
| Bulgaria | 5.7 | 4.4 | 6.0 | 5.5 | 4.7 | 6.0 |
| Croatia | 5.2 | 4.9 | 6.2 | 5.7 | 4.2 | 5.4 |
| Cyprus | 5.0 | 5.6 | 4.1 | 6.0 | 4.0 | 5.2 |
| Czech Republic | 6.4 | 6.2 | 5.8 | 7.3 | 5.3 | 7.3 |
| Denmark | 7.9 | 7.8 | 8.1 | 8.9 | 8.4 | 8.3 |
| Estonia | 7.3 | 6.8 | 7.1 | 8.6 | 6.7 | 7.6 |
| Finland | 7.2 | 7.3 | 7.7 | 9.1 | 8.4 | 8.6 |
| France | 6.2 | 6.9 | 7.4 | 7.2 | 6.8 | 6.4 |
| Germany | 7.4 | 7.1 | 6.8 | 8.7 | 7.0 | 7.9 |
| Greece | 4.4 | 4.9 | 4.7 | 7.0 | 4.8 | 6.5 |
| Hungary | 5.4 | 4.6 | 5.9 | 3.4 | 4.4 | 4.7 |
| Ireland | 6.8 | 6.6 | 6.4 | 8.2 | 6.8 | 7.1 |
| Italy | 4.5 | 5.5 | 6.2 | 6.9 | 4.9 | 6.2 |
| Latvia | 6.7 | 5.2 | 7.1 | 7.9 | 7.5 | 5.3 |
| Lithuania | 6.9 | 6.0 | 7.0 | 8.1 | 7.2 | 6.8 |
| Luxembourg | 7.2 | 7.5 | 7.3 | 7.6 | 6.6 | 7.9 |
| Malta | 6.7 | 5.7 | 5.1 | 5.8 | 5.8 | 6.5 |
| Netherlands | 7.5 | 6.8 | 6.3 | 7.1 | 6.1 | 6.9 |
| Poland | 6.2 | 5.3 | 4.7 | 4.8 | 4.9 | 6.1 |
| Portugal | 5.8 | 6.0 | 6.2 | 7.6 | 6.2 | 5.8 |
| Romania | 4.9 | 4.6 | 6.0 | 4.9 | 4.1 | 4.9 |
| Slovak Republic | 5.7 | 5.1 | 5.7 | 6.5 | 4.4 | 6.1 |
| Slovenia | 6.1 | 6.6 | 6.5 | 7.3 | 5.0 | 7.1 |
| Spain | 5.6 | 6.5 | 6.7 | 7.3 | 6.6 | 6.6 |
| Sweden | 7.9 | 7.4 | 8.7 | 9.3 | 8.5 | 8.8 |
| Economic Factors | |||||||||
|---|---|---|---|---|---|---|---|---|---|
| Disposable Income Per Capita | GG Deficit/Surplus as % GDP | Gini index | Gross Fixed Formation (Share of Investments by Institutional Sectors as Share of GDP) | Gross Household Savings Rate (Gross Household Savings Rate) | Inflation | Consumption Per Capita | Investment Position | Purchasing Power Adjusted GDP Per Capita | |
| Stimulant (A)/destimulant (D) | S | S | D | S | D | D | S | S | S |
| Average index | 23,104 | −2 | 28 | 23 | 10 | 6 | 77 | −26 | 25,159 |
| Poland | 15,449 | −4.00 | 30.00 | 23.69 | 12.93 | 10.1 | 26.1 | −40.90 | 14,200 |
| Economic factors continue | |||||||||
| Real effective exchange | Short term interest rates—three mounts interbank interest rates | General Government debt jako % PKB | Labor costs (average hourly costs in euro) | Market openness | |||||
| Stimulant (A)/destimulant (D) | S | D | D | D | S | ||||
| Average index | −1 | 8 | 49 | 17 | 102 | ||||
| Poland | 9.70 | 18.9 | 36.4 | 7.11 | 60.00 | ||||
| Financial factors | |||||||||
| Balance of payments as % of GDP | FDI as % of GDP | Pensions in euro per capita | Households with a high financial burden due to the cost of living in% | % of households with credit arrears | R&D expenditure as % of GDP | Government spending on health care as % of GDP | Education expenditure as % of GDP | Social spending as % of GDP | |
| Stimulant (A)/destimulant (D) | S | S | S | D | D | S | S | S | S |
| Average index | 0 | 32 | 3,851 | 32 | 4 | 1 | 2 | 5 | 15 |
| Poland | 0.500 | 5.500 | 1,587.86 | 44.20 | 2.30 | 0.64 | 0.9 | 5.60 | 17.70 |
| Financial factors continue | |||||||||
| Private sector debt as % of GDP | Liabilities of the financial sector as % of GDP | ||||||||
| Stimulant (A)/destimulant (D) | D | D | |||||||
| Average index | 96 | −29.15 | |||||||
| Poland | 35 | −35.90 | |||||||
| Non-wage factors | |||||||||
| House Price Index | Km of motorways per 1000 sq km | Number of self-employed people aged 15–64 in % | Number of patents per capita | Life expectancy in years | % of households using broadband Internet | % of people aged 25–64 with higher education | % of people at risk of social exclusion | % of crime, violence, and vandalism | |
| Stimulant (A)/destimulant (D) | S | S | S | S | S | S | S | D | D |
| Average index | 66 | 16 | 62 | 0 | 76 | 14 | 34 | 28 | 10 |
| Poland | 56.01 | 1.00 | 54.70 | 0.00 | 78.20 | 4.00 | 20.20 | 45.30 | 2.30 |
| Non-wage factors continue | |||||||||
| Unemployment rate in the age of 15–74 | Average number of flats per 1 person in a household | Voice and accountability | Political stability and absence of violence/terrorism | Government effectiveness | Regulatory quality | Rule of law | Control of corruption | ||
| Stimulant (A)/destimulant (D) | D | D | S | S | S | S | S | S | |
| Average index | 9 | 1 | 1 | 1 | 1 | 1 | 1 | 1 | |
| Poland | 16.00 | 1.00 | 1.08 | 0.31 | 0.61 | 0.75 | 0.71 | 0.71 | |
| Standardization of comparable variables | |||||||||
| Economic factors (standardization, indicator for Poland) | Disposable income per capita | GG deficit/surplus as % GDP | Gini index | Gross fixed formation (Share of investments by institutional sectors as share of GDP) | Gross household savings rate (Gross household savings rate) | Inflation | Consumption per capita | Investment position | Purchasing power adjusted GDP per capita |
| 0.18 | 0.44 | 0.43 | 0.48 | 0.24 | 0.80 | 0.10 | 0.52 | 0.06 | |
| Real effective exchange | Short term interest rates—three months of interbank interest rates | General Government debt jako % PKB | Labor costs (average hourly costs in euro) | Market openness | |||||
| 0.87 | 0.68 | 0.70 | 0.84 | 0.05 | |||||
| Financial factors (standardization, indicator for Poland) | Balance of payments as % of GDP | FDI as % of GDP | Pensions in euro per capita | Households with a high financial burden due to the cost of living in% | %of households with credit arrears | R&D expenditure as % of GDP | Government spending on health care as % of GDP | Education expenditure as % of GDP | Social spending as % of GDP |
| 0.500 | 0.011 | 0.088 | 0.339 | 0.842 | 0.113 | 0.121 | 0.758 | 0.676 | |
| Private sector debt as % of GDP | Liabilities of the financial sector as % of GDP | ||||||||
| 0.959 | 0.478 | ||||||||
| Non-wage factors (standardization, indicator for Poland) | House price index | Km of motorways per 1000 sq km | Number of self-employed people aged 15–64 in % | Number of patents per capita | Life expectancy in years | % of households using broadband Internet | % of people aged 25–64 with higher education | % of people at risk of social exclusion | % of crime, violence, and vandalism |
| 0.18 | 0.44 | 0.57 | 0.48 | 0.76 | 0.20 | 0.10 | 0.35 | 0.97 | |
| Unemployment rate in the age of 15–74 | Average number of flats per 1 person in a household | Voice and accountability | Political stability and absence of violence/terrorism | Government effectiveness | Regulatory quality | Rule of law | Control of corruption | ||
| 0.14 | 0.91 | 0.54 | 0.32 | 0.39 | 0.39 | 0.42 | 0.41 | ||
| Partial indicators being the arithmetic mean of the features in the each area | |||||||||
| Economic factors | Financial factors | Non-wage factors | |||||||
| 0.456 | 0.444 | 0.447 | |||||||
| Pseudo-single-feature indicator0.449 | |||||||||
| I Iteration (coefficients of correlation between individual areas and the inclusive development index) | |||||||||
| Economic factors | Financial factors | Non-wage factors | |||||||
| 0.339528 | 0.338945 | 0.403412 | |||||||
| Inclusive growth index for Poland in 20000.448 | |||||||||
References
- Piketty, T. Capital in the Twenty-First Century; Harvard University Press: Cambridge, MA, USA, 2014. [Google Scholar]
- UNDP. Poverty Reduction and UNDP; United Nations Development Programme: New York, NY, USA, 2013. [Google Scholar]
- Ianchovichina, E.; Lundstrom, S. What Is Inclusive Growth? Commodity Price Volatility and Inclusive Growth in Low-Income Countries: Washington, DC, USA, 2009. [Google Scholar]
- The World Bank. The Growth Report: Strategies for Sustained Growth and Inclusive Development; The World Bank: Washington, DC, USA, 2008. [Google Scholar]
- Samans, R.; Blanke, J.; Hanouz, M.D.; Corrigan, G. The Inclusive Growth and Development Report 2017; World Economic Forum: Geneva, Switzerland, 2017. [Google Scholar]
- Ranieri, R.; Ramos, R.A. Inclusive Growth: Building up A Concept March 2013. Available online: http://www.ipc-undp.org/pub/IPCWorkingPaper104.pdf (accessed on 16 November 2021).
- Grömling, M.; Klös, H.-P. Inclusive Growth—Institutions Matter! Intereconomics 2019, 54, 184–192. [Google Scholar] [CrossRef] [Green Version]
- European Union. EUROPE 2020 A European Strategy for Smart, Sustainable and Inclusive Growth; European Commission: Brussels, Belgium, 2010. [Google Scholar]
- Onofrei, M.; Gavrilută (Vatamanu), A.; Bostan, I.; Oprea, F.; Paraschiv, G.; Lazăr, C.M. The Implication of Fiscal Principles and Rules on Promoting Sustainable Public Finances in the EU Countries. Sustainability 2020, 12, 2772. [Google Scholar] [CrossRef] [Green Version]
- European Comission. Treaty on STABILITY, Coordination and Governance in the Economic and Monetary Union; European Comission: Brussels, Belgium, 2012. [Google Scholar]
- Dethier, S.; Levick, K. A Vision for Sustainable finance in Europe. Available online: https://www.e3g.org/publications/a-vision-for-sustainable-finance-in-europe/ (accessed on 16 November 2021).
- Kraay, A. When Is Growth Pro-Poor?: Cross-Country Evidence; IMF Working Paper: Washington, DC, USA, 2004; Volume 4. [Google Scholar]
- Berg, A.G.; Ostry, J.D. Inequality and Unsustainable Growth: Two Sides of the Same Coin? IMF Econ. Rev. 2017, 65, 792–815. [Google Scholar] [CrossRef] [Green Version]
- Ianchovichina, E.; Gable, S.L. What Is Inclusive Growth. In Commodity Prices and Inclusive Growth in Low-Income Countries; Arezki, R., Pattillo, C., Quintyn, M., Zhu, M., Eds.; International Monetary Fund: Washington, DC, USA, 2012. [Google Scholar]
- Opportunities for All. A Framework for Policy Action on Inclusive Growth; OECD: Paris, France, 2018. [Google Scholar]
- Aizenman, J.; Lee, M.; Park, D. The Relationship between Structural Change and Inequality: A Conceptual Overview with Special Reference to Developing Asia; ADBI Working Paper: 2012; Volume 2012. Available online: https://www.adb.org/publications/relationship-between-structural-change-and-inequality-conceptual-overview-special (accessed on 16 November 2021).
- Acemoglu, D.; Skills, D.A. Tasks and Technologies: Implications for Employment and Earnings; NBER Working Paper: Cambridge, MA, USA, 2011; Volume 16082. [Google Scholar]
- Anand, R.; Mishra, S.; Peiris, S.J. Inclusive Growth Revisited: Measurement and Determinants; Economics Premise, World Bank: Washington, DC, USA, 2013; Volume 122. [Google Scholar]
- Barro, R.J.; Lee, J.-W. International Data on Educational Attainment: Updates and Implications; Center for International Development Working Paper: Cambridge, MA, USA, 2000; Volume 42. [Google Scholar]
- Dollar, D.; Kraay, A. Growth Is Good for the Poor. J. Econ. Growth 2002, 7, 195–225. [Google Scholar] [CrossRef]
- Alekhina, V.; Ganelli, G. Determinants of Inclusive Growth in ASEAN; IMF Working Paper: Washington, DC, USA, 2020; Volume WP/20/18. [Google Scholar]
- Anand, R.; Mishra, S.; Peiris, S.J. Inclusive Growth: Measurement and Determinants; IMF Working Paper: Washington, DC, USA, 2013; Volume WP/13/135. [Google Scholar]
- Aoyagi, C.; Ganelli, G. Asia’s Quest for Inclusive Growth Revisited. J. Asian Econ. 2015, 40, 29–46. [Google Scholar] [CrossRef]
- Aoyagi, C.; Ganelli, G.; Murayama, K. How Inclusive Is Abenomics? J. Int. Commer. Econ. Policy 2016, 7, 1650005. [Google Scholar] [CrossRef]
- Benabou, R. Unequal Societies: Income Distribution and the Social Contract. Am. Econ. Rev. 2000, 90, 96–129. [Google Scholar] [CrossRef] [Green Version]
- Garcia-Penalosa, C.; Turnovsky, S. Growth, Income Inequality, and Fiscal Policy: What Are the Relevant Trade-offs? J. Money Credit. Bank. 2007, 39, 369–394. [Google Scholar] [CrossRef]
- Stawska, J.; Malaczewski, M.; Malaczewska, P.; Stawasz-Grabowska, E. The Nash equilibrium in the policy mix model for Czechia, Hungary, and Romania. Cogent Econ. Financ. 2021, 9, 1869380. [Google Scholar] [CrossRef]
- Romer, C.; Romer, D. Monetary Policy and the Well-Being of the Poor; NBER Working Paper: Washington, DC, USA, 1998; Volume 6793. [Google Scholar]
- Albanesi, S. Inflation and inequality. J. Monet. Econ. 2007, 54, 1088–1114. [Google Scholar] [CrossRef] [Green Version]
- Stiglitz, J.E.; Sen, A.; Fitoussi, J.-P. Report by the Commission on the Measurement of Economic Performance and Social Progress; European Commission: Paris, France, 2009; Available online: https://ec.europa.eu/eurostat/documents/8131721/8131772/Stiglitz-Sen-Fitoussi-Commission-report.pdf (accessed on 16 November 2021).
- Acemoglu, D.; Robinson, J.R. Why Nations Fail: The Origins of Power, Prosperity, and Poverty; Random House: New York, NY, USA, 2012. [Google Scholar]
- Ali, I.; Son, H.H. Measuring Inclusive Growth. Meas. Incl. Growth 2007, 24, 11–31. [Google Scholar]
- United Nations Development Programme. Human Development Reports. Available online: http://hdr.undp.org/en/content/human-development-index-hdi (accessed on 12 October 2021).
- Doumbia, D. The quest for pro-poor and inclusive growth: The role of governance. Appl. Econ. 2019, 51, 1762–1783. [Google Scholar] [CrossRef]
- Barro, R. Inequality and Growth Revisited. In Asian Development Bank Working Paper Series on Regional Economic Integration; ADB Working Paper Series on Regional Economic Integration: Mandaluyong City, PN, USA, 2008; Volume 11. [Google Scholar]
- Barro, R.; Sala-i-Martin, X. Economic Growth; MIT: Cambridge, MA, USA, 2004. [Google Scholar]
- Le Goff, M.; Singh, R.J. Does Trade Reduce Poverty? A View from Africa. J. Afr. Trade 2014, 1, 5–14. [Google Scholar] [CrossRef] [Green Version]
- Kpodar, K.; Singh, R. Does Financial Structure Matter for Poverty? Evidence from Developing Countries; Policy Research Working Paper; World Bank: Washington, DC, USA, 2011; Volume WPS5915, Available online: https://openknowledge.worldbank.org/bitstream/handle/10986/3685/WPS5915.pdf?sequence=1&isAllowed=y (accessed on 16 November 2021). [CrossRef] [Green Version]
- Guillaumont-Jeanneney, S.; Kpodar, K. Financial Development and Poverty Reduction: Can There Be a Benefit without a Cost? J. Dev. Stud. 2011, 47, 143–163. [Google Scholar] [CrossRef]
- Powers, E.T. Inflation, Unemployment, and PovertyRevisited. Econ. Rev. Fed. Reserve Bank Clevel. Q. 1995, 3, 2–13. [Google Scholar]
- Chinn, M.; Ito, H. A New Measure of Financial Openness. J. Comp. Policy Anal. 2008, 10, 309–322. [Google Scholar] [CrossRef]
- Kollmeyer, C.; Peters, J. Financialization and the Decline of Organized Labor: A Study of 18 Advanced Capitalist Countries, 1970–2012. Soc. Forces 2019, 98, 22. [Google Scholar] [CrossRef]
- Adams, A.; Glück, T. Financialization in commodity markets: A passing trend or the new normal? J. Bank. Financ. 2015, 60, 108. [Google Scholar] [CrossRef] [Green Version]
- Hein, E.; van Treeck, T. Financialisation’ in Kaleckian/Post Kaleckian models of distribution and growth. Macroecon. Policy Inst. Work. Pap. 2007, 7, 3. [Google Scholar]
- Assa, J. Financialization and its consequences: The OECD experience. Financ. Res. 2012, 1, 35–37. [Google Scholar]
- Palley, T.I. Financialization: What it is and Why it Matters? Macroecon. Policy Inst. (IMK) Hans-Boeckler-Found. Work. Pap. 2008, 4, 11. [Google Scholar]
- Cysne, R.P. On the positive correlation netween income inequality and unemployment. Rev. Econ. Stat. 2009, 91, 218–226. [Google Scholar] [CrossRef]
- Castells-Quintana, D.; Royuela, V. Unemployment and long-run economic growth: The role of income inequality and urbanisation. Investig. Reg. J. Reg. Res. 2012, 24, 153–173. [Google Scholar]
- Acemoglu, D.; Robinson, J.A. The Role of Institutions in Growth and Development; The International Bank for Reconstruction and Development; The World Bank: Washington, DC, USA, 2008; Volume 10. [Google Scholar]
- Campos, N.F.; Nugent, J.B. Development Performance and the Institutions of Governance: Evidence from East Asia and Latin America. World Dev. 1999, 27, 439–452. [Google Scholar] [CrossRef]
- Kaufmann, D.; Kraay, A.; Zoido-Lobaton, P. Governance Matters; Policy Research Working Paper; World Bank: Washington, DC, USA, 1999; Volume 2196. [Google Scholar]
- Knack, S.; Keefer, P. Does Social Capital Have an Economic Payoff? Q. J. Econ. 1997, 112, 1251–1288. [Google Scholar] [CrossRef]
- Kaufmann, D.; Kraay, A. Growth without Governance; Policy Research Working Paper; World Bank: Washington, DC, USA, 2002; Volume 2928. [Google Scholar]
- United Nations Development Programme. Governance for Sustainable Human Development; United Nations: New York, NY, USA, 1997. [Google Scholar]
- World Bank. Governance and Development; World Bank: Washington, DC, USA, 1992. [Google Scholar]
- Kaufmann, D.; Kraay, A.; Mastruzzi, M. The Worldwide Governance Indicators: Methodology and Analytical Issues; Policy Research Working Paper; World Bank: Washington, DC, USA, 2010; Volume 5430. [Google Scholar]
- World Bank. Worldwide Governance Indicators. Available online: http://info.worldbank.org/governance/wgi/Home/Reports (accessed on 6 October 2021).
- Gupta, S.; Keen, M.; Clements, B.; de Mooij, R. Inequality and Fiscal Policy; International Monetary Fund: Washington, DC, USA, 2015. [Google Scholar]
- Bertelsmann Stiftung. SGI Publications. Available online: https://www.sgi-network.org/2020/Publications (accessed on 14 October 2021).
- Schiller, C.; Hellmann, T.; Paulini, P. SGI Codebook, Sustainable Governance Indicators 2020; Dollacker & Waldik GbR: Berlin, Germany, 2020. [Google Scholar]
- Schraad—Tischler, D.; Seelkopf, L. Concept and Methodology—Sustainable Governance Indicators 2015; Dollacker & Waldik GbR: Berlin, Germany, 2015. [Google Scholar]
- Hartmann, H. High vulnerability to crisis. In Governance in International Perspective; Policy Brief: Gütersloh, Germany, 2020; Volume 1. [Google Scholar]
- Schiller, C.; Hellmann, T. Major Differences in the Conditions for Successful COVID-19 Crisis Management—SGI Findings Shed Light on States’ COVID-19 Crisis Vulnerability; Policy Brief: Gütersloh, Germany, 2021; Volume 1. [Google Scholar]
- Balasubramanian, S.; Bounader, L.; Bricco, J.; Vasilyev, D. Is There a One-Size-Fits-All Approach to Inclusive Growth? A Case Study Analysis; IMF Working Paper, International Monetary Fund: Washington, DC, USA, 2021; Volume 111. [Google Scholar]
- European Commission. Eurostat Database. September 2021. Available online: https://ec.europa.eu/eurostat/data/database (accessed on 29 October 2021).
- Acemoglu, D. Introduction to Modern Economic Growth; Princeton University Press: Princeton, NJ, USA, 2009. [Google Scholar]
- Ghosh, S.; Gregoriu, A. The composition of government spending and growth: Is current or capital spending better? Oxf. Econ. Pap. 2008, 60, 484–516. [Google Scholar] [CrossRef] [Green Version]
- Benos, N. Fiscal Policy and Economic Growth: Empirical Evidence from EU Countries; MPRA Munich Personal RePEc Archive: Munich, Germany, 2009. [Google Scholar]
- Romer, P.M. Endogenous Technological Change. J. Political Econ. 1990, 98, S71–S102. [Google Scholar] [CrossRef] [Green Version]
- Barro, R. Determinants of economic Growth in a Panel of Countries. Ann. Econ. Financ. 2003, 4, 231–274. [Google Scholar]
- De Vita, G.; Kyaw, K. Growth effects of FDI and portfolio investment flows to developing countries: A disaggregated analysis by income levels. Appl. Econ. Lett. 2009, 16, 277–283. [Google Scholar] [CrossRef]
- Nowak, A.; Ryć, K. Oszczędności w okresie transformacji [The Role of Savings in the Period of Economical Transformation]. Studia Eur. Cent. Eur. Uniw. Warsz. [Stud. Eur. Aff. CE UW] 2002, 2, 25–44. [Google Scholar]
- Cooray, A.v. Government expenditure, governance and economic growth. Comp. Econ. Stud. 2009, 51, 401–418. [Google Scholar] [CrossRef]
- Godlewska-Majkowska, H. Atrakcyjność Inwestycyjna Polskich Regionów. W Poszukiwaniu Nowych Miar [Investment Attractiveness of Polish Regions. In Search of New Measures]; Szkoła Główna Handlowa [Warsaw School of Economics]: Warsaw, Poland, 2008. [Google Scholar]
- European Court of Auditors. COVID-19 Crisis Risks Widening the Economic Gap Between EU countries. December 2020. Available online: https://www.eca.europa.eu/Lists/News/NEWS2012_09/INRW_Economic_response_to_Covid19_EN.pdf (accessed on 29 October 2021).
- Stawska, J. Dependencies between Variables from theArea ofthe Monetary and Fiscal Policy inthe European Union Countries. Comparative Economic Research. Cent. East. Eur. 2021, 24, 7–25. [Google Scholar]
- Ministry of Economic Development and Technology. Informacje o Państwach I Współpracy Gospdoarczej z Polską (Information on Countries and Economic Cooperation with Poland). Website of the Republic of Poland. 20 October 2021. Available online: https://www.gov.pl/web/rozwoj-technologia/informacje-o-panstwach-i-wspolpracy-gospodarczej-z-polska (accessed on 2 November 2021).
- Terazi, E.; Senel, S. The Effects of the Global Financial Crisis on the Central and Eastern European Union Countries. Int. J. Bus. Soc. Sci. 2011, 2, 191–192. [Google Scholar]
- Stawska, J.; Reis, P.M. Expansionary or restrictive policies in the Eurozone? Dominating trends in the first two decades. Acta Oeconomic 2021, 71, 405–430. [Google Scholar] [CrossRef]
- World Economic Forum. The Inclusive Development Index 2018 Summary and Data Highlights. Geneva. 2018. Available online: https://www3.weforum.org/docs/WEF_Forum_IncGrwth_2018.pdf (accessed on 29 October 2021).
- Zielenkiewicz, M. Diversity in the European Union in terms of inclusive development. Res. Pap. Wroc. Univ. Econ. Bus. 2020, 64, 206. [Google Scholar] [CrossRef]
- Polish Economic Institute. The Scandinavian Countires Proved to be the World’s Most Developed Economies in the Responsible Development Index Ranking. 30 October 2021. Available online: https://pie.net.pl/en/polska-na-32-miejscu-w-indeksie-odpowiedzialnego-rozwoju/ (accessed on 30 October 2021).
- What Puts Nordic Countires at the top of the Sustainability Rankings? Sustainability for All. 2 November 2021. Available online: https://www.activesustainability.com/sustainable-development/nordic-countries-top-sustainability-rankings/?_adin=02021864894 (accessed on 2 November 2021).
- Stawska, J.; Malaczewski, M.; Szymańska, A. Combined monetary and fiscal policy: The Nash Equilibrium for the case of non-cooperative game. Econ. Res.-Ekon. Istraz. 2019, 32, 3554–3569. [Google Scholar] [CrossRef]
| Variable | Description | S/D |
|---|---|---|
| ECONOMY | ||
| Disposable income per capita | The index reflects the purchasing power of households and their ability to invest in goods and services or to save for the future by taking into account taxes and social security contributions and social benefits in kind and in cash. It is calculated as adjusted gross disposable income of households and non-profit institutions serving households (NPISH) divided by the purchasing power parities (PPP) of actual individual consumption of households and the total number of inhabitants. The variable was presented at constant prices from 2015 (an adjustment for the inflation index was made). | S |
| GG deficit/surplus as % GDP | General government: a deficit/surplus is defined as a general government deficit/surplus of government and local government institutions included in the Maastricht Treaty as general government net credit (+)/net borrowing (−) according to the European System of Accounts (ESA). The general government sector includes central government, state government, local government, and social security funds. | S |
| Gini index | The Gini index shows the income inequality of a given society—it should be interpreted in a way that the higher it is, the greater the income inequality in a given country. When the value of the index is 0%, it means that all people receive the same income. | D |
| Gross fixed formation (share of investments by institutional sectors as share of GDP) | This indicator shows investments for the economy as a whole, government, business, and household sectors. The indicator gives the share of GDP that is used for gross investment (and not for consumption or export, for example). It is defined as gross fixed capital formation (GFCF) expressed as a percentage of GDP for the government, business, and household sectors. The GFCF consists of acquisitions of resident producers less disposals of fixed assets plus certain additions to the value of non-produced assets realized as part of productive activities, such as land improvements. Fixed assets include, for example, apartments, other buildings and structures (roads, bridges, etc.), machinery and equipment, but also intangible assets such as computer software and other intellectual property. | S |
| Gross household savings rate (gross household savings rate) | Savings is the portion of a household’s disposable income that is not spent on consumption over a period of time. The saving scale can be measured by the household saving rate, which is defined as the savings of households in proportion to their disposable income. | D |
| Inflation | The most important effects of inflation, noticeable for citizens—apart from the obvious increase in prices in shops—are: hindered running of business—in conditions of high or fluctuating inflation, entrepreneurs may find it difficult to set prices for their products and services in the future, and fewer investments—the result of dynamic fluctuating inflation is more difficult access to credit and more cautious approach of entrepreneurs to investments, more expensive mortgage loans—this is a possible effect of inflation that affects most citizens. In conditions of economic uncertainty, banks hedge themselves with a higher margin and a minimal own contribution, which limits the possibility of buying a flat or a house, higher taxes—because governments are late in adjusting tax thresholds to inflation, in times of widespread price increases, citizens pay really higher taxes. | D |
| Consumption per capita | Consumption per capita measured as a percentage of the total EU-28 (2013–2020) per capita (converted into million euro) in current prices. It is a measure of the material well-being of households based on the revised purchasing power parity as well as GDP and population. | S |
| Investment position | The international investment position is a statistical statement that shows at a point in time the value and composition of: financial assets of residents of an economy that are claims on non-residents and gold bullion held as reserve assets, and liabilities of residents of an economy to non-residents. The difference between external financial assets and liabilities of an economy is the net MPI of the economy, which can be positive or negative. Accordingly, the net international investment position (MPI) provides an aggregate picture of a country’s net financial position (assets minus liabilities) compared with the rest of the world. It allows for the flow-state analysis of the country’s external position. The MIP scoreboard indicator is the net international investment position expressed as a percentage of GDP. The indicative threshold is −35%. | S |
| Purchasing power adjusted GDP per capita | Gross domestic product (GDP) is a measure of economic activity. It refers to the value of the total production of goods and services produced in the economy, less intermediate consumption, plus net taxes on products and imports. GDP per capita is calculated as the ratio of GDP to the average population in a given year. The basic figures are expressed in purchasing power standards (PPS), which represent a common currency that eliminates differences in price levels between countries to allow meaningful comparisons of GDP volumes. | S |
| Real effective exchange | The real effective exchange rate (REER) aims to assess the price or cost competitiveness of a country in relation to its main competitors in international markets. Changes in cost and price competitiveness depend not only on changes in exchange rates, but also on cost and price trends. The specific REER for the MIP is reduced by consumer price indices (double export weights are used to calculate REER, reflecting not only competition in the home markets of different competitors, but also competition in export markets elsewhere) | S |
| Short term interest rates—three mounts interbank interest rates | These are interest rates on deposits and loans on the interbank market for a period not exceeding one year; short-term interest rates in the interbank market are significantly influenced by the decisions of central banks concerning the level of basic interest rates. | D |
| Trade openness | Trade openness refers to the orientation of a country’s economy in the context of international trade. The degree of openness is measured by the actual volume of registered imports and exports of the economy. The measure takes into account national accounts and trade (GDP, imports and exports). The index is calculated as the sum of imports and exports divided by GDP. | S |
| FINANCE | ||
| Balance of payments as % of GDP | The capital account covers all transactions that involve the receipt or payment of a capital account. It includes the acquisition/disposal of non-produced non-wage assets and capital transfers. The capital account together with the current and financial accounts creates the balance of payments (BoP). It is expressed as % of GDP. | S |
| FDI as % of GDP | Foreign direct investment (FDI) is a category of investment that reflects the objective of establishing a lasting holding of a resident enterprise in one economy (direct investor) in an enterprise (direct investment enterprise) that is resident in an economy other than the direct investor. FDI flows include:
| S |
| Pensions in euro per capita | A monthly cash benefit due to an insured person who ceased professional activity for working for a specified number of years and after reaching a certain age. Expressed in euro per capita at constant prices. | S |
| Households with a high financial burden due to the cost of living in% | Housing expenses are one of the distinguishing features of economic and social life. The measure is expressed as % of per capita disposable income available after paying housing costs. | D |
| % of households with credit arrears | The measure shows the % of households with arrears due to the timely repayment of loans for current needs. | D |
| R&D expenditure as % of GDP | Research and experimental development (R&D) covers creative work undertaken in a systematic way to increase the body of knowledge, including knowledge about humans, culture and society, and to use this body of knowledge to develop new applications. The measure is expressed as the share of R&D expenditure in GDP. | S |
| Government spending on health care as % of GDP | The measure shows the share of government expenditure on health protection in relation to GDP. | S |
| Education expenditure as % of GDP | The measure shows the share of government expenditure on science and education in relation to GDP. | S |
| Social spending as % of GDP | Social expenses result from the social policy conducted by the state. Generally speaking, these are expenses transferred from public funds to households in the form of various types of cash and material benefits and services, as well as expenses for the functioning of public institutions that support these expenses. The main social spending includes social security, health insurance, social assistance, family benefits, and labor market policy expenditure. Social expenses are implemented through state earmarked funds, multi-annual programs, and European funds. The measure is expressed as % of GDP. | S |
| Private sector debt as % of GDP | Private sector debt is the stock of liabilities held by the sectors of non-financial corporations, households, and non-profit institutions serving households. Instruments taken into account in compiling private sector debt are debt securities and loans. The MIP Scoreboard Indicator is the size of private sector debt as a percentage of GDP. The indicative threshold for private sector debt is 133%. | D |
| Liabilities of the financial sector as % of GDP | Total liabilities of financial institution sector measures the evolution of total liabilities (including cash and deposits, debt securities, loans, stocks and mutual fund shares, insurance, pensions and standard guarantees, employee derivatives and stock options, and other financial corporations’ liabilities). Data are presented on a non-consolidated basis, i.e., the data includes transactions within the same sector. Data are presented as % of GDP and in millions of national currency units. | D |
| NON-WAGE | ||
| House price index | The house price index covers the price changes of all residential properties purchased by households (apartments, detached houses, townhouses, etc.), both new or existing, irrespective of their final destination and previous owners. | S |
| Km of motorways per 1000 sq km | The measure expresses the level of transport accessibility of the EU countries, expressed as the number of kilometers of motorways per 1000 square km of the country’s area. | S |
| Number of self-employed people aged 15–64 in % | The measure expresses a degree of entrepreneurship of an EU country. It is expressed by the % of people aged 15–64 who run their own business (self-employed). | S |
| Number of patents per capita | The indicator measures the number of applications for patent protection of an invention submitted to the European Patent Office (EPO), regardless of whether they were granted or not. The number of applications includes European direct applications filed in the reference year (direct) and international applications (PCT) for which applicants have chosen to protect their invention in Europe by selecting the EPO during the reporting period (PCT region). Applications are allocated according to the applicant’s country of residence as listed on the application form. In cases where several applicants are mentioned in the application form, the country of residence of the first-mentioned applicant will apply (first applicant principle). The country of residence of the (first) applicant is not necessarily the same as the country of residence of the inventor(s). The data shows the total number of applications per country per capita. | S |
| Life expectancy in years | It is equal to the average number of years of life left for a citizen of a given age and group. In a special case, at age 0 (that is, for a newborn), the life expectancy is equal to that of the population in question. | S |
| % of households using broadband Internet | It expresses the level of digitization of society. Calculated as the % of households that use high-speed Internet. | S |
| % of people aged 25–64 with higher education | It expresses the level of education of a society in an EU country. Calculated as % of the population aged 25–64 who have completed higher education. | S |
| % of people at risk of social exclusion | Social exclusion has a negative impact on the quality of human capital, limits activity, entrepreneurship and innovation, and increases the costs of the state’s functioning. It is expressed in %. | D |
| % of crime, violence, and vandalism | The measure expresses the % of acts related to violence/vandalism of the total criminal acts in an EU country. | D |
| Unemployment rate in the age of 15–74 | A statistical value describing the intensity of unemployment in a given population. Most often, the unemployment rate is defined as the ratio of the number of unemployed people to the number of economically active people (the labor force of a given population). Expressed in %. | D |
| Average number of flats per 1 person in a household | It expresses a degree of wealth of the society. Calculated as the number of flats per 1 person in a household. | D |
| Voice and accountability | Perception of the extent to which a country’s nationals can participate in government election, as well as freedom of expression, association, and free media. | S |
| Political stability and absence of violence/terrorism | An index that maps perceptions of the likelihood that a government will be destabilized or overturned by unconstitutional measures or violence, including politically motivated violence and terrorism. | S |
| Government effectiveness | Perception of the quality of public services, the quality of the civil service and its degree of independence from political pressures, the quality of policy formulation and implementation, and the credibility of government involvement in such policies. | S |
| Regulatory quality | Perception of a government’s ability to formulate and implement sound policies and regulations that enable and promote private sector development. | S |
| Rule of law | Perceptions of the extent to which agents trust and adhere to the rules of society, in particular the quality of contract enforcement, property rights, the police and the courts as well as the likelihood of crime and violence. | S |
| Control of corruption | Perception of the extent to which public power is exercised for private gains, including both minor and major forms of corruption, as well as elite “seizure” of the state and private interests. | S |
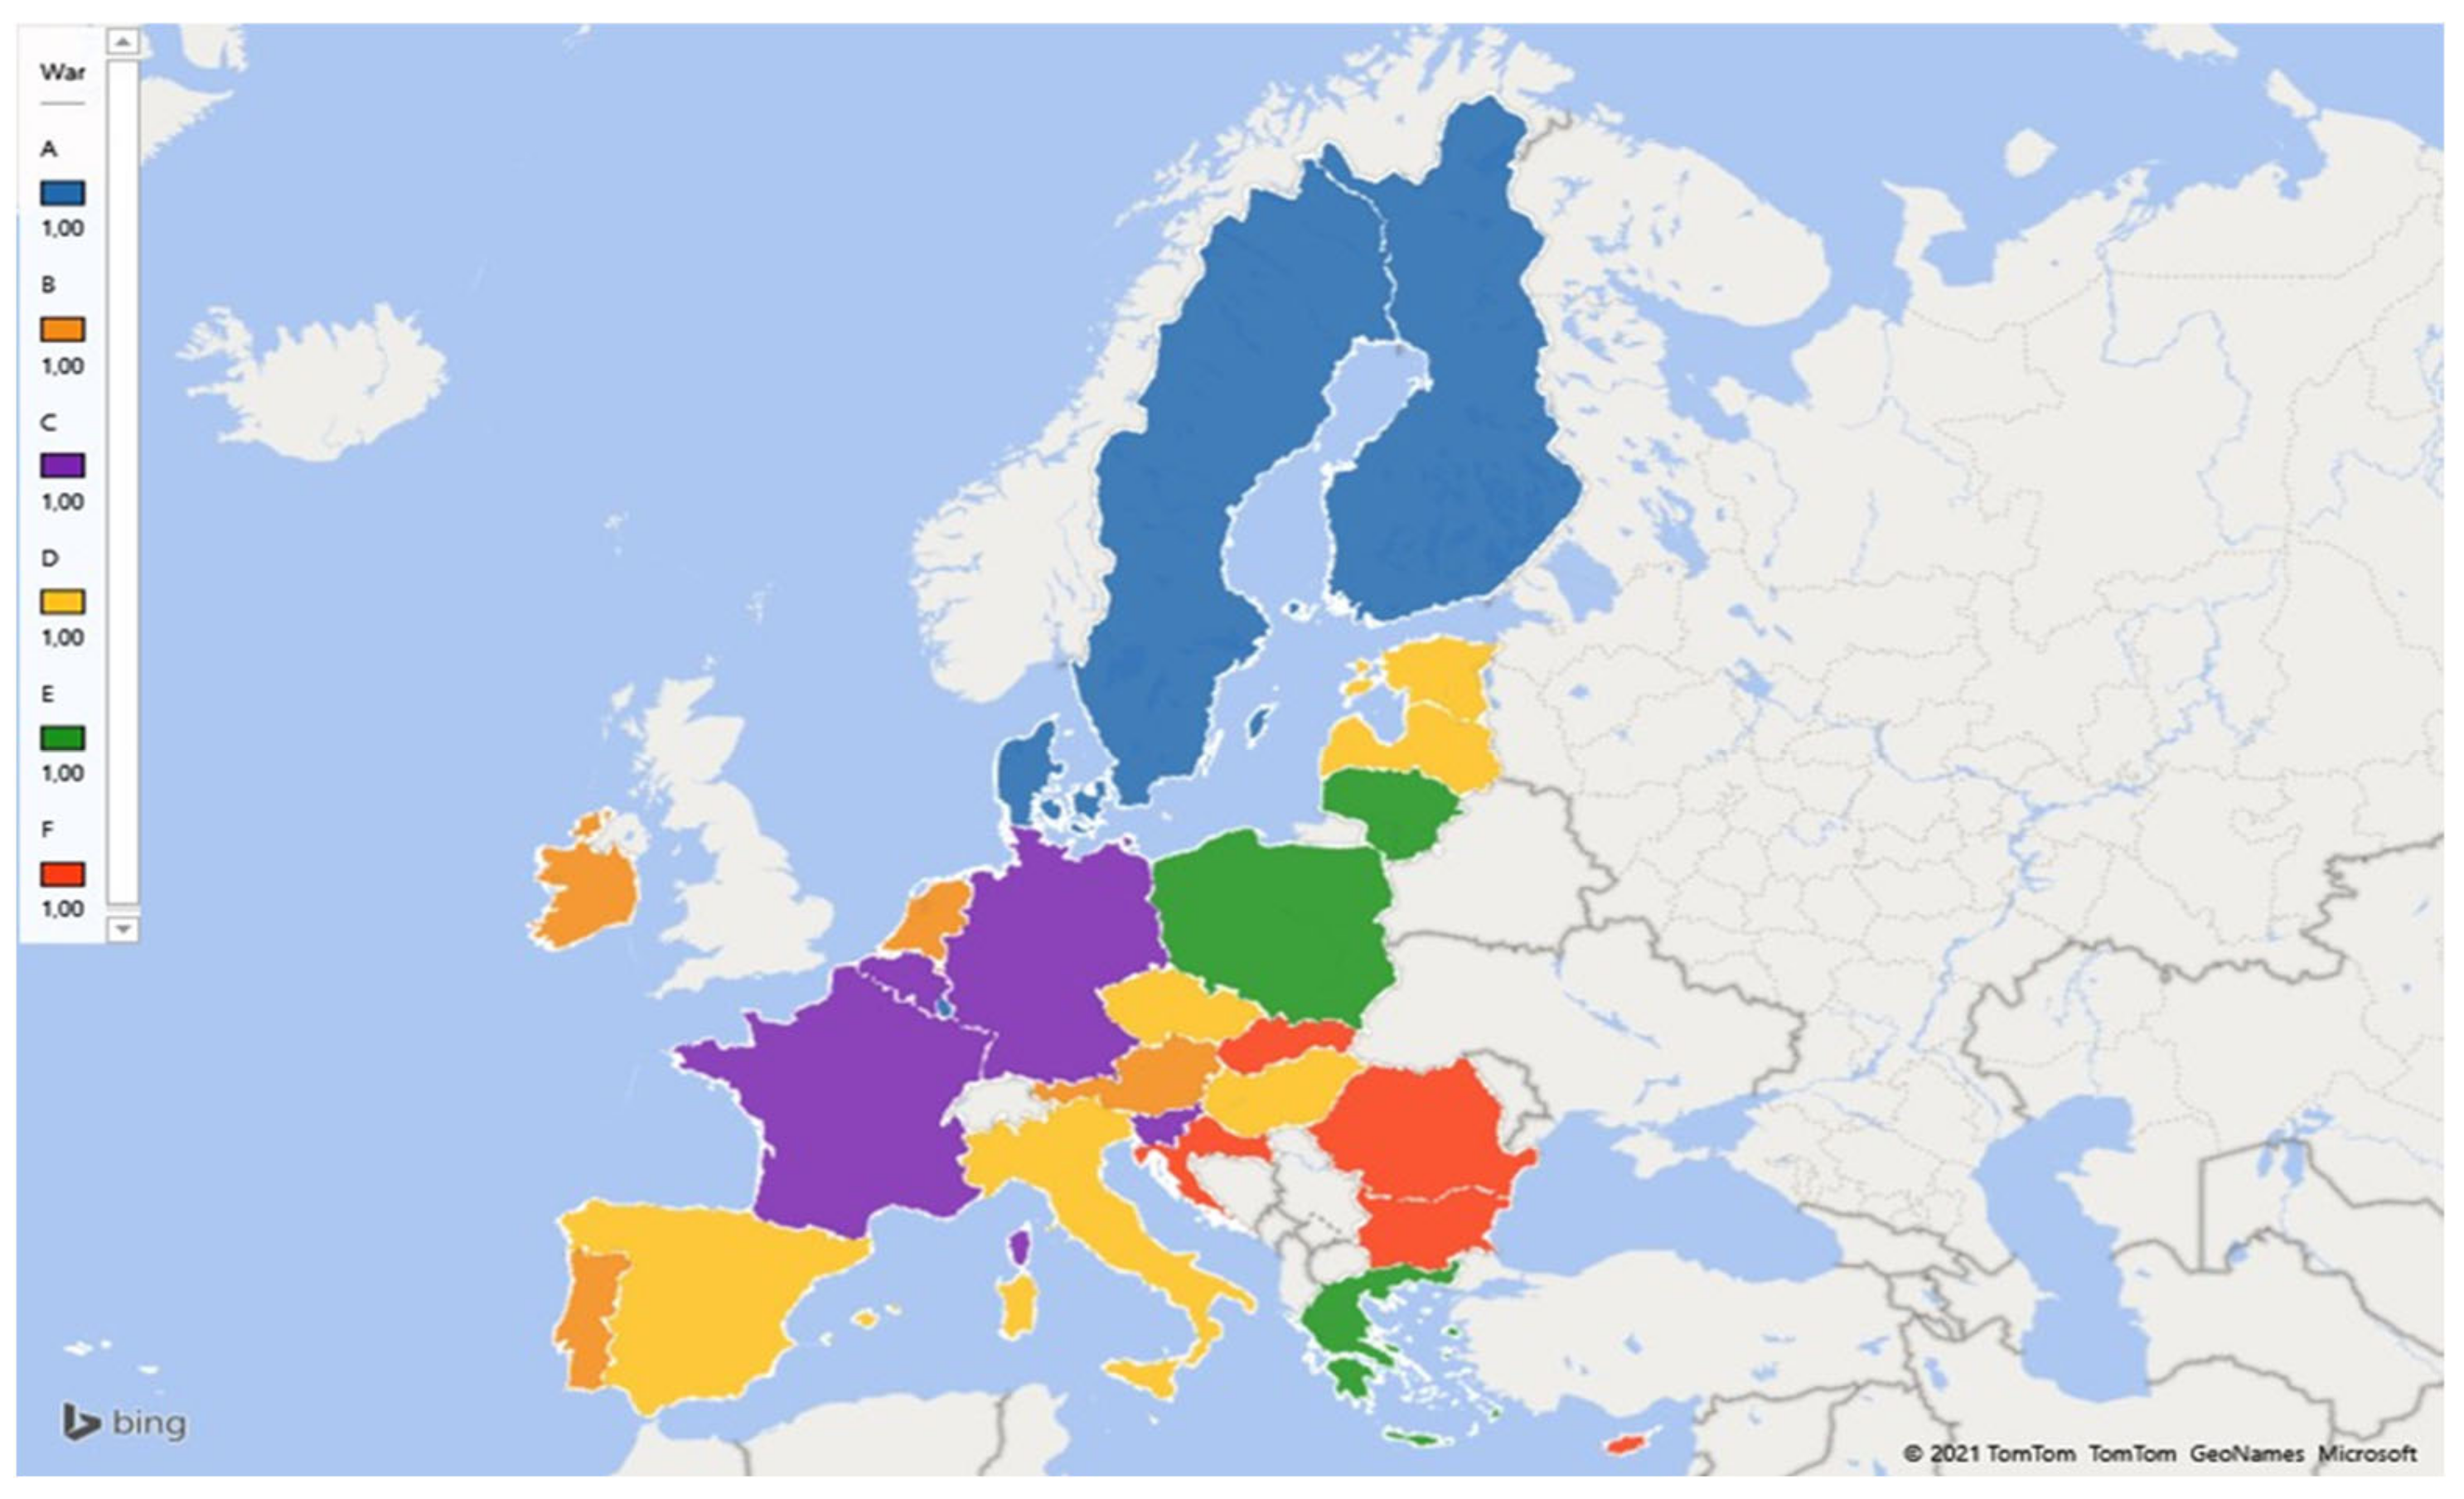
| Country | Economic Factors | Financial Factors | Non-Wage Factors | Inclusive Growth Index | Class |
|---|---|---|---|---|---|
| Belgium | 0.461 | 0.392 | 0.618 | 0.498 | C |
| Bulgaria | 0.449 | 0.322 | 0.209 | 0.319 | F |
| Czechia | 0.577 | 0.357 | 0.455 | 0.462 | D |
| Denmark | 0.574 | 0.554 | 0.622 | 0.586 | A |
| Germany | 0.478 | 0.439 | 0.612 | 0.516 | C |
| Estonia | 0.500 | 0.455 | 0.470 | 0.475 | D |
| Ireland | 0.574 | 0.439 | 0.616 | 0.547 | B |
| Greece | 0.380 | 0.376 | 0.481 | 0.417 | E |
| Spain | 0.474 | 0.332 | 0.560 | 0.461 | D |
| France | 0.467 | 0.447 | 0.565 | 0.497 | C |
| Croatia | 0.432 | 0.407 | 0.347 | 0.392 | F |
| Italy | 0.416 | 0.420 | 0.504 | 0.450 | D |
| Cyprus | 0.493 | 0.252 | 0.459 | 0.404 | F |
| Latvia | 0.556 | 0.434 | 0.377 | 0.450 | D |
| Lithuania | 0.504 | 0.488 | 0.344 | 0.439 | E |
| Luxembourg | 0.734 | 0.485 | 0.752 | 0.662 | A |
| Hungary | 0.478 | 0.445 | 0.502 | 0.476 | D |
| Malta | 0.570 | 0.500 | 0.555 | 0.542 | B |
| Netherlands | 0.527 | 0.413 | 0.684 | 0.550 | B |
| Austria | 0.515 | 0.482 | 0.649 | 0.555 | B |
| Poland | 0.456 | 0.444 | 0.447 | 0.449 | E |
| Portugal | 0.445 | 0.540 | 0.616 | 0.539 | B |
| Romania | 0.348 | 0.359 | 0.336 | 0.347 | F |
| Slovenia | 0.524 | 0.491 | 0.528 | 0.515 | C |
| Slovakia | 0.482 | 0.375 | 0.372 | 0.406 | F |
| Finland | 0.509 | 0.586 | 0.673 | 0.595 | A |
| Sweden | 0.594 | 0.566 | 0.649 | 0.606 | A |
| Average EU-27 | 0.501 | 0.437 | 0.519 | - | - |
| Class | Lower Limit | Upper Limit |
|---|---|---|
| A | 0.568 | 0.662 |
| B | 0.528 | 0.568 |
| C | 0.487 | 0.528 |
| D | 0.447 | 0.487 |
| E | 0.407 | 0.447 |
| F | 0.000 | 0.407 |
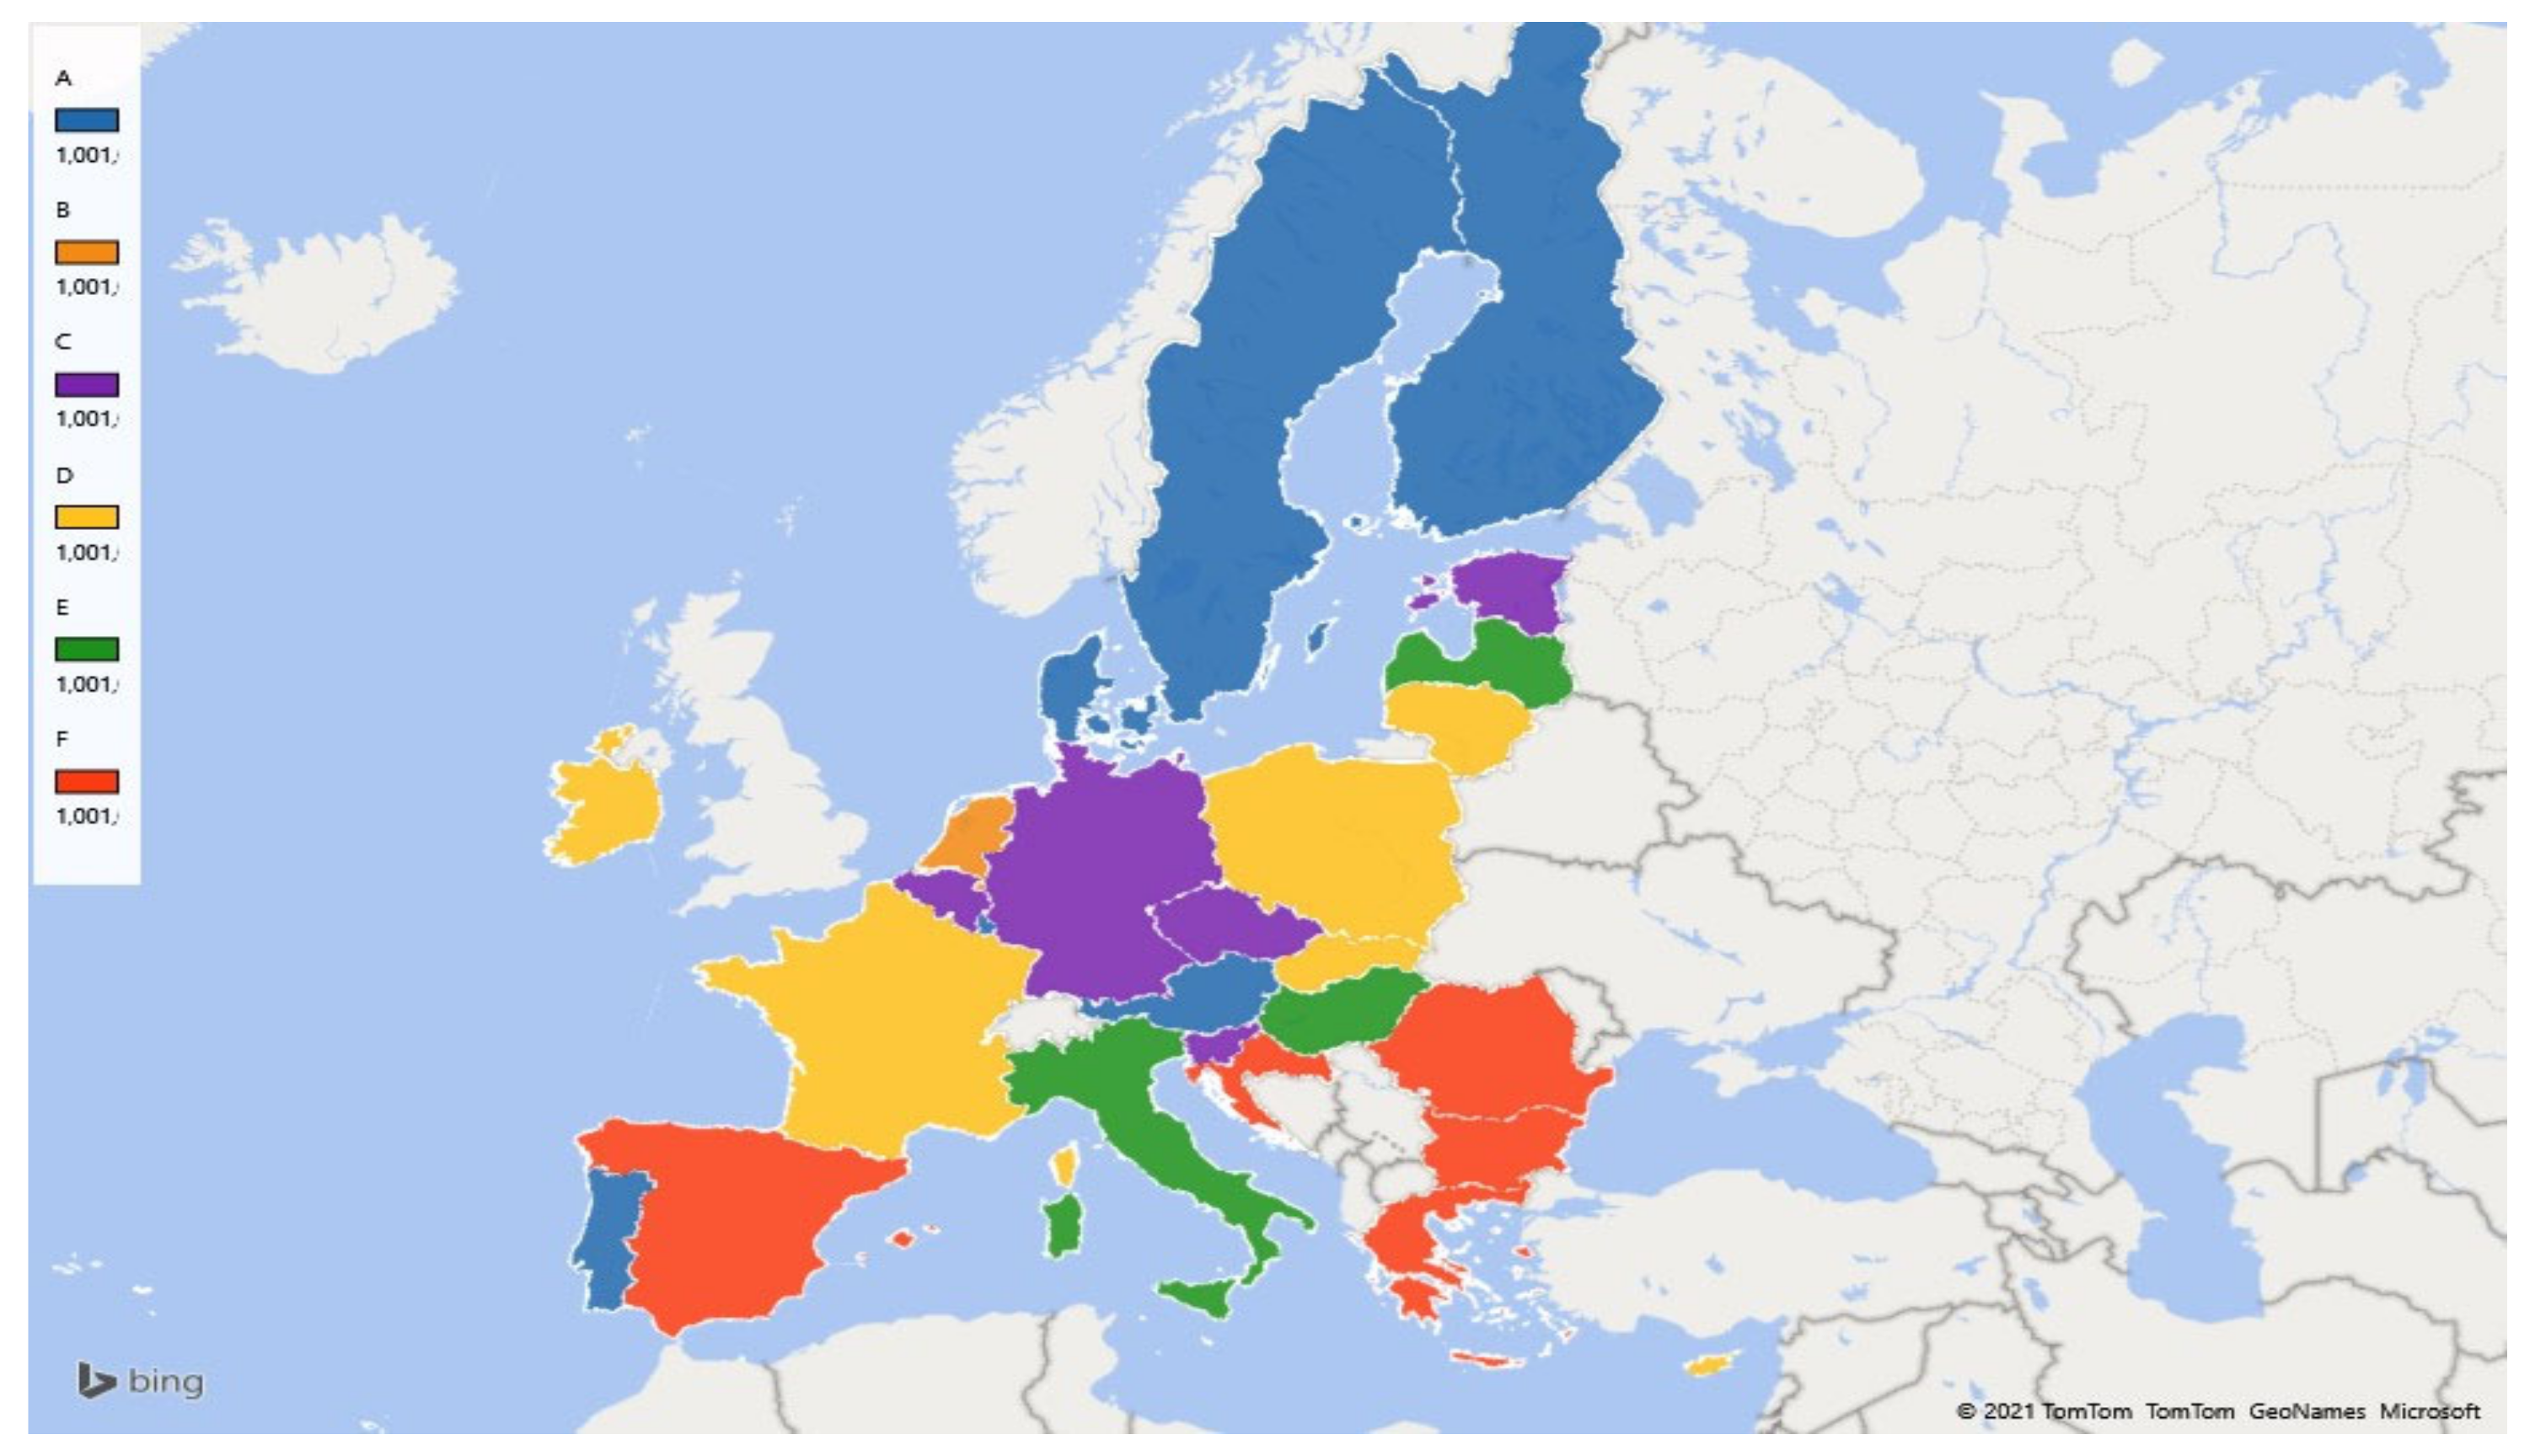
| Country | Economic Factors | Financial Factors | Non-Wage Factors | Inclusive Growth Index | Class |
|---|---|---|---|---|---|
| Belgium | 0.486 | 0.427 | 0.571 | 0.503 | C |
| Bulgaria | 0.421 | 0.352 | 0.374 | 0.384 | F |
| Czechia | 0.565 | 0.433 | 0.525 | 0.513 | C |
| Denmark | 0.574 | 0.571 | 0.664 | 0.608 | A |
| Germany | 0.469 | 0.449 | 0.621 | 0.523 | C |
| Estonia | 0.468 | 0.549 | 0.535 | 0.517 | C |
| Ireland | 0.432 | 0.437 | 0.570 | 0.487 | D |
| Greece | 0.335 | 0.426 | 0.424 | 0.395 | F |
| Spain | 0.436 | 0.294 | 0.429 | 0.394 | F |
| France | 0.436 | 0.444 | 0.557 | 0.485 | D |
| Croatia | 0.457 | 0.359 | 0.343 | 0.385 | F |
| Italy | 0.396 | 0.390 | 0.455 | 0.417 | E |
| Cyprus | 0.517 | 0.314 | 0.533 | 0.467 | D |
| Latvia | 0.360 | 0.490 | 0.478 | 0.442 | E |
| Lithuania | 0.461 | 0.556 | 0.443 | 0.480 | D |
| Luxembourg | 0.686 | 0.439 | 0.744 | 0.641 | A |
| Hungary | 0.392 | 0.497 | 0.425 | 0.434 | E |
| Malta | 0.523 | 0.495 | 0.515 | 0.512 | C |
| Netherlands | 0.521 | 0.439 | 0.639 | 0.544 | B |
| Austria | 0.499 | 0.494 | 0.689 | 0.572 | A |
| Poland | 0.447 | 0.507 | 0.422 | 0.454 | D |
| Portugal | 0.388 | 0.556 | 0.504 | 0.480 | A |
| Romania | 0.344 | 0.425 | 0.385 | 0.382 | F |
| Slovenia | 0.513 | 0.484 | 0.549 | 0.519 | C |
| Slovakia | 0.554 | 0.371 | 0.433 | 0.456 | D |
| Finland | 0.578 | 0.568 | 0.657 | 0.606 | A |
| Sweden | 0.557 | 0.600 | 0.674 | 0.615 | A |
| Average EU-27 | 0.475 | 0.458 | 0.524 | - | - |
| Class | Lower Limit | Upper Limit |
|---|---|---|
| A | 0.564 | 0.641 |
| B | 0.527 | 0.564 |
| C | 0.489 | 0.527 |
| D | 0.452 | 0.489 |
| E | 0.415 | 0.452 |
| F | 0.000 | 0.415 |
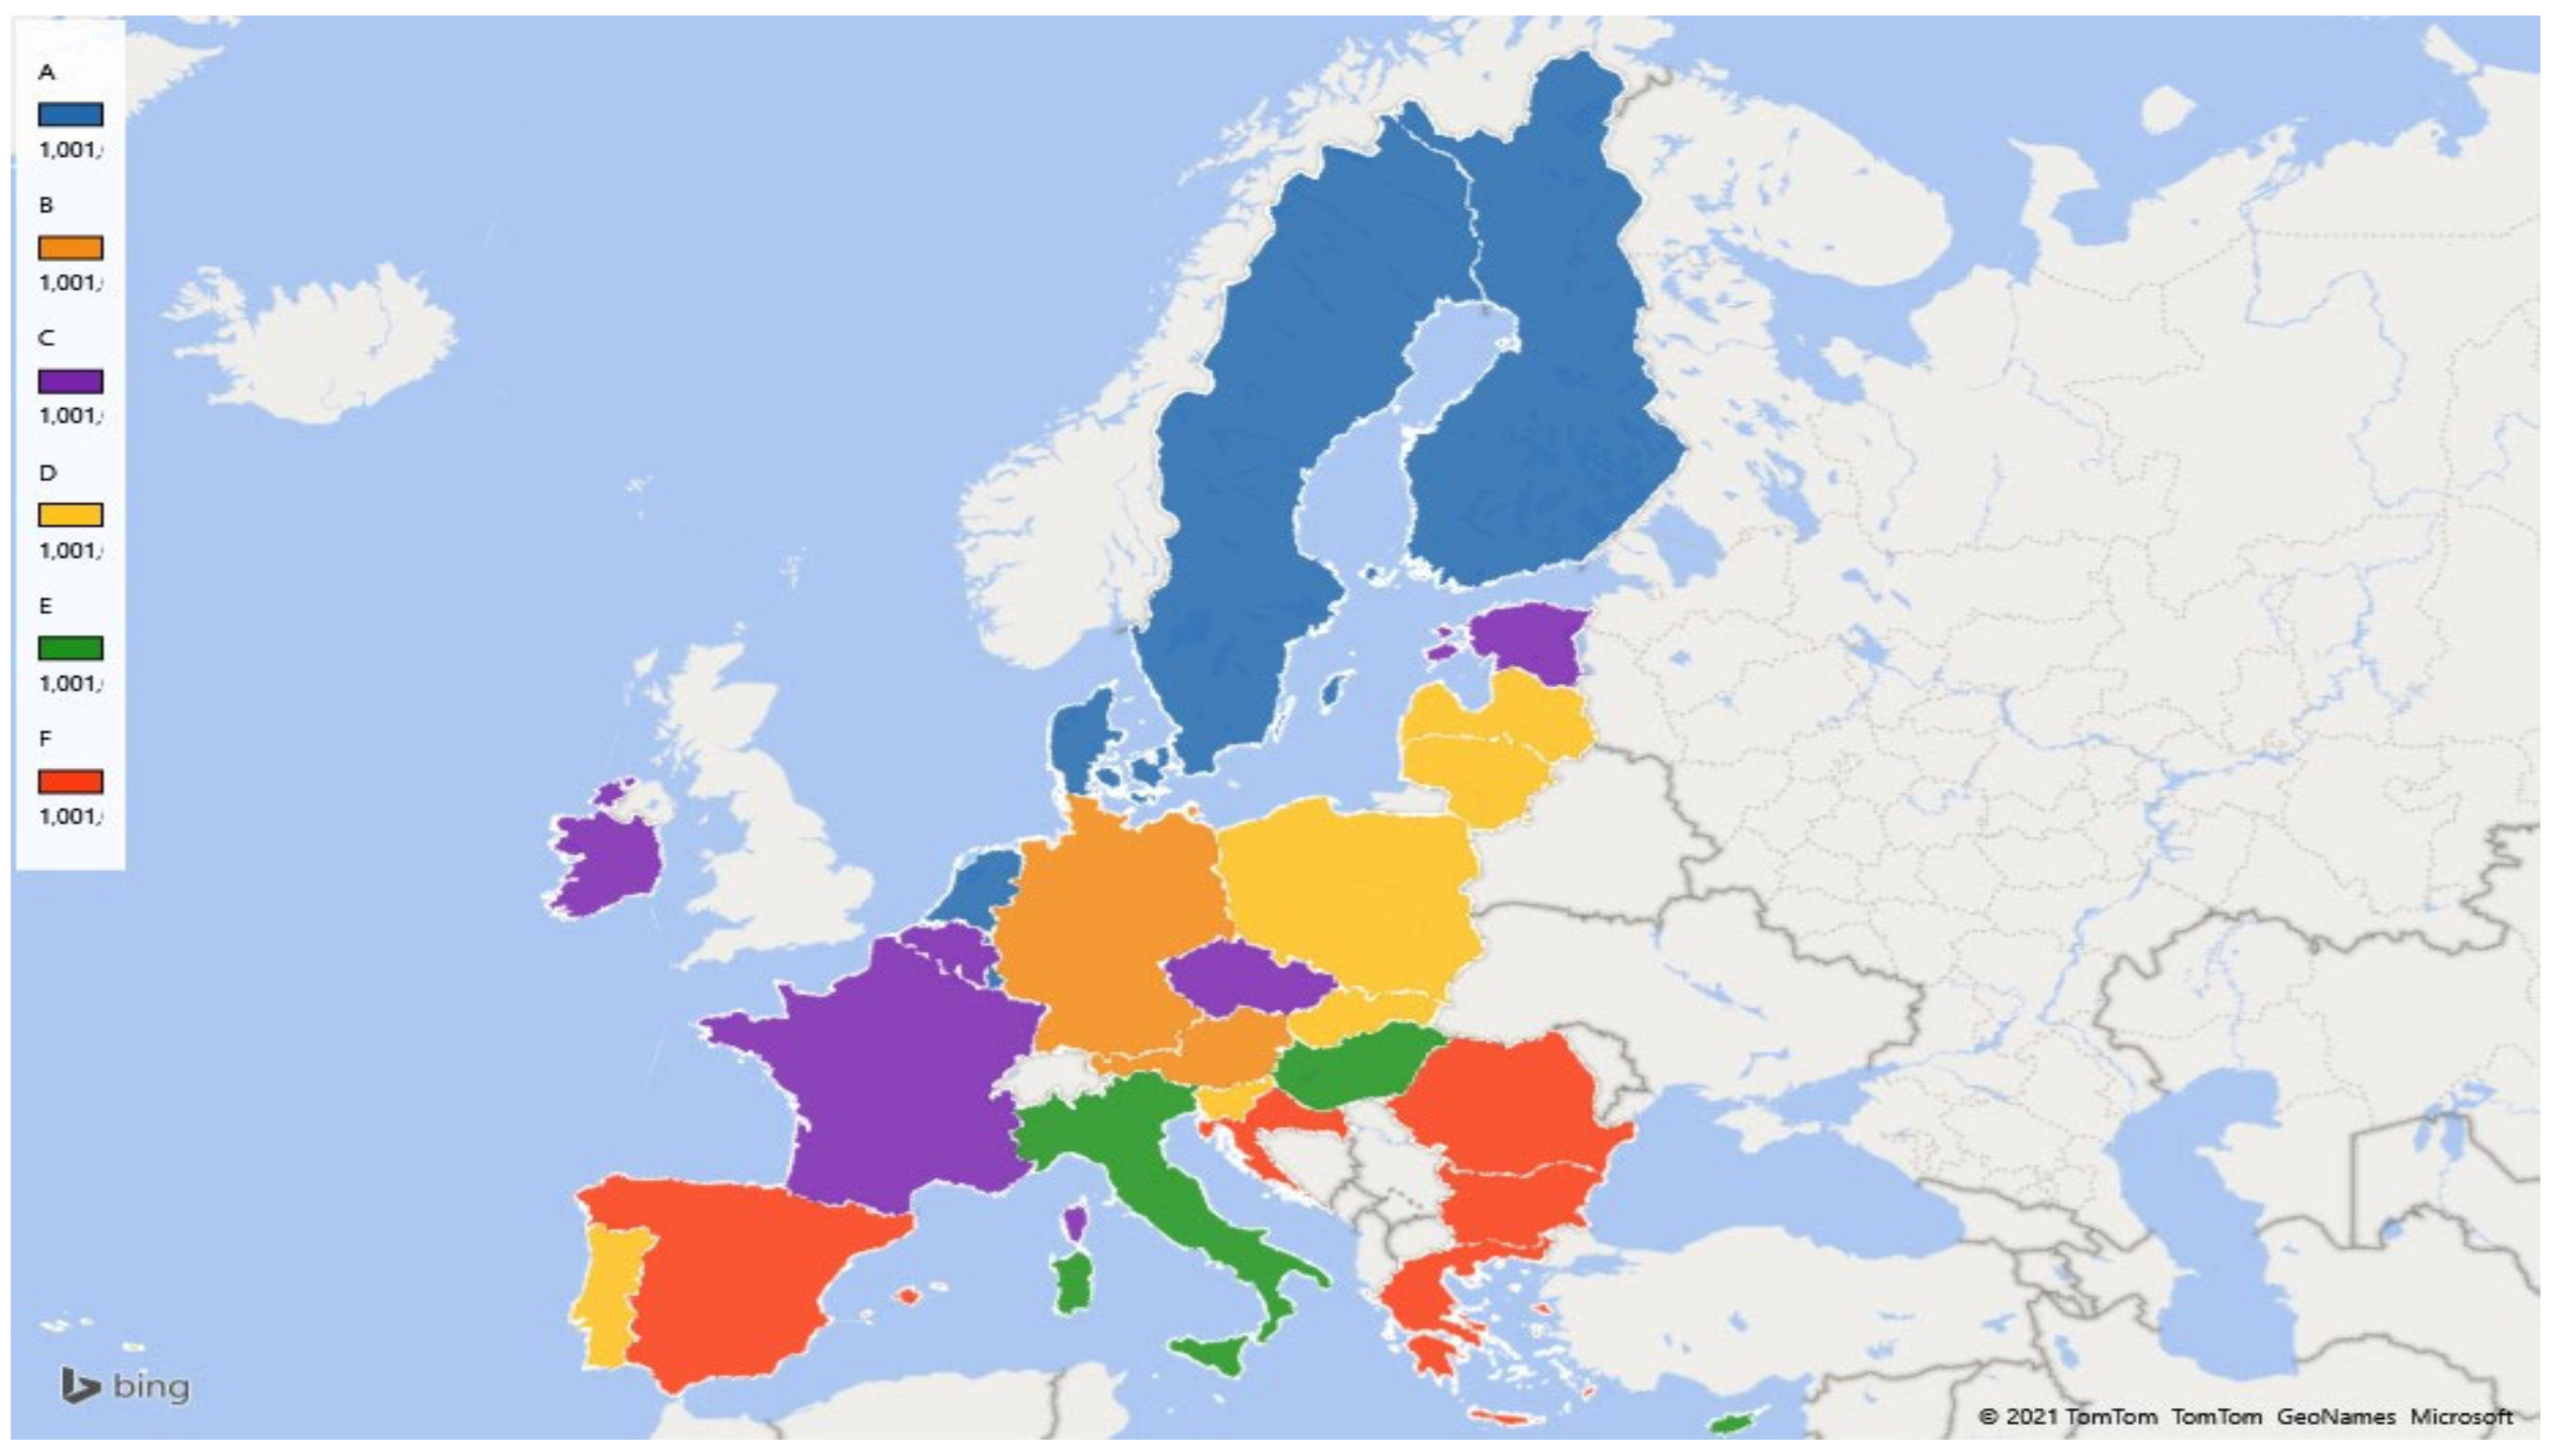
| Country | Economic Factors | Financial Factors | Non-Wage Factors | Inclusive Growth Index | Class |
|---|---|---|---|---|---|
| Belgium | 0.544 | 0.511 | 0.556 | 0.543 | C |
| Bulgaria | 0.466 | 0.427 | 0.350 | 0.408 | F |
| Czechia | 0.452 | 0.527 | 0.595 | 0.528 | C |
| Denmark | 0.618 | 0.574 | 0.727 | 0.656 | A |
| Germany | 0.545 | 0.520 | 0.643 | 0.582 | B |
| Estonia | 0.550 | 0.567 | 0.554 | 0.555 | C |
| Ireland | 0.579 | 0.386 | 0.622 | 0.559 | C |
| Greece | 0.399 | 0.574 | 0.281 | 0.383 | F |
| Spain | 0.431 | 0.461 | 0.366 | 0.409 | F |
| France | 0.479 | 0.581 | 0.539 | 0.525 | C |
| Croatia | 0.440 | 0.465 | 0.370 | 0.415 | F |
| Italy | 0.443 | 0.583 | 0.398 | 0.451 | E |
| Cyprus | 0.524 | 0.483 | 0.393 | 0.460 | E |
| Latvia | 0.515 | 0.551 | 0.469 | 0.502 | D |
| Lithuania | 0.527 | 0.502 | 0.490 | 0.506 | D |
| Luxembourg | 0.670 | 0.466 | 0.715 | 0.649 | A |
| Hungary | 0.358 | 0.571 | 0.445 | 0.438 | E |
| Malta | 0.556 | 0.592 | 0.425 | 0.507 | D |
| Netherlands | 0.566 | 0.567 | 0.706 | 0.626 | A |
| Austria | 0.528 | 0.608 | 0.656 | 0.599 | B |
| Poland | 0.434 | 0.545 | 0.480 | 0.476 | D |
| Portugal | 0.437 | 0.595 | 0.458 | 0.477 | D |
| Romania | 0.365 | 0.488 | 0.389 | 0.400 | F |
| Slovenia | 0.512 | 0.564 | 0.480 | 0.509 | D |
| Slovakia | 0.501 | 0.484 | 0.456 | 0.478 | D |
| Finland | 0.581 | 0.646 | 0.716 | 0.652 | A |
| Sweden | 0.580 | 0.582 | 0.711 | 0.637 | A |
| Average EU-27 | 0.504 | 0.534 | 0.518 | - | - |
| Class | Lower Limit | Upper Limit |
|---|---|---|
| A | 0.599 | 0.656 |
| B | 0.558 | 0.599 |
| C | 0.516 | 0.558 |
| D | 0.474 | 0.516 |
| E | 0.433 | 0.474 |
| F | 0.000 | 0.433 |
| Country | Class in 2000 | Class in 2010 | Class in 2020 | Description |
|---|---|---|---|---|
| Belgium | C | C | C | The crisis period of 2000 did not significantly affect the country’s economy. Then, in the period of 2008–2020 (as shown by the analyzed financial indicators), the Belgian government made far-reaching savings in order to improve budgetary discipline. However, the deteriorating economic situation and the undertaken austerity measures adversely affected the dynamics of foreign trade turnover. The Belgian government has set itself the goal of implementing a series of solutions regulating the financial system (or supporting them at the European level). Much space was devoted to Belgium’s maintenance of its social model in the government program. In order to counteract the effects of the economic crisis after 2008, the federal government implemented a program of economic stabilization. Its key elements were employment policy, strengthening social security, pension reform, fighting poverty, increasing funds for research and development, and support for enterprises. The conducted analyses show, however, that the measures implemented by the Belgian government did not bring significant results in terms of inclusive growth. This may mean that the COVID-19 crisis will negatively affect the functioning of the Belgian economy in the coming years. |
| Bulgaria | F | F | F | The analysis of financial, economic, and non-wage factors in Bulgaria showed significant changes during the financial crisis in 2008, although it should be emphasized that Bulgaria did not suffer significantly in the described period. In 2011, the Bulgarian economy grew at a rate of slightly above 2% y/y. As in 2010, export was the main driver of economic growth dynamics. Growing public consumption also had a positive impact on GDP growth. On the other hand, investment outlays and individual consumption continued to slow down economic growth. At the end of 2018, the government allocated approximately EUR 1 billion from the budget surplus, primarily to financing transport projects in 2019 and subsequent years. It was also planned to accelerate the absorption of EU subsidies, which were to stimulate various sectors, including industry. However, the Bulgarian economy, strongly linked to exports, struggled more and more acutely with the problem of labor shortages. Hundreds of thousands of Bulgarians have emigrated abroad. |
| Czechia | D | C | C | In 2008 and 2020, in terms of inclusive growth, the Czech economy advanced to class C compared with 2000, when it was in class D. From 2011 to 2012, the koruna weakened against the euro by 7%, while the Polish zloty and the Hungarian forint depreciated much more during this period (by 15% and 19%, respectively). At the same time, the increase in country risk, reflected by the change in CDS (Credit Default Swap) quotations, was also the lowest in the region in the Czech Republic. In the described period, CDS rates for 5-year treasury bonds in the Czech Republic increased by almost 70 bp, while the average for the region was almost three times higher. An additional factor proving the stability of the Czech economy were low interest rates. From 2010, the main interest rate of the Czech National Bank (2 W Repo Rate) was at a record low level of 0.75%, i.e., lower than the ECB rate. In previous years, its level was also much lower than in other countries of the Central and Eastern Europe (CEE) region (since 2002 it has not exceeded 3.75%), and at the same time the level of inflation (except for 2008, when inflation temporarily increased as a result of increases in tax rates and administered prices) was one of the lowest in the region. The Czech Republic also had the lowest current account deficit in the region in those years. From 2004 it did not exceed 4% of GDP, while in other CEE countries, it was often higher than 20% of GDP. In 2019, the Czech Republic recorded a slowdown in economic growth. According to the data of the Czech Statistical Office, GDP in 2019 increased by 2.6%. A year earlier, the economy grew at a rate of 2.8%, in 2017 it grew by 4.4%. The average inflation rate in 2019 was 2.8%. The unemployment rate remained the lowest in the European Union, averaging 2.0% throughout 2019. The current account of the balance of payments showed a slight deficit of 0.4% of GDP in 2019. The coronavirus pandemic had a significant impact on the economic situation in the Czech Republic. In the Czech Republic, declines in foreign trade and investment in fixed assets are expected to be among the most severe effects of the COVID-19 pandemic. There is a high probability of lower consumption of households. |
| Denmark | A | A | A | During the analyzed period, Denmark experienced a reduction in exports and imports as well as the inflow and outflow of FDI, which was related to the global economic slowdown, which led to changes in the current account balances. Changes in foreign trade turnover confirmed that the economy felt the effects of the global crisis in the analyzed period. The implications of the financial crisis in 2008 for the volume of foreign trade in the Nordic countries were greater than in other EU countries. However, the changes were temporary and did not have a significant impact on the value of the inclusive growth index under study. |
| Germany | C | C | B | The development of the German economy depends on foreign trade and investment activity, and to a lesser extent on internal consumption. Export is the engine of the German economy. After the 2008 financial crisis, in 2014 Germany achieved a record trade surplus of over EUR 200 billion, exceeding 7% of GDP. After ten years of growth, the German economy was hit by recession again. The outbreak of the pandemic in 2020 and the accompanying first lockdown led to a decline in GDP by 5.0% at the end of the year. Maintaining the competitiveness of exports as the main engine of the economic situation and maintaining low internal inflation remains an important issue for Germany. The policy of keeping social assistance within acceptable limits is continued. |
| Estonia | D | C | C | Estonia maintained a balanced level of inclusive growth during the period under review. During the crisis in 2008, the country maintained a high degree of budgetary discipline and in 2009 achieved a budget deficit of less than 3% GDP, despite significant drops in GDP. The growth in consumption in 2020, unlike before the crises of 2000 and 2008, took place in the conditions of stagnation on the credit market. In 2010, real unit labor costs decreased by 6.6% in Estonia, which partially offset their excessive increase in the pre-crisis period. As a result of the crisis, in 2009 there was a decline in production in the construction sector by 30–45% y/y. Both the number of new constructions and the prices of residential real estate decreased (the drops reached 50–60% compared with the highs in 2007). In the case of Estonia, joining the euro zone and raising the credit rating in August 2011 by the S&P agency additionally contributed to the improvement of its image and increased attractiveness for direct investment. |
| Ireland | B | D | C | Ireland is characterized by a relatively small, but modern and open, and thus dependent on foreign trade, economy. Growth was around 6% between 1995 and 2007, but the 2008–2009 financial crisis shook the Irish economy into recession. The real estate market, construction, and the banking sector were hit the hardest by the crisis, investments stopped, and unemployment rose sharply. In 2010, the Irish government was forced to accept international financial aid from the European Union and the International Monetary Fund (EUR 85 billion), which was associated with the implementation of a savings program that aimed to reduce the deficit and expenditure (mainly on social welfare, benefits, and pensions). Since then, the indicators of the Irish economy have steadily improved, and already in 2013 Ireland successfully completed the above-mentioned program. In the last few years, Irish GDP growth has been around 5–7%. The dynamic growth took place, inter alia, thanks to attractive taxation (12.5% CIT) and a flexible approach to the issue of residence for tax purposes, as well as facilitations in the registration of enterprises that attract foreign investors, especially in the technology sector. The coronavirus pandemic pushed Ireland into a technical recession in the first half of 2020, albeit not as deep as in the case of other European Union countries. Sectors such as construction (−38%) and distribution, transport, accommodation, and food services were hit the hardest by the pandemic (-30%). |
| Greece | E | F | F | Greece is an economically developed country, mainly based on the service and industrial sectors (15% of GDP), with a small share of the agricultural sector (around 4%). Greece is the largest beneficiary of EU aid, accounting for approximately 3.3% of the country’s annual GDP. In the years between 2003–2007, the Greek economy grew by about 4% annually but in 2009 it entered the recession phase as a result of the global financial crisis and problems with limiting of growing budget deficit. In 2007–2008, Greece met the budget deficit criteria set by the EU under the Stability and Growth Package (no more than 3% of GDP), but failed to meet them in 2009, when the deficit amounted to 15% of the country’s GDP. The deteriorating state of public finances, inaccurate statistics, and the continued failure of the required reforms to implement the required reforms led credit rating agencies to downgrade Greece’s international rating at the end of 2009. Under pressure from the EU and other participants in the international market, the Greek government accepted the aid program, which included, inter alia, lowering government spending, tightening the tax system, reviewing pension, healthcare and civil service systems, and reforming the labor market. In 2014, the Greek economy started recovering from the crisis. During the pandemic, the Greek government implemented economic and labor market protection packages worth EUR 24 billion. It also strengthened the country’s reserve resources to EUR 38 billion, acquiring EUR 14 billion from international markets, thanks to successful bond issues. Coming out of crises, in strictly economic terms, did not have any impact on the value of the inclusive growth index. |
| Spain | D | F | F | Currently, Spain is the fourth economy of the European Union and the third economy of the euro area (after the withdrawal of Great Britain from the European Union). However, the conducted research on inclusive growth differs significantly from the commonly available data describing the economic situation of the country. The sustained economic growth in Spain is due to good results in the tourism industry. Therefore, due to the ongoing COVID-19 pandemic, the Spanish economy is in a recessionary state. This crisis is even more severe than the 2008 crisis, which ended 16 years of steady growth in the Spanish economy and lasted until 2013. The financial crisis of 2008–2014 in Spain was resolved thanks to structural reforms by the government, an increase in exports (for the first time since 1986, an increase in exports translated into a positive trade balance in 2013) and employment, as well as an accommodative macroeconomic policy. In line with the obligations resulting from membership in the European Union, the Spanish government adopted in December 2016 a package of measures aimed at, inter alia, reduction of public debt to 97% in 2018, 95.2% in 2019, and 89.1% in 2021, and reduction of the budget deficit to 2.2% of GDP. In its recommendations of May 2018, the European Commission also emphasized the need to reform the fiscal policy and the public procurement sector, ensuring the transparency of public procurement control procedures and mechanisms at all levels of government. As can be seen from the value of the index, these activities did not constitute an impulse for inclusive growth because the Spanish economy is in the group of countries with the lowest level of the analyzed index. |
| France | C | D | C | 2020 saw the highest recession in the French economy since the end of World War II. This was heavily influenced by the sectors of France that were particularly hit hard by the pandemic, i.e., tourism, automotive and aviation, luxury goods production, and a longer and more stringent lockdown than in other EU countries. The effects of this crisis will be felt for the country in the long run. The consequences of the financial crisis after 2008 were equally severe for inclusive growth. The cost of the economic recovery plan implemented in 2009–2010 amounted to EUR 38.8 million. This amount had a significant impact on the deterioration of public finances in France. In 2009, the budget deficit amounted to 7.2% of GDP, and public debt increased to 78.9% of GDP. A year later, the budget deficit accounted for 6.8% of GDP and public debt reached the level of 81.6% of GDP. It can be assumed that the inclusive growth index in the coming years may be lower, and France may record a decline in the inclusive growth ranking. |
| Croatia | F | F | F | The calculated inclusive growth rates place this country in the group of the weakest economically and most affected by the economic crisis in the EU countries in the period 2000–2020. The persistently high unemployment rates are worrying. FDI is an opportunity for inclusive growth, the total value of which in the period from 1993 to 2019 amounted to EUR 31.80 billion, which allows Croatia to be included in the group of European countries with the highest level of foreign investments per capita. |
| Italy | D | E | E | Italy is the third economy in the European Union and the euro area (after Great Britain’s withdrawal from the EU). According to the International Monetary Fund data for 2019, Italy is the ninth country in the world in terms of GDP in nominal terms. However, as in the case of Spain, the calculated rates of inclusive growth in this paper do not coincide with the basic economic data demonstrating a high level of economic growth. The effects of the current COVID-19 crisis are particularly hard on the Italian economy. The Italian economy contracted by 9.9% in 2020. The economic recovery in the coming years will be based primarily on the manufacturing sector and investments. To stimulate them, Italy introduced a system of incentives in the form of the so-called super bonus (tax relief of 110% of the costs incurred) for activities in the field of increasing the energy and anti-seismic efficiency of buildings, photovoltaic installations, and erecting charging stations for electric cars. The economic crisis in Italy after 2008 was much milder than in Spain, and above all in Greece. A number of changes were introduced in the fight against the crisis. Within the tax system, in 2012, the excise tax on fuel used in transport was increased and a tax was introduced on certain financial transactions. In 2013, the PIT tax was reduced for people with low incomes, as well as for those investing in start-ups or operators operating in the tourism industry, who invest in order to modernize their business. In 2013, measures were also introduced to reduce CIT on enterprises operating in certain sectors. The basic VAT rate was increased to 22%, as well as reduced rates for some products. |
| Cyprus | F | D | E | Tourism, financial services, shipping services, and real estate are traditionally recognized as the leading service sectors of the Cypriot economy. During the first five years of Cyprus’ membership in the European Union, the country’s economy grew on average by approximately 4%. In 2009, along with the global financial crisis, the Cypriot economy experienced a recession. The domestic banking sector was particularly hard hit as the two largest Cypriot banks were among the holders of Greek bonds and had branches in Greece. Due to numerous drops in the country’s credit rating, Cyprus lost access to the international capital markets in May 2011. In 2012, Cyprus became the fifth euro area government to request a rescue plan from the European Commission, the European Central Bank, and the International Monetary Fund. Under the agreement, Cyprus received EUR 10 billion. After a 3.5-year recession, the Cypriot economy returned to its growth phase in 2015. Cyprus successfully carried out a three-year financial assistance program, which ended in March 2016. In total, it received support in the amount of EUR 6.3 billion from the European Stability Mechanism, as well as EUR 1 billion from the International Monetary Fund. |
| Latvia | D | E | D | In the case of Latvia, the level of inclusive growth was certainly influenced by high economic emigration. It is unofficially estimated that around 100,000 people have emigrated since Latvia’s accession to the EU, which constitutes approximately 9% of the total number of people employed. On January 1, 2014, Latvia joined the area of the single European currency. With the introduction of the euro, Latvia introduced changes to the tax system, making it a very attractive country for investors. The dividend tax was abolished. The profit from the sale of shares is also not taxed. In 2015, the personal income tax rate was reduced from 24% to 23%. |
| Lithuania | E | D | D | In 2010, real unit labor costs decreased by 9.1% in Lithuania. The most important source of economic growth in 2011 was investment expenditure. On the one hand, it was the effect of postponed investments (investment outlays in the Baltic states had been dropping sharply since 2008, i.e., earlier than in other countries of the region), and on the other hand, the ongoing stabilization on the real estate market. The increase in investments took place in the conditions of stagnation in the credit market. In Lithuania, profits have become the main driving force of investment spending. |
| Luxembourg | A | A | A | The Luxembourg economy is characterized by stability—with steady GDP growth, low inflation, and a low unemployment rate. Despite its small area and population, Luxembourg is the second richest country in the world in terms of GDP per capita. However, this economy was hit by the economic crisis in 2008. Problems in financial markets and falling global demand prompted the government to recapitalize the banking sector and implement firm measures to stimulate the economy. These measures and state aid to the banking sector led to a budget deficit of 3.0% in 2013, which was reduced to 1.4% in 2017. |
| Hungary | D | E | E | In 2011, the Hungarian economy was one of the slowest developing in the region. Growth was mainly driven by external demand while domestic demand continued to decline. Moreover, the continued “deleveraging” of households and the restrictive credit policy of banks continued to be a serious brake on the recovery in this country. An additional factor limiting the dynamics of individual consumption in Hungary was the ongoing “deleveraging” of consumers. Households in the period before the outbreak of the global financial crisis in 2008 willingly took out foreign currency loans (mainly in Swiss francs and euro), which was mainly due to their lower interest than loans in domestic currency and a relatively stable exchange rate of forint against the above-mentioned currencies. The country saw a decline in real income in 2009, but it also managed to reduce its real spending over that time. After a temporary slowdown in 2016, the Hungarian economy found itself on a path of rapid growth. Hungary’s GDP grew at a rate of 4–5 percent annually in 2017 and 2018. The recent government’s actions, including: lowering the corporate income tax rate, introducing incentives to strengthen the competitiveness of the economy, and favorable lending conditions, combined with the accelerating absorption of funds from the 2014–2020 EU programming period, resulted in the Hungarian economy developing in a stable manner. The source of economic growth was the growing consumption of households and the increase in investment. However, as in the case of Spain, the main economic indicators do not reflect the trend of inclusive growth indicators. After 2000, Hungary has recorded a gradual decline in inclusive growth. |
| Malta | B | C | D | Malta’s economy, due to its size and geographic location, is highly dependent on external factors. The main sectors driving the Maltese economy are tourism, financial services, pharmaceuticals, machinery and equipment manufacturing, aerospace and shipbuilding, film production, online gaming, pharmaceuticals, and educational services. The Maltese economy has been hit hard by the global economic crisis in previous years. However, starting in 2013, Malta has experienced significant economic growth, which peaked in 2015 at around 10.7% of GDP. Then, in 2016, it fell to 5.7% of GDP. Despite their decline, these figures were among the highest achieved by euro area countries, reflecting steadily increasing domestic demand, investment, and the increasing number of tourists visiting Malta. At the same time, the level of public debt was falling. According to the data of the European Commission, in 2018 it reached the level of approximately 46% of GDP, while in 2019, slightly over 43% of GDP. The situation on the labor market is also improving. Despite the increase in unemployment in the EU countries, in Malta this phenomenon remains at a stable low level below approximately 4.0%, due to the continued activity of Maltese enterprises and the inflow of FDI. |
| Netherlands | B | B | A | The Kingdom of the Netherlands is a highly developed and open economy in which foreign trade plays a key role. After the global financial crisis of 2008–2009, which brought the Netherlands to recession and then stagnation, we could observe an economic rebound for several years, however, it is now slowed down by the COVID-19 pandemic. |
| Austria | B | A | B | Austria is one of the most economically developed countries in the European Union, heavily dependent on exports and international cooperation. The consistently pursued policy of social partnership and cooperation with the countries of Central and Eastern Europe has a significant impact on achieving economic, social, and political stabilization. Austria’s economy benefited greatly from EU membership and the effects of its enlargement, becoming a regional center for financial, investment, and construction services for Central and Eastern Europe. Its economic growth was one of the highest in the EU for many years. During the economic crisis in 2008, the level of GDP decreased. The difficult situation in the euro area and the slower economic growth in Germany did not favor the Austrian economy in 2013–2016. Exports remained the main driving force of the economic situation. The economic and financial crisis temporarily weakened the dynamics of exports, but since 2017, exports have definitely increased. Foreign trade in Austria has increased significantly since 2017. The COVID-19 pandemic had a strong impact on the Austrian economy. As a result of the lockdown, registered unemployment increased significantly in 2021. Despite a partial decline, it has remained high since then. Additionally, the crisis is having a negative impact on the prices of industrial goods and services due to pent-up demand. The government has taken decisive steps to stabilize the economy and maintain its productive potential. In mid-2021, a new stimulus package worth EUR 19 billion (4.7% of nominal GDP in 2019) was announced. |
| Poland | E | D | D | In the case of the Polish economy, the negative shock caused by the global financial crisis came mainly through foreign trade and the financial sector, but with a certain delay. The relatively most difficult situation was recorded at the turn of 2008 and 2009. During this period, Polish enterprises significantly limited their production activities due to the declining foreign demand. The uncertainty prevailing on the market regarding the development prospects of the Polish economy (and its stability in the face of the intensification of the crisis), as well as other countries in the world, caused a temporary outflow of foreign capital, which contributed to the depreciation of the domestic currency. Limited availability of external financing, caused by stricter criteria for assessing creditworthiness, an increase in margins, bank commissions, as well as a higher required level of collateral, launched, with some delay (along with other factors mentioned), and adjustment processes in the real economy, i.e., economic downturn. The decline in the value of foreign direct investments flowing to the country led to a slowdown in economic processes (including the scale of investments made), as well as a deterioration in the current account balance. The factors that helped to save the Polish economy from recession include: relatively low dependence of GDP on exports (approximately 39.5% in 2009), high internal demand (mainly implied by individual consumption), depreciation of the zloty, and a positive contribution of net exports to GDP. |
| Portugal | B | A | D | Since joining the European Community in 1986, Portugal has developed into a diversified economy based more and more on services. Portugal is one of the countries with the lowest GDP per capita in Western Europe. Despite this, the country is highly ranked in terms of the standard of living. In the 1990s, the Portuguese economy grew faster than the European Union average, but the pace of growth slowed down between 2001 and 2008. In 2008, the Portuguese economy experienced its worst recession since the 1970s, necessitating financial support for the country from the European Commission, the European Central Bank, and the International Monetary Fund. It was then that the government introduced spending cuts and tax increases to meet the terms of the EU-IMF financial assistance package signed in May 2011. The rescue package required Portugal to implement a series of austerity measures in return for financial support of EUR 78 billion. The indicated values of inclusive growth in this study show that the Portuguese economy, in comparison to the previous research periods (2000, 2008), was in the D group, characterized by one of the lower levels of inclusive growth. |
| Romania | F | F | F | The recovery of economic growth after the crisis in 2008 and 2009 was very slow in Romania. For most of 2010, this economy recorded a decline in GDP in annual terms, while in other countries of the region this trend was reversed already in 2010 Q2. In the first half of 2011, GDP in Romania grew in annual terms by only 1.5%, which was also the most weaker result among the CEE countries. The situation changed in 2011, when GDP in Romania grew the most in the region on a quarterly basis (1.9% q/q), and its annual growth accelerated significantly (to 4.5% y/y). It is likely that such a high increase was a one-off due to the exceptionally good harvest in agriculture and the low base effect. The low pace of economic growth, especially in the first half of 2011, resulted mainly from the continued weakness of domestic demand, primarily consumption demand. In addition to the effects of the fiscal tightening observed in Romania in 2010, another important factor limiting the growth in consumption and investment was the cessation of lending. |
| Slovenia | C | C | D | Thanks to strong economic foundations and reform policy, the country survived the crisis of the early 1990s and then entered the path of rapid economic growth. In 2004, along with Poland, Slovenia joined the European Union, and at the beginning of 2007 it became the first post-communist country to adopt the common European currency, the euro. During this period, Slovenia enjoyed solid economic growth, which was rooted in dynamic exports and investments, especially in infrastructure. The rapid expansion ended in the last quarter of 2008. In 2011, Slovenia was one of the slowest developing countries in Central and Eastern Europe. In the first three quarters of 2010, gross domestic product increased below 1% y/y. For a long period of time after the 2008 crisis, a strong and negative impact on GDP dynamics was still exerted by lowering investment expenditure. |
| Slovakia | F | D | D | Among the countries of Central and Eastern Europe, Slovakia experienced the strongest slowdown in economic growth during the 2000 and 2008 crises. While in 2010 the country achieved the highest GDP dynamics (4.2%) in the region, in the first three quarters of 2009 the economic growth rate decreased to 3.3%. The relatively large decline in domestic demand in Slovakia in 2011 resulted from measures taken to reduce the budget deficit and a strong deterioration in the mood of consumers and some entrepreneurs. |
| Finland | A | A | A | Finland is one of the richest EU countries. Its per capita income in terms of purchasing power in 2019 accounted for 111% of the EU-27 average. Until recently, the Finnish economy was characterized by the highest competitiveness in the world and the least burdensome bureaucratic barriers and administrative regulations for startups. However, due to the crisis situation on world markets, in 2009 the GDP dropped by over 8%. There was a significant increase in unemployment, which approached 6%, and an increase in public debt, due to the planned financing of anti-crisis measures, to 45% of GDP. After 2017, the country’s economy entered the phase of economic growth mainly due to an increase in investment, consumption, and an increase in exports as a result of the introduction of the so-called The Competitiveness Pact in June 2016, which the Finnish Prime Minister managed to implement after many months of negotiations. All the measures taken contributed to the decline in unemployment. The increase in the retirement age from 63 to 65 as of 2017 increased employment by around 2% in 2018–2019. |
| Sweden | A | A | A | Sweden belongs to the group of the richest EU countries, its national income per capita calculated according to the purchasing power parity in 2019 accounted for 120% of the average per capita income in the entire EU. Sweden, like other European countries, was hard hit by the global financial crisis. At the beginning of 2008, GDP growth was assumed at the level of approximately 3%, the crisis caused the slowdown of the Swedish economy more than estimated. Ultimately, in 2008 it decreased by 0.6%, and in 2009 Sweden’s GDP shrank by over 5%. In 2010, Sweden returned to the development path. |
Publisher’s Note: MDPI stays neutral with regard to jurisdictional claims in published maps and institutional affiliations. |
© 2021 by the authors. Licensee MDPI, Basel, Switzerland. This article is an open access article distributed under the terms and conditions of the Creative Commons Attribution (CC BY) license (https://creativecommons.org/licenses/by/4.0/).
Share and Cite
Stawska, J.; Jabłońska, M. Determinants of Inclusive Growth in the Context of the Theory of Sustainable Finance in the European Union Countries. Sustainability 2022, 14, 100. https://doi.org/10.3390/su14010100
Stawska J, Jabłońska M. Determinants of Inclusive Growth in the Context of the Theory of Sustainable Finance in the European Union Countries. Sustainability. 2022; 14(1):100. https://doi.org/10.3390/su14010100
Chicago/Turabian StyleStawska, Joanna, and Małgorzata Jabłońska. 2022. "Determinants of Inclusive Growth in the Context of the Theory of Sustainable Finance in the European Union Countries" Sustainability 14, no. 1: 100. https://doi.org/10.3390/su14010100
APA StyleStawska, J., & Jabłońska, M. (2022). Determinants of Inclusive Growth in the Context of the Theory of Sustainable Finance in the European Union Countries. Sustainability, 14(1), 100. https://doi.org/10.3390/su14010100