The authors would like to make the following corrections about the published paper [1]. The changes are as follows:
- (1)
- Replacing affiliation 3:Department of Built Environment, Aalto University, 00076 Aalto, Icelandwith:Department of Built Environment, Aalto University, 00076 Aalto, Finland
- (2)
- Replacing the sentence in “Section 4.3. The Distances of Intersection Points (DIPs)” on page 16:Additionally, the UK, Cyprus, and Greece saw breakeven points beyond the vehicles’ assumed lifetime. The darker red the country, the greater the number of kilometers required to be driven to meet the DIP point. In the petrol case (Figure 7b), no countries saw a DIP greater than the vehicles’ assumed lifetime. The minimum estimated DIPs were approximately 34,100 and 18,000 km for the diesel and petrol cases, respectively, which were both found in Iceland. France and the other Nordic countries follow not far behind Iceland.with:Additionally, only Cyprus saw breakeven points beyond the vehicles’ assumed lifetime. The darker red the country, the greater the number of kilometers required to be driven to meet the DIP point. In the petrol case (Figure 7b), no countries saw a DIP greater than the vehicles’ assumed lifetime. The minimum estimated DIPs were approximately 31,100 and 17,000 km for the diesel and petrol cases, respectively, which were both found in Iceland. France and the other Nordic countries follow not far behind Iceland.
- (3)
- Replacing the sentence in “Section 4.4. Emissions Disparity (ED)” on page 16:Figure 8a shows that in comparison with diesel vehicles, EVs are estimated to have more GHG emissions over their life cycle in seven countries. All countries that are not blue have a negative ED (Latvia, Estonia, Poland, Greece, Cyprus, Malta, and the UK).with:Figure 8a shows that in comparison with diesel vehicles, EVs are estimated to have more GHG emissions over their life cycle in seven countries. All countries that are not blue have a negative ED (Latvia, Estonia, Poland, Greece, Cyprus, and Malta).
- (4)
- Replacing the sentence in “Section 4.5. Maximum Production Emissions (MPEs)” on page 16:Within the diesel case, it can be seen that the non-blue blue colored countries (Poland, Malta, and Latvia) require negative MPE’s to be environmentally viable, obviously an unrealistic case.with:Within the diesel case, it can be seen that the only non-blue colored country is Latvia, where a negative MPE would be required to be environmentally viable, which is obviously an unrealistic case.
- (5)
- As a continuation of this issue, the authors need to replace the original Figure 7:
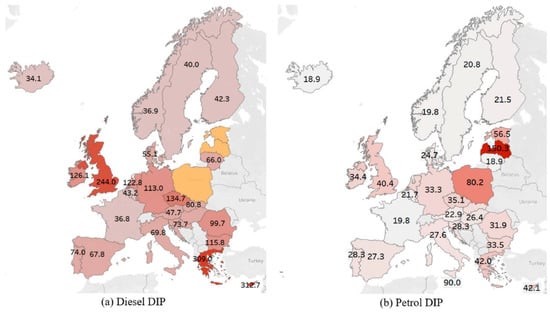 Figure 7. The distances of intersection points (DIPs; measured in thousands of kilometers) between an EV and (a) a diesel vehicle for comparison; (b) a petrol vehicle for comparison (in Figure 7a, the diesel DIP case, Malta does not intersect, and is thus highlighted in orange, but cannot be seen due to its relative size on the map).Figure 7. The distances of intersection points (DIPs; measured in thousands of kilometers) between an EV and (a) a diesel vehicle for comparison; (b) a petrol vehicle for comparison (in Figure 7a, the diesel DIP case, Malta does not intersect, and is thus highlighted in orange, but cannot be seen due to its relative size on the map).
 with:
with: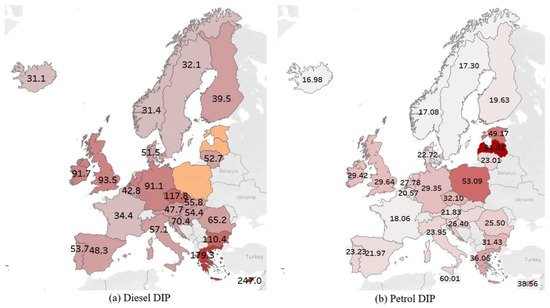 Figure 7. The distances of intersection points (DIPs; measured in thousands of kilometers) between an EV and (a) a diesel vehicle for comparison; (b) a petrol vehicle for comparison (in Figure 7a, the diesel DIP case, Malta does not intersect, and is thus highlighted in orange, but cannot be seen due to its relative size on the map).Figure 7. The distances of intersection points (DIPs; measured in thousands of kilometers) between an EV and (a) a diesel vehicle for comparison; (b) a petrol vehicle for comparison (in Figure 7a, the diesel DIP case, Malta does not intersect, and is thus highlighted in orange, but cannot be seen due to its relative size on the map).
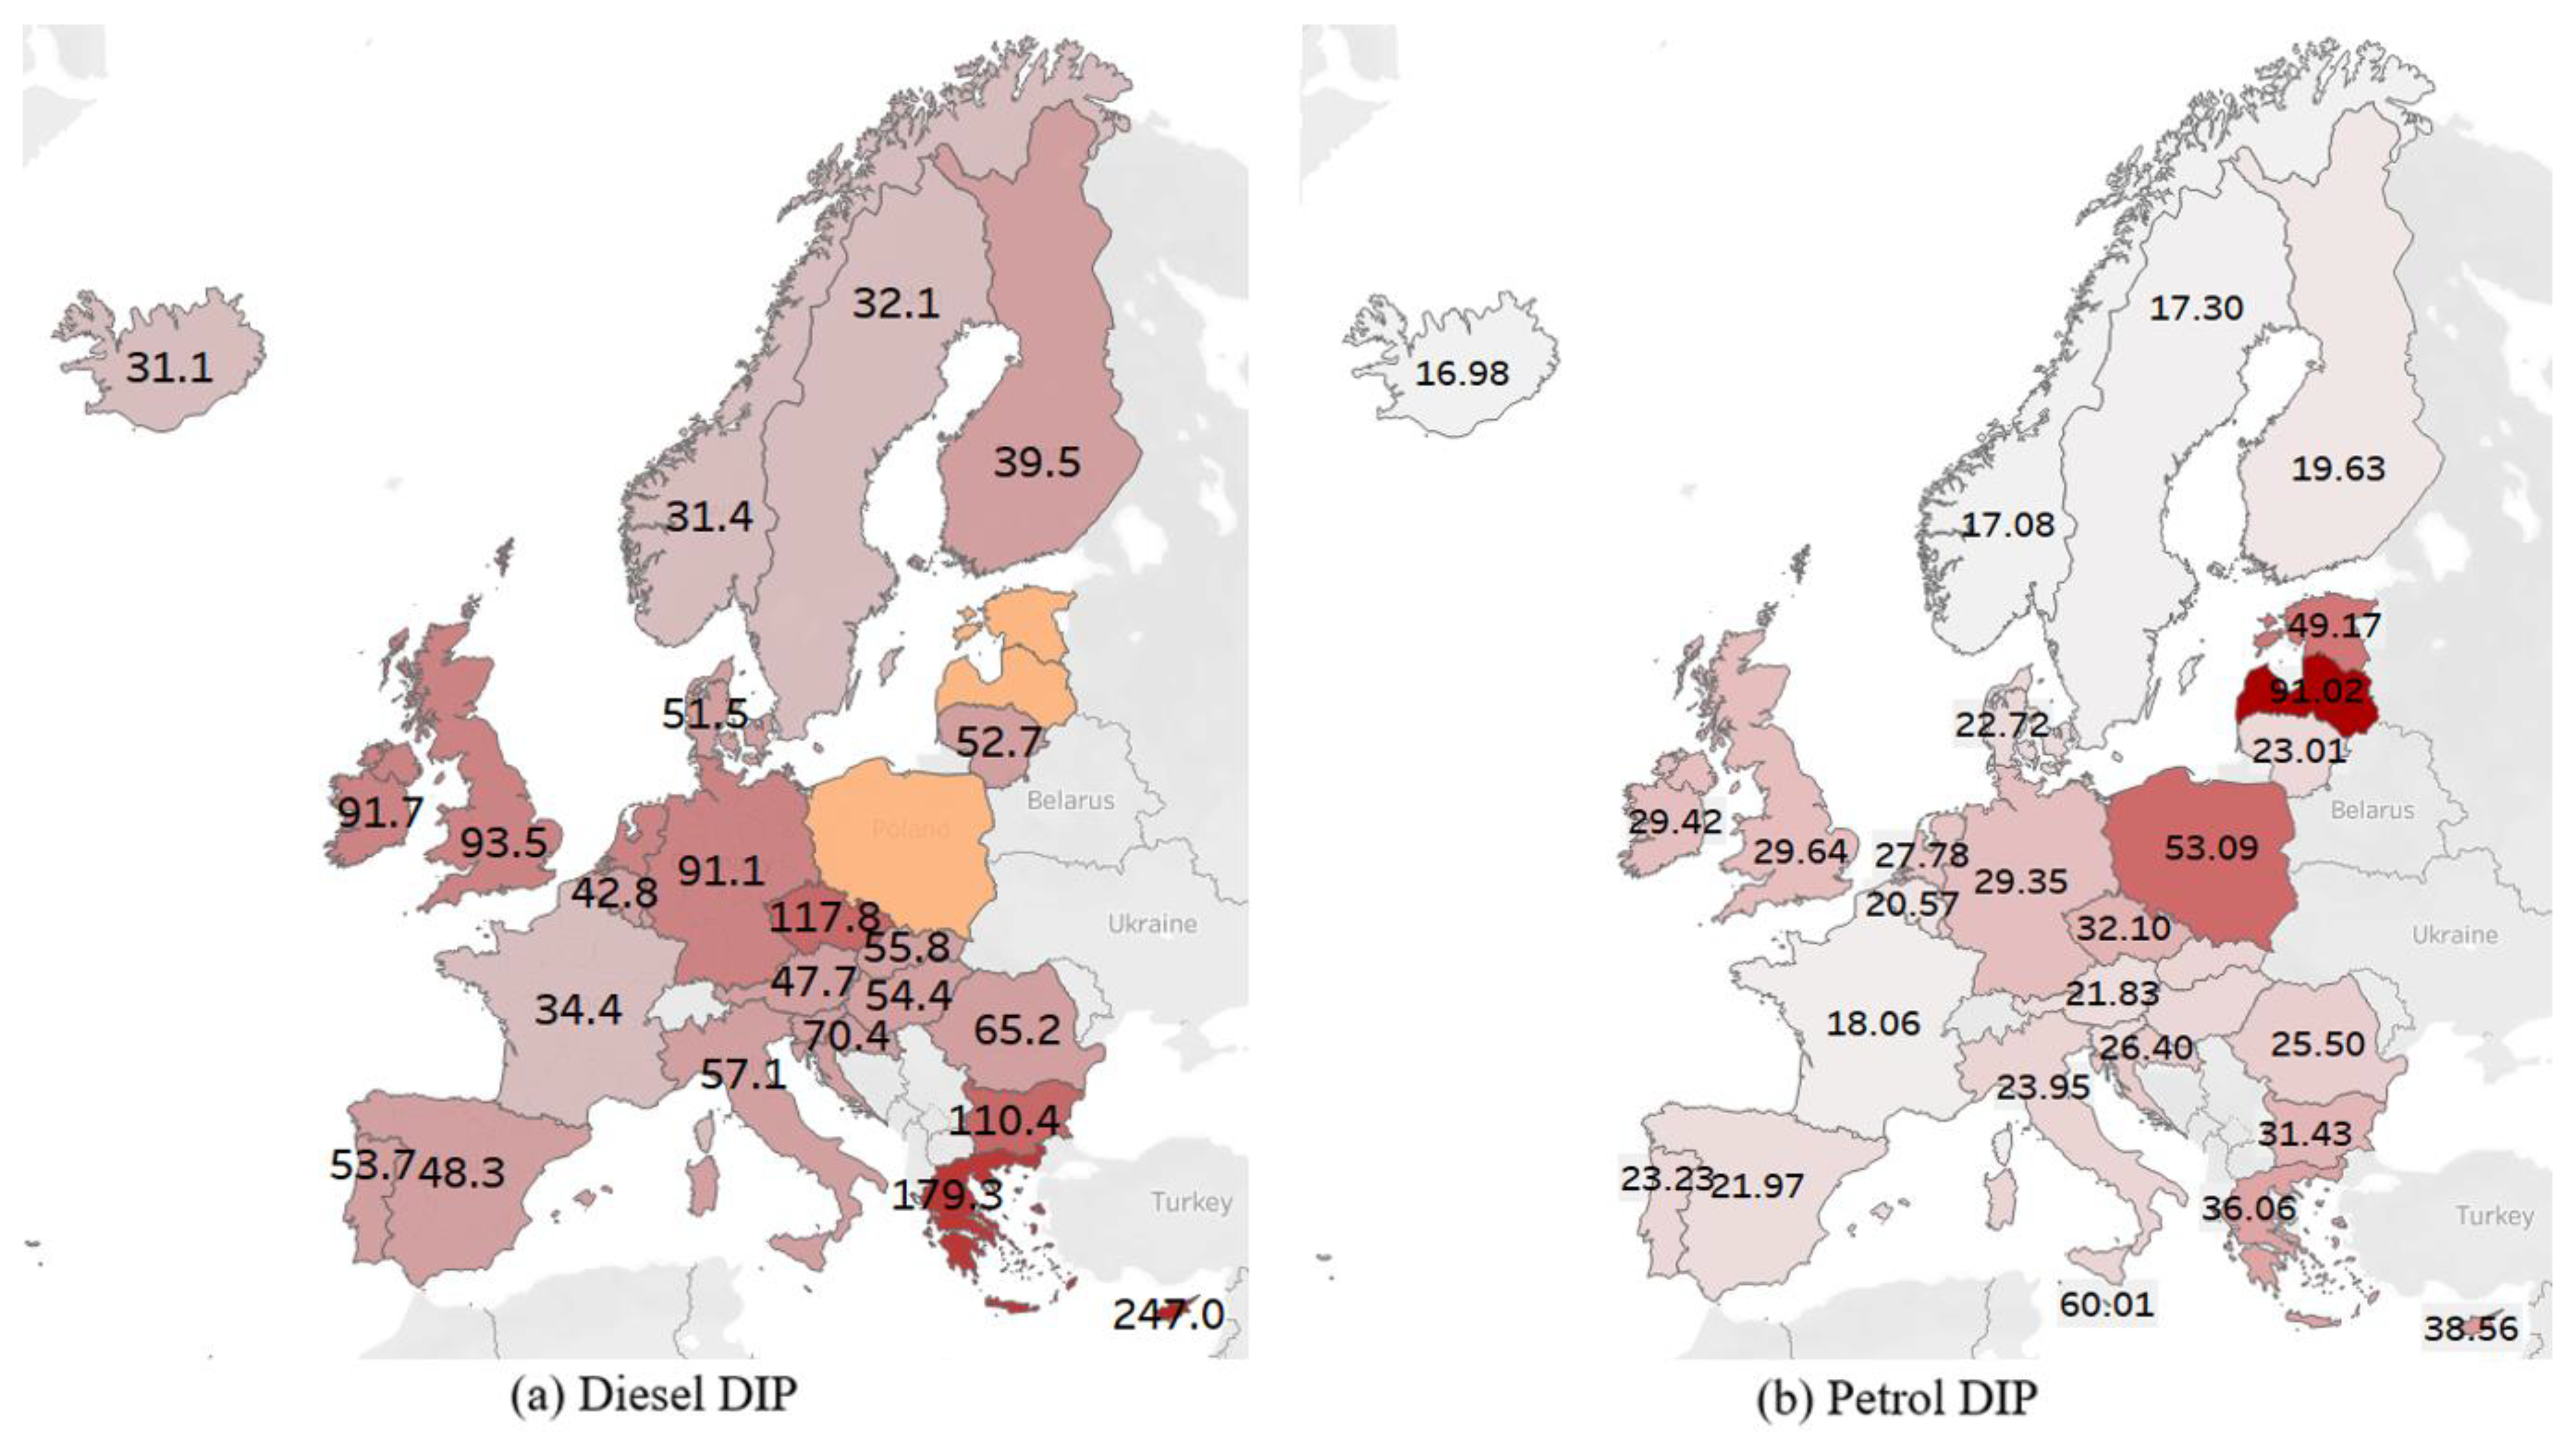
- (6)
- As a continuation of this issue, the authors need to replace the original Figure 8:
 Figure 8. Emissions disparity (ED) (measured in tCO2eq) between an EV and (a) a diesel vehicle for comparison; (b) a petrol vehicle for comparison.Figure 8. Emissions disparity (ED) (measured in tCO2eq) between an EV and (a) a diesel vehicle for comparison; (b) a petrol vehicle for comparison.
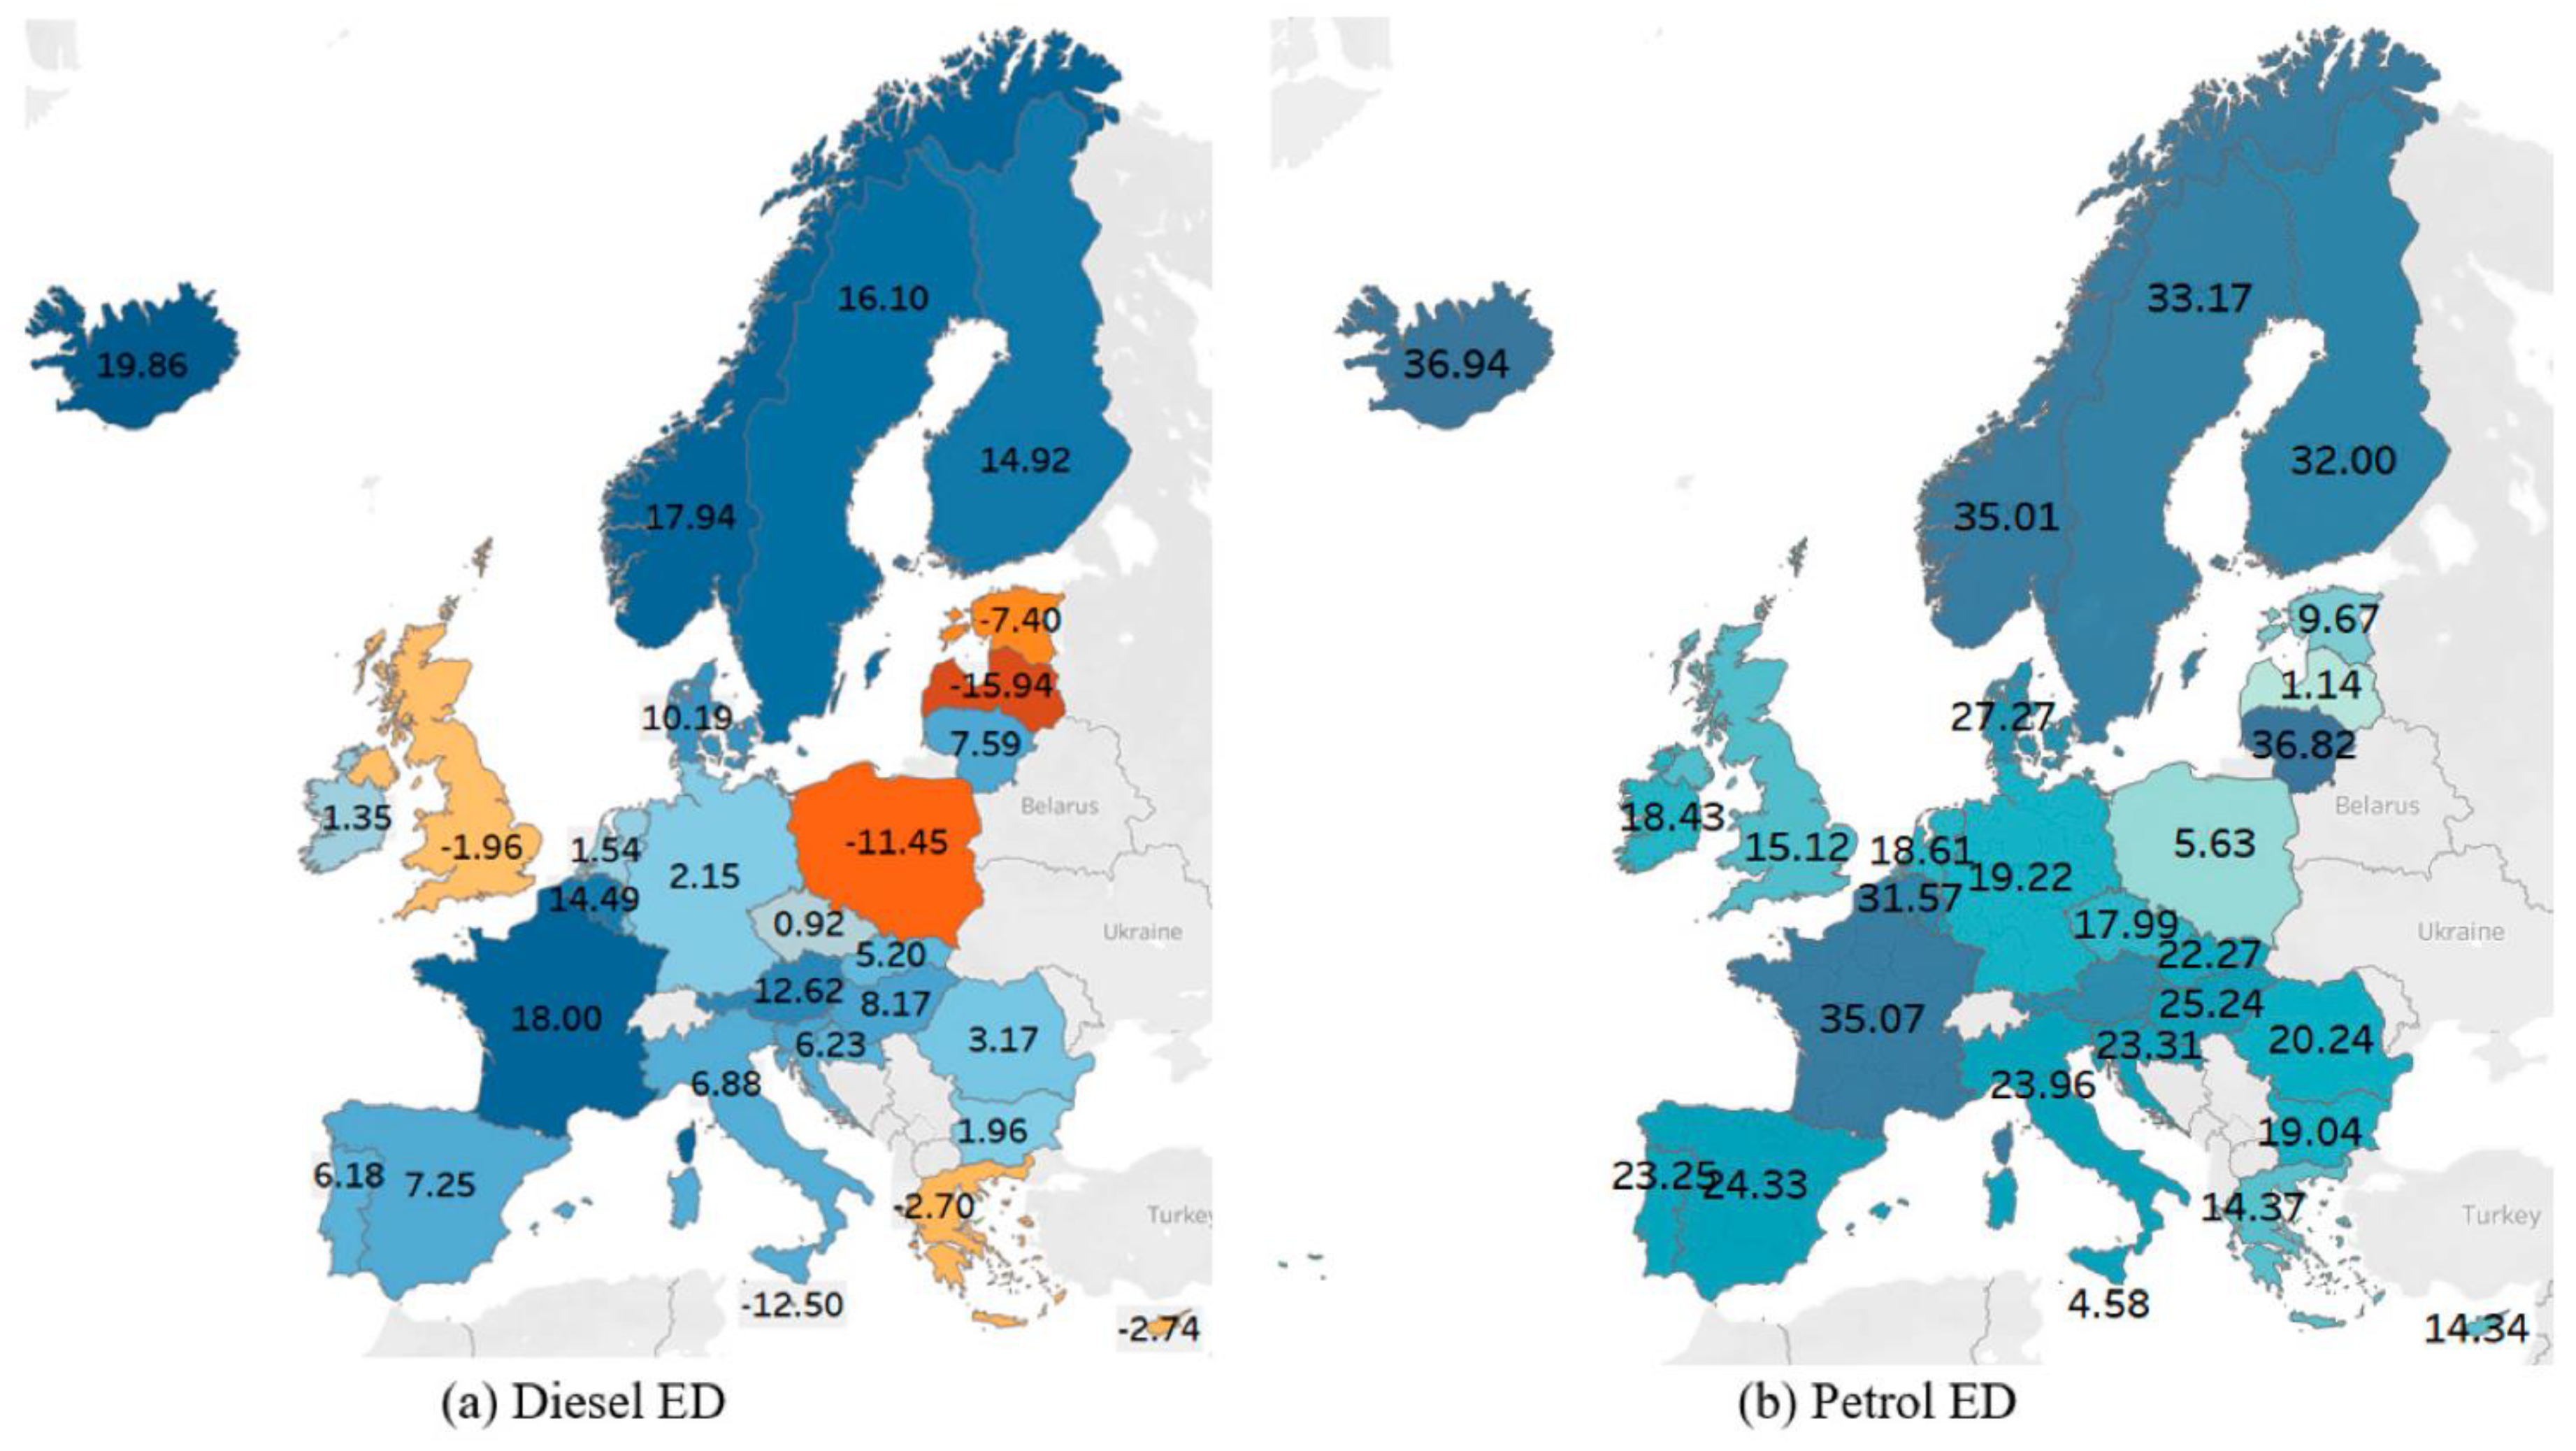 with:
with: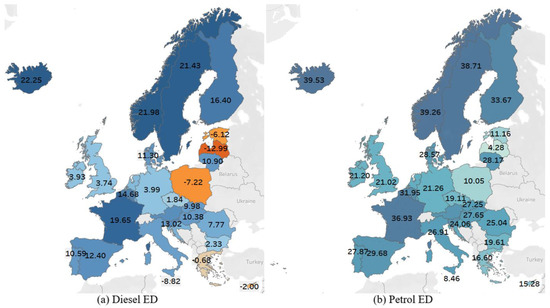 Figure 8. Emissions disparity (ED) (measured in tCO2eq) between an EV and (a) a diesel vehicle for comparison; (b) a petrol vehicle for comparison.Figure 8. Emissions disparity (ED) (measured in tCO2eq) between an EV and (a) a diesel vehicle for comparison; (b) a petrol vehicle for comparison.
- (7)
- As a continuation of this issue, the authors need to replace the original Figure 9:
 Figure 9. Maximum production emissions (MPEs; measured in tCO2eq) of an EV to environmentally outperform (a) a diesel vehicle for comparison; (b) a petrol vehicle for comparison.Figure 9. Maximum production emissions (MPEs; measured in tCO2eq) of an EV to environmentally outperform (a) a diesel vehicle for comparison; (b) a petrol vehicle for comparison.
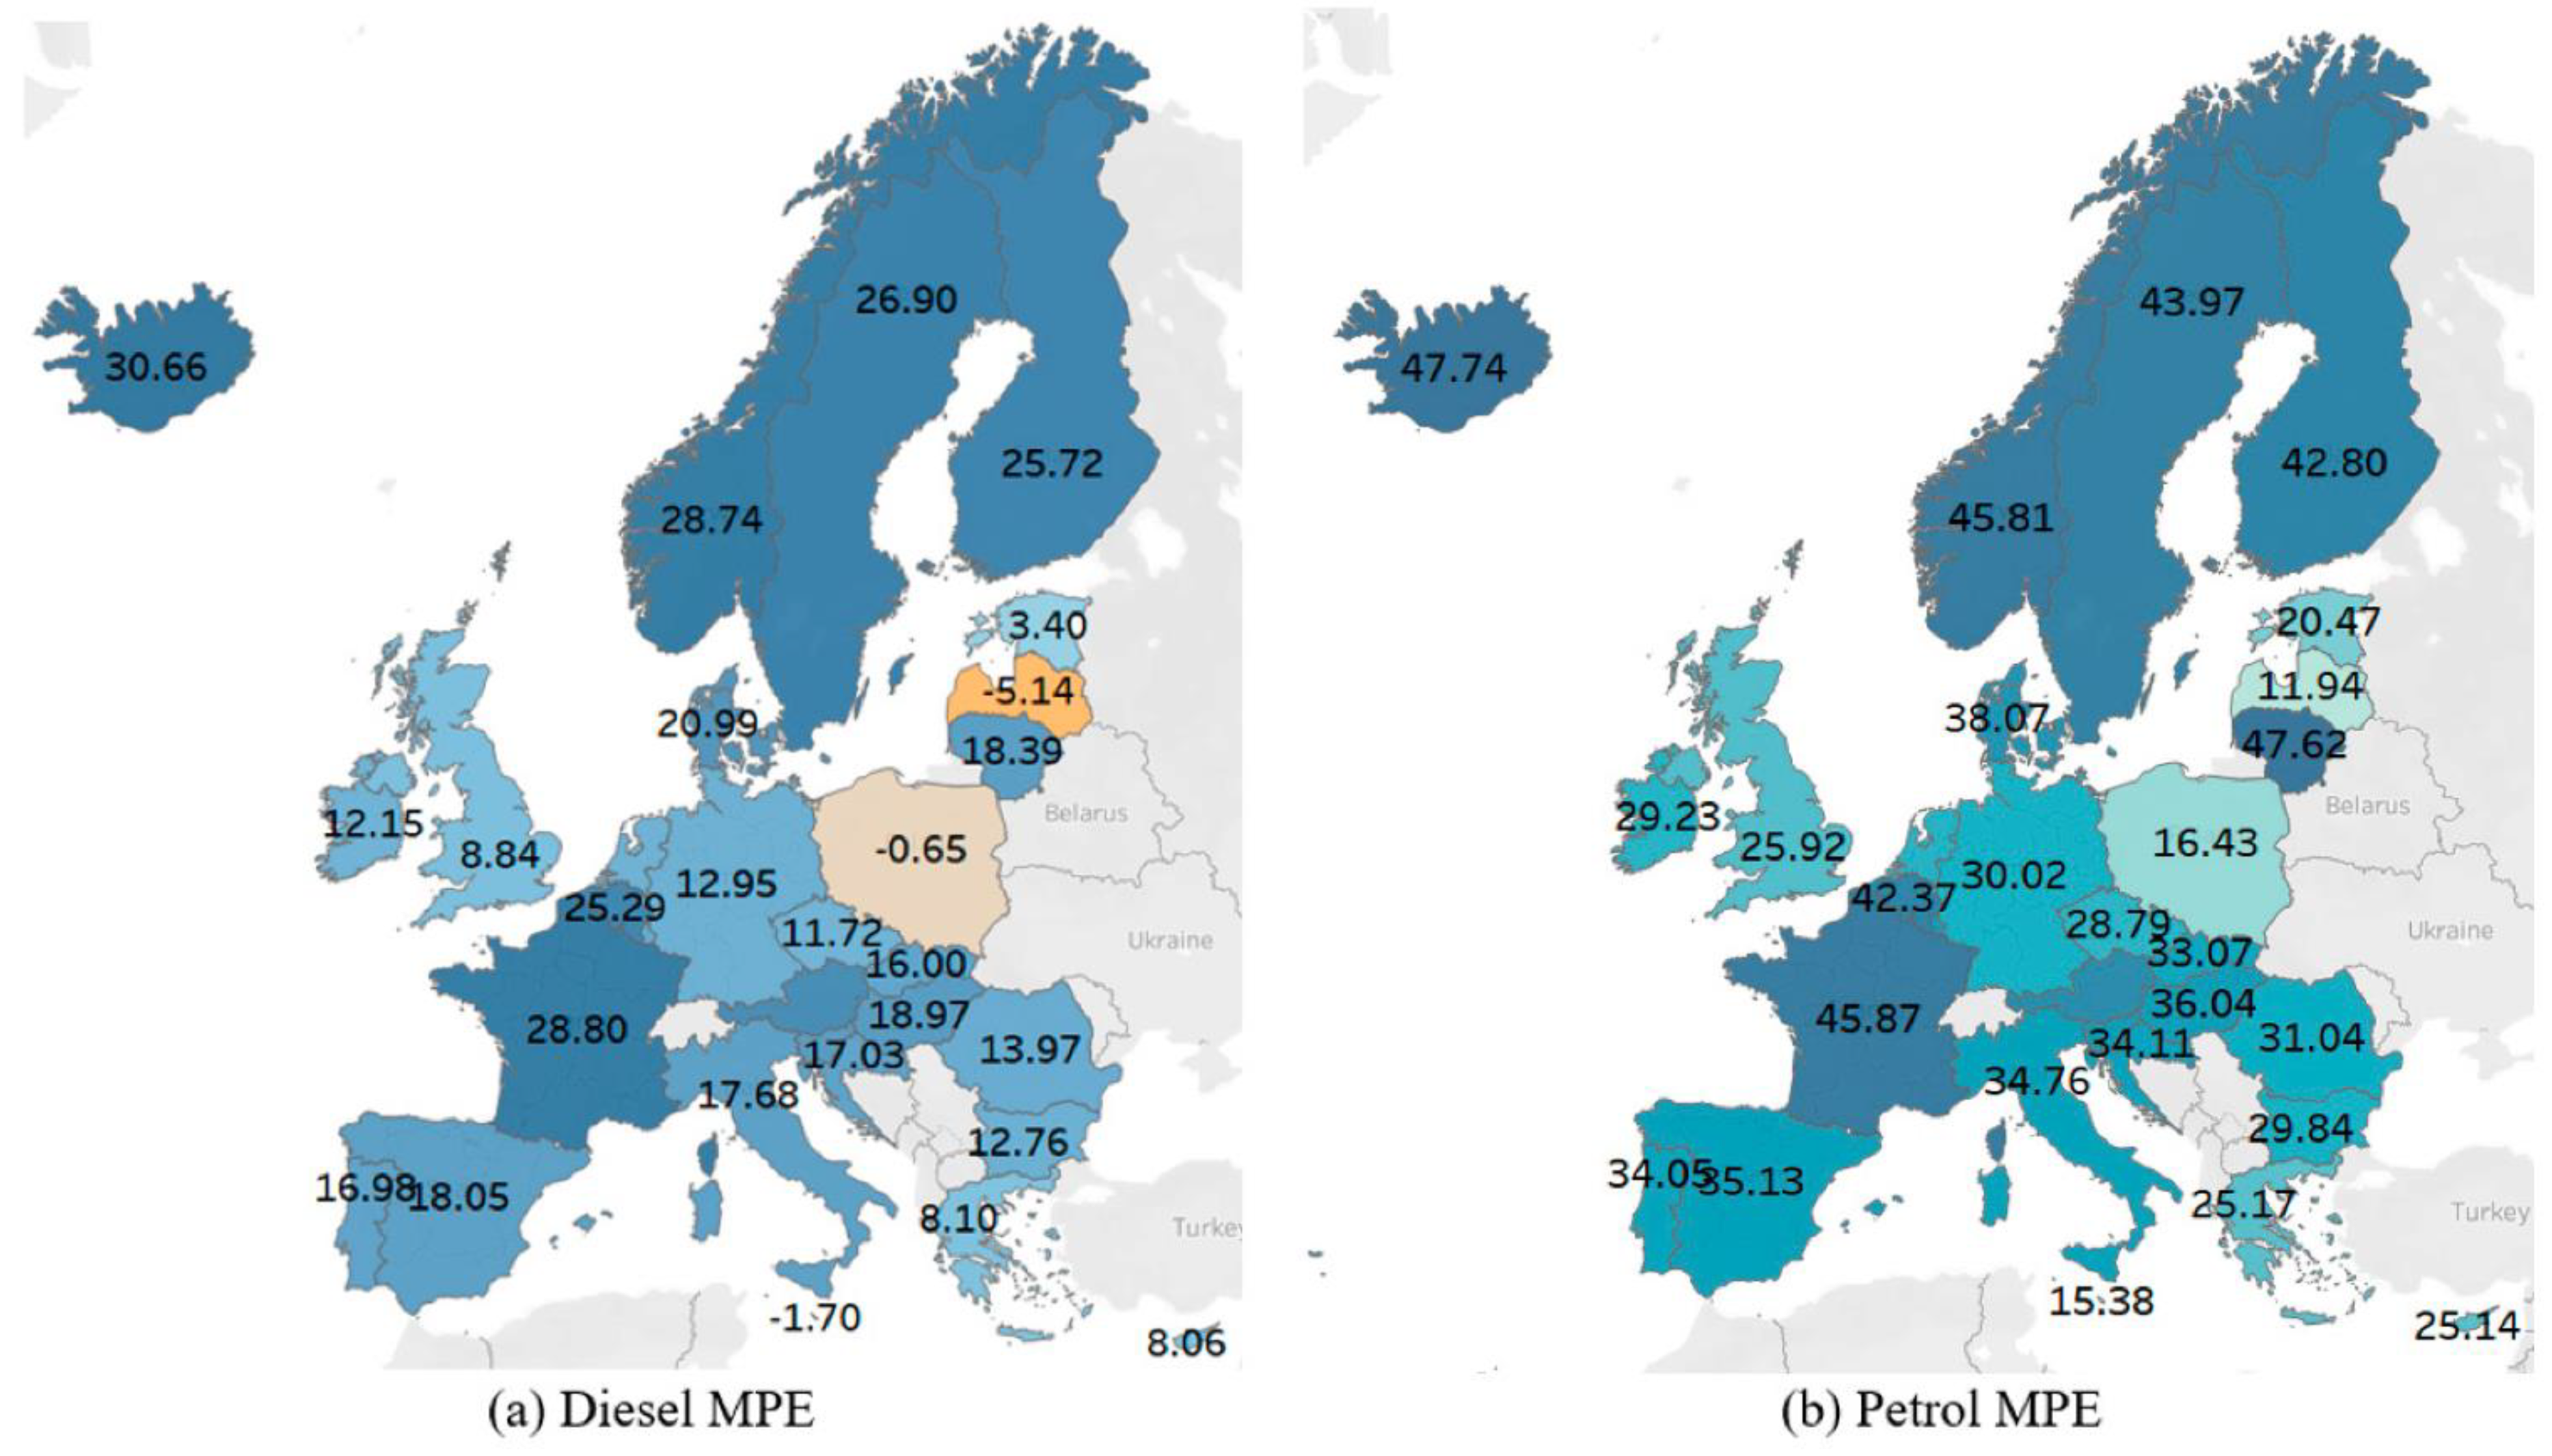 with:
with: Figure 9. Maximum production emissions (MPEs; measured in tCO2eq) of an EV to environmentally outperform (a) a diesel vehicle for comparison; (b) a petrol vehicle for comparison.Figure 9. Maximum production emissions (MPEs; measured in tCO2eq) of an EV to environmentally outperform (a) a diesel vehicle for comparison; (b) a petrol vehicle for comparison.
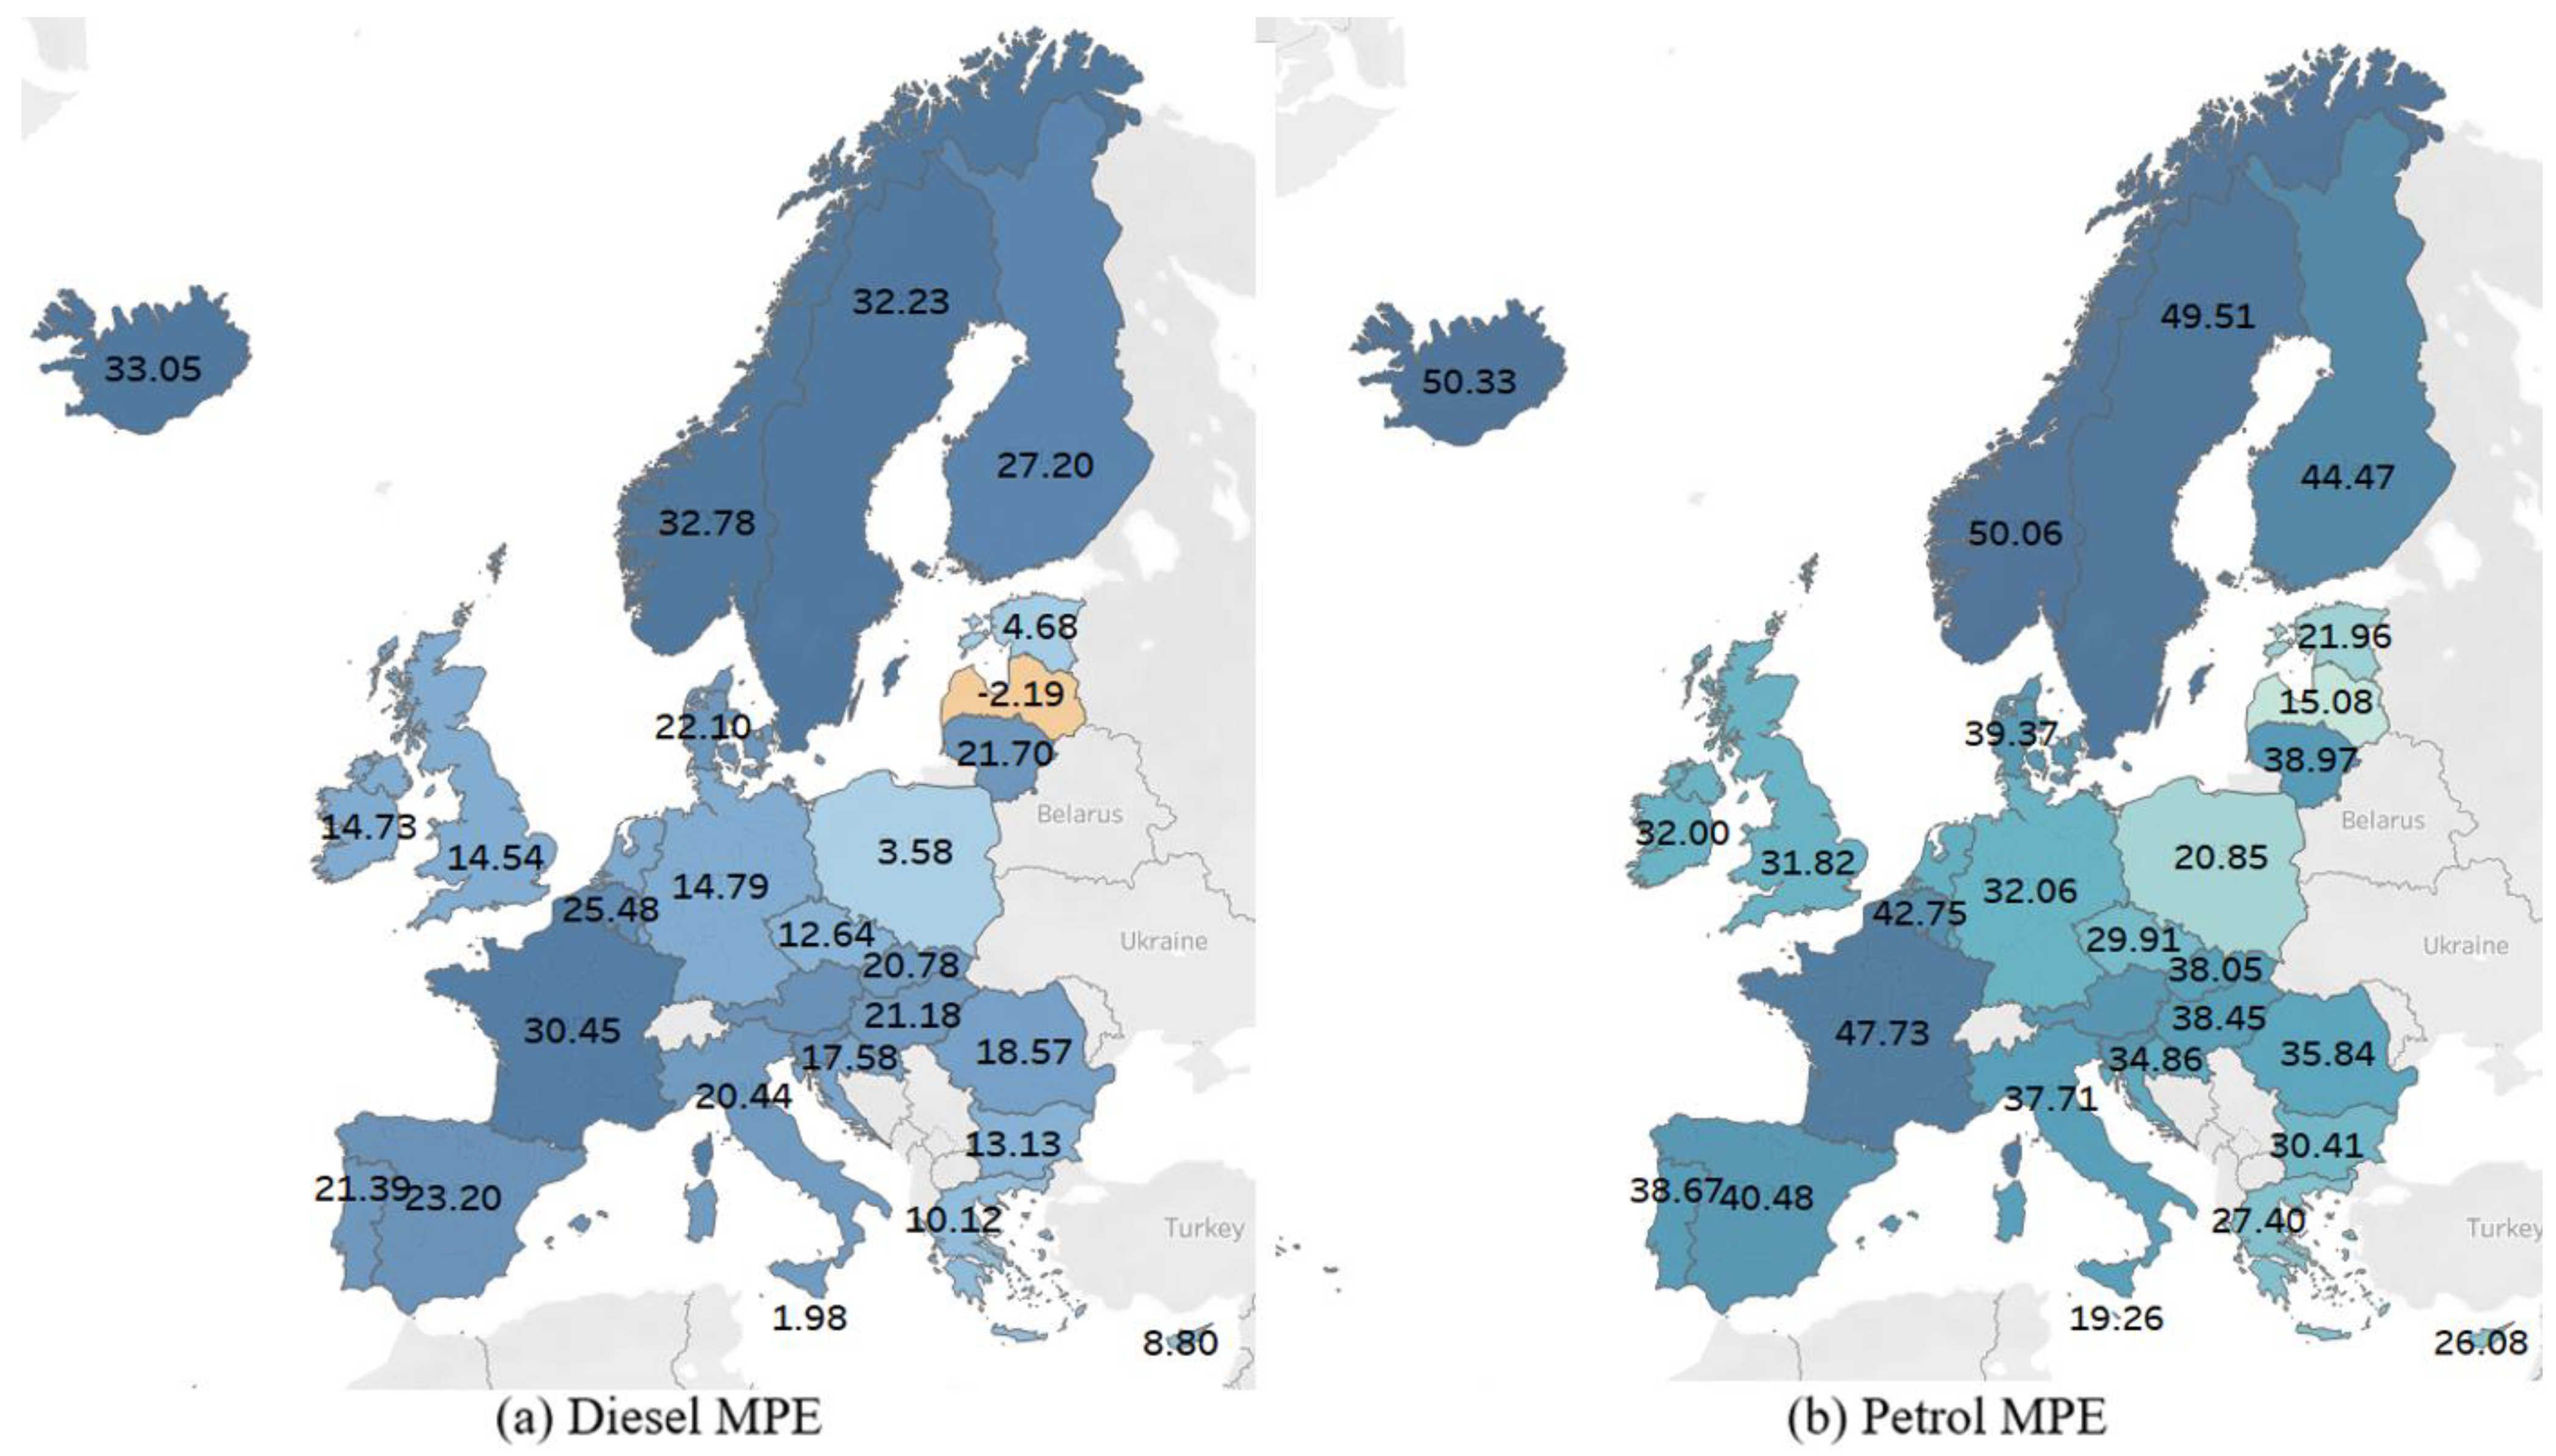
The authors and the Editorial Office would like to apologize for any inconvenience caused to the readers and state that the scientific conclusions are unaffected. The original article has been updated.
Reference
- Dillman, K.J.; Árnadóttir, Á.; Heinonen, J.; Czepkiewicz, M.; Davíðsdóttir, B. Review and Meta-Analysis of EVs: Embodied Emissions and Environmental Breakeven. Sustainability 2020, 12, 9390. [Google Scholar] [CrossRef]
Publisher’s Note: MDPI stays neutral with regard to jurisdictional claims in published maps and institutional affiliations. |
© 2021 by the authors. Licensee MDPI, Basel, Switzerland. This article is an open access article distributed under the terms and conditions of the Creative Commons Attribution (CC BY) license (https://creativecommons.org/licenses/by/4.0/).