Article

Analysis on the Influencing Factors of Farmers’ Cognition on the Function of Agricultural Water Price—Taking Hexi Corridor as an Example

1
Institute of Advanced Studies in Humanities and Social Sciences, Beijing Normal University at Zhuhai, Zhuhai 519087, China
2
Center for Innovation and Development Studies, Beijing Normal University at Zhuhai, Zhuhai 519087, China
*
Author to whom correspondence should be addressed.
Sustainability 2021, 13(9), 5197; https://doi.org/10.3390/su13095197
Submission received: 11 April 2021 / Revised: 28 April 2021 / Accepted: 29 April 2021 / Published: 6 May 2021
(This article belongs to the Special Issue Sustainable Planning and Management of Water Resources in Agriculture)

Abstract

:
Analyzing the farmer’s behavior and the water-saving incentive mechanism is of great significance to the implementation of the explicit subsidy policy of agricultural water prices. This paper introduces the concept of loss aversion from behavioral economics and conducts a theoretical analysis of the incentive mechanism of agricultural water prices to verify the hypotheses by using survey data from the three inland river basins in the Hexi Corridor, Northwest China. The results show that when farmers believe that their water-saving potential is relatively large, the loss aversion of farmers has a significantly positive impact on water-saving incentives under an explicit agricultural water price subsidy. In addition, irrigation canal evaluation and regional differences have negative and positive influences, respectively. Based on this, suggestions are made to actively promote the implementation of explicit subsidy of agricultural water prices in order to save irrigation water.

1. Introduction

According to data from the Chinese Water Resources Bulletin, agricultural water consumption has accounted for 61.4% of the total national water consumption. Gansu Province was higher than the national level, reaching 79.4%, while the Hexi Region in Gansu Province even accounted for 88.2%. The shortage of water resources has always been an important factor restricting the economic development of Gansu Province. With the continuous implementation of China’s “Western Development Strategy” and the gradual acceleration of “One Belt One Road” construction, the bottleneck of water resources has become more prominent.
To solve this problem, we need to take agricultural water use into account and carry out an efficient agricultural water price reform. In general, water is overused with low efficiency in the Chinese agricultural sector. This is closely related to factors such as low agricultural water prices and insufficient farmers’ awareness of water prices. Since agriculture is a weak industry, the state has been subsidizing agricultural water prices, which is also very common in many other countries around the world [1,2]. Agricultural water price subsidies are generally divided into two types: hidden subsidies and explicit subsidies. At this stage, the price of irrigation water for farmers does not fully cover all the costs of government management and supply of irrigation water. At present in China, most irrigation water price subsidies adopt the hidden subsidy model [3]. This kind of subsidy is implicit in the water price. The amount of the subsidy to the water user is not clear, and the government has no clear regulations on the amount of the subsidy or how to issue the subsidy [1]. Although the hidden subsidy model shares the water cost of farmers, the low water price also leads to a lack of inherent motivation for farmers to use water-saving technologies [4]. In the study area of this article, 63.06% of the farmers believe that the water price they pay is higher than the cost of water supply, while 18.79% of the farmers believe that the water fee they pay is equal to the water supply cost, 17.2% of the farmers believe that the water price they pay is lower than the water supply cost, and only 0.96% of farmers think it is much lower. This shows that although the government has long been subsidizing the irrigation water costs of farmers by subsidizing the water management department, the vast majority of farmers are not aware of this, which has led to this subsidy method having no positive water-saving effect for many years. Based on this, many researchers believe that reforming and increasing agricultural water prices are important ways to improve agricultural water efficiency [5,6].
Many empirical studies have shown that rising agricultural water prices will lead to a decline in farmers’ incomes [7,8], and that farmers will start to reduce water use quantity only when water prices increase to a level that significantly reduces planting income [9,10]. The negative impact of rising irrigation water prices on farmers’ income is mainly due to the inelastic demand for irrigation water [11,12,13]. Ward and Pulido-Velazquez (2008) believe that the adoption of water-saving measures does not help users reduce water consumption [14]; it can have the effect of reducing water consumption only when the subsidy is targeted to the amount of water saved. Huang et al. (2010) conducted an empirical study in East China and proposed a subsidy scheme that was combined with irrigation pricing reform—transferring income to households directly to compensate farmers for the loss of income [15]. Many scholars’ research results on the agricultural water price subsidy model show that the implementation of purely “implicit subsidies” for agricultural irrigation water fees (the government subsidizes the difference between the irrigation water price paid by farmers and the water supply cost) is inefficient [16], and the financial department should directly subsidize farmers based on their affordability [17]. The government can increase the price of agricultural water appropriately, and then provide direct subsidies to farmers, which can encourage farmers to save water without harming the established welfare of farmers, and can make agricultural water prices more truly reflect the value of water resources [18,19,20]. Some scholars have used examples of changing “implicit subsidies” to “explicit subsidies”, or have used economic theories, to prove that the existing implicit subsidies are not only conducive to the realization of the value of water resources but also water-saving, while explicit subsidies can achieve the purpose of water-saving [21]. However, there is a lack of study on the influencing factors of the water-saving effect of explicit subsidies, especially from the perspective of farmers. Farmers’ understanding and acceptance of the new policy directly affects the performance of the policy implementation. Therefore, it is very important to explore the influencing factors of the water-saving effect of explicit subsidies from the perspective of farmers. We attempt to analyze the water-saving effect of explicit subsidies with the help of loss aversion theory from behavioral economics, and to verify the hypothesis proposed in the article using survey data of the Shiyang River Basin, Hei River Basin, and Shule River Basin in Northwest China for the period 2013–2014.

2. Related Conceptions and Research Hypotheses

2.1. Explicit Subsidies Defined in this Article
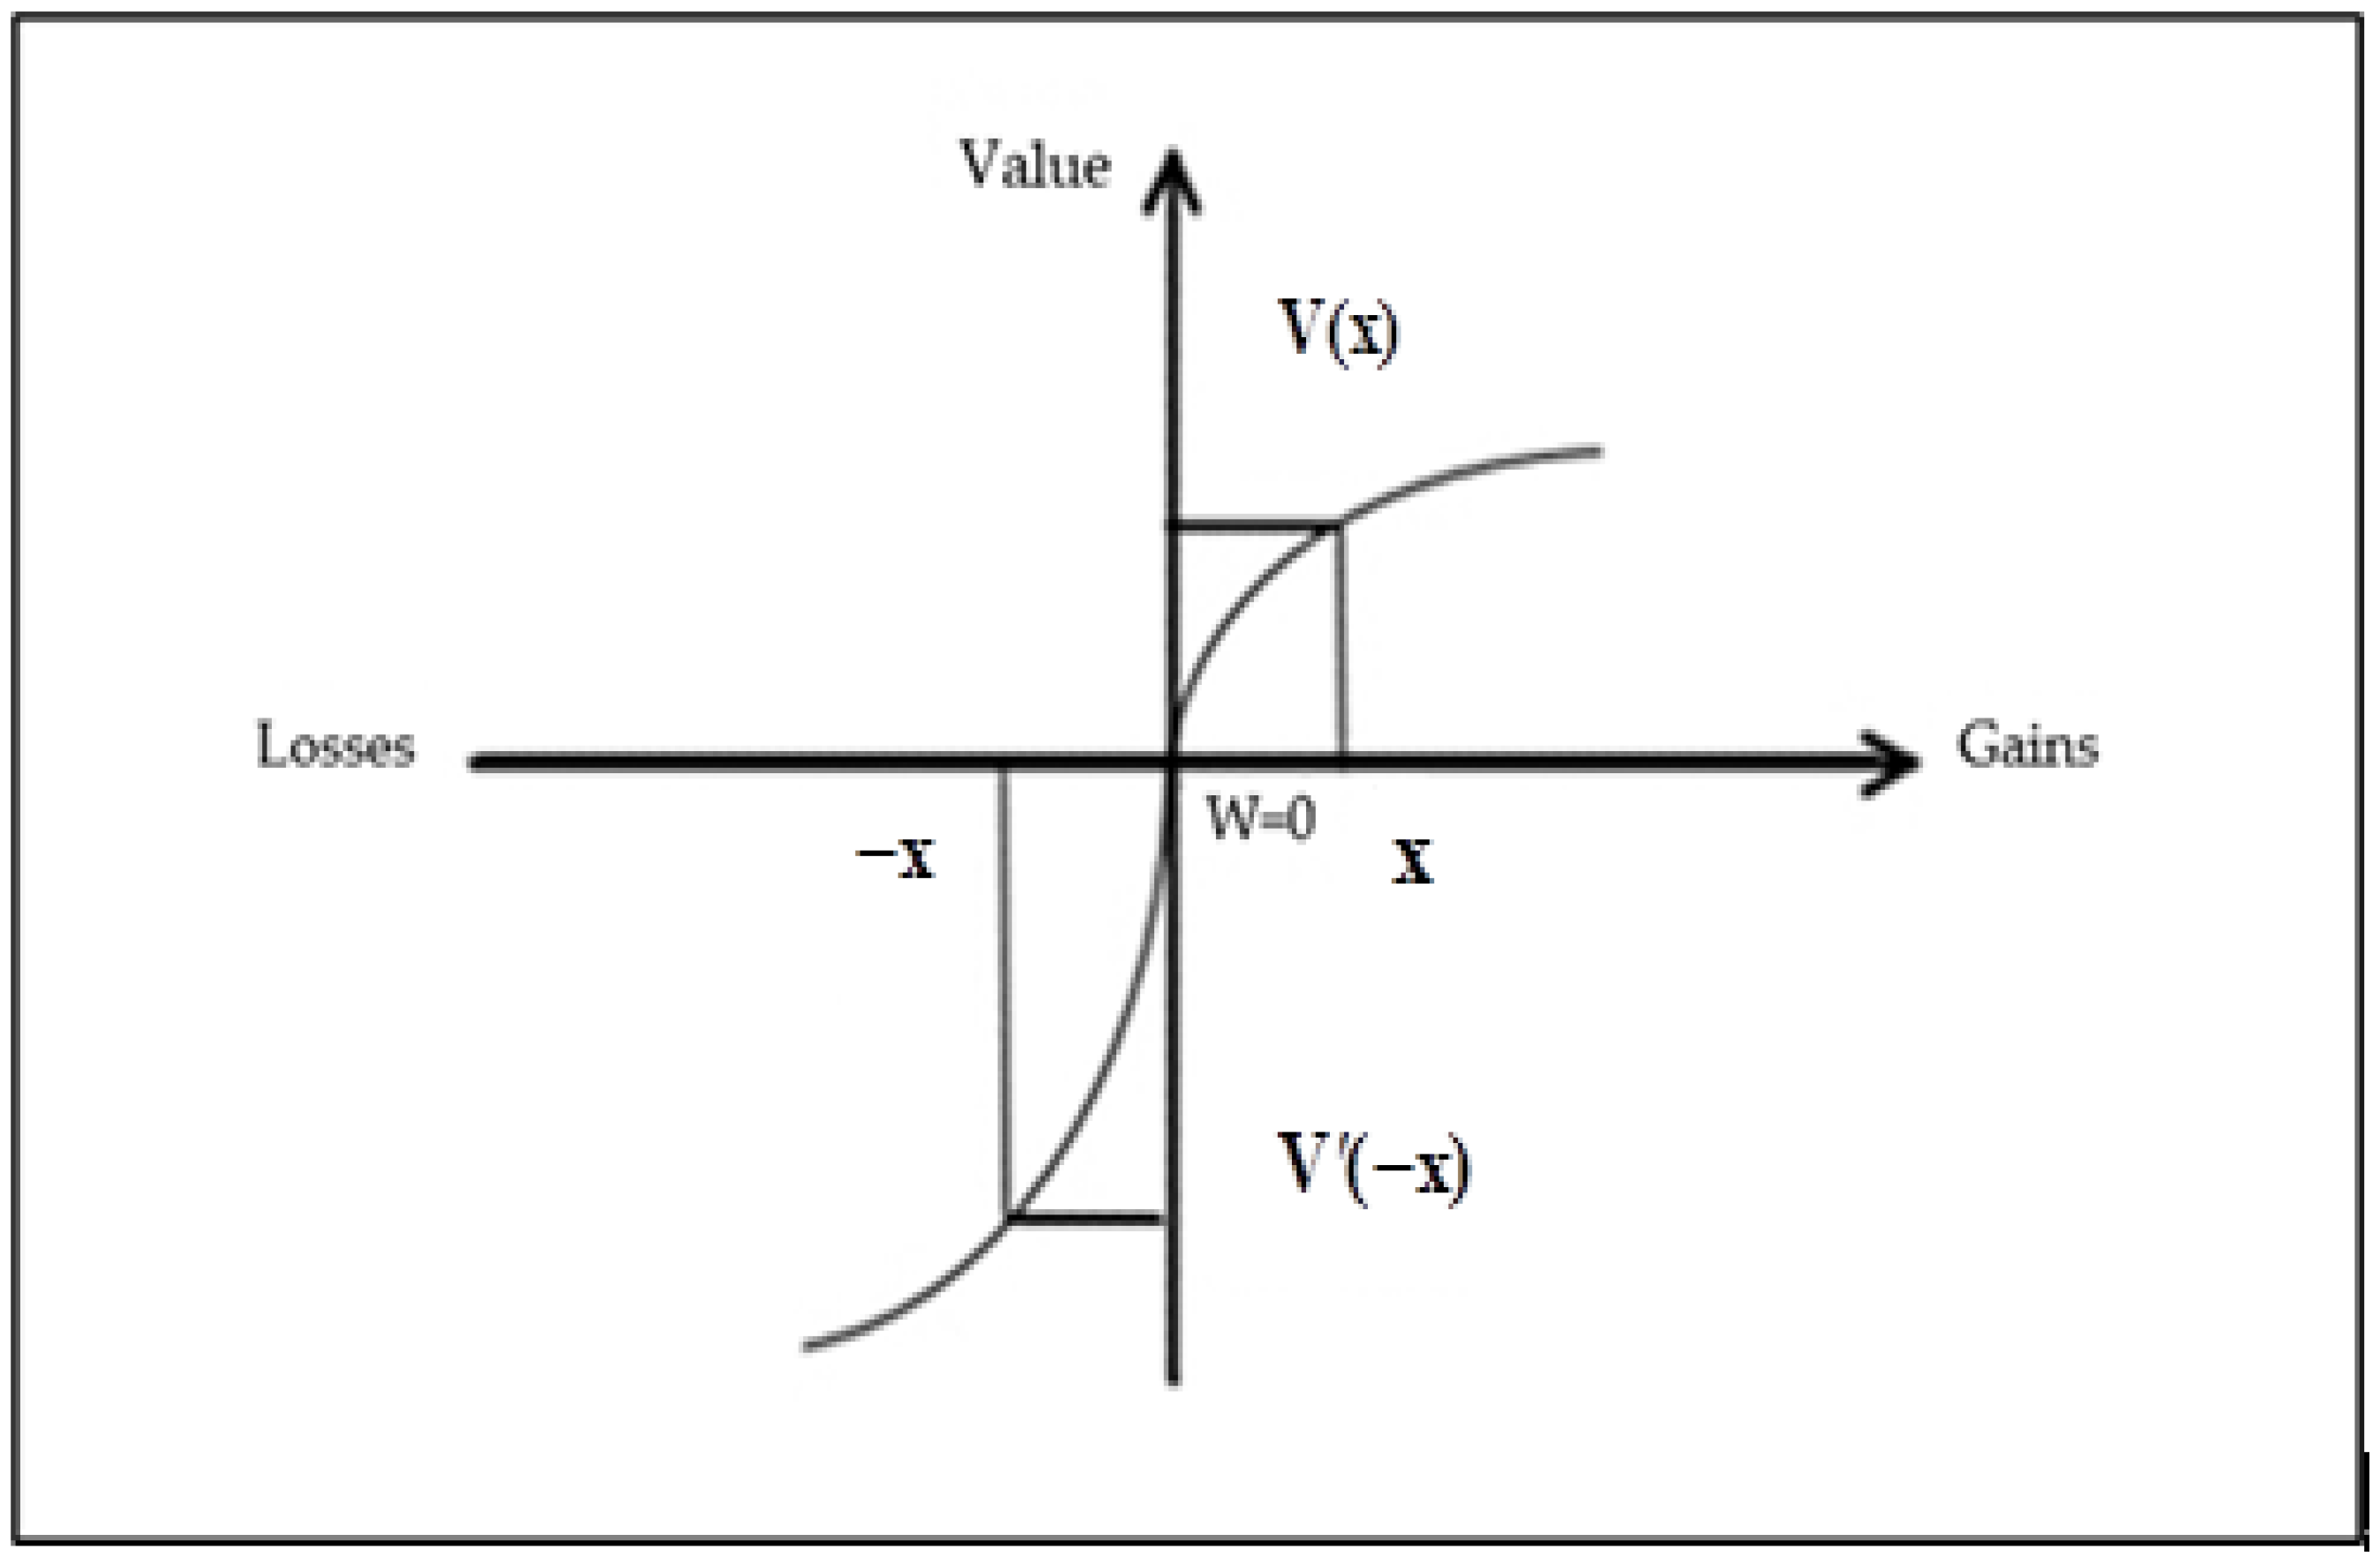
In the questionnaire, a scenario was set up for farmers: the government reformed the agricultural water price and doubled (or more) the current agricultural water price. However, at the beginning of the year, the increased amount of water cost (multiply the approved total water consumption of all arable land by the rising part of the water price) is directly distributed to farmers in the form of subsidies. For farmers, the actual water price has no change (the increase is paid out in cash at the beginning of the year).

2.2. Loss Aversion

Loss aversion is a concept in behavioral economics, first proposed by Kahneman and Tversky (1979) in prospect theory [22]. Prospect theory points out that when people face decision-making under risk, they have three basic characteristics: reference point dependence, dynamic risk attitude, and loss aversion. Reference point dependence means that when people make decisions, they always set a reference point to judge the increase or decrease of their wealth; people show different risk attitudes towards losses and gains based on this reference point. Most people show risk aversion when facing gains, but change to risk seeking when facing losses (that is, dynamic risk attitudes); usually, the pain that people feel when facing the loss of the same currency unit is much greater than the happiness brought by the gain of the same currency unit. This makes the value curve steeper in the loss domain than in the gain domain, as shown in Figure 1. For the same number of gains and losses at x and −x respectively, where x > 0, we have ∣V′(−X)∣ > V(X). There are differences in people’s sensitivity to loss and gain, and the suffering caused by loss is far greater than the happiness of gain [23,24].
Studies have shown that loss aversion is a very common phenomenon in behavioral decision-making, whether it is in risk or non-risk areas [25]. The measurement of loss aversion in the risk field is generally realized by risky gambling games, and participants choose whether to participate or not. Taking the gambling game used by Kahneman and Tversky (1979) as an example, participants have a half chance of winning $50 and a half chance of losing $50. It turns out that the proportion of subjects who are unwilling to participate is higher than the random level. The experiment’s results prove that the psychological effects of equal losses and benefits are not the same. The former is greater than the latter. The endowment effect is used to measure loss aversion in non-risk areas. The endowment effect means that an individual’s evaluation of the value of an item is higher when he/she owns it than when he/she does not [26]. In the experiment, the subjects were asked about the lowest price (willingness to accept (WTA)) at which they were willing to sell an item and the highest price (willingness to pay (WTP)) at which they would purchase the same item; the ratio of the two (WTA/WTP) was regarded as the subject’s degree of loss aversion.
The current loss aversion theory in behavioral economics is mainly used to explain the “market anomaly” from the perspective of traditional economic theory [27], such as the endowment effect [28] and the equity premium [29]. In addition, the theory is also applied to consumption [30,31], financial investment [7,32], trade policy [33], energy [34,35], and politics [36]. There are few studies on applying this theory to water resources, but some scholars have pointed out that the theory of behavioral economics should be combined with water resource management [37].

2.3. Research Hypothesis

The farmers will consider the raised water price as a loss, and the one-off subsidy at the beginning of the year is a kind of gain for them. According to the mental account theory proposed by Thaler (1985) [38], the farmers may be more likely to use this part of the subsidy for water expenses. There are the following three different situations:
(1)
If the water consumptions of the farmers in the current year are equal to their water quotas, the actual water fee paid after deducting the subsidy is the same as before the price increase;
(2)
If the water consumptions of the farmers exceed their quotas in the current year, the water fees of those parts exceeding the quota will make the farmers feel a strong sense of loss;
(3)
If the water consumptions of the farmers in the current year are less than their quotas, the actual water fees paid by the farmers will be lower than before.
Accordingly, the hypothesis proposed in this article is as follows: farmers with loss aversion will think that the explicit compensation scheme proposed in this article is more effective in motivating them to save water.

3. Data Source and Variables Selection

3.1. Data Source

The data analyzed in this paper is a household survey conducted in the three river basins of the Shiyang River, Hei River, and Shule River in 2013 and 2014, which comes from the research project “Agricultural Water Price Reform and Water-Saving Strategy Research in Arid Inland Areas” (12BJY100), funded by China’s National Social Science Foundation. During the survey, a stratified random sampling method was adopted. Firstly, in each of the river basins, 3–4 towns extending along the river from upstream to downstream were selected; secondly, 10 villages were randomly selected from each township; and finally, about 10 villages were selected from 30–40 candidate villages in each basin. Questionnaire surveys were conducted in more than 30 villages in the three basins.
The farmer questionnaire covers four topics: (1) farmers’ family members, their basic agriculture business conditions, income, and expenditure; (2) annual detailed information of planting, irrigation, and sales; (3) farmers’ perceptions of water prices, attitude towards water price and water-saving; (4) farmers’ preferences, including risk attitude, loss aversion, and time preference.
Each village randomly selected 10–12 households to conduct the survey, and the final sample size was 331. After data cleaning, the final sample used in regression analysis is 314, of which 114 are from the Shiyang River Basin and 98 are from the Hei River Basin. The number of samples from the Shule River Basin is 102.

3.2. Variables Selection and Definition

3.2.1. Dependent Variable

This article has selected the water-saving incentive effect of an explicit subsidy as the dependent variable, which is measured by the answer to the question: “Do you think that the water price reform (the explicit subsidy plan mentioned above) is useful to encourage you to save water?”. The options 1–5 range from “completely useless” to “very useful”. The statistical results are shown in Table 1.
The selection with “quite useful” accounted for the largest proportion at 45.54%, followed by “very useful” at 26.75%. About 1/5 people chose “completely useless” and “almost useless”. In general, the majority of farmers think that the explicit subsidy program can stimulate them to save water.

3.2.2. Independent Variables

In order to verify the hypothesis proposed in this article, it should be considered that whether farmers are willing to save water is also largely affected by their evaluation of the irrigation-water-saving potential. If the farmers believe that it does not have any water-saving potential, then the explicit subsidy plan proposed in this article will not be able to stimulate them to save water. Therefore, this paper selects the intersection of farmers’ loss aversion and water-saving potential as the main independent variable.
The loss aversion in the article is measured by the following question: “If another farmer wants to buy your water, what is the lowest price you accept to sell your water (WTA)? If there is water that can be bought, what is the highest water price you are willing to pay (WTP)?” The ratio of the two (WTA/WTP) was used as the subject’s degree of loss aversion.
The reason we asked this question was to make a similar situation to the endowment effect experiment without risk [28], and elicit WTA and WTP from the same individual. The gap between WTA and WTP can be interpreted as evidence for loss aversion in riskless choice. According to the results, all farmers were divided into two categories: 0 = no loss aversion (WTA/WTP ≤ 1), 1 = loss aversion (WTA/WTP > 1). The statistical results are shown in Table 2.
Most documents have confirmed the widespread existence of loss aversion, but our results show that only close to 1/3 of the interviewed farmers have loss aversion. This may be related to the imperfect market of local agricultural irrigation water rights. Water is a special commodity. It is not a fully market-oriented commodity, so the measurement results may only partially reflect the preferences of farmers.
The water-saving potential of farmers is measured by asking farmers to answer the question “In general, do you think your irrigation water has water-saving potential?” Options 1–5 indicate “no potential at all”, “almost no potential”, “balanced”, “some potential”, and “big potential”, respectively. The statistical results are shown in Table 3.
To further observe the impact of loss aversion on the water-saving effect of the explicit subsidy, this paper introduces two interaction terms. The first one is equal to loss aversion (0 = no loss aversion (WTA/WTP ≤ 1), 1 = loss aversion (WTA/WTP > 1)) multiplied by the evaluation of the water-saving potential of farmers, which means the level of water-saving potential considered by farmers with loss aversion; the second one is equal to no loss aversion (1 = no loss aversion (WTA/WTP ≤ 1), 0 = Loss aversion (WTA/WTP > 1)) multiplied by the evaluation of the water-saving potential of farmers, which means the level of water-saving potential considered by farmers without loss aversion. Interaction term 1 and term 2 are designed to isolate farmers who have (no) loss aversion, and observe their perception of water-saving potential and the impact of loss aversion on the dependent variable.
According to the above classification, the sample households can be roughly divided into four groups: households with both loss aversion and water-saving potential, households with only loss aversion but no water-saving potential, households without loss aversion but with water-saving potential, and households without either loss aversion or water-saving potential.

3.2.3. Control Variables

Combining existing literature [34,39,40,41], this paper selects three types of variables as the control variables: household head characteristics, family characteristics, and regional differences.
  • Characteristics of Household Heads
Age: Generally speaking, the older the household heads are, the richer their agricultural production experiences, and the more they are inclined to save water to reduce agricultural production costs. Younger household heads with insufficient production experiences may increase irrigation water to ensure yield. Therefore, it is expected that age will have a positive effect on the incentives for water-saving.
Years of education: The level of farmers’ understanding of the new policy is related to their education. The higher the level of education, the stronger the ability to understand and accept new things. On the whole, education level should have a positive impact on the incentives for saving-water.
Health status: A dichotomous variable is used to reflect the health status of farmers, where 1 = good, and 0 = fair or poor. Farmers with better health will have more energy and have more advantages in agricultural production. Compared with unhealth farmers, they are more inclined to save water, thereby saving agricultural production costs. It is expected that their health status will have a positive impact on the incentives for water-saving.
Identity: A dichotomous variable is used here to reflect the identity of the head of household. Party members or cadres in the village (or both) are the promoters of the implementation of the new policy, and their awareness of the new policy is higher than normal farmers.
Risk preference: We use a question to measure farmers’ risk preference. Farmers have two choices: option A is the opportunity to get 100 RMB for sure (without risk); and option B, a simple lottery with a 50% chance of getting more than 100 RMB (an amount that gradually increases from 150 RMB to 1500 RMB) and a 50% chance of getting nothing, as shown in Table 4.
When the expected value of option B is small, the farmers will tend to choose the risk-free option A. As the possible benefits of option B increase, farmers will start to choose B at a certain amount, and will continue to choose B thereafter. For most of the farmers, we can observe this turning point from option A to B, which can be used to measure the level of risk aversion. We employed a simple way to calculate the risk aversion index of farmers, as shown below:
Risk aversion index = 1—the number of option B was chose/8
This is an inverse indicator. The larger the number of option B, the more risk-averse the farmer is, and the smaller the index. For example, the index will equal 1 if a farmer always chooses the riskless option A, which means an extremely loss-averse person. The larger the index, the more risk-preferring the farmer is. For example, the index will equal 0 if the farmer always chooses option B, meaning a risk-seeking farmer who loves risk. Previous research shows that farmers with an appetite for risk are more willing to try new technologies [42], and they are more receptive to new things. It is expected that the explicit subsidy program will provide water-saving incentives for risk-preferring farmers.
Water price judgment: Farm households are divided into three categories based on their water price judgments: the first category is farmers who believe that the current water price is higher than the cost of water supply; the second category is farmers who believe that the current water price is lower than the water supply cost; the third category is farmers who think that water price is similar to the cost of water supply. This article takes the third category as a reference and introduces two dummy variables to observe whether the explicit subsidy plan will have different water-saving incentives for the three kinds of farmers with different water price judgments.
Canal evaluation: The quality of the irrigation canal directly reflects the quality of the water supply for farmers. The better the channel, the higher the irrigation efficiency of farmers, the less water wasted during the irrigation process, and the greater the potential for farmers to save water. It is expected that the better the canal evaluation, the more significant the water-saving incentives provided by explicit subsidy will be.
  • Family Characteristics
Cultivated land area: Generally speaking, the larger the area of arable land, the more favorable it is for large-scale agricultural production to achieve economies of scale and reduce agricultural production costs. Farmers with a larger area of arable land are more inclined to adopt advanced agricultural production technologies [43], which also means more room for water-saving. Therefore, it is assumed that the area of arable land has a positive effect on the water-saving incentives.
Planting structure: the proportion of the sown area of cash crops to the total sown area. The larger the proportion of cash crops, the more farmers will increase their water consumption to ensure profits. Although the explicit subsidy program can help active farmers save water costs, for those with a large proportion of cash crops, they are not motivated to save water in order to ensure yield.
Irrigation water used: Total water consumption per mu. Farmers who used too much irrigation water have insufficient water-saving awareness and insufficient planting experience. The water-saving space of these farmers is larger than that of farmers who used less irrigation water. Therefore, under the stimulation of the explicit subsidy program, farmers who used more irrigation water will be more motivated to save water.
Greenhouse: Farmers were asked whether they had used a greenhouse in 2012, which is a dichotomous variable. This variable is used to reflect the ability of farmers to accept new things and new technologies. Farmers who use greenhouses are more able to accept the implementation of the explicit subsidy program, which can promote farmers to save more water.
  • Regional Differences
There are differences in the natural environment of the three inland river basins. First, there are differences within the same watershed. Differences in elevation, precipitation, temperature, and evaporation in the upper, middle, and lower reaches of the river lead to differences in the supply of surface water and groundwater. Second, there are differences between the river basins. The three river basins run from east to west. As rainfall has decreased and evaporation has increased, the degree of drought has gradually increased, and the water demand of crops has also increased accordingly. Third, the human environment of the river basins is different. The population density of the three river basins gradually decreases from east to west, and the per capita arable land area and irrigation quota per unit of arable land increases. The above-mentioned differences will more or less interact and affect the views of farmers in the basin on the use of irrigation water, and the water-saving incentives. However, because these influencing factors are difficult to separate and refine in one survey, many factors interact with each other. Therefore, all the independent variable factors not mentioned above are integrated into regional difference factors and included as an influencing variable in the regression analysis. Shiyang River basin was taken as the reference area, and two dummy variables of Hei and Shule River were introduced to compare with it.
A specific description of the variables is shown in Table 5.

4. Hypothesis Verification

4.1. Model Selection

The dependent variable is an ordered discrete variable, so the ordered response model is adopted here. The ordered Probit model is the most commonly used model for predicting ordered discrete variables. In this paper, the input of the model is a vector Xi composed of factors x1ixmi that affect the water-saving incentives of the explicit subsidy scheme, and the output variable yi is the farmer’s evaluation of water-saving incentives. A continuous implicit variable y* is defined, which should be a mapping of yi, used to reflect the internal change trend of farmers’ incentives for water-saving. The general form of the ordered Probit model is:
y* = βX + ε
in the formula, β represents the parameter vector, and ε is the random error of the standard normal distribution, which represents the sum of other factors that are not considered in the model but have an impact on the dependent variable. According to the division of the incentive effect of water saving, the value interval of the continuous variable y* is divided into 5 intervals by setting the threshold αi (where α1 < α23 < α4), then there are [44]:
y = { 1 ,     y * α 1 2 ,     α 1 < y * α 2 3 ,     α 2 < y * α 3 4 ,     α 3 < y * α 4 5 ,     y * > α 4
The probability that yi appears in each interval, that is, the calculation equations of the conditional probability of yi with respect to X, are:
{ P ( y = 1 | X ) = Φ ( α 1 β X ) P ( y = 2 | X ) = Φ ( α 2 β X ) Φ ( α 1 β X ) P ( y = 3 | X ) = Φ ( α 3 β X ) Φ ( α 2 β X ) P ( y = 4 | X ) = Φ ( α 4 β X ) Φ ( α 3 β X ) P ( y = 5 | X ) = 1 Φ ( α 4 β X )
where Φ () is the cumulative distribution function of the standard normal distribution.

4.2. Regression Analysis Results

The results are shown in Table 6.

4.2.1. The Impact of the Intersection of Loss Aversion and Water-Saving Potential

The results show that interaction term 1 was positively significant at the 5% level, while interaction term 2 has a positive but not significant impact on the dependent variable, which shows that among the farmers who think there is water-saving potential, the farmers with loss aversion will think that the explicit subsidy policy has a significant water-saving incentive effect. However, the impact of loss aversion is not significant for those farmers who think they do not have the potential to save water. The incentive effect of explicit compensation can only be exerted when farmers have expectations for water-saving potential.

4.2.2. Influence of Control Variables

Among the characteristics of the head of household, the health status of the head of the household is positively significant at the level of 10%, indicating that farmers with better physical conditions have more water-saving incentives if the explicit subsidy program is applied. This is in line with our expectation that farmers with good physical conditions have more advantages in agricultural production, and under the stimulation of the explicit subsidy program, they are more willing to save water and reduce production costs.
Water price judgment 1 and water price judgment 2 are positively significant at the levels of 1% and 5%, respectively. Water price judgment 1 refers to farmers who believe that the current water price is higher than the cost of water supply, and water price judgment 2 refers to farmers who think that the current water price is lower than the cost of water supply. Compared with farmers who think that the current water price and water supply cost are equal, both types of farmers believe that the explicit subsidy plan can stimulate them to save more water.
The canal evaluation that reflects farmers’ evaluation of irrigation infrastructure has a significant negative impact on the water-saving incentives of the explicit compensation scheme. The farmers who believe that the canal is well maintained may feel that they don’t have much room for water-saving. However, those farmers with poorly maintained canals may consider that they can easily save water by improving their canal quality, and thus the explicit subsidy program can provide more incentive for them to save water.
The amount of irrigation water used per unit of land (logarithm) has a significant negative impact on the water-saving incentives of the explicit compensation scheme; that is, the more irrigation water used, the less water-saving incentives there are under the explicit compensation scheme. In the survey area, the amount of irrigation water used per unit of cultivated land mainly depends on the sufficiency of water resources and the strictness of irrigation water management—the more water resources and the looser the regional irrigation water management policy, the more irrigation water can be used. Farmers in areas where water resources were not strictly managed may have insufficient awareness of water shortages, and lack of motivation to save water.
The parameters of both two region dummy variables (Hei River and Shule River) are significantly positive. This means that compared with farmers in the Shiyang River Basin, farmers in both the Hei River and Shule River Basin have more water-saving incentive with the explicit compensation policies. The Shiyang River basin has implemented a very strict system for water resource management since 2007. After a series of reforms in Shiyang River basin, the water-saving potential of local farmers is exhausted by its existing management policies and water quota standards, and there is no room for continued water saving [45]. Compared to the Shiyang River, both Hei River and Shule River basins have more water resources and relatively loose management of agricultural irrigation water. As the consequence, farmers in these two basins believe that the explicit subsidy program can stimulate them to save water.

5. Discussion

The research results confirmed our hypothesis, but the purpose of the water price reform is to promote farmers to save water. According to our research results, the following three measures can be used to encourage farmers to save water.
Firstly, the local governments should actively explore how to implement a new agricultural water price reform, using an explicit subsidy policy.
To fully realize the value of water resources and improve the efficiency of water use, it is an inevitable choice to increase agricultural water prices. At the same time, we need to clarify that the essence of agricultural water price reform is to promote farmers to save water, rather than to simply increase prices and costs of agricultural production. At present, most farmers in the study area do not have sufficient awareness of the value of water resources and water supply costs, which leads to many obstacles to simple price increases. Therefore, the current agricultural water price reform should take into account both price increase and compensation. While increasing water prices, it should also increase farmers’ awareness of the value of water resources through publicity. On this basis, considering the nature of a weak industry like agriculture, a certain amount of compensation is used to eliminate the loss of farmers due to the increase in water prices. At present, many places in China have implemented an explicit subsidy policy for agricultural water prices [46], but due to the large differences in specific implementation plans, the water-saving effects are not the same.
The explicit subsidy policy needs to focus on two key points: how much to increase the water prices and the way to compensate farmers. A small increase in water prices makes it hard to effectively stimulate farmers’ awareness of water-saving, while a large increase in water prices will easily lead to an increase in the production costs of farmers, which will stimulate farmers to save water but hurt farmers’ enthusiasm for agricultural production. Therefore, the water price increase and its compensation amount and program design are very critical. Our results show that if the local governments can work with economists and make full use of behavioral economics, especially loss aversion, they can design a better water price mechanism, and stimulate farmers to save more water.
Secondly, the local governments should strengthen publicity and education, and enhance farmers’ awareness of the real value of water.
Farmers are the key to agricultural water price reform. Strict water resource management policies can be effective in the short term, but in the long run, agricultural water conservation can only be sustained if farmers have an awareness of water conservation. At the same time, the government should not damage the income of farmers in pursuit of water conservation. The government’s focus should be on improving water efficiency and eliminating waste. This requires the government to strengthen publicity and education, and make farmers understand the relevant policies through multiple channels. The traditional publicity methods of issuing leaflets and printing slogans are not so effective. New media should be considered to allow farmers to better understand and accept the new policies, and at the same time, the construction of water-saving facilities should be actively promoted to make farmers realize that their traditional irrigation methods have significant space for water saving, and to enhance farmers’ ability and confidence in exploiting the water-saving potential. All these methods are conducive to the implementation of an explicit subsidy policy for agricultural water price reform, which ultimately benefits farmers.
Thirdly, the local governments should improve the water rights trading market and infrastructure construction.
A well-designed water rights trading market and well-maintained irrigation infrastructure are important guarantees for agricultural water price reform. The water rights trading market plus a well-maintained canal network can realize the transfer of agricultural water between different water users and improve the efficiency of water resource allocation [47]. Although Gansu Province has achieved some successful pilot experiences in agricultural water rights trading in recent years, there are still many problems that need to be further improved [48]. Relevant departments should actively encourage farmers to jointly contribute to canal maintenance, which can not only reduce unnecessary losses such as leakage and evaporation caused by dilapidated canals, but also facilitate the installation of water-metering facilities, thus enabling the successful implementation of agricultural water price reforms.
Furthermore, when the ecosystem is damaged, it is worthwhile for us to learn from the Lake Karla case in central Greece, which not only solved the problem of a water resource shortage, but also brought environmental and economic benefits. Thus, nature-based solution (NBS) projects in agriculture may be conducive to the sustainable development of the local environment and economy [49].

6. Conclusions

The explicit compensation mechanism of agricultural water can provide more water-saving incentives for farmers who both have loss aversion and believe that they have water-saving potential. For farmers who don’t think there is water-saving potential, the water-saving incentives provided by explicit subsidies are not very effective. This conclusion provides us with a more specific and interesting perspective when designing policies. First, the government needs to consider how to help farmers improve their ability and confidence to make full use of water-saving potential, through measures such as publicity and technical support. Second, relevant departments may need to design different policies for different groups of farmers.
The health status, water price judgment, and canal evaluation of farmers all have a significant impact on the incentive effect of water-saving. Farmers in good physical condition are more energetic and more efficient in agricultural production, so they believe that the explicit subsidy program can provide them more water-saving incentives. Farmers who feel that the current water price is higher than the cost of water supply and that the current water price is lower than the cost of water supply both believe that the explicit subsidy program can stimulate them to save more water. The evaluation of the canal by farmers is related to the location of the farmer’s plot in the canal irrigation system. Farmers with a poor evaluation of the canal believe that the explicit subsidy program has a water-saving incentive effect, while those with a better canal may consider that they have less water-saving space. Therefore, the explicit subsidy program has little effect on their further water-saving incentives.
The water resource management system also has an impact on the water-saving incentive of the explicit subsidy scheme. This is reflected in the fact that parameters of the amount of irrigation water used per unit of land (logarithm) and regional dummy variables all are significant. Farmers with more irrigation water per unit of cultivated land have less incentive effect of the explicit subsidy program. In the survey area, the average amount of irrigation water per mu depends on both the richness of water resources and the strictness of irrigation water management. Among the regional variables, the Hei River and Shule River both have significant positive impacts, indicating that compared with the Shiyang River basin, farmers in the Hei and Shule River basins believe that the explicit subsidy program can stimulate them to save water. Under the pressure of ecological governance, Shiyang River initiated a comprehensive river basin management project in 2007. Through a series of strict water resource management measures, the ecology was improved. The water consumption of farmers has been continuously decreasing, and the amount of water-saving has reached an extreme, so the explicit subsidy program has a very limited effect on water-saving incentives for farmers in the Shiyang River Basin. The Hei and Shule River basins are not under such big pressure from ecological governance, and the management departments of surface water and groundwater are separated from different institutions. There are still a lot of farmers in the Hei and Shule River basins that have water-saving potential.

Author Contributions

Conceptualization, W.Q. and Q.T.; methodology, W.Q. and Q.T.; validation, W.Q. and J.Y.; formal analysis, Y.T.; investigation, W.Q.; resources, W.Q.; data curation, Y.T.; writing—original draft preparation, Y.T.; writing—review and editing, J.Y. and Q.T.; supervision, W.Q.; project administration, W.Q.; funding acquisition, W.Q. All authors have read and agreed to the published version of the manuscript.

Funding

This work is the output of the research project “Study on Agricultural Water Price Reform and Water Saving Strategy in Arid Inland Area” (12BJY100), supported by the National Social Science Foundation of China, and the “Research Skills Upgrading Scheme” (GL20180008), supported by Beijing Normal University at Zhuhai.

Institutional Review Board Statement

Not applicable.

Informed Consent Statement

Not applicable.

Data Availability Statement

Not applicable.

Conflicts of Interest

The authors declare no conflict of interest.

References

  1. Liu, H.M.; Wang, K.Q.; Huang, Z.J. Economic analysis of different choice of agricultural water price subsidies. J. Shanxi Univ. Financ. Econ. 2006, 28, 81–85. (In Chinese) [Google Scholar]
  2. Komives, K.; Foster, V.; Halpern, J.; Wodon, Q.T. Water, Electricity, and the Poor: Who Benefits from Utility Subsidies, 1st ed.; World Bank Publications: Washington, DC, USA, 2005; pp. 1–306. [Google Scholar]
  3. Zhang, Q.C. An example of changing from “invisible subsidy” to “visible subsidy” for water fee collection—The “subsidy after price increasing” mechanism. Manag. Adm. 2013, 31, 68–70. (In Chinese) [Google Scholar]
  4. Li, H.L. Reforming the agricultural water price policy is an important measure to promote the development of water-saving agriculture. Soc. Sci. Rev. 2012, 27, 22–25. (In Chinese) [Google Scholar]
  5. Johansson, R.C.; Tsur, Y.; Roe, T.L.; Doukkali, R.; Dinar, A. Pricing irrigation water: A review of theory and practice. Water Policy 2002, 4, 173–199. [Google Scholar] [CrossRef]
  6. Cummings, R.G.; Nercissiantz, V. The use of water pricing as a means for enhancing water use efficiency in irrigation: Case studies in mexico and the united states. Nat. Resour. J. 1992, 32, 731–755. [Google Scholar]
  7. Dimmock, S.G.; Kouwenberg, R. Loss-aversion and household portfolio choice. J. Empir. Financ. 2010, 17, 441–459. [Google Scholar] [CrossRef]
  8. Berbel, J.; Gomez-Limon, J.A. The impact of water-pricing policy in Spain: An analysis of three irrigated areas. Agric. Water Manag. 2000, 43, 219–238. [Google Scholar] [CrossRef]
  9. Gomezlimon, J. Irrigation water pricing: Differential impacts on irrigated farms. Agric. Econ. Blackwell 2004, 31, 47–66. [Google Scholar] [CrossRef]
  10. Amir, I.; Fisher, F.M. Response of near-optimal agricultural production to water policies. Agric. Syst. 2000, 64, 115–130. [Google Scholar] [CrossRef]
  11. Schoengold, K.; Sunding, D.L.; Moreno, G. Price elasticity reconsidered: Panel estimation of an agricultural water demand function. Water Resour. Res. 2006, 42, 2286–2292. [Google Scholar] [CrossRef] [Green Version]
  12. Moore, M.R.; Gollehon, N.R.; Carey, M.B. Multicrop production decisions in western irrigated agriculture: The role of water price. Am. J. Agric. Econ. 1994, 76, 859–874. [Google Scholar] [CrossRef]
  13. Ogg, C.W.; Gollehon, N.R. Western irrigation response to pumping costs: A water demand analysis using climatic regions. Water Resour. Res. 1989, 25, 767–773. [Google Scholar] [CrossRef]
  14. Ward, F.A.; Pulido-Velazquez, M. Water conservation in irrigation can increase water use. Proc. Natl. Acad. Sci. USA 2008, 105, 18215–18220. [Google Scholar] [CrossRef] [PubMed] [Green Version]
  15. Huang, Q.; Rozelle, S.; Howitt, R.; Wang, J.; Huang, J. Irrigation water demand and implications for water pricing policy in rural China. Environ. Dev. Econ. 2010, 15, 293–319. [Google Scholar] [CrossRef] [Green Version]
  16. Sun, M.Y.; Ma, S.Y.; Gu, B.Q.; Li, Y.X. Necessity and feasibility of agricultural irrigation water fee from “invisible subsidy” to “visible subsidy”. J. Econ. Water Resour. 2011, 29, 35–38. (In Chinese) [Google Scholar]
  17. Tian, G.L.; Sun, X.B.; Shi, C.F.; Ma, C. Design of China’s agricultural water fee compensation mechanism under the dual constraints of farmer burden reduction and water saving incentive. Price Theory Pract. 2014, 34, 57–59. (In Chinese) [Google Scholar]
  18. Liu, Y.; Huang, J.K.; Wang, J.X. The impact of water pricing policy on water use in irrigation and crop income. China Econ. Q. 2015, 14, 1375–1392. (In Chinese) [Google Scholar]
  19. Liu, Y.; Li, L.H. Economic analysis and method comparison of “Indirect to Direct” agricultural water subsidy in China. Price Theory Pract. 2013, 33, 43–44. (In Chinese) [Google Scholar]
  20. Yin, Q.M.; Ma, C.; Xu, C.X. Cost-sharing mode of agricultural water fees in river basin of China. China Popul. Resour. Environ. 2010, 20, 53–58. (In Chinese) [Google Scholar]
  21. Xing, X.J.; Yuan, R.H. Game theory research on agricultural irrigation water compensation. Water Sav. Irrig. 2017, 42, 70–73. (In Chinese) [Google Scholar]
  22. Kahneman, D.; Tversky, A. Prospect theory: An analysis of decision under risk. Econometrica 1979, 47, 263–292. [Google Scholar] [CrossRef] [Green Version]
  23. Li, R. An economic and psychological analysis of man’s decision-making behavior—A review of behavioral economics studies. J. Suzhou Univ. Sci. Technol. (Soc. Sci.) 2013, 30, 86–92. (In Chinese) [Google Scholar]
  24. Rabin, M.; Thaler, R.H. Anomalies: Risk Aversion. J. Econ. Perspect. 2002, 16, 229–230. [Google Scholar]
  25. Novemsky, N.; Kahneman, D. The boundaries of loss aversion. J. Mark. Res. 2005, 42, 119–128. [Google Scholar] [CrossRef]
  26. Thaler, R. Toward a positive theory of consumer choice. J. Econ. Behav. Organ. 1980, 1, 39–60. [Google Scholar] [CrossRef]
  27. Yang, Y.H. An explanation of the causes led us prefer a loss aversion based on an evolutionary view. Acad. Res. 2014, 45, 80–85. (In Chinese) [Google Scholar]
  28. Kahneman, D.; Knetsch, J.L.; Thaler, R.H. Experimental tests of the endowment effect and the coase theorem. J. Political Econ. 1990, 98, 1325–1348. [Google Scholar] [CrossRef] [Green Version]
  29. Benartzi, S.; Thaler, R.H. Myopic loss aversion and the equity premium puzzle. Q. J. Econ. 1995, 110, 73–92. [Google Scholar] [CrossRef] [Green Version]
  30. Piccolo, S.; Pignataro, A. Consumer loss aversion, product experimentation and tacit collusion. Int. J. Ind. Organ. 2018, 56, 49–77. [Google Scholar] [CrossRef]
  31. Karle, H.; Kirchsteiger, G.; Peitz, M. Loss aversion and consumption choice: Theory and experimental evidence. Am. Econ. J. Microecon. 2015, 7, 101–120. [Google Scholar] [CrossRef] [Green Version]
  32. Jarrow, R.; Zhao, F. Downside loss aversion and portfolio management. Manag. Sci. 2006, 52, 558–566. [Google Scholar] [CrossRef] [Green Version]
  33. Tovar, P. The effects of loss aversion on trade policy: Theory and evidence. J. Int. Econ. 2009, 78, 154–167. [Google Scholar] [CrossRef] [Green Version]
  34. Nicolson, M.; Huebner, G.; Shipworth, D. Are consumers willing to switch to smart time of use electricity tariffs? The importance of loss-aversion and electric vehicle ownership. Energy Res. Soc. Sci. 2017, 23, 82–96. [Google Scholar] [CrossRef]
  35. Greene, D.L. Uncertainty, loss aversion, and markets for energy efficiency. Energy Econ. 2011, 33, 608–616. [Google Scholar] [CrossRef]
  36. Jervis, R. Political implications of loss aversion. Political Psychol. 1992, 13, 187–204. [Google Scholar] [CrossRef]
  37. Correia, R.; Roseta-Palma, C. Behavioural Economics in Water Management, 1st ed.; Oxford University Press: Oxford, UK, 2012; pp. 196–223. [Google Scholar]
  38. Thaler, R. Mental accounting and consumer choice. Mark. Sci. 1985, 4, 199–214. [Google Scholar] [CrossRef]
  39. Chen, L.H.; Zhang, W.G.; Tian, Y.P. Research on the behavior decision of farmers participating in the traceability system of agricultural products quality and safety—Based on the survey data of 214 vegetable growers in Chongqing, China. Rural Econ. 2016, 34, 106–113. (In Chinese) [Google Scholar]
  40. Huang, M.L.; Li, X.Y.; Yuan, M.Y.; Liu, N.; Zhang, C.; Luo, B.X. Differences between farmers’ perception and behavior decisions on crop planting: An empirical study of Jianghan Plain. Res. Agric. Mod. 2016, 37, 892–901. (In Chinese) [Google Scholar]
  41. Zhu, Y.J.; Zhou, D.Y.; You, L.Z. Impact of farmers resource endowment and inner perception on technology adoption in Oromia, Ethiopia. Resour. Sci. 2015, 37, 1629–1638. (In Chinese) [Google Scholar]
  42. Liu, E.M. Time to change what to sow: Risk preferences and technology adoption decisions of cotton farmers in China. Rev. Econ. Stat. 2013, 95, 1386–1403. [Google Scholar] [CrossRef] [Green Version]
  43. Lin, Y.F. System, Technology and China’s Agricultural Development, 1st ed.; Shanghai People’s Publishing House: Shanghai, China, 2005; pp. 20–270. (In Chinese) [Google Scholar]
  44. Li, L.; Ding, H.F. Demand level identification of regional passenger transport corridor based on ordered probit model. J. Chongqing Jiaotong Univ. (Nat. Sci.) 2014, 33, 124–127. (In Chinese) [Google Scholar]
  45. Qu, W.; Li, Z.T.; Eefje, A.; Tan, Y.M.; Zhao, Y.F. Water saving strategy in inland river basin of Hexi Corridor in Gansu Province: Conjunctive management of surface water and groundwater. J. Glaciol. Geocryol. 2018, 40, 145–155. (In Chinese) [Google Scholar]
  46. Wang, J.; Zhang, L.; Huang, J. How could we realize a win–win strategy on irrigation price policy? Evaluation of a pilot reform project in Hebei Province, China. J. Hydrol. 2016, 539, 379–391. [Google Scholar] [CrossRef]
  47. Qian, H.H.; Ni, Y.P. The current situation and system innovation of agricultural water rights. China Rural Water Hydropower 2007, 32, 138–141. (In Chinese) [Google Scholar]
  48. Hu, Y.C.; Liu, D.X.; Liu, X.Y.; Lang, M.X. Practical application of reform of agricultural water right system in Gansu Province. China Water Resour. 2016, 51, 8–10. (In Chinese) [Google Scholar]
  49. Panagopoulos, Y.; Dimitriou, E. A large-scale nature-based solution in agriculture for sustainable water management: The Lake Karla case. Sustainability 2020, 12, 6761. [Google Scholar] [CrossRef]
Figure 1. Value function.
Sustainability 13 05197 g001
Table 1. The incentive effect of explicit subsidy on water-saving.
The Incentive Effect of Explicit SubsidyFrequencyPercentageCumulative Percentage
1 Completely useless144.46%4.46%
2 Almost useless5015.92%20.38%
3 Average237.33%27.71%
4 Quite useful14345.54%73.25%
5 Very useful8426.75%100%
Table 2. Loss aversion.
Loss AversionFrequencyPercentageCumulative Percentage
0 = No loss aversion21869.43%69.43%
1 = Loss aversion9630.57%100%
Table 3. Evaluation of water-saving potential of farmers.
Water-Saving PotentialFrequencyPercentageCumulative Percentage
1 No potential at all7523.89%23.89%
2 Almost no potential10232.48%56.37%
3 Balanced3711.78%68.15%
4 Some potential8426.75%94.90%
5 Big potential165.10%100%
Table 4. Risk preference question.
Option A: 100% Get 100 YuanOption B: 50% Chance to Get 0, 50% Chance to Get a Certain Amount of MoneyChoose A or B? 1 = A 2 = B
1000150
1000200
1000300
1000400
1000600
1000800
10001000
10001500
Table 5. Descriptive statistics.
Variable ClassificationVariable DescriptionVariable NameMeanStandard DeviationMin.Max.
Water-saving effect of explicit subsidy1 = completely useless, 2 = almost useless, 3 = average, 4 = quite useful, 5 = very usefulWater price reform3.7421.14715
Interaction termLoss aversion * Farmers’ evaluation of water-saving potentialInteraction term 10.7451.29605
No loss aversion * Farmers’ evaluation of water-saving potentialInteraction term 21.8221.61705
Household head characteristicsAge of household head (years)Age49.1979.6752574
Years of educationEducation8.2993.035015
health1 = good, 0 = fair or poorHealth0.8280.37801
Identity of household head1 = party member/village or water user association cadre, 0 = nothingIdentity0.4040.49201
Risk aversion1 = yes, 0 = noRisk preference0.5670.40901
Do you believe that the water price is higher than the cost of water supply? 1 = yes, 0 = noWater price judgment 10.6310.48301
Do you believe that the water price is lower than the cost of water supply? 1 = yes, 0 = noWater price judgment 20.1820.38601
Evaluation of the maintenance of the channel: 1 = very bad, 2 = bad, 3 = average, 4 = good, 5 = very goodCanal evaluation3.2231.29415
Family characteristicsTotal farmland area (mu) (logarithm)Farmland area2.7690.65304.673
The proportion of cash crop area to total sown areaPlanting structure0.9110.18801
Total irrigation water used per mu (m3) (logarithm)Irrigation water used6.6290.5254.8287.378
Whether to use a greenhouse: 1 = yes, 0 = noGreenhouse0.1880.39101
Regional differencesDummy for Shule River basin: 1 = yes, 0 = noShule River0.3250.46901
Dummy for Hei River basin: 1 = yes, 0 = noHei River0.3120.46401
Table 6. Regression analysis results.
VariableCoef.zp > z95% Conf.Interval
Interaction term 10.1352.010.044 **0.0030.267
Interaction term 20.0751.420.15−0.0290.178
Age0.0050.610.541−0.0100.019
Education0.0030.130.900−0.0410.047
Health0.3081.740.082 *−0.0390.655
Identity−0.030−0.220.826−0.2920.233
Risk preference−0.127−0.820.410−0.4310.176
Water price judgment 10.4342.590.009 ***0.1060.762
Water price judgment 20.4061.960.050 **0.0000.812
Canal evaluation−0.174−3.480.000 ***−0.272−0.076
Farmland area0.040.330.740−0.1990.280
Planting structure−0.008−0.020.985−0.7920.777
Irrigation water used−0.534−2.110.035 **−1.029−0.038
Greenhouse−0.098−0.580.565−0.4310.236
Shule River0.4901.690.092 *−0.0791.059
Hei River0.8653.060.002 ***0.3101.420
Significance level: *** p < 0.01; ** p < 0.05; * p < 0.1. Model test result: total number of samples = 314; LR chi2(16) = 40.33; Prob > chi2 = 0.0007; Pseudo R2 = 0.0481; Log likelihood = −398.607.
Publisher’s Note: MDPI stays neutral with regard to jurisdictional claims in published maps and institutional affiliations.

