Abstract
The location of electric vehicle charging facilities is of great significance in promoting the use of electric vehicles. Most existing electric vehicle location models, including the flow refueling location model (FRLM) and its flexible reformulation (FRFRLM), are based on flow demand. At present, these models cannot effectively deal with large-scale traffic networks within a limited time, and there has been little comparison of their relative benefits and limitations. Additionally, there have been few evaluations of the actual construction and location of charging facilities in cities. This paper describes an algorithm that can solve the large-scale transportation network problem within a reasonable time. Using this algorithm, the FRLM and FRFRLM models are compared in a case study focused on Jiading District, Shanghai, China, which provides some direction for the future development of flow demand models. Finally, to evaluate the actual construction of urban charging facilities, this paper presents an algorithm that can map the actual charging facilities to the transportation network, and compares the actual construction situation with the model output. This enables a comprehensive evaluation of the actual construction of charging facilities and provides guidance for future construction.
1. Introduction
With continued economic development, increasing attention is turning to the problem of environmental pollution. Motor vehicle exhaust emissions are the main source of urban air pollution [1]. Related reports indicate that the petroleum resources of the earth can only be exploited for another 200 years, while other fossil fuel resources will also be fully exploited over a similar timescale [2]. With increasingly severe environmental problems and the looming energy crisis, vigorous developments in new energy sources are of great significance [3]. The development of electric vehicles is an important component of China’s new energy development strategy [4]. Electric vehicles have the advantages of low vibration, low noise, and less pollution than petrol- or diesel-fueled vehicles [5]. In most countries, the cost of electricity consumption of electric vehicles is lower than that of ordinary vehicles. However, a number of factors are restricting the development of electric vehicles [6]. First, the driving range of electric vehicles is much shorter than that of traditional cars. Relevant studies have shown that owners of electric vehicles generally suffer from “range anxiety” [7]. Secondly, electric vehicles take a long time to charge. DC fast charging requires around half an hour to fill up to 80% of the battery capacity, whereas AC slow charging may take 6–8 h to fully recharge the battery [8]. Finally, electric vehicle charging piles are considered to be inconvenient and insufficient in number at present [9]. With the continuous development of society and improvements in technology, the driving range of electric vehicles will continue to increase, and the charging time will continue to decrease accordingly [10]. Some people thought that “if there are not enough electric vehicles, then not many charging piles will be constructed [11]. This has become a ‘chicken-and-egg’ problem [12,13]”. However, I disagree that this is a “chicken-and-egg” problem. Governments will encourage the construction of charging stations to encourage citizens to use electric cars. Therefore, it is vital to ensure a reasonable distribution of the limited number of electric vehicle charging piles.
Currently, in terms of research on electric vehicle charging facility planning based on flow demand, the flow refueling location model (FRLM) and its variants cannot effectively deal with large-scale traffic networks within a short period of time [14]. Because we consider the vehicle driving range in the FRLM, the first stage in determining the combination of facilities that can allow successful round trips requires iterations, where is the number of traffic network nodes that the vehicle passes. Thus, if the car passes 100 nodes, the feasible combination of such a path requires iterations, and such calculations need to be performed times in a transportation network consisting of nodes. The scale becomes too large when we consider a transportation network with more than 200 nodes. Therefore, the FRLM based on flow demand and its variants cannot handle large-scale transportation network problems within a limited time. To solve this problem, MirHassani and Ebrazi developed a flexible reformulation of FRLM (FRFRLM) based on flow demand [15]. This model deals with the scale of the problem better than the FRLM, but when applied to the 271 nodes in the traffic network of Jiading District, Shanghai, there are too many constraints and variables, causing the computer memory to overflow. Thus, FRFRLM also has some issues when dealing with large-scale network problems. Based on this, we have developed an algorithm that solves large-scale traffic network problems in a relatively short period of time, permitting the flow demand model to be applied to real-world networks.
Currently, the planning and modeling of electric vehicle charging facilities according to flow demand are mainly based on FRLM and FRFRLM. Therefore, we need to analyze and compare the two models to better understand their advantages and disadvantages. At present, there has been no research on this topic. We will compare FRLM with FRFRLM in terms of the flow capture results, site selection, and program runtime using data from Jiading District, Shanghai.
Finally, it is crucial to evaluate the current construction status of charging facilities. This will enable us to understand the current regional construction status, while also providing guidance for the next step in the construction of electric vehicle charging facilities. To date, there have been many studies on the construction of electric vehicle charging facilities, but there is little relevant research on the evaluation of such construction. Tian H P. and Zhou S et al. present a charging facilities construction site evaluation model based on the use efficiency by analyzing the current situation and characteristics of charging facilities [16]. We used the latitude and longitude data associated with the parking and charging of electric vehicles to develop an algorithm that maps real charging facilities to the transportation network, and compared the results with the output of FRLM and FRFRLM to evaluate the current construction of electric vehicle charging facilities.
The structure of the paper is as follows: the Section 2 is mainly a literature review of related electric vehicle charging facilities research. The Section 3 presents the FRLM and the FRFRLM as well as our proposed algorithm. The Section 4 is a case study in Jiading District, Shanghai. In Section 5, we compare FRLM with FRFRLM in terms of the flow capture results, site selection, and program runtime using data from Jiading District, Shanghai. The Section 6 evaluates the current status of charging facilities in Jiading District, Shanghai, based on the results of the model output and the result of mapping real charging facilities to the transportation network. Finally, section seven analyzes and summarizes this paper and looks forward to future research.
2. Literature Review
The location model based on flow demand was first proposed by Hodgson, who developed a flow-capture location model (FCLM) based on the maximum coverage [17]. In this model, the flow can be captured as long as there is a facility on the path. The model locates facilities and maximizes the flow that passes through them. Hodgson used 25 transportation network nodes designed by Berman and Simchi-Levi to conduct a case study. On this basis, Kuby considered the driving range of the vehicle and proposed the FRLM. Different from FCLM, FRLM requires a series of facility combinations to satisfy the need for the vehicle to go back and forth between an origin–destination (OD) pair. FCLM assumes that only one facility is needed on the path for the flow to be captured. FRLM is divided into two stages. The first stage identifies feasible combinations of candidate sites so that the vehicle can successfully complete a round-trip between the OD pair. The second stage uses these combinations as the model input to determine the site locations that maximize the passing flow. Kuby used the 25 transportation network nodes designed by Berman and Simchi-Levi to conduct a case study, while Kuby and Lim further expanded the location of candidate sites, using algorithms such as mid-path segment, minimax, and maximin to disperse candidate sites on arcs [18].
On the basis of FRLM, Upchurch and Kuby restricted the service capacity of alternative facility points, and proposed a capacitated flow refueling location model (CFRLM) that considers capacity constraints [19]. In CFRLM, the service volume of each alternative facility point is different and the locations cannot exceed their service capacity. The objective is still to maximize the flow. On the basis of FRLM, Kim and Kuby considered the deviation of the vehicle path to find facility service points, and proposed the deviation-flow refueling location model (DFRLM) [20]. DFRLM reflects the driver’s willingness to deviate from a pre-planned path to find service stations within a specified distance. However, in finding the shortest path to the chosen service station, DFRLM may cause the vehicle to pass too many nodes, so that the calculation time becomes too long. For this reason, Kim and Kuby developed a heuristic algorithm to solve this problem, which effectively reduces the runtime [21]. Based on the first stage of FRLM to find a feasible combination of candidate sites that cannot effectively deal with large-scale network problems in a short time, MirHassani and Ebrazi proposed their flexible reformulation model (FRFRLM) based on flow demand. They also used the 25 transportation network nodes designed by Berman and Simchi-Levi to conduct a case study, and randomly generated transportation networks of different sizes for further experiments. Wang proposed a model that minimizes the number of charging piles to be built by considering the charging time, and found that fast charging can effectively reduce the number of charging piles [22]. On this basis, Wang proposed an optimization model for the charging piles in the case of switching power considering the capacity limitations of the service facilities [23]. The results show that increasing the capacity of service facilities can effectively reduce the number of charging stations. In these two models, Wang used a seven-node transportation network to conduct case studies. In addition, Wang proposed a flow-based set cover model [24] based on vehicle refueling logic that minimizes the cost of building all charging piles while ensuring that vehicles can successfully go back and forth along a single path. A 51-node transportation network was developed for a case study evaluating this model.
3. Models and Algorithms
3.1. Flow Refueling Location Model
Kuby considered the driving range of the vehicle in developing the original FRLM. The model can be written as
where:
- = index of OD pairs (and, by implication, the shortest paths for each pair);
- = set of all OD pairs;
- = flow volume on the shortest path between OD pair ;
- = 1 if is captured, 0 otherwise;
- = potential facility location;
- = set of all potential facility locations;
- = 1 if a facility is located at , 0 otherwise;
- = number of facilities to be located;
- = index of combinations of facilities;
- = set of all potential facility combinations;
- = a coefficient equal to 1 if facility is in combination , 0 otherwise;
- = a coefficient equal to 1 if facility combination can refuel OD pair , 0 otherwise;
- = 1 if all facilities in combination are open, 0 otherwise.
The objective function in Equation (1) is intended to capture as great a flow as possible. Constraint (2) means that when is 1, a set of facility locations that can capture the flow must be built, and this set of facilities must be able to allow the car to pass back and forth on the path. Constraint (3) means that if a facility combination is to be built, then all facilities in that combination must be built. Constraint (4) means that we must construct facilities.
3.2. Flexible Reformulation of the Flow Refueling Location Model
MirHassani and Ebrazi considered the flaws of the FRLM. When the network scale becomes larger, it takes too long to determine the combination of facilities that would allow the car to go back and forth on a certain path successfully. Based on the new vehicle round-trip logic, they developed the FRFRLM. The model can be written as
where:
- = index of OD pairs (and, by implication, the shortest paths for each pair);
- = flow volume on the shortest path between OD pair ;
- = 1 if a station is located at node , 0 otherwise;
- = flow on an arc belonging to the expanded network arcs of path q (i.e., );
- = set of all candidate paths to be covered (usually the shortest path);
- N = set of all path-related nodes ();
- = subset of that contains all the paths passing node .
The objective function in Equation (5) is intended to capture as much flow as possible. Constraint (6) means that the inflow at a point is equal to its outflow. Constraint (7) means that if the path selected by the car passes through a point, then a charging station must be built at this point. Constraint (8) means that the inflow at a point must be greater than or equal to 0. Constraint (9) means that we must construct p facilities.
3.3. Algorithm for Solving Large-Scale Transportation Network Problems
We have developed an algorithm for solving the large-scale network problem based on the flow demand model. The algorithm is divided into two stages. In the first stage, the transportation network is reconstructed by clustering, and the site types are obtained by solving the model. The second stage restores the traffic network and deletes un-sited classes from the transportation network, but does not change the traffic network structure. Algorithm 1 describes the proposed approach.
| Algorithm 1. Algorithm for Solving Large-Scale Transportation Network Problems. | |
| Input | Flow between nodes of the transportation network: ; distance between nodes of the transportation network: ; number of clusters: ; number of charging facilities to be built in the transportation network: |
| Output | Location of charging facilities in the transportation network |
| Step 1 | |
| Step 2 | |
| Step 3 | |
| Step 4 | |
| Step 5 | |
| Step 6 | |
- Clustering. We cluster the traffic network nodes into classes according to the latitude and longitude coordinates of the traffic network nodes, so that the network can be effectively processed in a short time;
- Transportation network reconstruction. After clustering, it is necessary to reconstruct the distance between traffic network classes and the OD flow. The distance between classes is the farthest distance between points in the two classes, and the OD flow between classes is taken from all points in one class to all points in another class. For example, in Figure 1, the distance from class 1 to class 2 is the maximum distance from points 1, 3, and 6 in class 1 to points 25, 12, and 63 in class 2. If this does not exist, the distance between class 1 and class 2 is infinite. The OD flow of class 1 to class 2 is the sum of the flows from points 1, 3, and 6 to points 25, 12, and 63. Of course, in this way, part of the flow from origin to destination will be lost in the network. For example, the flow from point 1 to point 3 is lost;
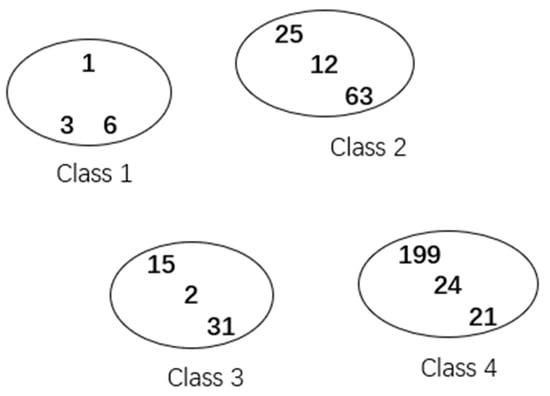 Figure 1. Traffic network.
 - We use the model to solve the problem. We thereby obtain the clustered charging facility location class and the classes where charging facilities will not be located;
- Restore the transportation network. On the premise of not damaging the transportation network, the locations that will not have charging facilities are deleted from the transportation network. For example, as shown in Figure 1, assume that charging facilities are built in classes 1, 2, and 4. Class 3 no longer has a charging service facility. For the classes that do not have charging facilities, the length of the road section is retained but the node data are removed, that is, points 15, 2, and 31 are removed from the network. If the path from point 6 to point 199 passes through point 15, however, the distance is not changed by removing point 15;
- Add a constraint. For the charging facility location class, add the constraint that a charging facility must be located in this class. LocationSet denotes the clustered charging facility location class ;
- By the above steps, we obtain a transportation network that gets rid of the classes where charging facilities will not be located. We use the distance data between points and the OD flow data to bring into the model to obtain the layout of the charging facilities;
3.4. Algorithm for Mapping Real Charging Facilities to the Transportation Network
Currently, the construction of electric vehicle charging facilities cannot be evaluated. Thus, we have developed an algorithm that maps real charging facilities to the transportation network. We can then compare the results with the model output to evaluate the construction of regional electric vehicle charging facilities. Algorithm 2 describes the proposed approach.
| Algorithm 2. Algorithm for mapping real charging facilities to the transportation network. | |
| Input | Parking and charging latitude and longitude data:; transportation network node latitude and longitude data: ; distance between charging points in the same charging station: ; number of clusters: ; distance: |
| Output | Construction of charging facilities in the transportation network |
| Step 1 | |
| Step 2 | |
| Step 3 | |
| Note | denotes the cluster center points after clustering |
The data required for this algorithm are as follows: (1) latitude and longitude coordinate data of vehicle parking and charging on a working day; (2) latitude and longitude coordinate data of the traffic network nodes. The following parameters need to be set: (i) the distance between charging points in the same charging station is denoted as ; (ii) the number of clustering categories is denoted as ; (iii) the distance between a traffic network node and the cluster center point is denoted as .
- The vehicle charging data are screened. One piece of data from each charging station is retained, as this is convenient for later clustering of the charging stations. One piece of data for which the distance between the vehicle charging latitude and longitude coordinates is less than is also retained;
- Use the K-means clustering method to cluster the filtered data. Setting the number of clusters to , we obtain cluster center points after clustering;
- Map the cluster center points to the traffic network nodes. According to the distance between the latitude and longitude coordinates of the transportation network node and the cluster center point, if there is a cluster center point around from a transportation network node, then the transportation network node can be considered as a charging facility construction point.
4. Case Study
We conducted a case study using data from Jiading District in Shanghai, China. The transportation network in Jiading District is shown in Figure 2. The OD flow of electric vehicles and the distance between the OD points in Jiading District during a working day are provided. There are 271 charging points and 25,259 OD pairs in a working day. The OD flow table is presented in Table 1, and the distances between nodes in the traffic network of Jiading District are given in Table 2.
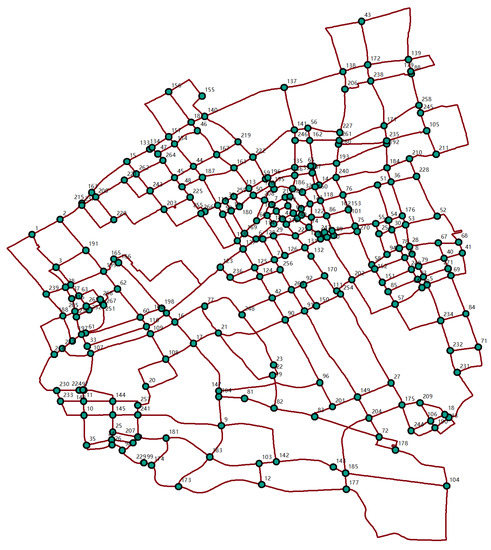
Figure 2.
Transportation network in Jiading District, Shanghai.

Table 1.
OD flow on a working day in Jiading District, Shanghai.
Table 2.
Distance between nodes in the traffic network of Jiading District, Shanghai.
4.1. Using FRLM and the Proposed Algorithm to Solve the Problem
Under the assumption that the driving range of an electric vehicle is 150 km, we used the proposed algorithm and FRLM to solve this large-scale transportation network problem with the number of clustering categories set to 120. The transportation network problem was solved with 10, 20, 30, 40, 50, and 60 given facilities, respectively; the results of the first stage of solving the flow capture are presented in Table 3, and the situation of the location classes is shown in Figure 3. We used a 2.3 GHz Intel® Core TM i7-10875H processor and 16 GB RAM to solve this problem.
Table 3.
FRLM: Flow capture results for different numbers of facilities—first stage.
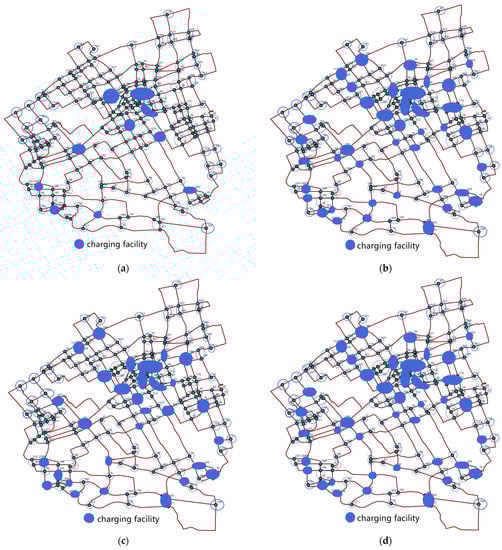
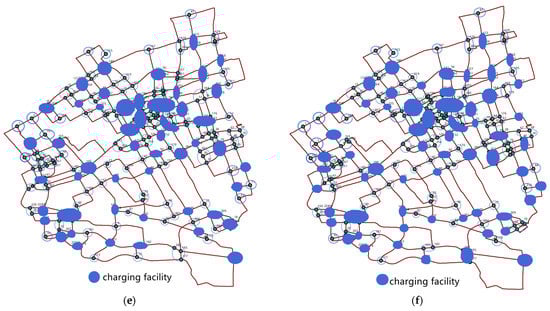
Figure 3.
FRLM: First-stage site selection results for (a) 10, (b) 20, (c) 30, (d) 40, (e) 50, and (f) 60 facilities.
The results of the second stage are presented in Table 4, and the situation of the sites is shown in Figure 4.
Table 4.
FRLM: Flow capture results for different numbers of facilities—second stage.
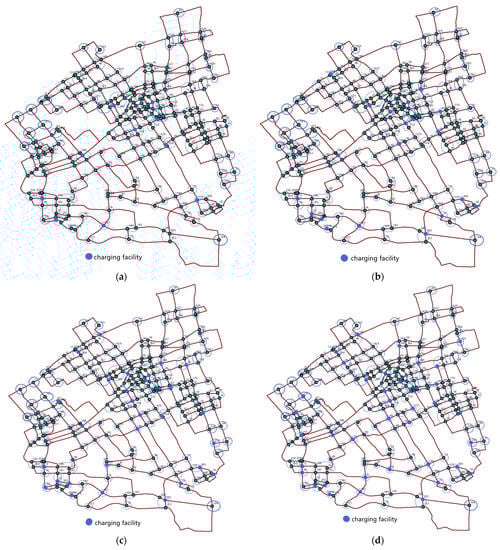
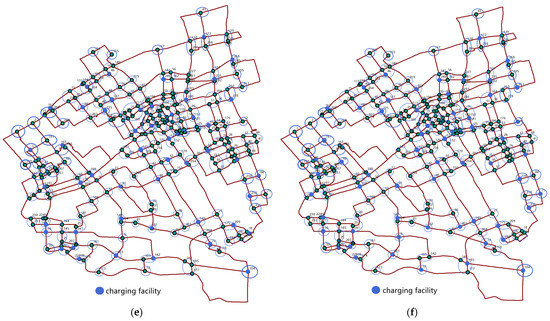
Figure 4.
FRLM: Second-stage site selection results for (a) 10, (b) 20, (c) 30, (d) 40, (e) 50, and (f) 60 facilities.
4.2. Using FRFRLM and the Proposed Algorithm to Solve the Problem
Under the same conditions and assumptions as described in Section 4.1, FRFRLM and the proposed algorithm were used to solve the large-scale transportation network problem. The results from the first stage of solving the flow capture problem are presented in Table 5, and the situation of the location classes is shown in Figure 5.
Table 5.
FRFRLM: Flow capture results for different numbers of given facilities—first stage.
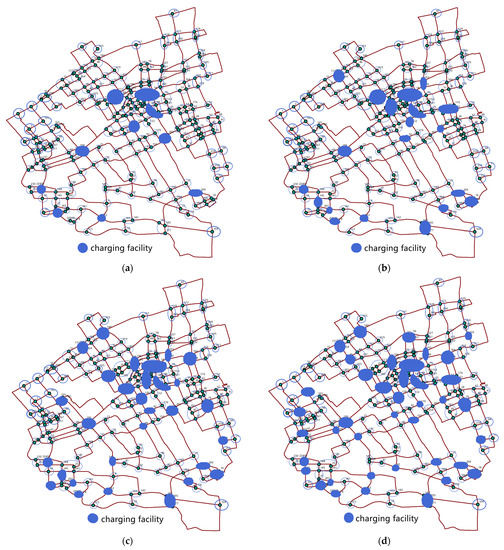
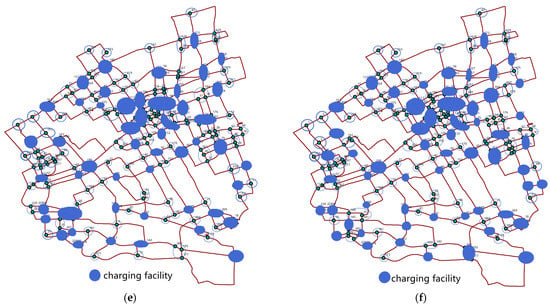
Figure 5.
FRFRLM: First-stage site selection results for (a) 10, (b) 20, (c) 30, (d) 40, (e) 50, and (f) 60 facilities.
The results of the second stage are presented in Table 6, and the situation of the facilities is shown in Figure 6.
Table 6.
FRFRLM: Flow capture results for different numbers of given facilities—second stage.
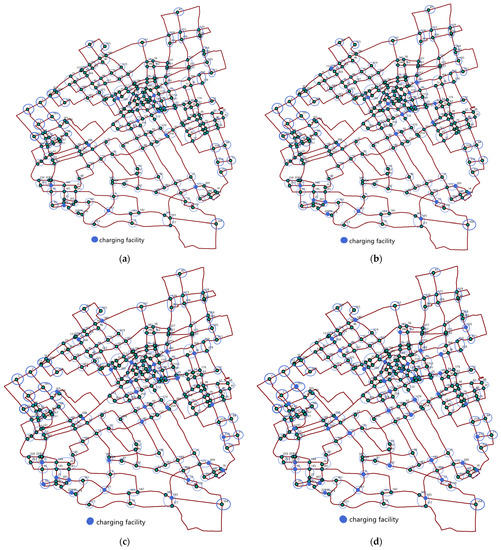

Figure 6.
FRFRLM: Second-stage site selection results for (a) 10, (b) 20, (c) 30, (d) 40, (e) 50, and (f) 60 facilities.
5. Comparative Analysis of Models
5.1. Comparative Analysis of Model Solution Coverage
The FRLM and FRFRLM flow capture coverage in the first stage is compared in Figure 7. Figure 8 compares the FRLM and FRFRLM flow capture coverage in the second stage.
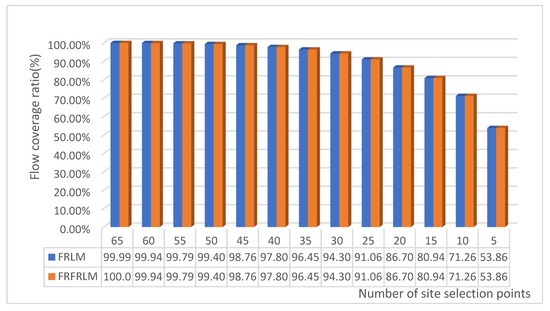
Figure 7.
Relationship between FRLM and FRFRLM flow coverage ratio in the first stage for various numbers of site selection points.
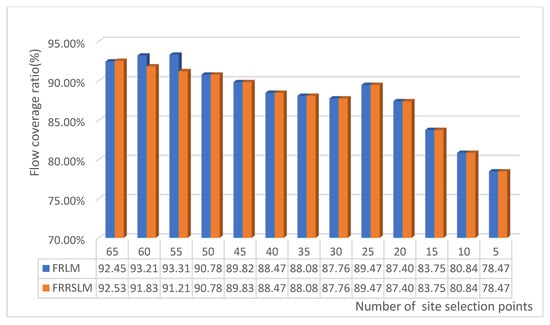
Figure 8.
Relationship between FRLM and FRFRLM flow coverage ratio in the second stage for various numbers of site selection points.
From Figure 7, it can be seen that, given the different numbers of location points, the solution coverage of FRLM and FRFRLM is exactly the same in the first stage. Figure 8 shows that, for different numbers of locations, FRLM and FRRSLM also have essentially the same solution coverage rate in the second stage. In summary, there is only a slight difference in the results when the two models are used to solve the flow capture problem.
5.2. Comparative Analysis of Coincidence Rate of Model Site Selection
The coincidence rate of FRLM and FRRSLM site selection in the first stage is shown in Figure 9. Figure 10 shows the coincidence rate of FRLM and FRFRLM site selection in the second stage.
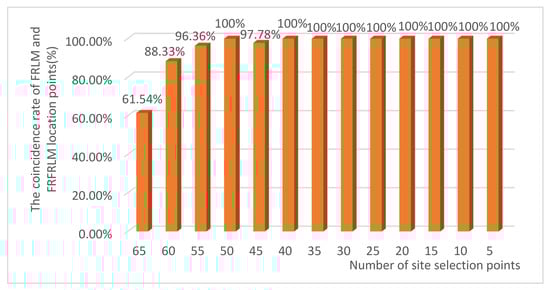
Figure 9.
Coincidence rate of FRLM and FRFRLM location points in the first stage for various numbers of site selection points.
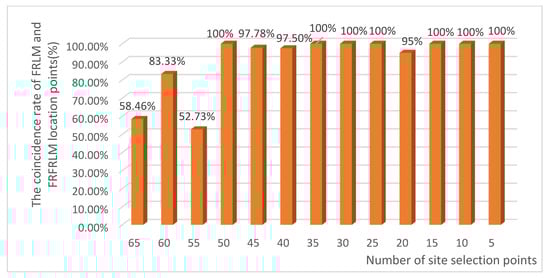
Figure 10.
Coincidence rate of FRLM and FRFRLM location points in the second stage for various numbers of site selection points.
Figure 9 indicates that, when the number of given location points is small, the location points output by FRLM and FRRSLM in the first stage completely coincide. When the number of given location points is large, the location points output by FRLM and FRFRLM are more diverse, but the majority of sites are the same. The reason for this may be the difference in the shortest path selection between FRLM and FRRSLM. It can be seen from Figure 10 that the results in the second stage are essentially the same as those in the first stage. In summary, when the number of given location points is small, FRLM and FRFRLM output the same location points. When the number of given location points is large, the output location points of FRLM and FRFRLM are slightly different, but the majority of locations are the same.
5.3. Comparative Analysis of Program Runtimes
The relationship between the number of FRLM and FRFRLM site selection points and the program runtime in the first stage is shown in Figure 11. The relationship between the number of FRLM and FRFRLM site selection points and the program runtime in the second stage is shown in Figure 12.
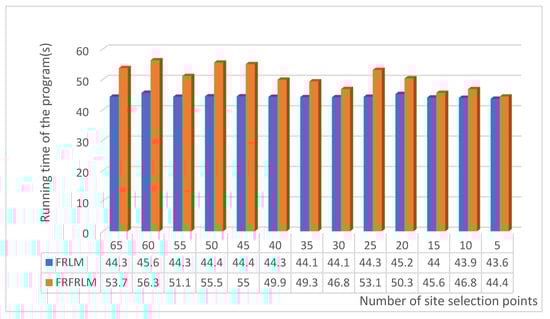
Figure 11.
Relationship between the number of FRLM and FRFRLM site selection points and the runtime in the first stage.
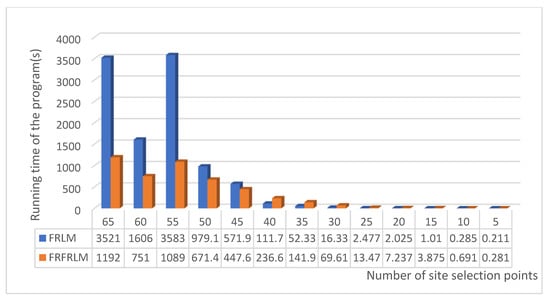
Figure 12.
Relationship between the number of FRLM and FRFRLM site selection points and the runtime of the program in the second stage.
In Figure 11, the total number of alternative point categories for FRLM charging facilities in the first stage are 120, when the given facility categories are 65, 60, 55, 50, 45, 40, 35, 30, 25, 20, 15, 10, and 5, respectively, we can find that the FRLM runtime is always less than that of FRFRLM.
In the first stage, the alternative point categories are 120. When we give 65 facility categories, according to the FRLM and the solution of the first stage of the algorithm, the “65 facility categories” consist of 166 charging facilities. Therefore, we need to choose 65 charging facility from the 166 charging facilities in the second stage. The alternative point categories are 120 in the first stage, when the given facility categories are 65, 60, 55, 50, 45, 40, 35, 30, 25, 20, 15, 10, and 5, respectively. According to the FRLM and the solution of the first stage of the algorithm, the total number of alternative points for FRLM charging facilities in the second stage, from largest to smallest, are 166, 152, 151, 143, 130, 120, 109, 98, 81, 72, 63, 41, and 23, which correspond to 65, 60, 55, 50, 45, 40, 35, 30, 25, 20, 15, 10, and 5. The corresponding values for FRFRLM are 163, 152, 153, 143, 131, 120, 109, 98, 81, 72, 63, 41, and 23, which correspond to 65, 60, 55, 50, 45, 40, 35, 30, 25, 20, 15, 10, and 5. It can be seen from Figure 12 that when the total number of alternative points exceeds 130, the runtime of FRLM is always greater than that of FRFRLM. The reason is that when the total number of site selection points is large, FRLM takes a long time to filter out the combinations that allow vehicles to travel between OD pairs. FRFRLM does not perform this process, but there are too many variables in the establishment of the model, resulting in a long runtime. In sum, when solving small-scale problems, the solution efficiency of FRLM is better than that of FRFRLM. When solving large-scale problems, FRFRLM is more efficient than FRLM.
5.4. Summary of the Model Comparison
According to the above analysis, the models are summarized in Table 7.
Table 7.
Comparison and analysis between FRLM and FRFRLM.
6. Evaluation of Charging Facility Construction
Sample electric vehicle charging data for a working day in Jiading District, Shanghai, are presented in Table 8; the full dataset contains 8636 items. Longitude and latitude coordinate data of transportation network in Jiading District, Shanghai, are presented in Table 9; the full dataset contains 271 items.
Table 8.
Coordinates of electric vehicle charging in Jiading District, Shanghai, on a working day.
Table 9.
Longitude and latitude coordinate data of transportation network in Jiading District, Shanghai.
Using the algorithm that maps the real charging facilities to the transportation network, with = 50 m, = 120, and = 500 m, we obtained the construction points of charging facilities on the network, as shown in Figure 13.
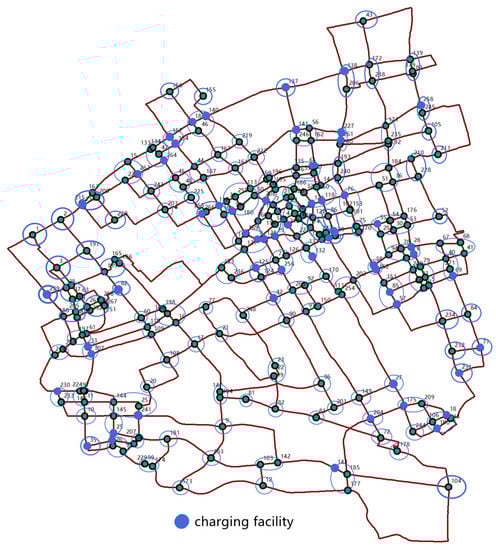
Figure 13.
Charging facilities in Jiading District, Shanghai, overlaid on the transportation network.
means the maximum distance between charging points in the same charging station; we think that 50 m is appropriate in Jiading District, because of the shortage of land resources in Jiading District. means the number of clusters; there is no special requirement for this, usually we make it twice as many charging facilities as given in FRLM and FRFRLM. means the distance between a cluster center point and a transportation network node. We think that if the distance between a cluster center point and a transportation network node is less than 500 m, then the transportation network node should be considered as having a charging facility. Of course, for different cities, there can be different and .
In Figure 14, according to the first stage output from FRLM, there are currently 34 real construction points in Jiading District in the model output construction category. The final FRLM output indicates that there are currently 15 real construction points that overlap with the model output. The first stage of the FRFRLM output shows 36 real construction points that are currently in the model output construction category. The final output from the FRFRLM model indicates that there are currently 15 real construction points that overlap with the model output.
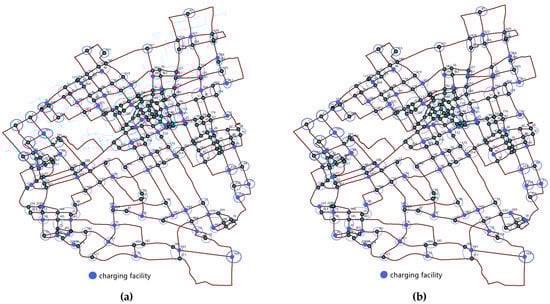
Figure 14.
Output results of (a) FRLM and (b) FRFRLM when the number of given location points is 60.
From the above data, it can be concluded that the overlap rate between electric vehicle charging facilities in Jiading District and the optimal solution of the model is about 25%, whereas the overlap rate between the construction type output in the first stage of the model is about 58%. From the perspective of transportation network nodes, there is currently a lack of charging facilities in the lower-left area of Jiading District. Generally speaking, according to the output of the model, there is considerable room for optimization in the construction of charging facilities in Jiading District, Shanghai.
7. Conclusions and Future Research
Existing flow demand models cannot solve large-scale network problems quickly and effectively. This paper describes an algorithm that solves large-scale network problems through the clustering reconstruction of the transportation network. We compare FRLM with FRFRLM in terms of the flow capture results, site selection, and program runtime using data from Jiading District, Shanghai. When the given number of charging facilities are the same, we find that the flow capture results and site selection are essentially the same, while FRFRLM has an obvious advantage in program runtime when we solve large-scale transportation network problems. Although a series of extended models, such as CFRLM and DFRLM, have been developed based on FRLM, there are few extensions of FRFRLM. In the future, we can expand FRFRLM considering the capacity of charging facilities and the deviation of vehicles from the original shortest path to find available charging sites. Through our analysis of the current construction of charging facilities in Jiading District, Shanghai, we can conclude that there is considerable room for the optimization of such facilities. Different cities can get the current status of the city’s charging facilities construction by adjusting the parameters that suit them.
Author Contributions
Data acquisition, curation, and analysis, C.W. and Z.G.; conceptualization, Z.G. and C.W.; funding acquisition, P.Y. and Z.L.; methodology, Z.G. and P.Y.; resources: C.W. and Z.L.; supervision, P.Y., Z.W. and Z.L.; writing—original draft, Z.G.; writing—review & editing, Z.G. and P.Y. All authors have read and agreed to the published version of the manuscript.
Funding
This research was funded by the National Key R&D Program of China, grant number 2018YFE0105100.
Institutional Review Board Statement
Not applicable.
Informed Consent Statement
Not applicable.
Data Availability Statement
Not applicable.
Acknowledgments
The authors’ work is supported by the National Key R&D Program of China (No. 2018YFE0105100). The authors are grateful for the support.
Conflicts of Interest
The authors declare no conflict of interest.
References
- Shen, Z.-J.M.; Feng, B.; Mao, C.; Ran, L. Optimization models for electric vehicle service operations: A literature review. Transp. Res. Part B Methodol. 2019, 128, 462–477. [Google Scholar] [CrossRef]
- The Oil on The Earth May Be Enough for Humans to Exploit for 200 Years: PetroChina Has Released Authoritative Data. Available online: https://www.sohu.com/a/205459986_188371 (accessed on 21 April 2021).
- Xu, M.; Meng, Q.; Liu, K.; Yamamoto, T. Joint charging mode and location choice model for battery electric vehicle users. Transp. Res. Part B Methodol. 2017, 103, 68–86. [Google Scholar] [CrossRef]
- Yu, J.; Yang, P.; Zhang, K.; Wang, F.; Miao, L. Evaluating the Effect of Policies and the Development of Charging Infrastructure on Electric Vehicle Diffusion in China. Sustainability 2018, 10, 3394. [Google Scholar] [CrossRef]
- Li, S.; Huang, Y.; Mason, S.J. A multi-period optimization model for the deployment of public electric vehicle charging stations on network-ScienceDirect. Transp. Res. Part C Emerg. Technol. 2016, 65, 128–143. [Google Scholar] [CrossRef]
- Chung, S.H.; Kwon, C. Multi-period planning for electric car charging station locations: A case of Korean Expressways. Eur. J. Oper. Res. 2015, 242, 677–687. [Google Scholar] [CrossRef]
- Wu, F.; Sioshansi, R. A stochastic flow-capturing model to optimize the location of fast-charging stations with uncertain electric vehicle flows. Transp. Res. Part D Transp. Environ. 2017, 53, 354–376. [Google Scholar] [CrossRef]
- Explore The Difference between Fast Charging and Slow Charging Based on the Principle of Lithium Batteries. Available online: http://www.juda.cn/news/22476.html (accessed on 21 April 2021).
- Ju, Y.; Ju, D.; Gonzalez, E.D.S.; Giannakis, M.; Wang, A. Study of site selection of electric vehicle charging station based on extended GRP method under picture fuzzy environment. Comput. Ind. Eng. 2019, 135, 1271–1285. [Google Scholar] [CrossRef]
- The Battery Life of Electric Vehicles Is Getting Higher and Higher, Will It Continue to Grow in the Future? Available online: https://www.sohu.com/a/385066753_507370 (accessed on 21 April 2021).
- Meng, W.; Kai, L. Optimization of electric vehicle charging station location based on game theory. In Proceedings of the 2011 International Conference on Transportation, Mechanical, and Electrical Engineering (TMEE), Changchun, China, 16–18 December 2011; pp. 809–812. [Google Scholar]
- Zink, R.; Valdes, J.; Wuth, J. Prioritizing the Chicken or Egg? Electric Vehicle Purchase and Charging Infrastructure Subsidies in Germany. Politics Gov. 2020, 8, 185–198. [Google Scholar] [CrossRef]
- Wang, F.; Chen, R.; Miao, L.; Yang, P.; Ye, B. Location Optimization of Electric Vehicle Mobile Charging Stations Considering Mul-ti-Period Stochastic User Equilibrium. Sustainability 2019, 11, 5841. [Google Scholar] [CrossRef]
- MirHassani, S.A.; Ebrazi, R. A Flexible Reformulation of the Refueling Station Location Problem. Transp. Sci. 2013, 47, 617–628. [Google Scholar] [CrossRef]
- Hodgson, M.J. A Flow-Capturing Location-Allocation Model. Geogr. Anal. 2010, 22, 270–279. [Google Scholar] [CrossRef]
- Tian, H.P.; Sun, Z.; Zhu, J.; Chen, H.; Zhao, Y.; Zhang, M.; Chen, Y. Research on location evaluation method of charging facilities based on use efficiency. Adv. Technol. Electr. Eng. Energy 2018, 37, 9–16. [Google Scholar]
- Kuby, M.; Lim, S. Location of Alternative-Fuel Stations Using the Flow-Refueling Location Model and Dispersion of Candidate Sites on Arcs. Netw. Spat. Econ. 2007, 7, 129–152. [Google Scholar] [CrossRef]
- Upchurch, C.; Kuby, M.; Lim, S. A Model for Location of Capacitated Alternative-Fuel Stations. Geogr. Anal. 2009, 41, 85–106. [Google Scholar] [CrossRef]
- Kim, J.G.; Kuby, M. The deviation-flow refueling location model for optimizing a network of refueling stations. Int. J. Hydrogen Energy 2012, 37, 5406–5420. [Google Scholar] [CrossRef]
- Kim, J.G.; Kuby, M. A network transformation heuristic approach for the deviation flow refueling location model. Comput. Oper. Res. 2013, 40, 1122–1131. [Google Scholar] [CrossRef]
- Wang, Y.-W. An optimal location choice model for recreation-oriented scooter recharge stations. Transp. Res. Part D Transp. Environ. 2007, 12, 231–237. [Google Scholar] [CrossRef]
- Wang, Y.-W. Locating battery exchange stations to serve tourism transport: A note. Transp. Res. Part D Transp. Environ. 2008, 13, 193–197. [Google Scholar] [CrossRef]
- Wang, Y.-W.; Lin, C.-C. Locating road-vehicle refueling stations. Transp. Res. Part E Logist. Transp. Rev. 2009, 45, 821–829. [Google Scholar] [CrossRef]
- Kuby, M.; Lim, S. The flow-refueling location problem for alternative-fuel vehicles. Socio-Econ. Plan. Sci. 2005, 39, 125–145. [Google Scholar] [CrossRef]


Publisher’s Note: MDPI stays neutral with regard to jurisdictional claims in published maps and institutional affiliations. |
© 2021 by the authors. Licensee MDPI, Basel, Switzerland. This article is an open access article distributed under the terms and conditions of the Creative Commons Attribution (CC BY) license (https://creativecommons.org/licenses/by/4.0/).