Abstract
In recent years, new energy vehicles in Beijing have developed rapidly. This creates a huge demand for charging. It is a difficult problem to accurately identify the charging behavior of new energy vehicles and evaluate the use effect of social charging piles (CART piles) in Beijing. In response, this paper established the charging characteristics analysis model of new energy logistics vehicles based on the positioning data of new energy logistics vehicles. It also researched vehicle SOC and charging electricity and analyzed the utilization characteristics of charging facilities operation by using the operation data of charging facilities. Finally, this paper established the evaluation index system of regional charging facility layout to evaluate the construction level of charging facilities in each district.
1. Introduction
At present, all countries in the world are vigorously developing new energy vehicles, and China is included in the seven strategic emerging industries. The development of energy-saving and new energy vehicles is one of the important measures to reduce oil consumption and reduce carbon dioxide emissions in China. Central and local governments at all levels pay close attention to their development, and have successively issued various supporting and cultivating policies, creating a good policy environment for the development of new energy vehicles. From the international comparison of new energy vehicle technology and industrialization level, China’s new energy vehicles technology industrialization scale ranks first in the world, covering plug-in, extended range, pure electric and other technical routes, as well as slow charging, fast charging, battery replacement, wireless charging, dual source fast charging and other energy supply modes.
In recent years, China’s new energy vehicle industry has made significant progress in industry standards, industrial alliance, enterprise layout, technology research and development. The State Council, the Ministry of Finance, the State Administration of Taxation and the Ministry of Industry and Information Technology have issued a series of supporting policies for new energy vehicles, which play an important role in the healthy development, environmental protection, energy conservation and sustainable development of new energy vehicles.
In July 2020, Beijing promoted 350,400 pure electric vehicles, including 279,800 private electric vehicles and 70,600 public electric vehicles (including 20,100 freight cars). A total of 215,500 charging piles have been built. There are about 161,800 charging piles in private areas, and about 46,700 charging piles in public areas, including about 28,100 social public charging piles and 18,600 internal public charging piles. About 7000 charging piles have been built in the special field.
Under the influence of the national and Beijing policies on ecological civilization and pollution prevention and control, Beijing has issued the right of way and operation incentive policies for new energy trucks, which has promoted the rapid development of new energy trucks in recent years. Since 2015, the scale of new energy trucks has increased from more than 300 to 20,000, with an average annual growth rate of 4000. The growth of vehicle scale is bound to bring about the growth of charging demand. It is very important for charging facilities to meet the charging demand of freight vehicles. However, according to the survey, there are some problems in the field of public charging facilities in Beijing, such as low utilization rate, poor applicability and lack of convenience. The main reasons are as follows: first, the supply of charging facilities does not match the charging demand, resulting in zombie piles or queuing charging phenomenon in some charging stations, showing regional differentiation and unbalanced use efficiency; second, some social public pile construction standards are not applicable to all models. At the initial stage of social public pile construction, it is mainly to protect passenger cars, and the voltage platform is difficult to meet the charging requirements of large vehicles. Third, the management of charging stations is not in place, and the phenomenon of oil vehicles occupying space, piles and electricity is frequent. Therefore, it is urgent to fully analyze the regional differences in the use of existing charging piles and explore the deep-seated reasons for the differences. This paper will use the historical data of Beijing Electric logistics vehicles to extract and analyze the driving track data of each vehicle every day, analyze and predict the charging behavior and demand of the social charging pile freight vehicle user groups, and evaluate the service effect of the existing charging facilities. The management work provides theoretical basis, guides the construction direction of charging facilities of enterprises, meets the charging demand of public charging pile freight vehicles based on the principles of accessibility, applicability and convenience, and provides guarantee for the application of electric vehicles in freight transport industry.
2. Journals Reviewed
Based on the analysis of the characteristics of pure electric vehicles and the operation of pure electric vehicles, in recent years there was a lot of research on the pure electric vehicle operation and the operation route optimization of pure electric vehicles.
In terms of site selection and layout planning of vehicle charging stations and charging piles, Wang Xiaobo [1] studied the spatial layout planning of charging facilities for pure electric freight vehicles—taking Shenzhen as an example. Hu [2] studied the location and layout of new energy vehicle charging stations based on floating car data. The author proposed the maximum coverage model of charging space-time demand and explored the optimal location and layout area of charging stations under a certain number of charging stations. Wang [3] studied the layout planning of pure electric taxi charging stations in Tongzhou District, Beijing. According to the actual situation of Tongzhou District, the optimization model and optimal configuration model of pure electric taxi charging station layout planning are applied and verified. Liu [4] studied the planning and operation of charging service network under the integration of three networks. Based on the research on the basic elements and development form of charging service network, the author summarized the electric vehicle cluster scale deduction and charging load forecasting method under the influence of multiple factors.
In terms of planning and designing the charging infrastructure, Liu [5] used UCINET analysis tool. This paper analyzes the point centrality and intermediate centrality of various stakeholders in the industrial chain at the stage of market introduction and market expansion of charging infrastructure and draws the network relationship maps of the two stages, respectively, based on the point centrality. Liu [6] studied the comprehensive performance evaluation of electric vehicle charging station and proposed the comprehensive performance evaluation index system of electric vehicle charging station, which provides reference and guidance for charging stations with different charging modes in planning, construction and operation management, and distinguishes the two charging modes in the index evaluation standard. Li [7] studied the charging pile resources of new energy vehicles based on auction mechanism and proposed a charging pile allocation and pricing mechanism based on auction mechanism. First, the actual problem of charging pile is abstracted into a mathematical model; then, based on the optimal mechanism design model, the maximum social welfare is taken as the objective function to establish the planning model, and the constraint conditions are established to ensure the feasibility of the model; finally, the idea of weighted bipartite graph maximum matching algorithm is used to solve the resource allocation problem of charging pile, and then the payment price is calculated with VCG (Vickrey Clarke groves) pricing algorithm, so as to ensure the fairness and credibility of the mechanism.
In terms of research and evaluation of commercial operation mode of vehicle charging, Wang [8] studied the charging operation mode, operation strategy and typical design of electric vehicles in residential areas, and proposed a charging operation mode, operation strategy and typical scheme design for residential areas. Zeng [9] studied the comprehensive evaluation of electric vehicle charging business operation mode based on value chain analysis and proposed a comprehensive evaluation model for the benefits of electric vehicle (EV) charging business operation mode. Bai [10] studied the design and evaluation of commercial operation mode of electric vehicle charging and proposed a comprehensive evaluation model for the benefits of commercial operation mode of electric vehicle charging. Xiao Qian [11] studied the design of “charging facilities + Internet” business model. Jia [12] studied the development bottleneck and business model of new energy vehicle charging service, analyzed the current situation of new energy vehicle charging service industry and several major problems encountered in the development process, including immature technology and business model. Finally, a series of feasible business models for investment and operation enterprises to enter the charging service industry are summarized and analyzed. Qin [13] studied the operation characteristics and evaluation methods of urban public charging facilities and designed a comprehensive evaluation index system for electric vehicle public charging facilities. Feng Yi [14] studied the mode of charging facilities’ electricity demand participating in the direct transaction of large users, proposed the path and mode of bundling the power demand of charging facilities and participating in the direct transaction of large users, and on this basis, made a simple estimation of the profit space after participating in the transaction.
In terms of vehicle condition monitoring, Xiong [15] studied the state monitoring of electric vehicles in the joint operation of charging and swapping and new energy consumption. Based on the large-scale development of electric vehicles, the impact of disorderly charging on distribution network and new energy consumption. In addition, it is necessary to study the operation status of new energy vehicles and to monitor the charging status of electric vehicles in real time. The system can realize remote real-time control of the start and stop of electric vehicles.
In terms of the research on the relationship between charging facilities and automobile market, Sun [16] studied the city scale, charging facilities construction and the cultivation of new energy vehicle market. From the perspective of city scale, under the theoretical framework of historical friendly model, the manufacturer decision-making model and consumer decision-making model are constructed, and the initial parameters are set by using statistical data and data to simulate the evolution process of new energy vehicle industry. The difference effect of charging facilities construction in different cities on the cultivation of new energy vehicle market was compared.
Based on the integration of new energy grid and electric vehicle charging path planning, Chen [17] studied the electric vehicle charging path planning based on the integration of new energy grid and vehicle charging path. The simulation results showed that the proposed planning method could effectively balance the charging load of each charging station, optimize the operation state of distribution network and traffic network, and had positive significance for improving the level of new energy consumption. Li [18] studied the optimization research on the location and path problem of the charging and exchanging power station for the secondary distribution electric vehicles in the urban area, and proposed to optimize the location and distribution path of the charging and replace power stations for different types of electric logistics vehicles so as to improve the use efficiency of electric logistics vehicles, achieve the purposes of saving logistics costs, energy saving and reducing environmental pollution. Hu [19] studied the two-level optimization strategy of electric vehicle charging based on electricity price guidance and established a two-level optimization model of electric vehicle charging based on price guidance. Liu [20] studied the two-level real-time energy management mechanism and optimization strategy of electric vehicle charging area/station, proposed a hierarchical energy management architecture for electric vehicle charging, including grid dispatching center, area-ems and μ—EMS, and elaborated the functions of each level and the operation principle of the architecture model.
In terms of spatial and temporal characteristics analysis of electric taxi charging load, Li [21] studied the prediction and analysis of spatial-temporal characteristics of electric taxi charging load based on OD matrix, integrated OD matrix information of taxi traffic and taxi business operation time window, analyzed passenger travel demand characteristics and taxi driving state conversion characteristics, and adopted Monte Carlo method, The simulation process of taxi charging demand is established.
In the research of new energy vehicles under big data, Zhu [22] using membership function and K-means clustering algorithm, the attribute character of truck driving cycle analysis is determined, and the analysis model of truck driving cycle is constructed. She [23] studied the application of big data analysis technology in the new energy vehicle industry based on the big data of new energy vehicle operation. Xie [24] studied the operation characteristics analysis of new energy time-sharing rental vehicles based on data. Shao [25] carried out the operation characteristics analysis and distribution path optimization of pure electric logistics vehicles. Yu [26] carried out an analysis on the influencing factors of electric vehicle charging behavior based on travel chain, introduced the concept of travel chain, integrated the data of charging process and discharge process of electric vehicles, considered various potential factors influencing charging behavior of electric vehicles from the actual situation and determined the factors significantly affecting charging behavior through logistic regression model analysis. Ding [27] carried out the analysis of charging law of electric vehicles based on GMM. By introducing the Gaussian mixture model (GMM) to flexibly model the charging behavior characteristics with different distribution laws, the rationality of the model was verified by K-S test, and the advantages and disadvantages of the model were compared with the single distribution law model. Finally, the charging behavior of electric vehicles was analyzed by the model. Huang [28] carried out data-driven modeling and analysis of charging behavior and charging demand of electric vehicles. From the perspective of charging stations, the regularity of a large number of electric vehicles in the charging process is characterized by characteristic variables of charging behavior, and the probability modeling of characteristic variables is conducted by using diffusion kernel density estimation method. This method has the nonparametric characteristics of ordinary kernel density estimation method, has good boundary estimation performance and can adaptively adjust the smoothing performance according to the density of observation value so as to achieve the best goodness of fit. Pan [29] carried out a study on the layout optimization of electric vehicle charging facilities based on charging choice behavior and established a charging choice model for electric vehicle travelers. The deterministic and stochastic charging decision-making process is proposed. In the stochastic charging decision-making process, the charging selection model is considered to estimate the charging probability. Xie [30] carried out a study on the optimal network layout of electric vehicle charging facilities and established a charging station location model based on Voronoi diagram method and a charging pile sizing model based on queuing theory to meet all charging requirements in the planning area. On this basis, the optimization model of minimum total social cost is established, and the optimal layout of man vehicle pile network is obtained. Finally, the feasibility and rationality of the planning method are verified by an example. Research on the development of new energy vehicle and charging pile technology. Fabio Arena [31] research on provide an overview of the current status and future perspectives of smart cars, taking into account technological, transport and social features. Phap Vu Minh [32] analyzed technically and economically the optimal configuration of PV-powered EV charging stations under different solar irradiation conditions in Vietnam. Stefania Boglietti [33] used PRIMA’s methodological approach and well-known scientific repositories (i.e., Scopus, Web of Science and Google Scholar); 90 studies between 2014 and 2020 were retrieved and analyzed. An overview and classification into endogenous issues (e.g., impact on transport and urban planning) and exogenous issues (e.g., impact on safety and the environment) are provided. Salvatore Trubia [34] pursued the objective of describing the global vision, the possible future direction of these innovations concerning the automotive and transport industries and a particular focus on infrastructures and roadways.
3. Research Route
This article is based on the positioning data of pure electric logistics vehicles in Beijing and the operation data of public charging piles in the whole city. Firstly, the charging characteristics of the city’s sub-traffic districts were analyzed, the vehicle positioning data were cleaned, and the missing data were supplemented, a set of path matching algorithm based on the positioning data was established, and the charging SOC, charging quantity and charging times of each traffic district were analyzed to evaluate the overall situation of the charging layout within the city. Then, a set of regional charging facility layout evaluation index system characteristic analysis index system was established to evaluate the operation and construction of charging facilities in each district of the city.
4. Data Sources and Methods
This section mainly introduces the data access in this study and the principles of data cleaning and checking.
4.1. Data Sources
1. New energy truck data sources
Vehicle positioning data are used for new energy truck data, data source: TCP, data frequency requirement: no more than 30 s, data volume: 5000 new energy logistics vehicles, time period: December 2019. As shown in the Table 1 and Table 2 below.

Table 1.
Data field description.
Table 2.
Data sample.
2. Operation data sources of charging facilities
The operation data of charging facilities adopts the order data of social public charging facilities. The data volume is 2700 social charging piles (CART piles), and the time period is December 2019. As shown in the Table 3 and Table 4 below.
Table 3.
Data field description.
Table 4.
Data sample.
4.2. Data Cleaning and Data Processing
1. Sequential cleaning
Delete time repeated data to form effective time series data.
2. Data cleaning
(1) Determination of starting point
(2) Abnormal data deletion: delete the whole data when the speed of adjacent points > 120 km/h.
(3) Patching: when the time of adjacent points is more than 60 s, data patching is carried out according to the rules of patching points (see the algorithm document for the rules).
(4) Second deletion of data: according to the determination of stay time, when the stay time is more than 60 min, only the first 30 min and the last 30 min data of the stay period are retained, and the remaining data are deleted.
(5) Judge the longitude and latitude fields, delete the empty data, city range: longitude 116–117.5, latitude 36–40.
3. Residence state identification
When the time between the continuous track points of the vehicle is more than 60 min, but the longitude and latitude do not change (or the driving mileage is ≤0.005 km), the vehicle is judged to be in the stop state. The first point of the dwell period is the end of the previous trip, and the last point of the dwell period is the starting point of the next trip.
4. The driving distance, driving time, driving speed and SOC are calculated.
(Note: mileage unit: m)
(Note: driving time unit is s)
(Note: the unit of driving speed is km/h)
SOC:
SOC is used to reflect the remaining capacity of battery according to sim_Code, GPS_After sorting, the same SIM is filtered out first_”Charge” under code_discharge_After sorting by time in the continuous data, the first and last data in the continuous data, where “charge”, are sorted by time, are filtered out_discharge_In “state”, the SOC field is extracted. The first data is the SOC initial charging value, and the SOC value of the last data minus the SOC value of the first data to get the SOC change of each charging.
4.3. Data Algorithm Description
The main purpose of this part is to realize the algorithm of location data encryption and matching with road network Link. The overall flow chart is shown below. By combining the location data with the road network SHP file data, the road network matching of the truck location data is realized.
The key step is to capture the road network data and form the Link connectivity set between each other, so as to pick up the road network and judge the connectivity. After each point bit is matched to the adjacent Link, test whether there is a certain degree of connectivity between the links of the two points before and after it. If there is no connectivity, one of the two points is abnormal and needs to be fixed. As shown in the Figure 1 below.
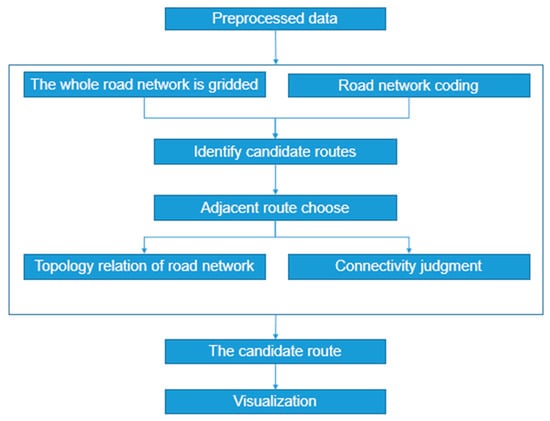
Figure 1.
Flow chart of path matching algorithm.
5. Analysis on Charging Characteristics of New Energy Logistics Vehicles
5.1. SOC Distribution of Initial Charging for New Energy Logistics Vehicles
According to the analysis results of SOC data of initial charging, the initial SOC of new energy trucks in the city mainly starts from 50%–80%. As shown in the Figure 2 below.
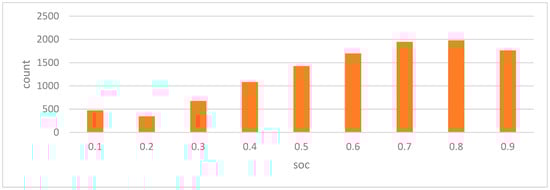
Figure 2.
SOC distribution of vehicle initial charging.
According to the analysis results of SOC data of initial charging, the SOC of initial charging in urban area is mainly 40%, and the SOC value of initial charging in Huairou, Fangshan, Miyun, Pinggu and other areas in the outer suburbs may be lower due to the remote geographical location and less charging facilities.Logistics parks such as Majuqiao Jingdong Logistics Park, Daxing Industrial Park, future science city, Shunyi airport area, etc., due to the large energy demand of logistics vehicles, the initial charging SOC is also low. As shown in the Figure 3 below.
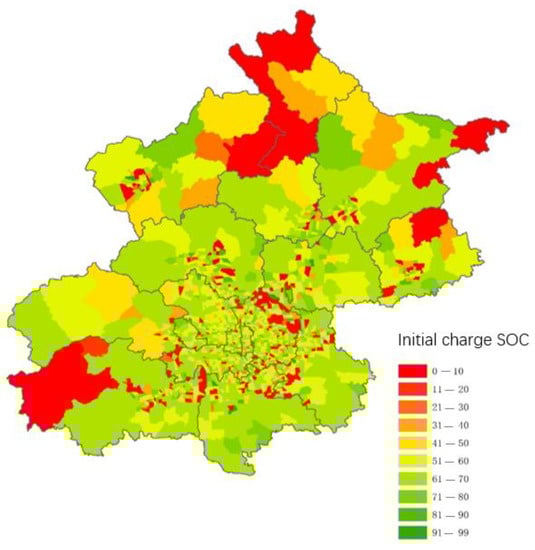
Figure 3.
SOC distribution of initial charging in different regions.
5.2. Power Distribution of Single Charging for New Energy Logistics Vehicles
According to the analysis results of SOC data of initial vehicle single charging, the single charging power of new energy trucks in the city is mainly concentrated in 20–50%. As shown in the Figure 4 below.
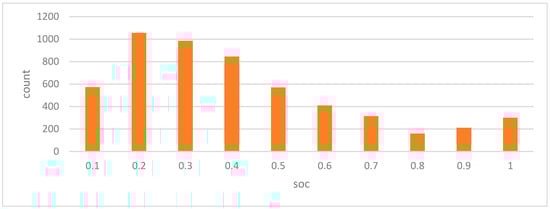
Figure 4.
Distribution of single charging power of vehicle.
According to the analysis results of charging times of single vehicle in different time periods, 8–12 o’clock and 0–2 o’clock are the most concentrated charging times in the whole city. Vehicles choose to charge at noon. The main reason is that most of the freight cars in the city choose to deliver goods at night, and the proportion of distribution in daytime is small. Vehicles choose to charge in the morning. On the one hand, we should make reasonable use of time, and on the other hand, we should make full use of time. The daily peak congestion time is staggered. As shown in the Figure 5 below.
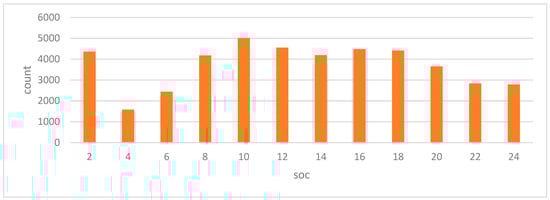
Figure 5.
Distribution of vehicle charging in different time periods.
According to the data analysis results of each charging, the charging power in the urban area is slightly higher than that in the suburb, and the main charging power is between 20% and 50%. As shown in the Figure 6 below.
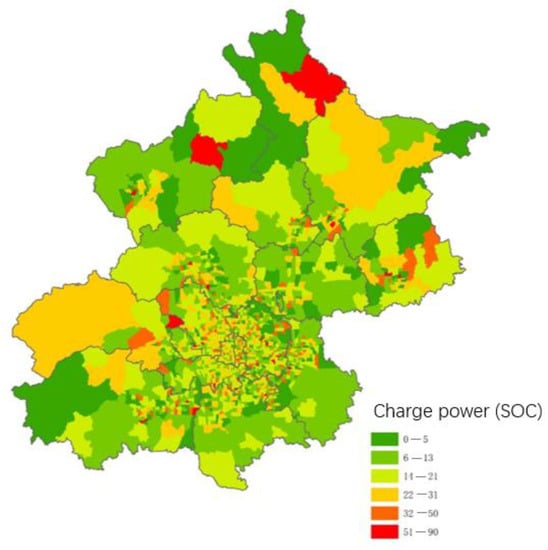
Figure 6.
Distribution of charging power in different areas.
According to the data analysis results of single vehicle charging times, the areas with more charging times in the whole city are mainly in the southeast and the surrounding areas of the sixth ring road. The main reason for the more charging times in this area is that the logistics parks in the southeast region are more concentrated, the logistics vehicles run frequently, and the energy demand is large. As shown in the Figure 7 below.
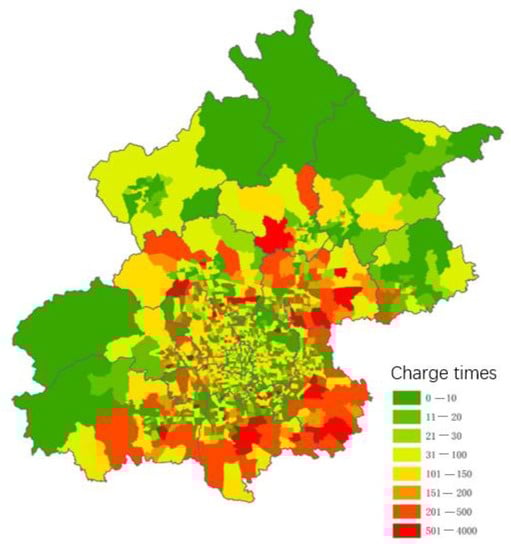
Figure 7.
Distribution of single vehicle charging times in different areas.
6. Operating Characteristics of Charging Facilities
6.1. Utilization Distribution of Charging Facilities
The main observation index of the operation characteristics of charging piles in the whole city is the time utilization rate of charging piles. According to the time utilization analysis of social charging piles (CART piles) in December 2019, the average utilization rate of social public charging piles in Beijing is 11% (the average utilization rate of public charging piles that have been built in China is 15%). Among them, the highest utilization rate is 75%, and the utilization rate of about half of charging piles is less than 6%. As shown in the Figure 8 below.
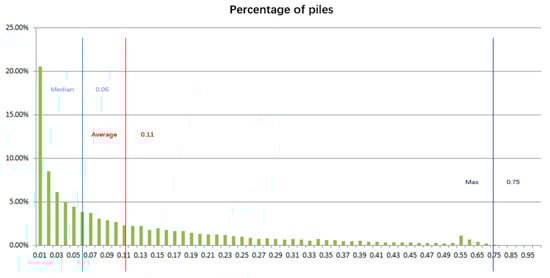
Figure 8.
Distribution of utilization rate of charging piles in Beijing.
From the distribution of utilization rate of charging piles in each district, the average utilization rate of charging piles in Shijingshan District, Tongzhou District, Shunyi District and Daxing District is relatively high, which is 4–6 percentage points higher than the average value of the whole city, while that of Pinggu District, Huairou District and Yanqing District is relatively low, less than 5%. As shown in the Table 5 below.
Table 5.
Distribution of utilization rate of piles in each area.
6.2. Utilization Evaluation of Charging Facilities
The evaluation index system of regional charging facilities utilization rate is mainly evaluated from two aspects, namely the service radius of charging pile and the utilization efficiency of charging facilities. The data base comes from the basic information of charging pile and the operation data of charging pile end. The final evaluation dimension includes the scope of the whole city and each administrative region. As shown in the Figure 9 below.
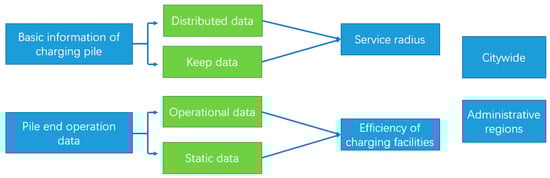
Figure 9.
Evaluation system of charging facilities utilization.
The average charging utilization rate of social charging piles in the whole city is 11%, and the service radius of charging piles is required to be less than 5 km. The comparison of service radius, charging utilization rate and standard of each district are as shown in the Table 6 below.
Table 6.
Evaluation index of charging facilities utilization in each district.
According to the calculation, the utilization efficiency and service level of charging piles in Haidian District, Shunyi District, Shijingshan District and Changping District are relatively high, while the utilization rate or layout of charging piles in other districts and charging piles need to be improved.
7. Study on Evaluation Index System of Regional Charging Facilities Layout
7.1. Construction of Evaluation Index System for Regional Charging Facilities Layout
The evaluation index system of regional charging facilities layout mainly evaluates the city’s social charging facilities from five aspects, namely, pile service scope, vehicle pile ratio, single vehicle charging power, single pile average power and regional time utilization rate. Among them, the pile service range, vehicle pile ratio and single vehicle charging power index are used to characterize the construction problems of charging pile, which mainly affect the construction strength of charging pile; the average power of single pile represents the proportion of fast charging pile, which mainly affects the proportion of fast charging pile; the utilization rate of regional charging time mainly represents the layout of charging pile and mainly affects the layout planning of charging facilities. As shown in the Figure 10 below.
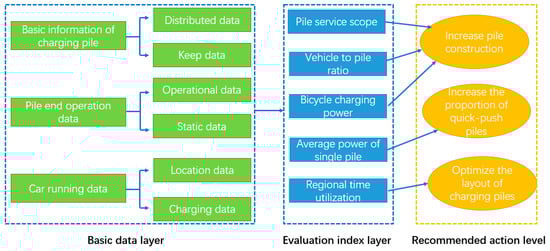
Figure 10.
Evaluation index system of regional charging facilities layout.
1. Evaluation index system of charging facilities layout
The main indicators of charging facilities layout evaluation index system include regional vehicle pile ratio, charging pile service scope, regional single pile power, regional single vehicle power, regional average time utilization rate.
2. Analysis results of index system in all districts of the city
(1) Regional vehicle pile ratio
Calculation method:
Area vehicle to pile ratio = the number of vehicles in the area with the longest parking time per week/the number of charging piles in the area.
The results are as follows:
According to the calculation data of each district, Fengtai, Xicheng, Haidian, Mentougou and Changping districts have relatively large vehicle piles, which are far behind the average value of the whole city, and the supply and demand of charging piles are not balanced. The vehicle pile ratio in Yanqing, Pinggu, Miyun and Shunyi districts is relatively reasonable. As shown in the Table 7 below.
Table 7.
Vehicle pile ratio.
(2) Average service range of charging point
Calculation method:
Service scope of charging point = area/number of charging points
The results are as follows:
According to the calculation data of each district, the average service range of charging pile is basically within 5 square kilometers, among which Miyun, Yanqing, Huairou and Mentougou districts have larger service scope. As shown in the Table 8 below.
Table 8.
Service scope of charging pile in each district (km).
(3) Regional single pile power
Calculation method:
Regional single pile power = total power of regional charging piles/number of regional charging piles
The results are as follows:
According to the calculation results of each district, the average power of single pile in Haidian, Chaoyang, Fengtai and Xicheng districts is relatively low, so it is necessary to strengthen the construction of fast filling pile. As shown in the Table 9 below.
Table 9.
Power of single pile in each area (kw).
(4) Regional single car power
Calculation method:
Regional single vehicle power = total power of regional charging point/the number of vehicles with the longest parking time in the area per week
The results are as follows:
According to the calculation results of each district, the average power of single vehicle in Haidian, Xicheng, Fangshan, Changping, Daxing, Fengtai and Mentougou districts is relatively low, so it is necessary to strengthen the construction of fast filling piles. As shown in the Table 10 below.
Table 10.
Average power of single vehicle in each district (kw).
(5) Regional average time utilization
Calculation method:
Time utilization = daily order duration/24 h a day
The results are as follows:
The overall average time utilization rate of the whole city is 11.6%. According to the calculation results of each district, the average time utilization rate of Pinggu, Huairou, Yanqing, Mentougou, Miyun, Fangshan, Xicheng and Dongcheng districts is relatively low, so it is necessary to further optimize the layout of charging piles. As shown in the Table 11 and Table 12 below.
Table 11.
Time utilization rate of each district.
Table 12.
Analysis of index system of each district.
7.2. Comprehensive Analysis on Index System of Each District
Five kinds of indicators (regional vehicle pile ratio, charging pile service scope, regional single pile power, regional single vehicle power, regional average time utilization rate) can be roughly divided into three categories, namely, increasing pile construction efforts (service scope of charging pile, regional vehicle pile ratio, regional single vehicle power), increasing the proportion of fast charging pile (regional single pile power), optimizing the layout of charging pile (regional average time utilization rate). From the data of each district, Haidian District, Mentougou District, Fangshan District, Daxing District, Changping District, Xicheng District and Fengtai District need to focus on increasing the construction of charging piles. It is necessary to increase the number or proportion of fast filling piles in Xicheng District, Haidian District, Fengtai District and Chaoyang District. It is necessary to optimize the layout of charging piles in Pinggu, Huairou, Yanqing, Mentougou, Miyun, Fangshan, Xicheng and Dongcheng districts. Among them, the number of charging piles, the proportion of fast and slow charging and the overall layout planning of Tongzhou, Shunyi and Shijingshan are relatively reasonable.
8. Conclusions
In order to characterize the charging behavior of new energy trucks in Beijing, identify the main problems in the charging process of new energy trucks, evaluate the use effect of social charging piles (CART piles), and finally put forward reasonable suggestions. This paper extracts 5000 new energy freight vehicle trajectory data and 2700 charging facilities operation data. The SOC field of the vehicle is extracted from the vehicle end data, and the characteristics of the initial charging position and single charging capacity of the vehicle are analyzed. The distribution of the charging location in the whole city is analyzed to identify the main charging positions of the freight vehicles in the city. The statistical results show that the initial charging power of new energy trucks in the city is mainly 50–80%, and the single charging power is between 20–50%. The charging location is mainly concentrated in the southeast and other key logistics bases.
According to the pile data, the utilization rate of charging facilities is identified, and the evaluation system of charging facilities utilization rate is established for each district. The statistical results show that the utilization rate of charging facilities in the whole city is 11%. According to the service radius and charging utilization rate and standards, the utilization efficiency and service level of charging piles in Haidian District, Shunyi District, Shijingshan District and Changping District are relatively high, while the utilization rate or layout of charging piles in other districts and charging piles need to be improved.
Finally, the evaluation index system of charging facilities layout is established by the fusion of vehicle end data and pile end data. The main indicators include regional vehicle pile ratio, charging pile service range, regional single pile power, regional single vehicle power, and regional average time utilization. Five kinds of indicators and five kinds of indicators are roughly divided into three categories: increasing pile construction efforts (service scope of charging pile, regional vehicle pile ratio, regional single vehicle power), increasing the proportion of fast charging pile (regional single pile power), optimizing the layout of charging pile (regional average time utilization rate). According to the evaluation results of each district, three different measures are proposed.
Author Contributions
Conceptualization, Z.T.; methodology, P.W.; formal analysis, Y.Y.; investigation, Y.L.; data curation, P.W. and Y.L.; writing—original draft preparation, Y.Y. and P.W. and Y.L.; writing—review and editing, Z.T.; visualization, Y.L.; supervision, Z.T.; project administration, Y.Y.; funding acquisition, Y.Y. All authors have read and agreed to the published version of the manuscript.
Funding
This research received no external funding.
Institutional Review Board Statement
Not applicable.
Informed Consent Statement
Not applicable.
Data Availability Statement
Not applicable.
Acknowledgments
The authors would like to thank anonymous reviewers for their very helpful suggestions.
Conflicts of Interest
The authors declare no conflict of interest.
References
- Xuewei, C.; Hongliang, C. Differences in Preventive Behaviors of COVID-19 between Urban and Rural Residents: Lessons Learned from A Cross-Sectional Study in China. Int. J. Environ. Res. Public Health 2020, 17, 4437. [Google Scholar] [CrossRef]
- Hu, P.; Cao, X.; Qin, H.; Rong, F. A study on the location of a new energy vehicle charging station based on floating car data—Taking Guangzhou as an example. Modern Urban Stud. 2018, 8, 28–36. [Google Scholar]
- Wang, J. Study on Layout Planning of Charging Station for Tongzhou District Electric Taxi; Beijing Jiaotong University: Beijing, China, 2017. [Google Scholar]
- Liu, J.; Xiang, Y.; Yao, H.; Tang, S.; Shafqat, J. Discussion on charging service network planning and operation under triple play. Power Syst. Protect. Control 2019, 47, 1–12. [Google Scholar] [CrossRef]
- Liu, Y.; Zhang, J.; Yue, W.; Li, S. Industry Chain Evolution of EV charging infrastructure industry chain from the perspective of network relationship. China Sci. Technol. Forum 2019, 1, 66–79. [Google Scholar] [CrossRef]
- Liu, C.; Li, Y.; Xia, L.; Li, H.; Li, B.; Ma, X.; Jang, J. Comprehensive performance evaluation of electric vehicle charging station. J. N. China Electr. Power Univ. 2017, 44, 82–88. [Google Scholar]
- Li, T.; Xie, Q.; Zhang, X.; Li, W.; Zhang, J. New energy vehicle charging pile resource problem based on auction mechanism. Comput. Appl. 2019, 39, 264–270. [Google Scholar]
- Wang, F. EV charging operation mode, operation strategy and typical design in residential area. Sci. Technol. Manag. Res. 2018, 38, 228–234. [Google Scholar]
- Zeng, B.; BAI, J.; Zhang, Y.; Sun, E. Comprehensive Evaluation of electric Vehicle Charging Business Operation Model based on Value chain Analysis. Electr. Power Autom. Equip. 2016, 38, 21–27, 34. [Google Scholar] [CrossRef]
- Bai, J. Commercial Operation Mode Design and Evaluation of EV Charging; North China Electric Power University: Beijing, China, 2018. [Google Scholar]
- Xiao, Q.; Lu, G.; Chen, X. Charging facility + Internet business model design. J. N. China Electr. Power Univ. 2017, 6, 21–27. [Google Scholar]
- Jia, J.; Guo, M.; Fan, C.; Guo, X.; Yin, C.; Cui, M. Discussion on development bottleneck and business model of new energy vehicle charging service. Shaanxi Electr. Power 2016, 44, 46–50, 59. [Google Scholar]
- Qin, M.; Feng, S.; Zhao, Y. Operation Characteristics and Evaluation Methods of Urban Public Charging Facilities. Available online: https://kns.cnki.net/kcms/detail/detail.aspx?dbcode=CMFD&dbname=CMFD201901&filename=1018238761.nh&v=pvq1ViGAZ5F1B6lj75ADxZdD6L%25mmd2FBbtFbX%25mmd2Brzc8RnyaPQgmH6Wnf6elvTbSE1mI2v (accessed on 1 April 2021).
- Feng, Y.; Zhang, B.; Liu, H.; Yang, L. Charging facility electricity demand participation large user direct transaction mode. China Power 2018, 51, 175–179. [Google Scholar]
- Xiong, W.; Wang, K.; Wu, S.; Zou, Y.; Bo, G. Research on condition monitoring of electric vehicle in combined operation of charging and new energy dissipation. J. China Three Gorges Univ. 2019, 41, 84–87. [Google Scholar]
- Sun, X.; Liu, X.; Yu, R. City scale, charging facility construction and new energy vehicle market cultivation. Oper. Res. Manag. 2018, 27, 111–121. [Google Scholar]
- Chen, L.; Liu, Y.; Chi, F.; Song, Y. Multi-grid integrated charging path planning for electric vehicle considering new energy sources. Inf. Technol. 2018, 6, 85–91. [Google Scholar]
- Li, Q. Study on Location and Routing Optimization of Secondary Distribution EV Charging Station in Urban Area; North China Electric Power University: Beijing, China, 2018. [Google Scholar]
- Hu, D.; Guo, C.; Yu, Q.; Yang, X. Electric vehicle charging bilevel optimization strategy based on price guidance. Power Constr. 2018, 39, 48–53. [Google Scholar]
- Liu, Q.; Zhang, Y.; Wei, J.; Hong, C.; Pang, F.; Zhou, Q. Electric vehicle charging area/station two-stage real-time energy management mechanism and optimization strategy. Electr. Power Autom. Equip. 2019, 39, 122–129, 152. [Google Scholar]
- Li, S.; He, Z.; Ting, K.; Ching, Y. Analysis of space-time characteristics of electric taxi charging load based on OD Matrix. Grid Clean Energy 2019, 35, 88–96. [Google Scholar]
- Zhu, T. Analysis of Truck Driving Condition Based on Big Data Technology; Jilin University: Jilin, China, 2018. [Google Scholar]
- She, C.; Zhang, Z.; Liu, P.; Sun, F. Application of big data analysis technology in new energy vehicle industry: A review based on new energy vehicle operation big data. Chin. J. Mech. Eng. 2019, 20, 3–16. [Google Scholar]
- Xie, X.; Chen, H.; Lin, Y.; Tu, H. Data-driven analysis of new energy time-sharing rental vehicle operation characteristics. J. Wuhan Univ. Technol. 2017, 41, 678–681. [Google Scholar]
- Shao, S. Study on Operation Characteristics and Distribution Route Optimization of Pure Electric Logistics Vehicle; Beijing Jiaotong University: Beijing, China, 2017. [Google Scholar]
- Yu, H.; Zhang, L.; Ren, Y. Analysis of influencing factors of EV charging behavior based on trip chain. J. Beijing Univ. Aeronaut. Astronaut. 2019, 45, 1732–1740. [Google Scholar]
- Ding, J.; Wei, R. Analysis of electric vehicle charging law based on GMM. South. Farm Mach. 2019, 50, 156–157. [Google Scholar]
- Huang, S. Modeling and Analysis of Data-Driven EV Charging Behavior and Charging Demand; Zhejiang University: Hangzhou, China, 2020. [Google Scholar]
- Pan, L. Research on the Layout Optimization of EV Charging Facilities Based on Charging Selection Behavior; Beijing Jiaotong University: Beijing, China, 2019. [Google Scholar]
- Xie, Y.; Zhang, L.; Deng, S.; He, J. Research on optimal network layout of electric vehicle charging facilities. Pract. Underst. Math. 2020, 50, 168–176. [Google Scholar]
- Arena, F.; Pau, G.; Severino, A. An Overview on the Current Status and Future Perspectives of Smart Cars. Infrastructures 2020, 5, 53. [Google Scholar] [CrossRef]
- Vu, M.P.; Sang, L.Q.; Hai, P.M. Technical Economic Analysis of Photovoltaic-Powered Electric Vehicle Charging Stations under Different Solar Irradiation Conditions in Vietnam. Sustainability 2021, 13, 3528. [Google Scholar] [CrossRef]
- Boglietti, S.; Barabino, B.; Maternini, G. Survey on e-Powered Micro Personal Mobility Vehicles: Exploring Current Issues towards Future Developments. Sustainability 2021, 13, 3692. [Google Scholar] [CrossRef]
- Trubia, S.; Severino, A.; Curto, S.; Arena, F.; Pau, G. Smart Roads: An Overview of What Future Mobility Will Look Like. Infrastructures 2020, 5, 107. [Google Scholar] [CrossRef]
Publisher’s Note: MDPI stays neutral with regard to jurisdictional claims in published maps and institutional affiliations. |
© 2021 by the authors. Licensee MDPI, Basel, Switzerland. This article is an open access article distributed under the terms and conditions of the Creative Commons Attribution (CC BY) license (https://creativecommons.org/licenses/by/4.0/).