Abstract
The Contingency Outsourcing Relationship (CORE) model originated from the Four Outsourcing Relationship Types (FORT) model; the CORE model is used in the globalized Facility Management (FM) industry, while the FORT model is originally used in the global information technology industry. The purpose of this paper is to thoroughly analyse the simulated case studies of the four different categories (i.e., in-house, technical expertise, commitment and common goals) of the CORE model from the perspective of the various clients. This study builds on the previous work on the outsourcing relationships between a client and a globalized FM service provider. It further explores the application of this model with the aid of artificial neural networks (ANNs) towards a sustainable future. A quantitative methodology through a survey is used to analyse eight outsourcing strategies for the four outsourcing relationships. A set of revised rules of the CORE is introduced and discussed regarding the approaches to investigate the four simulated outsourcing relationship systems. The study further reveals that an interesting understanding of the four outsourcing categories can be systematically and efficiently implemented into the FM outsourcing relationships through the methodology of scientific Artificial Intelligence (AI). It is concluded that FM outsourcing categorization may help to define the appropriate relationships. This further detailed outcome generated from the ANN can be clearly considered a strong and solid reference to define and explain the existing outsourcing relationships between the stakeholders and the service providers with the aim to assign an outsourcing category to the FM relationship between the client and service provider based on the learnt rules.
1. Introduction
Nowadays, it is imperative for FM clients and service providers to plan well and restructure the future steps of their own FM department or organization. Even though FM has grown from the traditional day-to-day operational management to be a strategic management tool, janitorial services and facilities maintenance remain the most outsourced FM services [1]. As the frontline of facilities management and property management industries, FM professionals keep learning to be well prepared for managing, now and in the future. Perhaps as a new approach, FM outsourcing relationships can be tested and verified by the advanced technology of artificial intelligence.
Lok et al. [2] address and introduce the application of Artificial Neural Networks to the FM outsourcing relationship services model, such as building maintenance, cleaning, security and catering. The importance of artificial intelligence to FM outsourcing services is getting more and more critical in order to achieve better utilization of FM resources and better global health towards socio-economic development. The goal of this study is to examine the outsourcing category of the FM outsourcing services such as maintenance, cleaning, security and catering contracts for the clients. In addition, the significance is to implement and manage the FM outsourcing strategies through the sustainable development lens. The conclusion finalises the bespoke FM Contingency Outsourcing Relationships (CORE) model, exploring why and how it can logically consider application into the modern FM industry.
2. Literature Review
This paper is the theoretical level with a simulation of the four possible outcomes on the application of artificial intelligence as examples, such as Artificial Neural Networks, in a measurable and quantifiable manner. The FM outsourcing relationship model/system between clients and service providers can relate to the energy efficiency in the built environment. The research question is asking whether FM outsourcing relationships can be tested and verified by the robust and scientific artificial neural networks so that the quality and productivity of FM outsourcing services can be increased and reinforced by the FM CORE model. In order to develop a comprehensive, objective, reliable and practical performance evaluation model for FM outsourcing services using the ANN at quantifying and measuring the effectiveness and efficiency, this part discusses the key performance indicators affecting the FM outsourcing services and to explains the design of strategies for management of FM outsourcing relationships.
2.1. Measurement and Quantification of FM Outsourcing Services with Key Performance Indicators
2.1.1. How FM Key Performance Indicators Relate to FM Service Outsourcing
The development of FM was influenced by society’s need for increasing efficiency following the economic crisis of the mid-1970s and the evolvement of new public management [3]. Outsourcing is considered to be one of the suggested ways to introduce private-sector ideas to the public sector to increase efficiency. Haugen and Klungseth [4] reported that since its conception, FM has focused on productivity, and, from the late 1980s, one major subject for discussion has been the efficiency of FM services related to their quality. In a way, it can be argued that FM has changed its focus from efficiency to effectiveness. Nowadays, the focus is on cost optimization, customer satisfaction and service quality. Haugen and Klungseth [4] also emphasizes the core businesses’ productivity and people’s quality of life globally with respect to how to procure and manage FM services and how to obtain sound service quality and efficiency. It is indicated in the literature that the effectiveness and efficiency of FM outsourcing services affect productivity in offices. Poor accountability and responsibilities of FM outsource providers are taken, and poor productivity of the client can be observed [5]. The FM outsourcing practices have an impact on the productivity of the client. Fleming [6] suggests the need to measure user satisfaction, user comfort and user productivity.
Hou et al. [7] explain that tight budget constraints and the absence of strategic planning are two important factors that affect FM service outsourcing. Adverse outsourcing relationships are due to tight budget constraints and the lack of strategic planning as a series of inefficiencies in the outsourcing process. To improve the FM outsourcing performance and relationships, comprehensive strategic planning is necessary.
Ernst and Young [8] reported that the three main reasons why organizations in Europe are outsourcing in 2013 were cost reduction, efficiency improvement and reduction in headcount. Measurement of efficiency of FM outsourcing is necessary for continuous improvement. As Pintelon and Puyvelde [9] explained, performance metrics are mostly ratios demonstrating effectiveness, efficiency or productivity. Appropriate quantifiable and measurable indicators are important. Research studies are lacking in providing a set of quantifiable KPIs for strategic decision-making in organizations [10]. The performance indicators to measure facilities and/or organizations should not only be easily measurable but also quantifiable in order to make valid comparisons and decisions [10,11,12,13,14,15,16]. In order to measure the performance metrics of FM outsourcing services, the appropriate quantifiable and measurable methodology is crucial. Lok et al. [2] introduce the artificial intelligence approach using Artificial Neural Networks (ANN), which quantifies and measures the FM outsourcing relationships objectively, robustly and scientifically.
Among major facility performance measurement practices are the benchmarking, balanced scorecard approach, post-occupancy evaluation and measurement through metrics of key performance indicators (KPIs) [17]. Developing performance metrics is an important step in the process of performance evaluation, as it includes relevant indicators that express the performance of the facility in a holistic manner [15,18,19,20,21,22]. Cable and Davis [15] critically assert that performance measurement using established KPIs helps the senior management team to make strategic decisions. This indicates the cause and effect between key performance indicators and high-quality service performance. The quality of FM outsourcing services can directly connect with established KPIs.
2.1.2. Measurement and Quantification of FM Outsourcing Services
The selection of measures of performance as KPIs depends on who actually uses the performance assessment (e.g., executives, managers or supervisors), the public or private nature of the organization, the assessment objectives (financial, functional, or physical) and prevailing trends in the industry [15,21,22,23,24,25]. Lavy et al. [26] list four categories of KPIs in FM such as financial, functional, physical and user satisfaction. For instance, operating, occupancy, utility and capital costs of FM outsourcing services belong to the financial category of KPIs. Building physical condition, resource consumption—energy, water, property and real estate, waste, health and safety, indoor environmental quality and security of FM outsourcing services—belong to the functional category of KPIs. Productivity and space utilization of FM outsourcing services belong to the physical category of KPIs. Customer/building occupants’ satisfaction with products or services of FM outsourcing services belongs to the user satisfaction category of KPIs. Lavy et al. [27] commented that the current assessment of facility performance measurement emphasises financial aspects such as business, organizational goals, job satisfaction, work environment, environmental issues and also other non-financial qualitative aspects in a detailed manner holistically. It is believed that FM outsourcing services can be assessed by non-financial aspects and also other financial qualitative aspects through the measurement of FM outsourcing relationships.
Non-Financial Qualitative Aspects
Mendell and Heath [28] address Indoor Environmental Quality (IEQ) of a building as a primary concern today as it reflects and influences the health and well-being of its occupants. According to Fowler et al. [29], IEQ has major impacts on occupant health and productivity and eventually could adversely influence occupants’ turnover rate, absenteeism and satisfaction. Furthermore, IEQ-related problems possess economic implications, as Prakash [30] suggests that IEQ-related problems, like sick building syndrome, other building-related illnesses and absenteeism result in increased costs. Improved IEQ performance of a facility enhances the satisfaction and productivity level of its occupants [29,30,31,32,33,34]. An enhanced IEQ not only increases productivity and reduces the financial burden; it also enhances confidence in the organization’s ability to provide a safe, comfortable and healthy atmosphere [29,30,32]. Mendell and Heath [28] conclude that the performance of students in school or non-school indoor atmospheres demonstrates a direct relationship to indoor pollutants, thermal comfort and building characteristics because of health-related problems. Bakker and Van der V. Theo [35] discover that plants can have a positive impact on the productivity of human beings. Those studies indicate that the non-financial qualitative aspects of the IEQ relate to Lavy et al.’s [26] three categories of KPIs in FM including functional, physical and user satisfaction. The issue of indoor environmental quality directly affects the quality of FM services no matter what kind of procurement is such as FM outsourcing.
Financial Aspects
Facility management (FM) provides supportive services to core businesses for companies [36], such as infrastructure maintenance, equipment repair, etc. Companies (especially large ones) that are faced with the challenge of maximizing business productivity and reducing costs are increasingly considering outsourcing their non-core activities such as FM [37]. Cui and Coenen [38] argue that FM service suppliers can add potential value in this dimension by improving employees’ productivity, increasing user satisfaction and innovating customers’ business processes in business relationships. Haugen [39] explains the client–supplier model regarding long-term gains in productivity. The client–supplier model had a greater focus on the core business of the local authorities and was anticipated to reduce the administrative and operational aspects of organisations. From the perspective of facilities management, key performance indicators of the facilities management can be used to measure the FM performance.
Lavy et al. [27] explain that the current assessment of facility performance measurement emphasises financial aspects. Clements-Croome and Kaluarachchi [40] discuss the occupant productivity measurement and how the various factors that affect it can be quantified into measurable entities. Table 1 indicates the factors affecting productivity in modern offices.

Table 1.
Factors affecting the productivity in modern offices.
There are also other factors that affect productivity: Bradley [41] proposes that the business measures that can be derived from the balanced scorecard, and are specific to real estate and workplace, are as follows: productivity (e.g., space utilisation, process speed and quality, waste levels). Productivity is generally defined as the ratio of output (produced goods and services) and input (consumed resources/corresponding offers) in the production transformation process [42,43,44].
As a result, productivity is closely linked to the available resources: this means that productivity is reduced if the resources are not used properly or if there is a lack of appropriate resources. On the other hand, productivity is strongly linked to the creation of value. This means that high productivity is obtained when adding value to the produced goods and services in the production transformation process [42].
The built environment has incontrovertible effects not only on the health, safety and productivity of building occupants, but also on the elemental systems ecology of the natural world [27]. It is widely understood that measurable and quantifiable efficiency of the built environment can affect the FM outsourcing performance. This FM outsourcing relationship model or system can be utilised not only to maintain the quality but also to improve the FM services such as energy efficiency of the clients in the built environment systematically.
2.2. Critical Measurement of Strategies for Four Outsourcing Relationships
This FM outsourcing relationship model originated from the FORT model in the IT industry because of the specific dynamic and revolutionized capability of the IT model. Therefore, this bespoke FM model can incorporate the advantages of the IT outsourcing model [2]. Figure 1 presents the FORT Framework converted from IT to the FM industry (the CORE model). The following explanations are used for the interpretation of the eight strategies for the four outsourcing relationships: OC1 (in-house), OC2 (technical expertise), OC3 (commitment) and OC4 (common goals). In the CORE model, the variable “OC” represents the outsourcing category and there are four outsourcing categories. Lok et al. [2] assessed FM providers by a ranking, one out of five from “1”, “2”, “3”, “4” to “5”, for each of the four OC’s. Then, the four OC’s are combined together into one OC based on the operation of the ANN, the rank given to each OC is manually assigned, thus not objective enough.
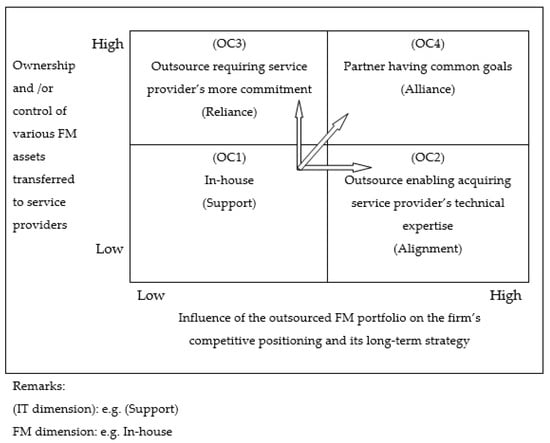
Figure 1.
The FORT Framework converted for the FM industry (The CORE model) Source: Lok et al. (2020). Reprinted with permission from ref. [2]. Copyright 2020 Lok et al.
The critical success factors for outsourcing strategies in FM contracts are highlighted in Table 2. There are two axes for the quantitative measurement of the proposed FM outsourcing strategies as X-axis and Y-axis. Accordingly, the X-axis is used for measurement of influence of the outsourced FM portfolio on client’s competitive position and long-term plan, whilst the Y-axis is used for measurement of ownership and control of various FM assets transferred to the service providers.
Table 2.
Critical success factors of ownership and control of various FM assets transferred for outsourcing strategies and critical success factors regarding the influence of outsourced FM portfolio on clients’ competitive position and long-term plan.
After investigation and analysis of those eight strategies of the FM CORE model, it is more accurate and predictable to find out the current outsourcing relationships of the FM service providers and the clients of the specific FM outsourcing contracts such as building maintenance, cleaning, security and catering. This mission was considered difficult, even though not impossible in the past as the FM outsourcing business procurement has been prevalent around the world. Now, with the advent of techniques in artificial intelligence (AI), such as the application of ANN, some improvement in the practical FM outsourcing business can be seen. Starting from learning the rules and theories of real cases, application and verification, AI can be used to enhance the accuracy, efficiency and effectiveness of the FM outsourcing business as well as other industries.
There are eight FM outsourcing strategies to be developed, i.e., Substitution of Ownership (SO1, SO2) and Substitution of Control (SC1 and SC2) on the Y-axis and Competitive Position (CP1, CP2) and Long term Plan (LP1 & LP2) on the X-axis, from the FM CORE model as proposed and verified by Lok and Baldry [45,46]. The previous studies identified and categorized in detail various measuring instruments to assess the outsourcing performance of the FM outsourcing service providers based on the FM CORE model. Under this new instrument, interviewees of FM service providers are no longer asked to give an opinion but to provide solid data and figures for the compilation of the grade of the eight strategies. Such data and figures are then converted into the five ranks of each of the four OCs with the aim of developing a comprehensive quantitative questionnaire for such process of data collection.
This will enhance the ability to critically measure the performance or productivity quantitatively or objectively by a scientific approach of the FM outsourcing performance based on the collected on-site data generated from the questionnaire surveys. Finally, the AI method that involves the application of the ANN is used for OC identification of the FM service provider. Some modifications may be required to tailor-make the system for the FM industry. The general principle is that key performance indicators are suggested to be used for the assessment and collection of the data from the identified FM interviewees for the eight FM strategies as detailed below.
According to the FM CORE model, there are two criteria for quantitative assessment, corresponding to the horizontal and vertical axes of such model. Lok et al. [47] observed and discovered the critical success factors for outsourcing strategies from the second round of the Delphi study at the sector of service providers, including co-ordination between the facilities manager and functional units on the operational level, core skills of facilities managers (e.g., innovative thinking, listening and negotiating capacities, etc.), procurement strategies (i.e., details in contract administration), measurement on performance (i.e., assessment on service providers), allocation of human resources (i.e., senior management to junior), FM practice and whole life cycle processes, cost-effectiveness (i.e., productivity), value of customers satisfaction, resource sharing among people, budget, systems, information and organization structure. The critical success factors are derived in the FM dimensions that are investigated in the Y-axis of ownership and control of FM assets and X-axis of competitive position and long-term plan. The result is presented in Table 2.
2.2.1. Explanation of the Y-Axis of the FM Contingency Outsourcing Relationship Model
(i) Ownership of various FM assets transferred to or owned by service providers
SO1: Service providers consider the availability of their own equipment or machinery for competing jobs (sustainable environmental and economic development) (listed in Table A1).
Explanation: The measurement of availability of equipment or machinery for competing jobs can be based on a list of inventory of equipment by kinds from the providers. The clients are suggested to provide the list of inventory of equipment by kind, or the providers can prepare their own list. Generally, they can be classified as handheld tools or specific facilities and equipment. The service providers can complete the prepared lists of inventory of equipment for confirmation of their daily operations.
There is a check box against each kind of equipment or instrument, and the provider ticks all those they own, which are verified by the client. The ratio of available equipment to all required can be a KPI that is a real number larger than zero but smaller than or equal to one. It would be a percentage larger than 0% but smaller than or equal to 100%. The most important class of tools is given a score of “3”, while the least important class of tools is given a score of “1”. Furthermore, a minimum ratio of availability must be met, e.g., at least one fixed telephone line per five employees. Without meeting such a minimum ratio, the score cannot be given, i.e., a score of “0” equivalent to none. Lok et al. [47] discuss this in alignment with critical success factors for outsourcing strategies of resource sharing on people, budget, systems, information, and organization structure.
SO2: Service providers can immediately help their customers if needed with professional knowledge (sustainable social development) (listed in Table A2).
Explanation: The measurement of availability of professional knowledge can be based on the number of built environment professionals by kinds from the providers. Service providers can provide professional knowledge through different professionals in the built environment such as engineers, surveyors, facilities and housing managers, etc. The developed professional knowledge identified by IFMA can be generally used and stated as the core issues of professional knowledge. Other additional tailor-made professional knowledge can also be taken as reference for the specific kind of building assets such as the different requirements of professional knowledge of service providers at supermarket stores and space centres. Again, a checklist is to be provided by the client and ticked by the provider. The number of kinds of professionals and skills available by the provider for each kind required can be a KPI. Again, this is a figure in percentage larger than 0% and smaller than or equal to 100%. The most important class of professionals is given a score of “3”, while the least a score of “1”. Again, there is a minimum ratio of availability; e.g., at least one professional building services engineer per two hundred employees of the service provider. Lok et al. [47] discuss this in alignment with the critical success factors for outsourcing strategies of core skills of facilities managers (e.g., innovative thinking, listening and negotiating capacities, etc.).
(ii) Control of various FM assets transferred to or performed by service providers
SC1: Service providers can meet the deadlines. (Sustainable economic development) (listed in Table A3).
Explanation: The measurement of the deadlines can be based on the progress of the services by the providers as core or non-core services. A literature review is needed to search for the definition and measurement of work progress. Generally, measurement of capitals and time can be considered as the variables for work progress. Further desktop study is necessary for this strategy. For example, at a particular month, there are P number of projects on hand by the service provider. For each project, if that job needs n months to finish by the provider as a norm and the provider has already finished x% in the first m months (up to the end of this particular month), the KPI may be 100% if (x/100 − m/n) >= 1 or = 100% × (x × n/(100 × m)). Such a percentage must be multiplied to a score from “1” (least important) to “3” (most important). Then, all the scores of the P projects are added together to be divided by the maximum sum of scores of that month. Lok et al. [47] discuss this in alignment with critical success factors for outsourcing strategies of procurement strategies (i.e., details in contract administration).
SC2: Service providers arrange coordination meetings regularly and can fully address concerns and questions of clients (sustainable economic development) (listed in Table A4).
Explanation: At the end of a particular month, there are P concerns of the client within that month. If the service provider can solve a particular concern, a score of 1, 2 or 3 can be given. These must be given if there is a full solution. If that concern cannot be 100% solved, the score is 0. The sum of scores of the P concerns divided by the maximum scores of all P concerns is the SC2 score of that month. Lok et al. [47] discuss this in alignment with critical success factors for outsourcing strategies of coordination between the facilities manager and functional units on the operational level.
2.2.2. Explanation of the X-Axis of the FM Contingency Outsourcing Relationship Model
(i) Influence of the outsourced FM portfolio on the client’s competitive position
CP1: Service providers can efficiently deploy their human resources for maintaining a good relationship (sustainable social development) (listed in Table A5).
Explanation: The measurement of maintaining a good relationship between the service provider and the client can be based on the daily worksheets submitted by the clients each day in a month and assessed by the clients. Every day, the client can tick to indicate satisfaction and leave the box blank to indicate dissatisfaction with every daily job order. Then, the ratio of satisfied days to the total number of days per month can be a KPI that is a figure between 0% and 100%. Lok et al. [47] discuss this in alignment with critical success factors for outsourcing strategies of allocation of human resources (i.e., senior management to junior).
CP2: Service providers can increase their customer’s general routine productivity (sustainable social, environmental and economic development) (listed in Table A6)
Explanation: The measurement of the customer’s general routine productivity can be based on, for example, the ratio of income and expenses per month of the client. In order to formulate the appropriate KPI, a literature review session is presented, and Lok et al. [47] discuss this in alignment with critical success factors for outsourcing strategies of cost-effectiveness (i.e., productivity).
(ii) Influence of the outsourced FM portfolio on client’s policy
Lok et al. [47] discuss this in alignment with critical success factors for outsourcing strategies of measurement on performance (i.e., assessment on service providers) and value of customers’ satisfaction. In the first case, the investigation is about the client within 1-year policies such as those on issues of health, safety, and maintenance and operation management. In the second case, the investigation is about the clients’ policies of more than 1 year, such as those on issues of emergency planning, business continuity and sustainability.
LP1: Service providers can support their customer’s policy on a short-term basis (sustainable social, environmental and economic development) (listed in Table A7)
Explanation: The measurement of the customer’s short-term plan can be based on the client’s short-term target in terms of a specific aspect. The target must be 100% related to the provider’s performance, and the monthly achievement of the target can be used to form the KPI.
LP2: Service providers can support their customer’s long term plan (sustainable environmental and economic development) (listed in Table A8)
Explanation: The measurement of the customer’s long-term plan can be based on the client’s long-term target in terms of a specific aspect. This can be similar to LP1, but the difference is mainly concerning the time period considered.
3. Methodological Approach
The FM Contingency Outsourcing Relationship (CORE) model can be used to quantitatively measure the current outsourcing performance of an FM service provider and to evaluate the future outsourcing plans, abilities and capacities of the service provider for specific FM contracts from the identified outsourcing relationships. The service provider is required to conduct self-examination through the assessment of the influence of the outsourced FM portfolio on the client’s competitive position and long-term plan and also on the measurement of ownership and control of various FM assets transferred to the service provider. The research method is to develop eight strategies that can quantitatively be measured to finally assign the appropriate rank to each of the four relationships. These eight strategies can be placed upon a 2-dimensional co-ordinate system with four on each axis. Lok et al. [2] have already built the model with ANN. This paper further investigates the practical and detailed application of ANN into the FM CORE model in scrutiny. According to the CORE model, an FM service provider has to determine his position in one of the four categories, namely OC1, OC2, OC3 and OC4. OC1 is at the lowest left quarter where both the X-value and the Y-value are low. OC2 is at the lowest right quarter where the X-value is high but the Y-value is low. OC3 is at the highest left quarter where the X-value is low but the Y-value is high. Finally, OC4 is at the highest right quarter where both the X-value and Y-value are high. The existing assessment method is based on the personal opinion of all interviewees [45]. The objective of this study is to quantitatively and objectively determine the X-value and Y-value of a service provider so as to determine which category this provider is in. The previous method was more subjective, while the present method tends to be more objective. The impact of this study is obvious as the previous one was fully based on personal opinion, which was very subjective. However, this paper is based on in situ measurement and evaluation, which are very objective in nature. This indicates the accuracy of the output is much higher than that of the previous study.
The methodological approach involves self-analysis through a survey using the CORE model. Currently, the sampling strategy used the computing simulation of ANN model on four OCs. In this study, there are four scenarios, namely OC1, OC2, OC3 and OC4. If real cases are investigated, the survey respondents are mainly the management grade of staff in the FM department of the property owners, facility owners, operators, owner-operators, tenants or, in some cases, managing agents acting on behalf of companies or organisations of any size. The CORE model was used to evaluate and to manage the FMs’ outsourcing relationships of the FM service providers on sustainable environmental, social and economic performance effectively and efficiently for short and long-term FM plans. The expert rules originated from CORE, and the ANN learns all the rules and then applies the rules on simulated cases in this study. For example, if real cases are investigated, ANN receives input from real on-site measurements based on the quantitative formulae suggested. Then, the whole CORE system becomes more objective and robust.
3.1. Working Mechanism of FM Contingency Outsourcing Relationship Model
Table 3 indicates how the Y-axis—Ownership substitution—and X-axis—Strategic influence of the FM outsourcing strategies—relate to the four FM outsourcing categories. The FM outsourcing strategies have high, medium or low impacts on the four FM outsourcing categories. The working mechanism of this paper is principally based on the critical mapping shown in Table 3. To combine the eight figures, each being a percentage, SO1, SO2, SC1 and SC2, of the Y axis, and CP1, CP2, LP1 and LP2 of X-axis, we need to first determine how these are related to the four OC1, OC2, OC3 and OC4, respectively. It is confirmed that the output of the ANN should be from +0.5 to +4.49 so that every OC is given a fair treatment. (There are only 4 OCs, 1, 2, 3 and 4. Outputs of ANNs are real numbers, not integers. Therefore, the output values must be equally distributed among the four OCs to be fair. Therefore, the range from 0.5 to 1.499999 belongs to OC1; the range from 1.5 to 2.49999 belongs to OC2, etc.) If the result of ANN is between +0.5 and 1.49, it is OC1; if between 1.5 and 2.49, it is OC2; if between 2.5 and 3.49, it is OC3; if between 3.5 and 4.49, it is OC4. Table 4 identifies the four outsourcing categories, including in-house, technical expertise, commitment and common goals in dimensions of relationships in FM outsourcing.
Table 3.
The mapping of Four Outsourcing Categories with the Eight FM Outsourcing strategies.
Table 4.
Four outsourcing categories, including Outsourcing category 1 (In-house), Outsourcing category 2 (Technical expertise), Outsourcing category 3 (Commitment) and Outsourcing category 4 (Common goals) in dimensions of relationships in FM outsourcing.
Measurement of Y-axis of the FM Contingency Outsourcing Relationship model
(i) Ownership of various FM assets transferred to or owned by service providers
SO1: Service providers consider the availability of their own equipment or machinery for competing jobs.
SO2: Service providers can immediately help their customers if needed with professional knowledge.
(ii) Control of various FM assets transferred to or performed by service providers
SC1: Service providers can meet the deadlines.
SC2: Service providers arrange coordination meeting(s) regularly and can fully address concerns and questions of the clients.
Measurement of X-axis of the FM Contingency Outsourcing Relationship model
(i) Influence of the outsourced FM portfolio on client’s competitive position
CP1: Service providers can efficiently deploy their human resources for maintaining a good relationship.
CP2: Service providers can increase their customer’s general routine productivity.
(ii) Influence of the outsourced FM portfolio on client’s policy
LP1: Service providers can support their customer’s short-term plan.
LP2: Service providers can support their customer’s long-term plan.
3.2. Rules for Determining Outsourcing Categories (OC) of Companies Based on Survey
Four categories were used in the surveys, namely OC1 for “In-house”, OC2 for “Technical expertise”, OC3 for “Commitment” and OC4 for “Common goals.” For every service provider under the survey, a number of key managerial personnel were selected and were requested to assign a rank to each category. There were a total of five ranks to be chosen by the respondents, from 1 to 5, the meaning of which is discussed in the rules. The set of rules to be developed could give a final category, i.e., either OC1, OC2, OC3 or OC4, based on the results of survey, as detailed below. In principle, the set of rules were mainly designed for the determination of the FM outsourcing categories of companies based on the work of Lok et al. [2] However, some revisions were recorded as below; the revised rules are shown as follows:
- (1)
- The magnitude of stability of four outsourcing categories is naturally as follows: OC1 < OC2 < OC3 < OC4. This is the measurement of the extent or particular degree to which the locked-in relationship of the specific OC is. The magnitudes of the dynamics of the four outsourcing categories is naturally as follows: OC1 > OC2 > OC3 > OC4. This is the measurement of the extent or particular degree to which the mobile relationship of the specific OC is. The level of OC3 and OC4 is superior to that of OC1 and OC2.
- (2)
- The stability of OC1 is the smallest, while the stability of OC4 is the largest. The stability of outsourcing categories is measured by the relationship between dimensions of substitution of ownership and control of service providers and also the strategic impact of the outsourced services on competitive position and long-term plan. Stability is the locked-in relationship of the specific OC.
- (3)
- The rank of 1 as “very unsatisfactory” and 2 as “unsatisfactory” are insignificant for determination. However, those combinations are still considered applicable.
- (4)
- The rank of 3 as “neutral”, 4 as “satisfactory” and 5 as “very satisfactory” are significant for determination, and they are included in the assignment of category and the ANN training.
- (5)
- The final designated OC(s) is (are) chosen when the rank of each of them is at least one of the five ranks, i.e., 1 or 2 or 3 or 4 or 5.
- (6)
- The final OC is determined to be OC1 = “In-house” if the rank of OC1 is 1 or 2 or 3 or 4 or 5 and is equal to or larger than the ranks of OC2, OC3 and OC4, or if the ranks of OC2, OC3 and OC4 are smaller than 3 or equal to 3.
- (7)
- The final OC is determined to be OC2 = “Technical expertise” if the rank of OC2 is 2 or 3 or 4 or 5 and is larger than the ranks of OC1, OC3 and OC4, or if the ranks of OC1, OC3 and OC4 are smaller than 3 or equal to 3.
- (8)
- The final OC is determined to be OC3 = “Commitment” if the rank of OC3 is 2 or 3 or 4 or 5 and is larger than the ranks of OC1, OC2 and OC4 or if the ranks of OC1, OC2 and OC4 are smaller than 3 or equal to 3.
- (9)
- The final OC is determined to be OC4 = “Common goals” if the rank of OC4 is 2 or 3 or 4 or 5 and is larger than the ranks of OC1, OC2 and OC3 or if the ranks of OC1, OC2 and OC3 are smaller than 3 or equal to 3.
3.3. Linking Facilities Management Outsourcing Strategies to Sustainable Key Performance Indicators
Outsourcing has become so common that facility managers use the most advanced contracting methods and truly optimize outsource service providers. Both sustainability and security/emergency management have gained such an organizational tailwind that, if managed properly, they will be at the forefront of all facility managers’ practices [48]. This section explains sustainable development in terms of facilities management in the context of this research and why this may be related to the facilities management outsourcing services.
Olawumi and Chan [49] addressed the recent studies in sustainability research, focusing mainly on various subject categories such as green and sustainable technology and construction and building technology. They observed that the emerging research and global trends in sustainability research are in the areas of sustainable urban development, sustainability indicators, environmental assessment and public policy, etc.
This research focuses on the facilities management outsourcing services such as building maintenance, cleaning, security and catering. These FM outsourcing services are not only the main contract types that are outsourced by various building assets around the world, but they also impact (or are impacted by) sustainable development objectives. With the possible exception of security, each of them fits into environmental, social and economic strands of sustainable development.
This study explains the three sustainable development strands relevant to the built environment and FM [49]. The following are the definitions of each strand of sustainable development; environmental aspects confine human activity within the carrying capacity of the ecosystem (such as materials, energy, land and water) prevailing in the locality and places emphasis on the quality of human life (air quality, human health). Economic aspects consider efficient use of resources to enhance operational profit and maximise market value. Furthermore, they deal with substituting natural for manmade resources, reusing and recycling. Social aspects focus on social wellbeing of the populace, balancing the needs of individuals with the needs of the group (equity), public awareness and cohesion, and participation and utilisation of local labour and firms.
According to Table 5, the key performance factors are derived in the Y-axis of FM Contingency Outsourcing Relationship model through an investigation into the ownership and control of FM assets for outsourcing strategies. According to Table 6, the key performance factors are derived in the X-axis of FM Contingency Outsourcing Relationship model that is connected with competitive position and policy for outsourcing strategies. Both tables categorise the key performance factors in terms of each of the environmental, social and economic strands. The key performance factors regarding four FM outsourcing relationships’ dimensions, such as ownership of various FM assets, control of various FM assets, outsourced FM portfolio on clients’ competitive position and outsourced FM portfolio on clients’ policy for outsourcing strategies, can be related to the three dimensions of sustainable development.
Table 5.
Sustainable key performance factors of ownership and control of various FM assets transferred to or owned by service providers for outsourcing strategies of the FM Contingency Outsourcing Relationship model.
Table 6.
Sustainable key performance factors of influence of the outsourced FM portfolio on client’s competitive position and client’s policy for outsourcing strategies of the FM Contingency Outsourcing Relationship model.
4. Analysis of Results
4.1. The ANN for Outsourcing Categorization and Generation of Final OC
Lok et al. [2] address the pilot practical use of Artificial Neural Network into the Facilities Management Contingency Outsourcing Relationships model (CORE) theoretically. Without a doubt, the application of neural networks (artificial intelligence) in this study is concerned with the analysis of very large data volumes. The ANN ensures the inflow of such data. The whole ANN structure was previously discussed in detail in [2], regarding how to use the ANN with more quantitative input.
After further thorough investigation, this paper discusses an application of ANN to the CORE through a detailed mathematical mechanism by using the bespoke formulae and raw quantitative data. Once all the tables of the eight FM outsourcing strategies described above have been filled in, eight values, all capped with a range (0%, 100%), including SO1, SO2, SC1, SC2, CP1, CP2, LP1 and LP2, are available. These eight values are further converted into four values of outsourcing categories, also within the (0%, 100%) with reference to the mapping Table 3, according to the following four equations based on The Cobb–Douglas Production Function [50] where the indices of high = 3, that of med = 2 and that of low = 1.
Regarding the Cobb-Douglas function, So et al. [51] applied it to the computation of the Intelligent Building Index (IBI) for the Asian Institute of Intelligent Buildings. In economics and econometrics, the Cobb–Douglas production function is a special functional form of the production function, widely used to represent the technological relationship between the amounts of two or more inputs (particularly physical capital and labour) and the amount of output that can be produced by those inputs. The Cobb–Douglas form was developed and tested against statistical evidence by Charles Cobb and Paul Douglas during 1927–1947. These four values of outsourcing categories are fed into the well-trained ANN as discussed in Lok et al. [2]. The structure of the ANN is shown in Figure 2, where there are four inputs, 55 hidden nodes and one output, i.e., the value of OC.
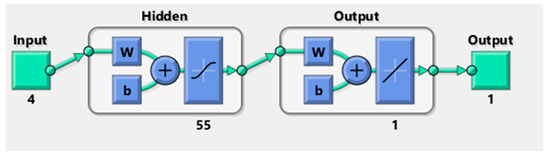
Figure 2.
Structure of the ANN.
Since each input is from 0%+ to 100%, it is converted to a range of [0.5, 5.5] by dividing the raw value of each outsourcing category by 20 and then adding 0.5 to the result. Moreover, the output is confined within the range [0.5, 4.5] during the learning process. Then, the final output is determined by the following formula.
4.2. Application of the ANN to the Facilities Management Contingency Outsourcing Relationships Model
This part is to simulate the four outsourcing examples for the categories OC1, OC2, OC3 and OC4 respectively with clear explanation of the framework. Table 7 summarises the result of ANN output of the OC1, OC2, OC3 and OC4 respectively.
Table 7.
Result of ANN Output of the OC1, OC2, OC3 and OC4.
4.2.1. Explanation of Example 1 on Application of Outsourcing Category 1 (OC1)
The relationship between the client and service provider belongs to the Outsourcing Category 1 (OC1) as an in-house group. In order to achieve this group, the impacts of SO1 of the Y-axis (Ownership Substitution) of FM Outsourcing strategies should be quite high. The service providers can provide at least sufficient or even a higher standard of mutually agreed equipment for confirmation of daily operations to the clients’ requirements. The impacts of CP1 of the X-axis (Strategic Influence) of FM Outsourcing strategies should also be quite high. The service providers can maintain good relationships with the clients on each day, e.g., diligent work, professional manner, warm hospitality, close co-ordination and understanding the needs of customers. Simply speaking, (OC1) in-house group works as the mechanism of support from the service provider to the client [2].
4.2.2. Explanation of Example 2 on Application of Outsourcing Category 2 (OC2)
The relationship between the client and service provider belongs to the Outsourcing Category 2 (OC2) as the service provider’s technical expertise group. In order to achieve this group, the impacts of SO2 of the Y-axis (Ownership Substitution) of FM Outsourcing strategies should be quite high. The service providers can provide at least sufficient or even higher standards of tailor-made professional knowledge for the building assets. Again, this list is an example, which must be mutually agreed upon between the client and the service provider for the confirmation of daily operations to the clients’ requirements. The impacts of CP2 of the X-axis (Strategic Influence) of FM Outsourcing strategies should also be quite high. The service providers can maintain a high level of customer’s general routine productivity on a high level for monthly operations, including security management, waste management, cleanliness of the workplace and indoor environmental quality. Simply speaking, (OC2) service providers’ technical expertise group works as the mechanism of support from the service provider to the client [2].
4.2.3. Explanation of Example 3 on Application of Outsourcing Category 3 (OC3)
The relationship between the client and service provider belongs to the Outsourcing Category 3 (OC3) as service provider’s commitment group. In order to achieve this group, the impacts of SC1 and SC2 of the Y-axis (Ownership substitution) of FM Outsourcing strategies should be quite high. The service providers can provide at least sufficient or even a higher standard of mutually agreed working timeframe for work orders and progress of concern for confirmation of monthly operations to the clients’ requirement. The impacts of CP1 of the X-axis (Strategic Influence) of FM Outsourcing strategies should be quite high. The service providers can maintain good relationships with the clients each day, e.g., diligent work, professional manner, warm hospitality, close co-ordination and understanding the needs of customers. In addition, the impacts of LP1 of the X-axis (Strategic Influence) of FM Outsourcing strategies should also be quite high. Service providers can maintain monthly performance and value of customers’ satisfaction with respect to health, safety, and maintenance and operation management. Simply speaking, (OC3) as a service provider’s commitment group works as the mechanism of support from the service provider to the client [2].
4.2.4. Explanation of Example 4 on Application of Outsourcing Category 4 (OC4)
The relationship between the client and service provider belongs to the Outsourcing Category 4 (OC4) as the partner group. In order to achieve this group, the impacts of SC1 and SC2 of the Y-axis (Ownership substitution) of FM Outsourcing strategies should be as high as that of Outsourcing Category 3 (OC3). In addition, the impacts of LP1 of X axis (Strategic Influence) of FM Outsourcing strategies should also be as high as that of Outsourcing Category 3 (OC3). The impacts of LP2 of the X-axis (Strategic Influence) of FM Outsourcing strategies should also be quite high. The service providers can maintain yearly performance and value of customers’ satisfaction on emergency planning, business continuity and sustainability. Simply speaking, the (OC4) partner group works as the mechanism of support from the service provider to the client [2].
In summary, OC1 (in-house) has a high impact on (SO1) hard FM—the challenge of flexible facilities and (CP1) competitive advantage. OC2 (Technical expertise) has a high impact on (SO2) soft FM—the challenge of flexible relationships in service provision and (CP2) value points for leveraging FM portfolio and business process improvement. OC3 (Commitment) has a high impact on (SC1 and SC2) managerial control and decision making over operations, planning, development and implementation of facilities and personnel replacement in-house FM personnel, (CP1) competitive advantage and (LP1) competitiveness. OC4 (Common goals) also has a high impact on (SC1 and SC2) and (LP1 and LP2) long-term competitiveness, a close partnership, strategic inter-organizational relationship and new revenue.
5. Discussion
The COVID-19 pandemic has truly made the world a smaller place, where global citizens need to combat its many unwanted effects together. For FM and PM professionals working at the frontline of the built environment, all these effects have far-reaching consequences for people required to manage the various risks daily, which is hard enough by itself. However, it is also expected from us to learn and use our previous and current experiences to better prepare for new and future crises.
Understanding a rapidly changing context and its effects on FM is becoming increasingly important, forcing the FM industry to evolve far beyond the existing trusted FM models. This change that is forced upon us can be perceived as a “risk” to the traditional FM professional. Risk is a dual concept and can imply both a threat as well as an opportunity within the same reality. As many successful entrepreneurs can vouch for, it is all about context and timing, hence the need to manage risk professionally. Keeping this new insight in mind, this means that if the FM professionals are to prepare for a better future, managing risk implies focusing on yet-unseen opportunities and on constantly evolving FM-organizations, FM-businesses, FM-departments and FM-professionals. This answers the “Why” in FM related risk management, which automatically brings us to the “What” and subsequent “HOW” questions of achieving sustainable FM.
5.1. Operational Mechanism of the ANN CORE Model
This part summarizes the operational mechanism of the ANN FM CORE model. Generally, there are seven steps to operate the FM CORE model and to achieve the final outsourcing category in the quantitative approach intelligently and objectively.
Firstly, the FM strategists in the clients are required to understand basic concepts of the eight FM outsourcing strategies in the X-axis and Y-axis of the FM CORE model.
Secondly, the FM strategists in the clients are required to evaluate their FM assets, both hardware and software, with reference to descriptions and guidelines set on each FM outsourcing strategy holistically.
Thirdly, FM strategists in the clients are individually required to complete all the blank forms of data collection for the Y-axis of the FM CORE model without support from an external agent. The items are summarized in four tables (Appendix A, Appendix B, Appendix C and Appendix D).
Fourthly, FM strategists in the clients are individually required to complete all the blank forms of data collection for the X-axis of the FM CORE model without support from an external agent. The items are summarized in ten Tables (Appendix E, Appendix F, Appendix G and Appendix H).
Fifthly, the strategists’ FM CORE model can evaluate, calculate and find out the expected corresponding outsourcing category, i.e., OC1, OC2, OC3 or OC4, from the ANN for the clients as a reference for the FM procurements, such as building maintenance, security, cleaning and catering services according to the above 14 tables.
Sixthly, FM strategists in the clients can have a clear and full picture of their own specific FM services regarding the outsourcing relationships with their service providers from the identified outsourcing category.
Finally, FM strategists in the clients are able to improve their own daily operation efficiently and effectively through revising and updating the impact of their own FM outsourcing strategies on environmental, economic and social strands of sustainable development with reference to the ANN FM CORE model.
5.2. Method of Accomplishment of the Working Tables of ANN FM Contingency Outsourcing Relationship Model
Regarding the achievement of the ANN FM CORE model, it is necessary to complete the 14 tables for the data analysis. In the Y-axis of the FM CORE model, there are four tables. In the X-axis of the FM CORE model, there are 10 tables. This part is subjective in nature, but assessment methods generally have the same limitation. Provided that all rules from the CORE model are fairly applied to all situations, this is appropriate. The method statements are not related to ANN computation. The method statement is recorded as below steps.
5.2.1. Measurement of Y-Axis of the FM Contingency Outsourcing Relationship Model
(i) Ownership of various FM assets transferred to or owned by service providers
SO1: Service providers consider the availability of their own equipment or machinery for competing jobs (listed in Table A1, one table).
Method Statement: The client’s evaluator is requested to fill in the data in the list of inventory of equipment for confirmation of daily operations by service providers. This list must be mutually agreed upon with the service provider of the number of people in the company, the number of equipment(s) provision on-site and the actual mark for the importance of equipment(s) with reference to the minimum qualified ratio per person.
SO2: Service providers can immediately help their customers if needed with professional knowledge (listed in Table A2, one table).
Method Statement: The client’s evaluator is requested to fill in the data in the list of tailor-made professional knowledge for the building assets by service providers. This list must be mutually agreed with the service provider of number of people in the company, number of professional(s) provision on-site and the actual mark for the importance of professional knowledge and skills with reference to the minimum qualified ratio per person.
(ii) Control of various FM assets transferred to or performed by service providers
SC1: Service providers can meet the deadlines (listed in Table A3, one table).
Method Statement: The client’s evaluator is requested to fill in the data in the list of measurement of working timeframe for work orders by service providers. According to the number of work orders in that month, the client’s evaluator is requested to find out the key performance indicators (KPIs) such as weight of that order or marks for current work orders, the whole period of work order in the month(s), and scheduled and actual progress of work orders (%) until now.
SC2: Service providers arrange coordination meeting(s) regularly and can fully address concerns and questions of the clients (listed in Table A4, one table).
Method Statement: The client’s evaluator is requested to fill in the data in the list of reports of progress of concern by service providers per month. According to the number of concerns in that month, the client’s evaluator is requested to find out the key performance indicator (KPI) such as importance of concern and problem solving.
5.2.2. Measurement of X-Axis of the FM Contingency Outsourcing Relationship Model
(i) Influence of the outsourced FM portfolio on the client’s competitive position
CP1: Service providers can efficiently deploy their human resources for maintaining good relationships (listed in Table A5, one table).
Method Statement: The client’s evaluator is requested to fill in the data in the list of measurements of maintaining good relationships for daily operations by service providers per month. According to the weighting of the daily satisfaction in that month, the client’s evaluator is requested to find out the key performance indicator (KPI) such as maintaining good relationships on each day such as diligent work, professional manner, warm hospitality, close co-ordination and understanding the needs of customers.
CP2: Service providers can increase their customer’s general routine productivity (listed in Table A6, four tables).
Method Statement: The client’s evaluator is requested to fill in the data in the list of measurements of the customer’s general routine productivity for monthly operations by service providers. According to the operational factors affecting productivity in that month, the client’s evaluator is requested to find out the key performance indicators (KPIs) such as security management by completion of records of daily logbook, waste management by measurement of levels of garbage in rubbish bins of common area and staff office environment, cleanliness of the workplace by 1/5000 square feet of office environment and washrooms with reference to standards of a professional cleaner and indoor environmental quality by temperature 23.5 °C plus or minus 2 °C; humidity 75% or below; carbon dioxide concentration 600 ppm or below to be measured once per day.
(ii) Influence of the outsourced FM portfolio on client’s policy
LP1: Service providers can support their customer’s short-term plan (listed in Table A7, three tables).
Method Statement: The client’s evaluator is requested to fill in the data in the list of measurements of the customer’s short-term plan (within 1 year) by service providers. According to the customer’s short-term plan on the monthly achievement, the client’s evaluator is requested to find out the key performance indicator (KPI) such as measurement of performance (i.e., assessment of service providers) and value of customers satisfaction on health by the number of sick leaves of office staff, safety by the number of accidents of office staffs of internal assessment per 90 staff per month, and maintenance and operation management by one random check within 5000 square feet of the office environment with reference to the standard of maintenance (e.g., lighting, photocopier, fire services sprinklers, air ventilation, etc.).
LP2: Service providers can support their customer’s long-term plan (listed in Table A8, two tables).
Method Statement: The client’s evaluator is requested to fill in the data in the list of measurements of the customer’s long-term plan (more than 1 year) by service providers. According to the customer’s long-term plan on the yearly achievement, the client’s evaluator is requested to find out the key performance indicator (KPI) such as the measurement of performance (i.e., assessment of service providers) and value of customers’ satisfaction by emergency planning (internal assessment per year)—e.g., (i) updated arrangement displayed on notice board regularly, i.e., announcement of arrangement of fire drills, etc.; (ii) installation of updated fire services equipment, i.e., various types of valid fire extinguishers, etc.—business continuity and sustainability (internal assessment per year)—e.g., (i) arrangement of intensive cleaning, i.e., on carpets, lighting system and air conditioning systems in office areas, etc., and (ii) application of full sterilization i.e., of the washrooms, etc.
After data manipulation and consolidation, ANN can objectively supplement the FM strategist to decide the outsourcing category from the CORE model to explain the existing outsourcing relationships between the clients and service providers. The FM strategists can use this result as a reference tool for self-assessment and evaluation. Different outsourcing categories have different outsourcing strengths and weaknesses. Regarding the expected future FM services, the FM strategists can improve their own FM services by revision of the FM strategies accordingly. This is in alignment with the general principle of “Plan, DO, Check and ACT”.
6. Conclusions
The significance of the decision of the outsourcing category of the FM outsourcing contracts is to continuously improve and to enhance the FM outsourcing services provided by the FM service providers.
The ground theory originates from the Contingency Outsourcing Relationships Model (CORE), which is to identify only four FM outsourcing relationships between the clients and service providers. The application of the artificial intelligence technique ANN to the CORE model can use a quantitative approach to measure and calculate the outsourcing category of the FM outsourcing services. This paper has successfully recorded and presented how the outsourcing category of the FM outsourcing services can be identified by the quantitative measurement through completion of data calculation and analysis. The identification of an outsourcing category in the four relationships is through the analysis of two axes in environmental, economic and social dimensions of sustainability. The X-axis is used for the measurement of the influence of the outsourced FM portfolio on the client’s competitive position and policy, whilst the Y-axis is used for measurement of ownership and control of various FM assets transferred to service providers.
This study has simulated the four-outsourcing framework for the categories OC1, OC2, OC3 and OC4 respectively. Appendix I includes all raw data used to arrive at the four outsourcing categories inputs from OC1 to OC4. Regarding the details of simulation of specific outsourcing category, Appendix J indicates the details of simulation of outsourcing category 1 as an example. Finally, the clients can clearly identify the FM outsourcing relationships with the corresponding FM service providers for further improvement and enhancement of the FM outsourcing services through the implementation of the appropriate FM outsourcing strategies.
The main contribution of this paper is the quantitative and objective input of parameters of the testing firm. This implies that the facility owners can reference this CORE model to systematically and effectively measure and record their outsourced facility goods and services under guiding rules. It can generate a big database for analysis and evaluation. However, the limitation of using ANN as a research method is that the input of parameters was based on personal opinion, which could be subjective. ANN helps to gather all expert advice provided in the form of rules and then interprets input from companies to calculate the final OC value. Since the expert advice provided is not very linear, the involvement of ANN can only improve the evaluation, which should work better than what would be done by humans manually. The ANN is merely a summary of rules; it cannot invent anything new. Facility owners are also required to spend extra efforts and resources to identify the existing outsourced facility goods and services through the input, and this constitutes more time required before implementation. However, the contribution of the study is that the productivity of the facility owners can be increased and cost of the FM contracts can be reduced by application on the mechanical and systematic mechanism. The facility owners can refer to the research results for designing the short-, medium- and long-term FM outsourcing strategies with the service providers. The owners cannot only more effectively evaluate the performance of current service providers but also more accurately select the appropriate providers for their FM services.
In addition, the current data in this research are generated from computing simulation but not from real-life practical cases. The credibility of the proposed study should be increased if samples from real-life cases can be obtained from practitioners and more structured interviews can be undertaken with FM experts. This study also does not investigate the financial elements of the FM outsourcing contracts, as it is difficult to collect the highly confidential and sensitive financial data of the FM outsourcing contracts. The future direction of the study focuses on the investigation of real-life practical cases for further strengthening and validating the FM CORE model.
Author Contributions
Conceptualization, K.L.L.; Data curation, K.L.L. and A.S.; Formal analysis, K.L.L. and A.S.; Funding acquisition, C.C.; Investigation, K.L.L., A.S. and A.O.; Methodology, K.L.L. and A.S.; Project administration, K.L.L. and C.C.; Resources, C.C.; Validation, K.L.L.and A.S.; Visualization, A.O. and C.C.; Writing—original draft, K.L.L. and A.S.; Writing—review & editing, A.O. and C.C. All authors have read and agreed to the published version of the manuscript.
Funding
This research received no external funding.
Institutional Review Board Statement
Not applicable.
Informed Consent Statement
Not applicable.
Data Availability Statement
The data are self generated by the computer simulation.
Conflicts of Interest
The authors declare no conflict of interest.
Appendix A
Explanation of the Y-axis of the FM Contingency Outsourcing Relationship model
(i) Ownership of various FM assets transferred to service providers
SO1: Service providers consider the availability of their own equipment or machinery for competing jobs.
Table A1.
Lists of inventory of equipment for confirmation of daily operations by service providers. This list is only an illustration, which should be mutually agreed upon between the service provider and the client.
Table A1.
Lists of inventory of equipment for confirmation of daily operations by service providers. This list is only an illustration, which should be mutually agreed upon between the service provider and the client.
| Equipment/Office | Key Performance Indicator (KPI) | ||||
|---|---|---|---|---|---|
| Possible Marks for Each Piece of Equipment | Number of People in the Company | Number of Equipment(s) Provision On-Site | Actual Mark MSO1(i) | Remark: Minimum Qualified Ratio per Person | |
| Photocopier | 3 | 3 or 0 | 1/30 | ||
| Computer(s) | 3 | 1/2 | |||
| Fixed line Telephone(s) | 2 | 2 or 0 | 1/5 | ||
| Mobile | 3 | 2/5 | |||
| Internet equipment | 3 | 1/1 | |||
| Desktop lamp(s) | 1 | 1/1 | |||
| Stationeries | 1 | 1/1 | |||
| Extension cable of electrical adaptors | 2 | 1/2 | |||
| Scanner | 1 | 1/30 | |||
| LCD Monitor in conference room | 3 | 1/100 | |||
| Projector in conference room | 1 | 1/100 | |||
| Daily Operation | |||||
| Safety personal equipment | 3 | 1/2 | |||
| Laser pointer | 1 | 1/5 | |||
| Walkie-Talkie(s) | 3 | 1/1 | |||
| Universal electrical adaptors | 2 | 1/2 | |||
| Digital camera | 1 | 1/4 | |||
| Hand-held tools | 3 | 1/4 | |||
| Screw driver(s) | 3 | 1/4 | |||
| Electricity check meter(s) | 3 | 1/4 | |||
| Steel rod | 2 | 1/4 | |||
| Hammer | 2 | 1/4 | |||
| Nails | 3 | 1/4 | |||
| Plumbing fixing tool | 3 | 1/4 | |||
| Electrical saw | 3 | 1/4 | |||
| Total NSO1 items | MSO1P | ||||
Mathematical Equation: . Remark: MSO1P is the sum of the first column, while MSO1T is the final mark of SO1. NSO1 is the total number of items considered in the table. Variables in other tables are defined similarly. Marks for the importance of equipment(s) are defined as follows: High importance as 3 marks; Medium importance as 2 marks; Low importance as 1 mark.
Appendix B
SO2: Service providers can immediately help their customers if needed with professional knowledge. Here, professionals mean anybody with a license or a professional membership.
Table A2.
Lists of tailor-made professional knowledge for the building assets by service providers. Again, this list is an example, which must be mutually agreed upon between the client and the service provider.
Table A2.
Lists of tailor-made professional knowledge for the building assets by service providers. Again, this list is an example, which must be mutually agreed upon between the client and the service provider.
| Key Performance Indicator (KPI) | |||||
|---|---|---|---|---|---|
| Professional Knowledge and Skills | Possible Marks for Each Professional Knowledge and Skills | Number of People in the Company | Number of Professional(s) Provision on-Site | Actual Mark MSO2(i) | Remark: Minimum Qualified Ratio per Person |
| Technical professionals | |||||
| Information technology | 2 | 1/200 | |||
| Building services engineering | 3 | 1/200 | |||
| Facilities manager | 3 | 1/200 | |||
| Housing manager | 2 | 1/200 | |||
| Maintenance manager | 3 | 1/200 | |||
| Environment and sustainability | 3 | 1/200 | |||
| Administrative professionals | |||||
| Quality assurance | 3 | 1/200 | |||
| Human resources | 2 | 1/200 | |||
| Financial and business | 3 | 1/200 | |||
| Emergency preparedness | 2 | 1/200 | |||
| Strategic planning | 3 | 1/200 | |||
| Total NSO2 items | MSO2P | ||||
Mathematical Equation: . Remark: Marks for importance of Professional knowledge and skills (High importance as 3 marks; Medium importance as 2 marks; Low importance as 1 mark).
Appendix C
(ii) Control of various FM assets transferred to service providers
SC1: Service providers can meet the deadlines.
Table A3.
Lists of measurement of working timeframe for work orders by service providers.
Table A3.
Lists of measurement of working timeframe for work orders by service providers.
| Key Performance Indicator (KPI) | |||||
|---|---|---|---|---|---|
| Number of Work Orders in That Month (Pls. Input the Required Number) | Weight of That Order as 1, 2 or 3 (Most Important), wSC1(i) | Whole Period of Work Order in Month(s) | Scheduled Progress of Work Orders (%) on Now, ψ(i) | Actual Progress of Work Orders (%) on Now ρ(i) | Mark of Each Order out of 100% ρ(i)/ψ(i) Capped to “1” but Larger Than or Equal to 0.01 |
| 1 | |||||
| 5 | |||||
| Total NSC1 orders | |||||
Mathematical Equation: Cobb-Douglas Function . Remark: Marks for current work orders as below (High importance as 3 marks; Medium importance as 2 marks; Low importance as 1 mark).
Appendix D
SC2: Service providers arrange coordination meeting(s) regularly.
Table A4.
Lists of report of progress of concern by service providers per month.
Table A4.
Lists of report of progress of concern by service providers per month.
| Key Performance Indicator (KPI) | ||
|---|---|---|
| Number of Concern (Pls. Input the Required Number) | Weight of Concern as 1, 2 or 3 (Most Important); wSC2(i) | Marks to be Given, ψSC2(i), 1 Mark for Not Solved, 50 Marks for Partially Solved, 100 Marks for Fully Solved |
| 1 | ||
| 4 | ||
| TotalNSC2 orders | ||
Mathematical Equation: . Remark: Weight of concern as below (High importance as 3 marks; Medium importance as 2 marks; Low importance as 1 mark).
Appendix E
Explanation of the X-axis of the FM Contingency Outsourcing Relationship model
(i) Influence of the outsourced FM portfolio on the client’s competitive position
CP1: Service providers can efficiently deploy their human resources for maintaining a good relationship.
Table A5.
Lists of measurement of the maintaining good relationships for daily operations by service providers.
Table A5.
Lists of measurement of the maintaining good relationships for daily operations by service providers.
| Key Performance Indicator (KPI) | |||||
|---|---|---|---|---|---|
| Maintaining Good Relationships on Each Day e.g., Diligent Work, Professional Manner, Warm Hospitality, Close Co-Ordination and Understand the Needs of Customers (Indicated by “√” in the Below Blanket), ψCP1(i), Either “1”, “2”, “3”, “4” or “5”, “1” the Poorest; “5” the Best | |||||
| Day | 1 | 2 | 3 | 4 | 5 |
| 1–31 | |||||
| Total NCP1 days | |||||
Mathematical Equation: . Remarks: Most Satisfactory = “5”; Satisfactory = “4”; Neutral = “3”; Dissatisfactory = “2”; Most Dissatisfactory = “1”.
Appendix F
CP2: Service providers can increase their customer’s general routine productivity.
Table A6.
Lists of measurement of the customer’s general routine productivity for monthly operations by service providers.
| Key Performance Indicator (KPI)—1 | ||
|---|---|---|
| Operational Factors That Affect Productivity—Security Management e.g., Completion of Records of Daily Logbook (Indicated by “√” in the Below Blanket), ψCP2,1(i) | ||
| Day | Patrolling Point(s) | |
| Missing | Recording all | |
| 1–31 | ||
| Total NCP2 days | ||
Remarks: Missing patrolling point (s)—0; Recording all patrolling points—1.
| Key Performance Indicator (KPI)—2 | ||||
|---|---|---|---|---|
| Operational Factors That Affect Productivity—Waste Management e.g., Measurement of Levels of Garbage in Rubbish Bins of Common Area and Staff Office Environment; (Indicated by “√” in the Below Blanket), ψCP2,2(i) | ||||
| Before Lunch Hour | After Lunch Hour | |||
| Day | Unchanged or Higher Level of Rubbish | Lower Level of Rubbish | Unchanged or Higher Level of Rubbish | Lower Level of Rubbish |
| 1–22 | ||||
| Total CP2 days | ||||
Remarks: Unchanged or higher level of rubbish—0; Lower level of rubbish—1.
| Key Performance Indicator (KPI)—3 | ||||
|---|---|---|---|---|
| Operational Factors That Affect Productivity—Cleanliness of Workplace e.g., 1/5000 Square Feet of Office Environment and Washrooms with Reference to Standard of Professional Cleaner; (Indicated by “√” in the Below Blanket), ψCP2,3(i) | ||||
| Office Environment | Washrooms | |||
| Day | Not Meeting Standard | Meeting Standard | Not Meeting Standard | Meeting Standard |
| 1–22 | ||||
| Total NCP2 days | ||||
Remarks: Not meeting standard—0; Meeting standard—1.
| Key Performance Indicator (KPI)—4 | ||
|---|---|---|
| Operational Factors That Affect Productivity—Indoor Environmental Quality e.g., Temperature 23.5 °C Plus or Minus 2 °C; Humidity 75% or Below; Carbon Dioxide Concentration 600 ppm or Below to be Measured Once per Day, Minimum per Month = “1” (Indicated by “√” in the Below Blanket), ψCP2,4(i) | ||
| Indoor Office Environment | ||
| Day | All Complied | Not Complied |
| 1–22 | ||
| Total NCP2 days | ||
Mathematical Equation: . Remarks: wCP2,z, for the zth feature (z = 1, 2, 3 or 4) in either 1, 2 or 3. All complied—1; None complied—0.
Appendix G
LP1: Service providers can support their customers’ short-term plans.
Table A7.
List of measurement of the customer’s short-term plan (Within 1 year) by service providers.
| Key Performance Indicator (KPI)—1 | ||
|---|---|---|
| Customer’s Short-Term Plan on the Monthly Achievement: Measurement on Performance (i.e., Assessment on Service Providers) and Value of Customers Satisfaction—Health e.g., Number of Sick Leaves of Office Staff of Internal Assessment per 90 (n) Staff per Month (Indicated by “√” in the Below Blanket). If There Are 120 Staff, Use 4 Sick Leaves per Month and by Pro Rata. ψLP1,1(i) for the ith Month, Either 1 or 0, Total Must Be Capped to at Least 1. | ||
| Month | Sick leave | |
| Below int(3 * n/90) Sick Leave (Man-Time) per Month | int(3 * n/90) or More Sick Leave (Man-Time) per Month | |
| 1–12 | 1 | 0 |
| Total NLP1 moths in the year = LP1(1) with w1= 1 | ||
Mathematical Equation: Remarks: 3 or more than 3 sick leaves (man-time) either at home or in hospital per month—0; Below 3 sick leaves per month—1; The definition of sick leave here is based on the person.
| Key Performance Indicator (KPI)—2 | ||||
|---|---|---|---|---|
| Customer’s Short-Term Plan on the Monthly Achievement: Measurement on Performance (i.e., Assessment of Service Providers) and Value of Customers Satisfaction—Safety; e.g., Number of Accidents of Office Staff of Internal Assessment per 90 (n) Staff per Month (Indicated by “√” in the Below Blanket) ψLP1,2(i) for the ith Day, Either 1 or 0, Total Must Be Capped to at Least 1 | ||||
| Month | Minor Degree of Injury (Staying at Home) | Serious Degree of Injury (Staying at Hospital) | ||
| Below Int(3 × N/90) Man-Accident per Month | int(3 × n/90) or More Man-Accident per Month | Below int(2 × n/90) Man-Accident per Month | int(2 × n/90) or More Man-Accident per Month | |
| 1 (at home score ^ hospital score)–12 | 1 | 0 | 1 | 0 |
| Total NLP1 month in the year, Score = LP1(2) with weight w2 = 1 | ||||
Mathematical Equation Remarks: Int(2 or 3 * n/90) or more man-accident per month—0; Below int(2 or 3 * n/90) man-accident per month—1.
| Key Performance Indicator (KPI)—3 | ||
|---|---|---|
| Customer’s Short-Term Plan on the Monthly Achievement: Measurement on Performance (i.e., Assessment on service Providers) and Value of Customers Satisfaction—Maintenance & Operation Management; e.g., 1 Random Checking within 5000 Square Feet of Office Environment with Reference to Standard of Maintenance; (e.g Lighting, Photocopier, Fire Services Sprinklers, Air Ventilation, etc.) (Indicated by “√” in the Below Blanket) ψlp1,3(i) for the ith Month, Either 1 or 0, Total Must Be Capped to at Least 1. If 20,000 sq ft, Take 4 Random Checks. All workable = 1. | ||
| Month | Indoor Office Environment Maintenance & Operation Management | |
| Not Workable | All Workable | |
| 1–12 | 0 | 1 |
| Total NLP1 months in the year, Score = LP1(3) with weight w3 = 3. | ||
Mathematical Equation: . LP1 total score = Remarks: Not workable—0; Workable—1.
Appendix H
LP2: Service providers can support their customer’s long-term plan.
Table A8.
List of measurement of the customer’s long-term plan (More than 1 year) by service providers.
| Key Performance Indicator (KPI)—1 | ||||
|---|---|---|---|---|
| Customer’s Long-Term Plan on the Yearly Achievement: Measurement of Performance (i.e., Assessment of Service Providers) and Value of Customers Satisfaction—Emergency Planning (Internal Assessment per Year). e.g., (i) Updated Arrangement Displayed on Notice Board Regularly, i.e., Announcement of Arrangement of Fire Drills, etc. (ii) Installation of Updated Fire Services Equipment, i.e., Various Types of Valid Fire Extinguishers, etc. (Indicated by “√” in the Below Blanket) ψLP2,1(i) for the ith Year, Either “1” or “0”, Total Must Be Capped to at Least “1” | ||||
| Year (Mathematical Equation: ) | Emergency Planning (Internal Assessment) | |||
| (i) Updated Arrangement Displayed on Notice Board Regularly (per Year) | (ii)Installation of Updated Fire Services Equipment (per Year) | |||
| <3 times | 3 or >3 times | <3 times | 3 or >3 times | |
| 1–5 (score of the notice board and updated fire services equipment by adding them together, lowest at “0”, highest at “2”.) | 0 | 1 | 0 | 1 |
| Total NLP2 number of years above, now 5/Total NLP2 years, score = LP2(1) with weight w1= 1 | ||||
Remarks: Below 3 times per year—0; 3 or more than 3 times per year—1.
| Key Performance Indicator (KPI)—2 | ||||
|---|---|---|---|---|
| Customer’s Long-Term Plan of Yearly Achievement: Measurement on Performance (i.e., Assessment of Service Providers) and Value of Customers Satisfaction—Business Continuity and Sustainability (Internal Assessment per Year). e.g., (i) Arrangement of Intensive Cleaning i.e., of Carpets, Lighting System and Air Conditioning Systems in Office Areas, etc.; (ii) Application of Full Sterilization i.e., of the Washrooms, etc. (Indicated by “√” in the Below Blanket) ψLP2,2(i) for the ith Year, Either 1 or 0, Total Must Be Capped to at Least 1. | ||||
| Year (Mathematical Equation:) Total Score = | Business Continuity and Sustainability (Internal Assessment) | |||
| (i) Arrangement of Intensive Cleaning (per Year) | (ii) Application of Full Sterilization (per Year) | |||
| <3 times | 3 or >3 times | <3 times | 3 or >3 times | |
| 1–5 (Score = intensive cleaning and application of disinfectant by adding the two scores together, 0 the lowest and 2 the highest) | 0 | 1 | 0 | 1 |
| Total NLP2 years, seeming 5 for now, Score = LP2(2) with weight w2=2 | ||||
Remarks: Unchanged or higher level of rubbish—0; Lower level of rubbish—1.
Appendix I
Table A9.
Four outsourcing categories inputs from OC 1 to OC 4.
Table A9.
Four outsourcing categories inputs from OC 1 to OC 4.
| Score of | To be inserted into the ANN | Score of | To be inserted into the ANN | |||
| OC1 | 60.75 | 3.537 | OC1 | 67.078 | 3.853 | |
| OC2 | 51.521 | 3.076 | OC2 | 73.950 | 4.197 | |
| OC3 | 48.688 | 2.934 | OC3 | 81.574 | 4.578 | |
| OC4 | 49.314 | 2.965 | OC4 | 63.023 | 3.651 | |
| Expected ANN Output | OC1 | Expected ANN Output | OC3 | |||
| Score of | To be inserted into the ANN | Score of | To be inserted into the ANN | |||
| OC1 | 47.553 | 2.877 | OC1 | 53.371 | 3.168 | |
| OC2 | 57.789 | 3.389 | OC2 | 65.682 | 3.784 | |
| OC3 | 32.303 | 2.115 | OC3 | 66.160 | 3.808 | |
| OC4 | 34.140 | 2.206 | OC4 | 71.218 | 4.060 | |
| Expected ANN Output | OC2 | Expected ANN Output | OC4 | |||
| OC1 | OC2 | OC3 | OC4 | |||
| Expected ANN Output | OC1 | 3.537 | 3.076 | 2.934 | 2.965 | |
| Expected ANN Output | OC2 | 2.877 | 3.389 | 2.115 | 2.206 | |
| Expected ANN Output | OC3 | 3.853 | 4.197 | 4.578 | 3.651 | |
| Expected ANN Output | OC4 | 3.168 | 3.784 | 3.808 | 4.060 | |
Appendix J
Table A10.
Details of simulation of outsourcing category 1 as an example.
Table A10.
Details of simulation of outsourcing category 1 as an example.
| Score of | Wt with Respect to OC1 | OC1 | Wt with Respect to OC2 | OC2 | Wt with Respect to OC3 | OC3 | Wt with Respect to OC4 | OC4 | Score of | To Be Inserted into the ANN | ||
|---|---|---|---|---|---|---|---|---|---|---|---|---|
| SO1 | 100.00 | 3.00 | 1,000,000 | 2.00 | 10,000 | 1.00 | 100 | 2.00 | 10,000 | OC1 | 60.75 | 3.54 |
| SO2 | 44.83 | 2.00 | 2010 | 3.00 | 90,082 | 2.00 | 2010 | 2.00 | 2010 | OC2 | 51.52 | 3.08 |
| SC1 | 23.38 | 1.00 | 23 | 2.00 | 547 | 3.00 | 12,782 | 3.00 | 12,782 | OC3 | 48.69 | 2.93 |
| SC2 | 34.86 | 1.00 | 35 | 1.00 | 35 | 3.00 | 42,363 | 3.00 | 42,363 | OC4 | 49.31 | 2.97 |
| CP1 | 100.00 | 3.00 | 1,000,000 | 2.00 | 10,000 | 3.00 | 1,000,000 | 2.00 | 10,000 | |||
| CP2 | 40.82 | 2.00 | 1666 | 3.00 | 68,008 | 2.00 | 1666 | 2.00 | 1666 | |||
| LP1 | 61.77 | 1.00 | 62 | 2.00 | 3815 | 3.00 | 235,674 | 3.00 | 23,5674 | |||
| LP2 | 55.33 | 1.00 | 55 | 1.00 | 55 | 1.00 | 55 | 3.00 | 169,388 | |||
| Sum of Wt | 14.00 | 16.00 | 18.00 | 20.00 | ANN Output | OC1 |
References
- Ikediashi, D.I.; Odesola, I.A. Facilities Management outsourcing: Theoretical trends and evidence from practice in Nigeria and United Kingdom. Int. J. Strat. Prop. Manag. 2016, 20, 207–219. [Google Scholar] [CrossRef]
- Lok, K.L.; So, A.; Opoku, A.; Song, H. Globalized service providers’ perspective for facility management outsourcing relationships: Artificial neural networks. Manag. Decis. 2020, 59, 134–151. [Google Scholar] [CrossRef]
- Klungseth, N.J. Cleaning Services in Local Authorities. Ph.D. Thesis, Norwegian University of Science and Technology (NTNU), Trondheim, Norwey, 2015. Available online: http://hdl.handle.net/11250/2364934 (accessed on 17 September 2016).
- Haugen, T.; Klungseth, N.J. In-house or outsourcing FM services in the public sector—A review of 25 years research and development. J. Facil. Manag. 2017, 15, 262–284. [Google Scholar] [CrossRef]
- Ikediashi, D.I.; Ogunlana, S.O.; Boateng, P. Analysis of risks associated with facilities management outsourcing. J. Facil. Manag. 2012, 10, 301–316. [Google Scholar] [CrossRef]
- Fleming, D. Facilities management: A behavioral approach. Facilities 2004, 22, 35–43. [Google Scholar] [CrossRef]
- Hou, H.; Ho, D.; Chung, J.K.H.; Wong, K.K.W. Tight budget constraints and the absence of strategic planning—an exploratory analysis of FM service outsourcing. Facilities 2016, 34, 8. [Google Scholar] [CrossRef]
- Ernst and Young. Outsourcing in Europe: An Indepth Review of Drivers, Risks, and Trends in The European Outsourcing Market; EYGM Limited: London, UK, 2013. [Google Scholar]
- Pintelon, L.; Puyvelde, F.V. Maintenance performance reporting systems: Some experiences. J. Qual. Main. Eng. 1997, 3, 4–15. [Google Scholar] [CrossRef]
- Shohet, I.M. Building evaluation methodology for setting maintenance priorities in hospital buildings. Const. Manag. Econ. 2003, 21, 681–692. [Google Scholar] [CrossRef]
- Augenbroe, G.; Park, C.S. Quantification methods of technical building performance. Bldg. Res. Inf. 2005, 33, 159–172. [Google Scholar] [CrossRef]
- Ho, D.C.H.; Chan, E.H.W.; Wong, N.Y.; Chan, M. Significant metrics for facilities management benchmarking in the Asia Pacific region. Facilities 2000, 18, 545–555. [Google Scholar] [CrossRef]
- Gumbus, A. Introducing the balanced scorecard: Creating metrics to measure performance. J. Manag. Edu. 2005, 29, 617–630. [Google Scholar] [CrossRef]
- Tsang, A.H.C.; Jardine, A.K.S.; Kolodny, H. Measuring maintenance performance: A holistic approach. Int. J. Oper. Prod. Manag. 1999, 19, 691–715. [Google Scholar] [CrossRef]
- Cable, J.H.; Davis, J.S. Key Performance Indicators for Federal Facilities Portfolios, Federal Facilities Council Technical Report 147; National Academies Press: Washington, DC, USA, 2004. [Google Scholar]
- Chan, K.T.; Lee, R.H.K.; Burnett, J. Maintenance performance: A case study of hospitality engineering systems. Facilities 2001, 19, 494–503. [Google Scholar] [CrossRef]
- Lavy, S.; Garcia, J.A.; Dixit, M. KPIs for facility’s performance assessment, Part I: Identification and categorization of core indicators. Facilities 2014, 32, 256–274. [Google Scholar] [CrossRef]
- Varcoe, B.J. Facilities performance measurement. Facilities 1996, 14, 46–51. [Google Scholar] [CrossRef]
- Brackertz, N. Relating physical and service performance in local government community facilities. Facilities 2006, 24, 280–291. [Google Scholar] [CrossRef]
- Amaratunga, D.; Baldry, D.; Sarshar, M. Assessment of facilities management performance in higher education properties. Facilities 2000, 18, 293–301. [Google Scholar] [CrossRef]
- Amaratunga, D.; Baldry, D.; Sarshar, M. Assessment of facilities management performance—What next? Facilities 2000, 18, 66–75. [Google Scholar] [CrossRef]
- Lebas, M.J. Performance measurement and performance management. Int. J. Prod. Econ. 1995, 41, 23–35. [Google Scholar] [CrossRef]
- Hinks, J. Business-related performance measures for facilities management. In Facilities Management: Innovation and Performance; Alexander, K., Atkin, B., Brochner, J., Haugen, T., Eds.; SPON Press: New York, NY, USA, 2004; pp. 97–107. [Google Scholar]
- Eagan, P.D.; Joeres, E. Development of a facility-based environmental performance indicator related to sustainable development. J. Clean. Prod. 1997, 5, 269–278. [Google Scholar] [CrossRef]
- Cripps, S. Calgary K-12 District benefits from the facilities management evaluation program. Facil. Manag. Mag. 1998, 14, 27–33. [Google Scholar]
- Lavy, S.; Garcia, J.A.; Dixit, M. Establishment of KPIs for facility performance measurement: Review of literature. Facilities 2010, 28, 440–464. [Google Scholar] [CrossRef]
- Lavy, S.; Garcia, J.A.; Dixit, M. KPIs for facility’s performance assessment, Part II: Identification of variables and deriving expressions for core indicators. Facilities 2014, 32, 275–294. [Google Scholar] [CrossRef]
- Mendell, M.J.; Heath, G.A. Do indoor pollutants and thermal conditions in schools influence student performance? A critical review of the literature. Indoor Air 2004, 15, 27–52. [Google Scholar] [CrossRef]
- Fowler, K.M.; Solana, A.E.; Spees, K. Building Cost and Performance Metrics: Data Collection Protocol; Pacific Northwest National Laboratory: Richland, WA, USA, 2005.
- Prakash, P. Effect of Indoor Environmental Quality on Occupant’s Perception of Performance: A Comparative Study. Master’s Thesis, University of Florida, Gainesville, FL, USA, 2005. [Google Scholar]
- Fisk, W.J. Health and productivity gains from better indoor environments and their implications for the US Department of Energy. In Proceedings of the E-Vision 2000 Conference, Washington, DC, USA, 11–13 October 2000. [Google Scholar]
- Mozaffarian, R. Life-Cycle Indoor Air Quality Comparisons between LEED Certified and Non-LEED Certified Buildings. Master’s Thesis, University of Florida, Gainesville, FL, USA, 2008. [Google Scholar]
- Ford, S.A.; Zagreus, L.; Lehrer, D.; Huizenga, C. Occupant satisfaction with indoor environmental quality in green buildings. Healthy Bldgs 2006 2006, 3, 365–370. [Google Scholar]
- Heath, G.A.; Mendell, M.J. Do indoor environments in schools influence student performance? A review of literature. In Air 2002 Conference, Proceedings of the 9th International Conference on Indoor Air Quality and Climate, Monterey, CA, USA, 30 June–5 July 2002; International Academy of Indoor Air Sciences: Herndon, VA, USA, 2002; pp. 802–807. [Google Scholar]
- Bakker, I.; van der Voordt, T. The influence of plants on productivity: A critical assessment of research findings and test methods. Facilities 2010, 28, 416–439. [Google Scholar] [CrossRef]
- CEN. Facility Management—Part 1: Terms and Definitions; NSAI: Dublin, Ireland, 2006. [Google Scholar]
- Maechling, T.; Bredeson, J. Discovering value in outsourcing facilities management. Biopharm Int. 2005, 18, 66–72. [Google Scholar]
- Cui, Y.Y.; Coenen, C. Relationship value in outsourced FM services–value dimensions and drivers. Facilities 2016, 34, 43–68. [Google Scholar] [CrossRef]
- Haugen, T. Norway: Contracting out property and facility services in Norwegian municipalities. Nord. J. Surv. Real Est. 2003, 1, 52–70. [Google Scholar]
- Clements-Croome, D.; Kaluarachchi, Y. Assessment and measurement of productivity. In Creating the Productive Workplace; Clements-Croome, D., Ed.; E&FN Spon: London, UK, 2000; pp. 129–166. [Google Scholar]
- Bradley, S. What’s working? briefing and evaluating workplace performance improvement. J. Corp. Real Est. 2002, 4, 150–159. [Google Scholar] [CrossRef]
- Tangen, S. A Theoretical Foundation for Productivity Measurement and Improvement of Automatic Assembly Systems. Licentiate Thesis, Royal Institute of Technology, Stockholm, Sweden, 2002. [Google Scholar]
- van der Voordt, T.J. Productivity and employee satisfaction in flexible workplaces. J. Corp. Real Est. 2004, 6, 133–148. [Google Scholar] [CrossRef]
- Oeij, P.R.A.; de Looze, M.P.; ten Have, K.; van Rijhn, J.W.; de Graaf, H.A.L.M. From productivity strategy to business case: Choosing a cost-effective intervention for workplace innovations. J. Cent. Cathedra Busi. Econ. Res. J. 2012, 5, 171–184. [Google Scholar] [CrossRef]
- Lok, K.L.; Baldry, D. Facilities management outsourcing relationships in the higher education institutes. Facilities 2015, 33, 819–848. [Google Scholar] [CrossRef]
- Lok, K.L.; Baldry, D. Demand and supply of FM outsourcing services. J. Facil. Manag. 2016, 4, 221–248. [Google Scholar] [CrossRef]
- Lok, K.L.; Opoku, A.; Baldry, D. Design of sustainable outsourcing services for facilities management: Critical success factors. Sustainability 2018, 10, 2292. [Google Scholar] [CrossRef]
- Roper, K.O.; Richard, P. The Facility Management Handbook; AMACOM: New York, NY, USA, 2014. [Google Scholar]
- Olawumi, T.O.; Chan, D.W.M. A scientometric review of global research on sustainability and sustainable development. J. Clean. Prod. 2018, 183, 231–250. [Google Scholar] [CrossRef]
- Cobb, C.W.; Douglas, P.H. A Theory of Production. Am. Econ. Rev. 1928, 18, 139–165. [Google Scholar]
- So, A.T.P.; Wong, K.C. On the quantitative assessment of intelligent buildings. Facilities 2002, 20, 208–216, 288–295. [Google Scholar] [CrossRef]


Publisher’s Note: MDPI stays neutral with regard to jurisdictional claims in published maps and institutional affiliations. |
© 2021 by the authors. Licensee MDPI, Basel, Switzerland. This article is an open access article distributed under the terms and conditions of the Creative Commons Attribution (CC BY) license (https://creativecommons.org/licenses/by/4.0/).