Abstract
New challenges and perspectives to improve non-financial reporting and the disclosure of environmental, social, and governance indicators have been launched towards the development horizon of Romanian public interest entities, implementing the provisions of Directive 2014/95/EU in the local regulatory framework. In this context, our approach focused on the content analysis of the non-financial information reported by listed companies, for the period 2017–2019, and the measure of the average disclosure degree on environmental, social, economic, and governance (ESEG) indicators. To measure the average degree of disclosure, a composite index was constructed through the main component analysis for categorical data that allowed the classification of sampled companies by sustainable performance. The results showed a slight increase in the ESEG disclosure index at the level of the sampled companies, from 47 units in 2017 to 52 units in 2019, several companies “went ahead” and others “recovered over the period”. Cross-sectional analysis revealed differences in the average non-financial disclosure index, and also in the disclosure index of ESEG indicators. The non-parametric correlation analysis highlighted the existence of a statistically significant positive correlation of medium intensity between the disclosure index of non-financial information and the publication of the non-financial statement or report.
1. Introduction
An authentically successful and powerful company can meet the information needs of all stakeholders in such a way that their decisions are as risk-averse as possible. A company’s performance assessment requires information that goes beyond the scope of financial accounting information or, in general, economic information. Beyond these is non-financial information. In the context of global performance assessment, the real challenge consists in non-financial information reporting. This increases the quality of the information as a whole, and its publication in a sustainability report or an integrated report creates a comprehensive image of the company’s performance. Therewith, this kind of information can contribute to the identification of significant issues that affect the business strategies, contributing to decision-making and generating actions aimed at creating value in the future [1]. Reporting non-financial information helps companies to avoid, diminish, or control the harmful impact of their activities on the population and the environment [2]. Sustainability risk must be considered and managed with the same importance given to others [3].
Achieving the objectives of the UN 2030 Agenda requires a thorough and in-depth analysis of the directions in which progress has been made in sustainable development, as well as where challenges or threats in sustainable reporting occur, through continuous monitoring and assessment. The 2030 Agenda requires a complex approach in multiple dimensions, representing a frame of reference for the conservation and capitalization of natural and human resources and ensuring the protection of human rights [4]. In this regard, several international bodies have taken actions to raise awareness of companies and society of the need for sustainable development. The United Nations, by adopting the 2030 Agenda, which includes 17 sustainable development goals and 169 associated tasks, guides the Member States (including Romania) on implementing and capitalizing on sustainable principles, an important step towards a sustainable future [4]. Romania’s economy is going through important stages in terms of economic development [5], currently being challenged by sustainable development.
Companies are becoming more and more responsible because investors are also urged to make socially responsible investment decisions [6]. As the company reaches a certain size and the business consolidates, it becomes attractive to creditors or investors [7]. However, the actions responsible towards the environment and society must result from the mandatory or voluntary information reported and disclosed by companies. The G4 standards developed by the Global Reporting Initiative (GRI) are a feasible non-financial reporting framework, providing guidelines to companies in building their non-financial information disclosure strategy [2].
In Europe, the EU Directive 2014/95/EU [8] requires certain companies and large groups to provide non-financial and diversity information. However, the regulation does not indicate any framework to be used by companies for corporate and non-financial reporting [9], its adoption increases the use of this reporting [2,10,11,12]. The impact of this directive is felt in Romania, through the publication of Order of the Ministry of Public Finance (Order) 1938/2016 [13] in response to the alignment of national regulation with the European one. The regulation introduces starting with 1 January 2017, the “Non-financial declaration” as a component of the annual reports of public interest entities with an average number of employees higher than 500. Subsequently, Order 3456/2018 [14], with applicability from 1 January 2019, extends the mandatory publication of a non-financial statement to all entities with more than 500 employees, regardless of whether their financial statements are prepared following national accounting regulations (Order 1802/2014 [15]) or under IFRS (Order 2844/2016 [16]). In the vision of the Romanian regulator, the purpose of this statement is to facilitate the understanding of the sustainable development of the entity, its performance, and financial position, as well as the impact of its activities. Information on environmental, social, and personnel issues, information on human rights, but also the fight against corruption and bribery, is required to be mentioned in this statement. According to CNVM Regulation No.1/2006 [17] (until 21 June 2018) and ASF Regulation No. 5/2018 [18] listed companies are required to publish information about the environment, employees, risk management, policies, and future objectives. Order 1802/2014 [15] remains, which encourages unlisted Romanian companies with fewer than 500 employees to engage in the transparent and voluntary communication of non-financial information if this better understands their “development, performance or position”. Corporate social responsibility initiatives lead to improved business reputation and increased stakeholder interest in the way companies have an impact on society and the natural environment. Through reporting, a particularly important communication channel is created through which companies can convince their stakeholders that they are receptive to society’s needs and dynamics [2].
Against this background, this study investigates the nature of the relationships between sustainability disclosures expressed by the non-financial reporting index and the type of industry and the existence of non-financial report or declaration/statement. The research is achieved on two levels. The first stage aims to build a synthetic measure—a composite index of non-financial reporting disclosure based on four dimensions—environmental, social, economic, and governance (ESEGindex), to evaluate companies’ behaviour during the period 2017–2019 using the categorical principal components analysis based on panel data. Sustainability performance indicators, distinctive features of non-financial reporting, are a significant added value to non-financial corporate communication and are useful tools for internal decision-making processes [10]. At the second level, the aim is to identify correlations. At this stage, the aim is and to evaluate if the type of industry influences the overall index of non-financial disclosure and also its components using the non-parametric test of Kruskal–Wallis. Also, the potential relationship between the composite index of non-financial disclosure index and the existence of a non-financial report or declaration/statement has been investigated using the Spearman and Kendall correlation analysis and Mann–Whitney test. In this respect, the study aims to test research hypotheses.
Our study has two main contributions. That of analyzing the average degree of disclosure of non-financial information dynamics based on the composite disclosure index, but also to deepen the analysis in structure and compare the degree of disclosure of sustainability indicators and the second contribution is to stratify the results by industry and analysis of the correlation between non-financial reporting, and the existence of an express report or statement published separately, included or not, in the annual report of the companies
The paper comprises seven sections. After this introductory part, section two presents a review of the literature, being analyzed several studies dealing with the disclosure of non-financial information in correlation with other sustainability indicators. The next section reveals the research design, which then leads to the discussion of results where the level of disclosure of non-financial indicators by listed Romanian companies and their evolution over time is revealed. Section five shows how the degree of non-financial disclosure (ESEGindex) was calculated, as well as its analysis. The sixth section corresponds to the research level of the correlation between the type of industry and the existence of a non-financial report or statement with the ESEG disclosure index. Finally, the research conclusions are drawn, the limits of the research are identified, and the agenda of future research is completed.
2. State of Art and Research Objectives
2.1. Stakeholder Theory and Non-Financial Reporting
Stakeholder theory is focused on analyzing the relationships between a business and the groups or individuals that influence or are affected by the business, pursuing the interests of each actor, thus offering the possibility to efficiently manage the value creation process and the exchange of value, follow the business ethics and harmonizing the interests pursued by managers in achieving performance objectives [19]. The business conducted from the perspective of this theory is seen as a network of relationships between entities that have a stake in the activities that make up the business [20,21,22] and refers to how shareholders, investors, employees, managers, banks, customers, suppliers, state institutions, various organizations, communities, and the public interact to create and exchange value.
Hill and Jones [23] showed that extending the agency theory from shareholders to stakeholders motivates managers to bring stakeholders together to achieve the financial goals in the business.
On the other hand, Choi and Wang [24] observed that good stakeholder relationships allow a company to achieve higher financial performance over a longer period, but at the same time, they motivate lower-performing companies to improve their performance faster. Thus, stakeholder theory is the basis for understanding the factors that influence corporate reporting. As concerning the relationship between stakeholders’ interests and the need to comply with GRI guidelines, more and more studies have analyzed how companies respond to the increased pressure of disclosing environmental, social, and governance (ESG) information and the impact of non-financial disclosure on society [25]. One way companies respond to this pressure from stakeholders is to report non-financial information most often through a report or statement included in the annual report or through a sustainability report [26,27]. The interests of different stakeholders can sometimes be very different even in opposition and finding the best way to meet their information needs is a challenge [28]. Thus, managers can select and prioritize the need to meet the information needs of stakeholders in non-financial reporting by giving greater importance to stronger actors with greater influence in the set of relationships developed [29]. The analysis of the relevance of stakeholders and the motivation of companies to report non-financial information will reveal the set of ESG information that will be included in the non-financial report or statement [30,31]. Some authors who have studied the correlation between stakeholder theory and the determinants of non-financial reporting argued that there are differences in the relevance of this theory and the information reported in emerging markets [25]. Empirical evidence in this regard exists for Asian countries as can be found in Liu and Anbumozni [32] and Muttakin and Khan [33]. If the Chinese state is one of the key players putting pressure on Chinese companies for non-financial reporting of information, and Liu and Anbumozni [32] showed that there is a positive correlation between the quality of regulations and non-financial reporting, in the case of Bangladeshi companies their internationalization is one of the factors that determine non-financial reporting, internationally oriented companies are required to report non-financial information to global stakeholders [33].
As Romania is a European country with a governance model based on stakeholders’ interests in the context imposed by the requirements of EU Directive 2014/95/EU on non-financial reporting and disclosure, we considered it relevant to examine how Romanian companies respond to these regulations.
Thus, in this study, we were interested in analyzing the degree of disclosure of non-financial information, before and after implementing the requirements of the European Directive, and the correlations between the type of industry, the existence of the report or non-financial statement as a separate piece in the annual report of sampled companies and the average degree of disclosure of non-financial information.
2.2. Background on Non-Financial Disclosure and Hypothesis Development
Many international organizations encourage companies around the world to embrace corporate social responsibility and pay close attention to non-financial reporting practices. Stakeholders are determined to require companies to behave socially and environmentally [2]. Sustainable Development Goals (SDGs) are designed to help companies meet several challenges: reputational risk management, responding to phenomena such as globalization and digitalization, proper communication with stakeholders, and meeting investor requirements for greater reporting transparency [34]. Climate change, human capital issues [6], and the increasingly visible associated risks cause more and more companies and regulators to become aware of the importance of environmental, social, and governance activities and disclosures [35]. Acting in the direction of these three dimensions, any company demonstrates what is called “corporate social responsibility”. Initiatives of corporate social responsibility play an important role in communicating non-financial information [2]. For a sustainable economy, it is necessary that every individual, but especially company, act responsibly towards the environment and people. Achieving the objectives of sustainable development at the macroeconomic level can be obtained only by achieving the same objectives at the level of economic entities, as microelements in this complex system [36]. Many companies globally strive to introduce sustainable development strategies into their business model that affect the environment as little as possible but contribute to a better social environment. These companies have been the sample of numerous research studies in this field of sustainability. Various studies [37,38,39,40,41] have been conducted on companies that represent examples of good practice in terms of their flexibility to adapt to responsible corporate reporting requirements. Several reports are published on the websites of representative bodies [2,9]. One can notice a constant improvement of the reports of these companies, whether it is an alignment with GRI Standards [2] or compliance to the International Integrated Reporting Committee (IIRC) framework [9].
In terms of compliance, various studies [10,41,42,43,44,45,46,47] were conducted to identify the reaction of companies to the mandatory transposition of what was voluntary. How prepared companies are for reporting as required by the directive is the question that many researchers have asked themselves [42,43,44]. Considering the case of the 50 largest European companies (aftermarket capitalization), Manes-Rossi et al. [42] notes that there is already a high level of compliance of these companies’ annual and integrated 2016 reports with the requirements to be introduced by the directive. Doni et al. [43] conclude that in terms of the business model, the previous skills acquired by the 60 Italian companies listed in the non-financial reporting have made a significant contribution to the disclosure of non-financial information. From their cross-country analysis, Venturelli et al. [44] believe that companies with a history of corporate social responsibility, such as those in the UK, will not gain significant benefits from the application of the directive. Italian companies, on the other hand, will benefit from this regulation, expecting further efforts from them to improve the quality of non-financial reports [43,44]. Some researchers [10,41,45,46,47] conducted comparative analyzes of non-financial reporting practices before and after the European directive. The effects of the new regulation for the 70 Italian companies analyzed by Venturelli et al. [45] consisted only in increasing the number of non-financial reports published in 2018 compared to 2016, but with a lower overall degree of comparability of data. To find out whether mandatory regulation leads to greater disclosure of non-financial information Nicolò et al. [46] analyzes 22 European state-owned enterprises, comparing the years 2016–2017. They conclude that, in the case of these companies, mandatory regulation does not stimulate non-financial disclosure, as the level of disclosure through published integrated reports has remained relatively constant.
Raucci and Tarquinio [10] highlighted their results on disclosure analysis of sustainability reports published by Italian listed companies in 2017 compared to 2012. The investigation of disclosure behavior was based on a set of sustainability performance indicators according to GRI Standards. A reduction of the quantity of disclosed indicators was noted, explained by the authors by a limitation of the companies in publishing non-financial information only to those considered more “relevant”, according to the Directive 2014/95/EU. The conclusions of the study also highlighted the discrepancies in non-financial reporting between companies in different sectors of activity, without testing the existence of a correlation between the type of industry and the number of sustainability performance indicators reported. To conduct a comprehensive analysis of the sustainability performance of companies and to place them in a hierarchy, Tarquinio et al. [41] extend the study to 57 Italian listed companies for the period 2016–2018, before and after the European directive. The downward trend in the non-financial disclosure index for the majority of them is confirmed once again, but most companies have improved their disclosure metrics during the analyzed period. In terms of performance, most studies identify positive relationships between sustainability practices and financial indicators [6,48,49,50,51] or between CSR and companies’ financial performance [52,53,54,55,56]. In their analysis of a considerable number of listed British companies, Li et al. [50] found a positive association between the level of environmental, social, and corporate governance disclosure and the value of the company, suggesting that improved transparency and accountability and increased stakeholder trust play a significant role in increasing the value of the company. Analyzing Australian companies’ disclosure practices between 2010 and 2016, Sila and Cek [51] unlike previous authors, observed that social performance constantly leads to improved economic performance, environmental performance also had a positive effect on economic performance, but to a lesser extent. However, they obtained very weak evidence for a significant relationship between governance and economic performance, with only one significant effect in 2015. According to Oncioiu et al. [57] indicators of CSR can be incorporated into companies’ financial reports and can convert sustainability measures into a real value for all parties.
Empirical studies [49,58,59] conducted on companies from sensitive industries analyze the financial performance of listed companies in the energy sector, seeking to identify links between the sustainable actions of companies and their financial performance. From studies conducted by Paun [58] and Rastogi et al. [59], we found out that the performance of companies is strongly influenced by government policies. For these companies to perform, the government needs to establish policies that motivate these companies to invest more in sustainable development. This is is because good environmental, social and corporate performance can improve the financial performance. As appreciated by Zhao [49] through the return on capital employed (ROCE) indicator, excellent sustainability performance can achieve excellence in the power generation industry. Paun [58] and Rastogi et al. [59] assessed the performance of companies through the financial indicator ROE while Kurochkina et al. [60] measured the performance of sustainable business undertaken by Russian companies, in terms of value creation indicators. They considered that a whole image of the created value is given by an approach from three points of view: the intrinsic value of the company, the overall capitals, respectively the created value influenced by interested parties. Analyzing corporate social responsibility practices on a large number of Korean companies, Yoon [61] showed that they significantly and positively affect the firm’s market value, but the impact on stock prices may differ depending on the company’s features. Corporate governance negatively influences the companies’ value for environmentally sensitive companies, even significantly in the case of family-managed business groups.
Baboukardos [62] following his study conducted on French listed companies, finds that investors give a positive and significantly higher value to environmental performance ratings to companies with environmental provisions recognized in their balance sheets. Therefore, he concluded that integrated reporting, which shows the interaction of financial information with non-financial information, has favorable implications for the assessment of companies by capital market actors. GRI standards support companies in preparing their sustainability reports. At the same time, the International Integrated Reporting Council developed the International Integrated Reporting Framework as a support for the development of an integrated report. While traditional corporate reporting contains numerous reports, not connected and static, integrated reporting focuses on the process of creating company value over time, bringing together financial and non-financial information [9]. At the same time, De Lucia [6] observed that the changing behavior of companies receptive to the sustainability problems of the global community and the availability of environmental, social, and governance indicators in their reports, attract investors to socially responsible investment decisions. Ielasi [63] specifies that pension funds are encouraged by regulations to integrate environmental, social, and governance issues, both in risk analysis and in investment policies. The results of their research, based on the effect of these non-financial indicators on European and American securities portfolios, confirm that if they are not included in the portfolio management this will make performance more vulnerable.
Exploring the sustainability performances of companies using environmental, social, and governance scores was done by several researchers [2,3,9,10,41,64,65]. Used in addition to the financial score, the use of these scores increases accuracy in assessing performance and risk [64]. The reporting of sustainability indicators signals to potential investors that the company involves a less risky investment than others [66,67,68,69]. At the same time, the quantification with the help of scores of this non-financial information that is qualitative facilitates rankings and comparisons. For example, Rajesh [3], analyzing Indian companies, noted that the score of resource use, the score of environmental innovations, and the score of the strategy on corporate social responsibility contributed the most to the sustainable performance of companies. Human rights scores, shareholders’ scores, and management scores are the least involved. There are also studies [70,71,72,73] that show that there is a significant negative correlation between corporate ESG activities and firm performance, non-state-owned and non-environmentally sensitive companies undertake greater cost pressure on ESG activities, which in turn leads to a greater reduction in firm performance [35]. Likewise, Broadstock et al. [74] find a non-linear relationship between the reporting of greenhouse gas emissions and the firm performance, noting a reluctance of companies to disclose this issue. The disclosure of social or governance issues also does not directly influence emissions reporting, suggesting that firms dissociate environmental responsibility from social responsibility. Studies conducted by Eccles [75], Mojarad et al. [76], and Fuso-Nerini et al. [77] focused on the examination and analysis of the relationship between the industry type and sustainable development variables.
The interest in carrying out studies regarding non-financial reporting and sustainability indicators of Romanian companies has registered an increasing trend lately. Thus, several studies have been conducted on listed companies during the last decade [2,4,47,64,78] and have shown great progress in obtaining a high level of environmental, social, and governance performance. The tendency of these companies to publish sustainability reports is increasing [2]. They are making an increasing effort to ensure that their reports meet the requirements of the European directive [47]. A comparative study conducted on 20 Romanian companies and 20 Polish companies [78] shows that the overall score of disclosure is higher for Romania, although Poland has registered a larger expansion of voluntary reporting. Analyzing the three dimensions of non-financial performance, Achim et al. [64] get a higher score for the social and environmental dimension than for corporate governance. Studies [79,80,81,82] that have analyzed non-financial reporting practices in correlation with the activity sector observed that some sectors differ in the level of sustainability disclosure. From the cross-sectional analysis by industries conducted on sampled Romanian companies, in the period 2017–2019, Nechita et al. [4] emphasizes the similarities and reporting differences influenced by the industrial branches. Hurghiş [1] shows that those companies operating in the financial field tend to present more information than companies in the health field. Similarly, Tiron et al. [47] finds that unlike other sectors of activity, Romanian energy listed companies are more aware and more focused on environmental, social, and governance issues, a finding derived from a considerable increase in the index of disclosure of non-financial information.
Based on those presented above, the purpose of this study is to measure the degree of disclosure of non-financial sustainability variables and to test the correlations between these measurements and the industry type and the link between them and the publication of an annual non-financial report or statement. In this sense, the following research hypotheses were developed:
Hypotheses 1 (H1).
The type of industry influences the non-financial reporting (ESEGindex) disclosure index.
We have divided H1 into three hypotheses and we have tested them separately. These are:
Hypotheses 1a (H1a).
The type of industry influences the environmental and social component of ESEG disclosure index.
Hypotheses 1b (H1b).
The type of industry influences the economic component of ESEG disclosure index.
Hypotheses 1c (H1c).
The type of industry influences the governance component of ESEG disclosure index.
Hypotheses 2 (H2).
There is a correlation between the existence of non-financial report or statement and the non-financial reporting (ESEG) disclosure index.
3. Materials and Methods
3.1. Data
The research is based on a sample of 60 companies listed on BSE (Bucharest Stock Exchange) grouped in 8 industries analyzed for the period 2017–2019 (Table 1). This period was chosen for the comparative analysis of the average degree of disclosure of non-financial information, before and after the occurrence of Romanian accounting regulations requiring publication with the annual financial reports a statement or a non-financial report (Order 3456/2018 [14]).

Table 1.
Sampled industries.
For the construction of the composite non-financial reporting disclosure index (ESEGindex), the analysis used 12 variables that gathered information on 4 indicators: environmental, social, economic, and governance issues (Table 2), as follows:
Table 2.
Sustainability indicators and selected measured variables.
The score method was used to quantify the degree of disclosure of information in annual reports and/or non-financial statements on these variables. Thus, the following scores were given: 1 for non-existent information, 2 for information presented but poor, 3 for information presented but not detailed, and 4 for information presented in detail. We also looked at whether the non-financial sustainability variables were presented separately in a non-financial report or statement, or the presentation was made in the chapters of the annual reports. The average ESEG disclosure index was calculated as follows:
where xi represents the information quantified according to the level of explanation and n is the number of variables that describe the non-financial and sustainability indicators.
3.2. Methodology
As indicated above, the companies in our sample are required to publish, under Order 1938/2016 [13] and Order 3456/2018 [14], non-financial statements or reports, containing to the necessary extent, information on at least aspects, related to environmental, social, and personnel issues, respect for human rights, the fight against corruption and bribe information, to better understand the development of business, the financial position and the evolution of their global performance. After the calculation of the average ESEG disclosure index, the present study aimed to determine the composite non-financial disclosure index.
Although in the construction of composite indices, PCA (principal component analysis) is the method considered adequate and extremely used in empirical studies in different fields, the use of qualitative data (ordinal data) in capturing the degree of non-financial disclosure leads us to the CATPCA method (main component analysis for categorical data) which is a more flexible alternative, suitable for categorical variables that cannot be linearly related. The purpose of principal component analysis is to reduce an original set of variables to a smaller set of uncorrelated components that represent most of the information found in the original variables. The analysis of standard main components assumes linear relationships between numerical variables. On the other hand, the optimal scaling that includes this type of CATPCA method allows the scaling of variables at different levels. Categorical variables are optimally quantified in the specified dimensionality. As a result, nonlinear relationships between variables can be modeled. A detailed description of the method is provided by Linting and Van der Kooij [83], Saukani and Ismail [84], Šulc and Řezankova [85], and Coco and Russo [86].
Categorical Principal Component Analysis (CATPCA) is appropriate for reducing dimensionality when variables are categorical and the goal is to identify the components of a set of variables (or items), while maximizing the amount of variance accounted for in those items. The main benefit of using CATPCA as opposed to traditional PCA is the lack of assumptions associated with CATPCA. This method does not imply linear relationships between numerical data, nor does it require the assumption of normal multivariate data. Principal component analysis (PCA) and CATPCA are methods that reduce the number of observed variables to some uncorrelated latent variables, called principal components. Unlike PCA, CATPCA presents a more general approach, which allows solving some limits of traditional PCA: the use of nominal and ordinal variables and the discovery of nonlinear relationships between variables.
When working with category variables, the categories must be quantified to allow the calculation of the correlation matrix and the variance as a concept (VAF-Variance accounted for) which serves as a diagnostic model. This process is called optimal scaling. The purpose of both methods is to create main components that contain as much variability as possible from a data set. The proportion of variability expressed by the main components is VAF. Unlike PCA, where latent variables are calculated directly from the correlation matrix, CATPCA creates a correlation matrix simultaneously with model creation. If all variables are numeric, the iterative process ends with the same result as PCA. The main output of PCA and CATPCA are main components-component loadings; in a two-dimensional solution, they can be displayed as a diagram. As a procedure, the CATPCA procedure from the SPSS statistical software version 23 was used in the analysis. For the determination of the composite non-financial disclosure index (ESEGindex), the weights obtained based on CATPCA were used, reporting the proportion of the variance recovered by each main component in the total variance recovered as weights of the factor scores to determine the non-standardized index. Subsequently, the index was standardized using the percentile rank, to take values between 0 and 100. The company with the best performance takes the value 100, while the company with the lowest performance takes the value 0. Dynamics in the degree of non-financial disclosure of a company can be highlighted based on a trend chart. Thus, if the value of the composite index for a set of companies for at least two different periods is known, then growth rates can be determined. The Kruskal–Wallis non-parametric test was used to test the H1 hypothesis and its sub-components H1a, H1b, and H1c, highlighting significant differences in the average degree of non-financial disclosure depending on the type of industry in which the company activates.
Further on, we used Mann–Whitney test to examine the link between ESEGindex and the existence of a published report or statement on non-financial information.
4. Results
4.1. Company Profile
Most of the companies in the sample analyzed operate in the manufacturing, transport and storage, and extractive industries. The largest advance in terms of the main dimensions of the degree of non-financial disclosure was recorded in the period 2017–2019 and aimed at detailing the aspects related to the fight against corruption and bribery and the integrated management system. Also, compared to 2017, in 2019, the share of companies increased for which the non-financial sustainability variables were presented separately in a non-financial report or statement, from 26.7% in 2017 to approximately 41.7% in 2019 (Table 3).
Table 3.
Descriptive statistics for sampled companies.
4.2. Analysis of Non-Financial Disclosure Metrics
The average degree of disclosure of environmental issues in the entire sample of 60 companies included in the analysis showed an upward trend in 2018 compared to 2017, but with a slight downward trend for the last year, 2019. At an individual level, it is found that most of the analyzed companies have not changed their policy of disclosing environmental issues in these three years, and a relatively small number of companies have improved this aspect. Thus, Fora, SN Electrica, Digi Communications NV, Aerostar, and Comelf registered a higher degree of disclosure regarding environmental aspects, while companies such as Electroputere, Electrocontact, Uamt, and Zentiva marked decreases in detailing the degree of disclosure regarding the environment.
The average degree of disclosure targeting the social component marked by personnel issues, human rights issues, and the fight against discrimination and the promotion of diversity marks a higher disclosure in 2018 compared to 2017, but a setback in 2019. Thus, the most significant decrease was registered among the human rights indicators. At an individual level, companies such as Transelectrica, Turism Felix, Electrica, Digi Communications NV, Alro, Antibiotice, Artego, and Prefab disclosed detailed information regarding issues related to the social component, while the companies Compa and Electromagnetica registered a regression regarding the disclosure of the aspects concerning social variables.
In terms of the economic dimension, increases in the average level of disclosure have been recorded for the transparency of trade policies and the fight against corruption and bribery. At the individual level, the companies Turism Felix, Electrica, Digi Communications NV, Farmaceutica Remedia, Transgaz, Compa, and Electroarges, disclosed detailed information regarding economic aspects, while the companies Electroputere, Electrocontact, Uamt, and Zentiva registered a setback in terms of disclosing economic issues.
On the governance component, the year 2019 registers at the level of the sampled companies a slight increase of the average degree of disclosure in terms of organizational empathy, but also a decrease in detailed information concerning ethics, deontological integrity, and elimination of conflict of interests. At the individual level, Electrica, Digi Communications NV, Compa, Prebet, Prefab, Retrasib, Romcarbon, and Uamt disclosed detailed information related to the governance component, while the companies Aerostar, Electromagnetica, Electrocontact, and Zentiva registered a setback in terms of disclosure of governance issues.
5. ESEG Disclosure Index (Construction and Analysis)
The first objective of the research was to identify the key dimensions in the analysis of the degree of non-financial disclosure (ESEG) at the level of sampled companies for the period 2017–2019 and build a synthetic indicator (composite indicator) to evaluate non-financial disclosure using analysis in main components for categorical data based on panel data. The empirical results of the Cronbach-alpha coefficient used to evaluate how well a set of elements measures a single one-dimensional object, estimating the internal consistency of the elements in the model, recorded for the data panel has the value of 0.964, highlighting a good internal consistency of the indicators, being higher than the limit of 0.7 specified in specialized studies [87]. The eigenvalues can be used as an indication of the number of dimensions to be retained. Like the traditional PCA, the superunit eigenvalues (the three eigenvalues) that recover 71.81% of the total version of the original indicators will be selected. Thus, the first main component recovers 51.2% of the total variance, the second recovers another 11.36%, while the third recovers only 9.24%, all three summarizing a total of 71.81% of the total variance, of the original variables. The scores of the objects are the coordinates associated with each case (a company in the sample) for each of the three dimensions, presented in Figure 1. On the first dimension, all the variables have high (positive) loads of the components, being strongly correlated with the aspects related to the environment, the personnel, but also to waste management. The second dimension is mainly correlated with the variables detailing aspects related to the transparency of trade policies, while the third dimension is positively correlated with the variable concerning aspects of social responsibility and other corporate governance responsibilities.
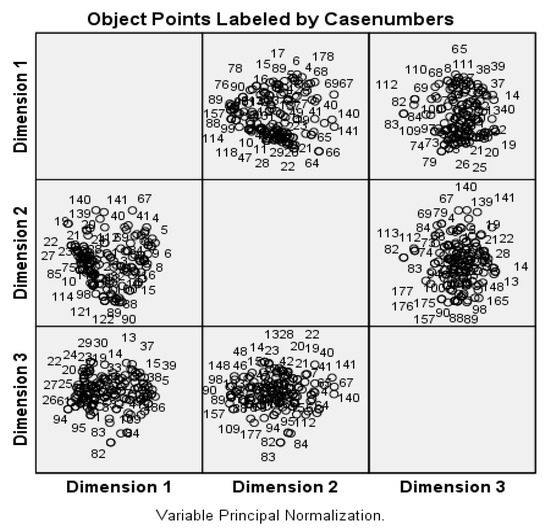
Figure 1.
The scores of the objects in the space with three dimensions.
The first main component that recovers most of the original variables, 51.20%, can be considered a sustainability component that includes an environmental dimension (environmental aspects), a social dimension that aims at employee aspects, and an economic dimension concerning aspects related to waste management. The second main component can be interpreted in terms of an economic component, which concerns issues related to the transparency of trade policies, while the third main component refers to a governance component that deals with aspects of social responsibility and other corporate governance responsibilities (Figure 2).
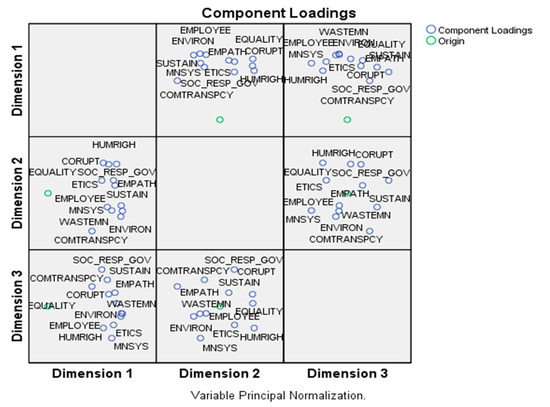
Figure 2.
Component loadings and dimension analysis.
In Figure 3 we represented a scattering biplo-graph of each main component (blue) and each company (green) drawn in the space of the three dimensions. Here, we can see that dimension 1, which can capture more of the variance between items and cases, can explain variance better than dimension 2, for elements and cases that are more condensed (less variable/variance) and overlap each other.
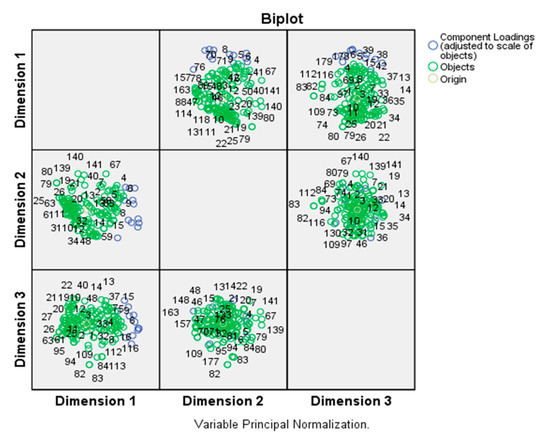
Figure 3.
Main components in graph representation.
In the final stage of the construction of the composite non-financial disclosure index (ESEGindex), the weights obtained based on CATPCA are considered, reporting the proportion of the variance recovered by each main component in the total variance recovered as weights of factor scores to determine the non-standardized index.
The final value given to each observation for each company and year is rescaled using the percentile rank. Thus, the non-financial disclosure index will indicate how a company will perform in one year compared to another company in another year, at its level. The index will take values between 0 (lowest level of disclosure) and 100 (highest level of disclosure). A value of 50 represents an average level of disclosure. Depending on the values recorded for the non-financial disclosure index at the level of the sample of companies in the period 2017–2019 (Appendix A) we concluded that there are:
- Companies with a relatively high degree of non-financial disclosure for the entire period: OMV Petrom, Romgaz, Electrica, Digi Communications NV, Conpet, Aerostar, Romcarbon, TMK Artrom.
- Companies with increases of the degree of non-financial disclosure in time: Turism Felix, Compa, Electroarges, Uamt.
Analyzing the average values of the non-financial disclosure index of the level of the sampled companies for the period 2017–2019, we can conclude that Omv Petrom, Romgaz, Nuclearelectrica, Electrica, Conpet, Aerostar, and TMK Artrom, recorded the highest average degree of disclosure for the analyzed period 2017–2019, with scores of over 85 units, while at the opposite pole are Socep, Amatura, Electroaparataj, Mecanica Fina, and Romcab, with scores of the average degree of disclosure below 10 units (Figure 4).
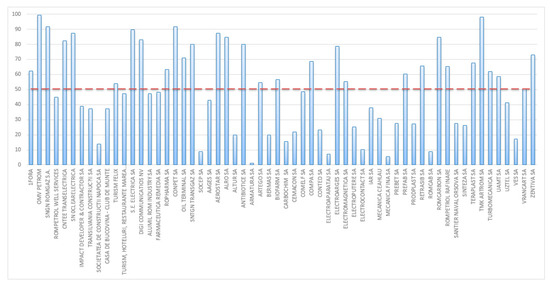
Figure 4.
The average non-financial disclosure index at the level of sampled companies for 2017–2019.
During the investigated period, there is a slight increase in the degree of non-financial disclosure index at the level of sampled companies, from 47 units in 2017 to 52 units in 2019. Analyzing the evolution of the degree of non-financial disclosure among the sampled companies during 2017–2019, it can be highlighted the existence of four groups of companies: those with a high degree of disclosure throughout the period, those with a low degree of non-disclosure disclosure for the entire period, those that have improved their degree of non-financial disclosure, respectively those that have worsened their degree of disclosure. Within the trend chart presented in Figure 5, the dotted lines represent the percentage change of the non-financial disclosure index from 2019 compared to 2017, respectively the average score both at company and year level. From the graph, it can be seen that there are mostly two types of companies: those with a relatively low disclosure index that have rather regressed in the last year compared to the previous two years (Mecanica Fina, Romcab, Electroaparataj) and companies that rather are in a stagnation phase, registering quite high levels of the disclosure index for the entire analyzed period (TMK Artrom, OMV Petrom).
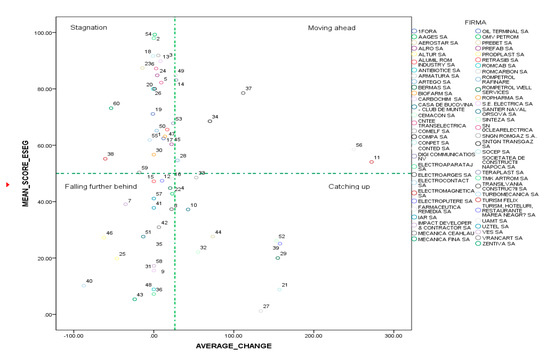
Figure 5.
Classification of companies according to the average values of the non-financial disclosure index (ESEGindex).
The companies that “went ahead” and have registered progress in the disclosure index are Electroarges, Digi Communications NV, Romcarbon, while the companies that “recovered over the period” are Comelf, Rompetrol Well Services, and Casa de Bucovina-Club de munte. Analyzing the distribution of companies according to the average non-financial disclosure index calculated for the period 2017–2019, we can classify the companies into two groups: those with a high degree of non-financial disclosure (for which the values of the average disclosure index for the three years is higher than the general average (50.28)), and those with a low non-financial disclosure degree (for which the values of the average disclosure index for the three years is lower than the general average (50.28)). Thus, we note companies with a high degree of ESEG disclosure index, like OMV Petrom, Transgaz, and Electrica, while at the opposite pole, with a low degree of disclosure index are Mecanica Fina, Socep, and Electrocontact (Figure 6).
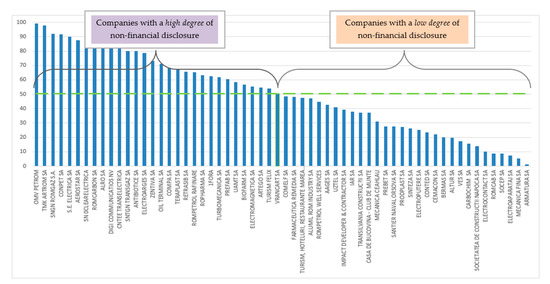
Figure 6.
Companies with high vs. low ESEGindex.
6. ESEG Disclosures in Correlation with Industry Type and the Statement of Non-Financial Reporting
The empirical Kruskal-Wallis test was applied to check if there are significant differences between the average non-financial disclosure index (ESEGindex) but also its components, the sustainability component (CP1), the economic component (CP2), and the governance component (CP3), depending on the type of industry in which the company operates. The results highlighted the presence of significant differences at a significance level of 5.5% for ESEG, CP1, and CP3. For the CP2 component, the probability of the test above the 10% threshold leads to the refutation of such differences (Table 4). Therefore, we can consider that H1a and H1c are validated.
Table 4.
Empirical results of the Kruskal-Wallis test.
Thus, companies operating in professional and technical-scientific activities, in the production and supply of electricity and heat, gas, hot water, and air conditioning, and the extractive industry have the highest degree of non-financial disclosure but also the highest degree of disclosure regarding the first sustainability component, focusing on issues related to the environment, personnel but also waste management for the period 2017–2019. On the other hand, companies in the construction, hotel, and restaurant sectors have the lowest degree of non-financial disclosure. The average degree of non-financial disclosure that refers to issues related to the transparency of trade policies does not differ significantly depending on the type of industry. Instead, companies in the sectors of professional and technical-scientific activities, hotels and restaurants but also wholesale and retail trade registered the highest degree of non-financial disclosure targeting aspects of social responsibility and other corporate governance responsibilities, while at the opposite pole are the companies in the manufacturing industry. Analyzing whether the type of industry leads to differences in the general degree of non-financial disclosure for each of the three years of the analysis, the Kruskal–Wallis test results showed significant differences for each year, at the significance threshold of 10% (Asymp.Sig is lower than this level, Table 5).
Table 5.
Empirical results of the Kruskal-Wallis test.
Therefore, at the level of 2017, the sectors of production and supply of electricity and heat, gas, hot water, and air conditioning, and professional, and technical-scientific activities recorded the highest degree of disclosure, at the opposite pole being situated the hotels and restaurants industry. In 2018, the same sectors with the highest degree of disclosure are kept, but at the opposite pole is the construction industry (Figure 7).
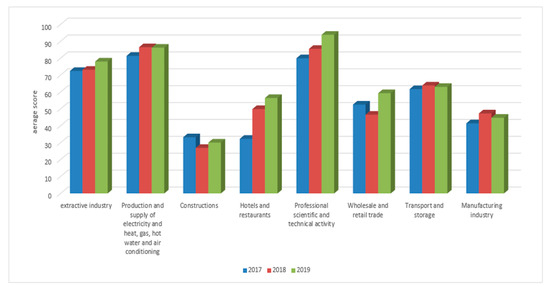
Figure 7.
Evolution of the general degree of ESEG non-financial disclosures by industries, between 2017 and 2019.
In 2019, the highest degree of disclosure was recorded by the professional scientific and technical activities, followed by the sector of production and supply of electricity, heat, gas, hot water, and air conditioning. It can be seen that the extractive industries, hotels, and restaurants, but also professional and technical-scientific activities, and wholesale and retail trade have registered over the three years continuous increases in the degree of non-financial disclosure, while production and supply of electricity, heat, gas, hot water and air conditioning, construction, transportation and storage, and the manufacturing industry marked slight decreases in this non-financial disclosure index (Figure 7).
Analyzing the relationship between the existence of the non-financial statement/declaration and the ESEG non-financial disclosure index for the period 2017–2019, the results of the Mann–Whitney test highlighted significant differences between the two groups of companies in terms of the degree of non-financial disclosure by the presence or the absence of the non-financial statement for all three years of the analysis, so that the companies that registered this type of statement also have a much higher degree of disclosure. The non-parametric correlation analysis highlighted the existence of a statistically significant positive correlation at the significance threshold of 1% and of medium intensity between the degree of non-financial disclosure of companies and the existence of the non-financial statement/declaration or report (Table 6, Table 7 and Table 8). Hence, we can state that H2 is validated.
Table 6.
Empirical results of the relationship analysis between the degree of ESEG non-financial disclosure in 2017 and the non-financial statement.
Table 7.
Empirical results of the relationship analysis between the degree of ESEG non-financial disclosure in 2018 and the non-financial statement.
Table 8.
Empirical results of the relationship analysis between the degree of ESEG non-financial disclosure in 2019 and the non-financial statement.
Our results are similar to those of Sierra-Garcia et al. [80] but there is a gap between the Spanish companies’ tendency to comply with non-financial reporting requirements and the speed of reaction to these reporting requirements of Romanian listed companies. The latter make real progress in reporting on the sustainability and non-financial indicators but react more slowly in publishing explanatory and detailed information in the non-financial statement or report.
7. Conclusions
The main objective of this research was to build a composite non-financial disclosure index at the level of the sample companies using the analysis in main components for categorical variables for the period 2017–2019 based on panel data. The analysis was performed for 60 companies listed on the BSE from eight branches of activity for the investigated period. The empirical results of the analysis in main components for categorical data highlighted the existence of three main components that recover 71.82% of the variance of the original variables as follows. First, there is a sustainability component that recovers most of the variance of original data targets environmental, personnel, and issues related to waste management. The second is an economic component that aims at the transparency of trade policies. The last component that represents a governance component that refers to issues related to social responsibility and other corporate governance responsibilities.
Analyzing the values of the average non-financial disclosure index calculated for the period 2017–2019, OMV Petrom, Transgaz, and Electrica, took the first places while at the opposite pole are Mecanica Fina, Socep, and Electrocontact. During the analyzed period, there is a slight increase in the degree of non-financial disclosure at the level of the sampled companies from 47 units in 2017 to 52 units in 2019. The empirical results of the Kruskal-Wallis test applied to examine if there are significant differences in the average non-financial disclosure index (ESEGindex) but also its components, depending on the type of industry in which the company operates have highlighted significant differences at a level of significance of 5.5% for ESEG, CP1, and CP3. Thus, there are differences between the different sectors both in terms of the average non-financial disclosure index and in terms of environmental, personnel, and waste management issues, as well as those related to social responsibility and other corporate governance responsibilities.
And at the level of the three years, there are differences between the different sectors in terms of the non-financial disclosure index. Thus, the extractive industry, hotels, and restaurants, but also professional and technical-scientific activities and wholesale and retail trade have registered throughout the three years continuous increases in the degree of non-financial disclosure, while the production and supply of electricity, thermal, gas, hot water, and air conditioning, construction, transportation and storage, and the manufacturing industry marked slight declines in this non-financial disclosure index.
The analysis of the relationship between the existence of the non-financial statement and the non-financial disclosure index for the period 2017–2019, highlighted significant differences between the two groups of companies in terms of the degree of non-financial disclosure depending on the presence or absence of the non-financial statement, for all three years of the analysis. Consequently, companies that registered this type of statement also have a much higher degree of disclosure, but also the existence of a statistically significant positive correlation at the significance threshold of 1% and the average intensity between the degree of non-financial disclosure of the company and the existence of the non-financial statement or report.
The results of the study highlighted that there is a slow but steady progress of Romanian companies in reporting and disclosing non-financial sustainability indicators. We consider that the progress registered by the analyzed companies in reporting and disclosing ESEG information, it will positively influence the sustainability reporting and will ultimately lead to a higher quality of information reported by Romanian companies and implicitly increasing the credibility of investors and other stakeholders in their business.
The results of this research may have implications for policymakers, showing them the current state of the content of non-financial and sustainable reporting. It may also be useful for companies that may use our results to identify usable benchmarks to compare their approach to disclosing non-financial indicators with those of other competitors operating in the same or other sectors.
There are also research limitations, one may be related to the scoring method used for measuring non-financial and sustainable indicators, as well as the sample selection limited to Romanian companies and only those listed on BSE. These limits may outline the future development of other studies. The extension of the sampled companies to those that are not listed on the stock exchange, but also to other companies from Central and Eastern Europe, will be the subject of another research. Thus, we could identify possible differences and similarities in the disclosure behavior of companies. At the same time, the study deserves to be extended to identify possible correlations between the ESEG disclosure index and financial performance measurement indicators.
Author Contributions
Conceptualization, M.B. and V.B.; data curation, D.N.P. and V.B.; formal analysis, M.B. and D.N.P.; methodology, M.B.; writing—original draft preparation, M.B.; writing—review and editing, V.B., M.B., and D.N.P. All authors have read and agreed to the published version of the manuscript.
Funding
This research received no external funding.
Data Availability Statement
The data presented in this study are available upon request from the corresponding author.
Acknowledgments
This article has been partially supported through the project “SmartDoct—High-quality programs for doctoral students and postdoctoral researchers of the University of Oradea for increasing the relevance of research and innovation in the context of the regional economy”, ID/project code: 123008, co-financed by the European Social Fund through The Human Capital Operational Program 2014–2020.
Conflicts of Interest
The authors declare no conflict of interest.
Appendix A

Figure A1.
The non-financial disclosure index at the level of the sampled companies in the period 2017–2019.
References
- Hurghiş, R. Raportarea integrată şi caracteristicile consiliului de administraţie. Audit Financ. 2017, 15, 21–30. [Google Scholar]
- Marinescu, A.O. Analysis on the Compliance of Sustainability Reports of Romanian Companies with GRI Conceptual Framework. Audit Financ. 2020, 18, 361–375. [Google Scholar] [CrossRef]
- Rajesh, R. Exploring the Sustainability Performances of Firms Using Environmental, Social, and Governance scores. J. Clean. Prod. 2020, 247, 119600. [Google Scholar] [CrossRef]
- Nechita, E.; Manea, C.L.; Irimescu, A.M.; Nichita, E.M. The Content Analysis of Reporting on Sustainable Development Goals. Audit Financ. 2020, 18, 831–854. [Google Scholar] [CrossRef]
- Delcea, L.; Simut, R.; Borma, A. The Analysis of the Economical Development of Romanias North-West Region. In Revista Economica; Lucian Blaga University of Sibiu, Faculty of Economic Sciences: Sibiu, Romania, 2012; Volume 1, pp. 243–250. [Google Scholar]
- De Lucia, C.; Pazienza, P.; Bartlett, M. Does Good ESG Lead to Better Financial Performances by Firms? Machine Learning and Logistic Regression Models of Public Enterprises in Europe. Sustainability 2020, 12, 5317. [Google Scholar] [CrossRef]
- Badulescu, D.; Badulescu, A. Financial Constraints Facing SMEs: Some Theory and Evidence. Metal. Int. 2010, 15, 169–173. [Google Scholar]
- European Union. Directive 2014/95/UE of the European Parliament and of the Council of 22 October 2014 Amending Directive 2013/34/UE as Regards Disclosure of Non-Financial and Diversity Information by Certain Large Undertakings and Groups. Available online: https://eur-lex.europa.eu/legal-content/EN/TXT/?uri=CELEX%3A32014L0095 (accessed on 25 January 2021).
- Tiron-Tudor, A.; Hurghis, R.; Lacurezeanu, R.; Podoaba, L. The Level of European Companies’ Integrated Reports Alignment to the <IR> Framework: The Role of Boards’ Characteristics. Sustainability 2020, 12, 8777. [Google Scholar] [CrossRef]
- Raucci, D.; Tarquinio, L. Sustainability Performance Indicators and Non-Financial Information Reporting. Evidence from the Italian Case. Adm. Sci. 2020, 10, 13. [Google Scholar] [CrossRef]
- Romolini, A.; Fissi, S.; Gori, E. Exploring Integrated Reporting Research: Results and Perspectives. Int. J. Account. Financ. Rep. 2017, 7, 32–59. [Google Scholar] [CrossRef]
- Leuz, C.; Wysocki, P.D. The economics of disclosure and financial reporting regulation: Evidence and suggestions for future research. J. Account. Res. 2016, 54, 525–622. [Google Scholar] [CrossRef]
- Order of the Minister of Public Finance no. 1938/2016 for Amending and Supplementing Accounting Regulations, Bucharest. Available online: https://static.anaf.ro/static/10/Anaf/legislatie/OMFP_1938_2016.pdf (accessed on 25 January 2021).
- Order of the Minister of Public Finance no. 3456/2018 for Amending and Supplementing Accounting Regulations, Bucharest. Available online: https://static.anaf.ro/static/10/Anaf/legislatie/OMFP_3456_2018.pdf (accessed on 25 January 2021).
- Order of the Minister of Public Finance no. 1802/2014 for the Approval of the Accounting Regulations Regarding the Individual and Consolidated Financial Statements, Bucharest. Available online: https://static.anaf.ro/static/10/Anaf/legislatie/OMFP_1802_2014.pdf (accessed on 15 April 2021).
- Order of the Minister of Public Finance no. 2844/2016 for the Approval of Accounting Regulations in Accordance with International Financial Standards Reporting, Bucharest. Available online: https://static.anaf.ro/static/10/Anaf/legislatie/OMFP_2844_2016.pdf (accessed on 15 April 2021).
- CNVM. Regulation no. 1/2006 Regarding the Issuers and the Transactions with Securities, Bucharest. Available online: http://asfromania.ro/files/capital/regulamente/2006/Regulamentul-01-2006.pdf (accessed on 15 April 2021).
- ASF. Regulation no. 5/2018 Regarding Issuers of Financial Instruments and Market Operations, Bucharest. Available online: https://asfromania.ro/files/capital/regulamente/2018/Regulament%205%202018_MOF.pdf (accessed on 15 April 2021).
- Parmar, B.L.; Freeman, R.E.; Harrison, J.S.; Wicks, A.C.; Purnell, L.; De Colle, S. Stakeholder Theory: The State of the Art. Acad. Manag. Ann. 2010, 4, 403–445. [Google Scholar] [CrossRef]
- Freeman, R.E. Strategic Management: A Stakeholder Approach; Pitman: Boston, MA, USA, 1984. [Google Scholar]
- Walsh, J.P. Taking Stock of Stakeholder Management. Acad. Manag. Rev. 2005, 30, 426–438. Available online: www.jstor.org/stable/20159128 (accessed on 16 April 2021). [CrossRef]
- Freeman, R.E.; Harrison, J.; Wicks, A. Managing for Stakeholders: Business in the 21st Century; Yale University Press: New Haven, CT, USA, 2007. [Google Scholar]
- Hill, C.W.; Jones, T.M. Stakeholder-Agency Theory. J. Manag. Stud. 1992, 29, 131–154. [Google Scholar] [CrossRef]
- Choi, J.; Wang, H. Stakeholder Relations and the Persistence of Corporate Financial Performance. Strateg. Manag. J. 2009, 30, 895–907. [Google Scholar] [CrossRef]
- Duran, I.J.; Rodrigo, P. Why Do Firms in Emerging Markets Report? A Stakeholder Theory Approach to Study the Determinants of Non-Financial Disclosure in Latin America. Sustainability 2018, 10, 3111. [Google Scholar] [CrossRef]
- Reverte, C. Determinants of Corporate Social Responsibility Disclosure Ratings by Spanish Listed Firms. J. Bus. Ethics 2009, 88, 351–366. [Google Scholar] [CrossRef]
- Gallego-Alvarez, I.; Ortas, E.; Vicente-Villardón, J.L.; Álvarez-Etxeberria, I. Institutional Constraints, Stakeholder Pressure and Corporate Environmental Reporting Policies. Bus. Strategy Environ. 2017, 26, 807–825. [Google Scholar] [CrossRef]
- Goettsche, M.; Steindl, T.; Gietl, S. Do Customers Affect the Value Relevance of Sustainability Reporting? Empirical Evidence on Stakeholder Interdependence. Bus. Strategy Environ. 2016, 25, 149–164. [Google Scholar] [CrossRef]
- Fernandez-Feijoo, B.; Romero, S.; Ruiz, S. Effect of Stakeholders’ Pressure on Transparency of Sustainability Reports within the GRI Framework. J. Bus. Ethics 2014, 122, 53–63. [Google Scholar] [CrossRef]
- Neville, B.A.; Bell, S.J.; Whitwell, G.J. Stakeholder Salience Revisited: Refining, Redefining, and Refueling an Underdeveloped Conceptual Tool. J. Bus. Ethics 2011, 102, 357–378. [Google Scholar] [CrossRef]
- Mitchell, R.K.; Agle, B.R.; Wood, D.J. Toward a Theory of Stakeholder Identification and Salience: Defining the Principle of Who and What Really Counts. Acad. Manag. Rev. 1997, 22, 853–886. [Google Scholar] [CrossRef]
- Liu, X.; Anbumozhi, V. Determinant Factors of Corporate Environmental Information Disclosure: An Empirical Study of Chinese Listed Companies. J. Clean. Prod. 2009, 17, 593–600. [Google Scholar] [CrossRef]
- Muttakin, M.B.; Khan, A. Determinants of Corporate Social Disclosure: Empirical Evidence from Bangladesh. Adv. Account. 2014, 30, 168–175. [Google Scholar] [CrossRef]
- CIMA. Sustainable Development Goals and the Role of the Accountant. 2018. Available online: https://www.cimaglobal.com/Research--Insight/sustainable-development-goals-and-the-role-of-the-accountant/ (accessed on 10 February 2021).
- Ruan, L.; Liu, H. Environmental, Social, Governance Activities and Firm Performance: Evidence from China. Sustainability 2021, 13, 767. [Google Scholar] [CrossRef]
- Lemke, C.; Bastini, K. Embracing Multiple Perspectives of Sustainable Development in a Composite Measure: The Multilevel Sustainable Development Index. J. Clean. Prod. 2020, 246, 118884. [Google Scholar] [CrossRef]
- Akbas, H.E. The Relationship Between Board Characteristics and Environmental Disclosure: Evidence from Turkish Listed Companies. SE Eur. J. Econ. Bus. 2016, 11, 7–19. [Google Scholar] [CrossRef]
- Wirth, H.; Kulczycka, J.; Hausner, J.; Koński, M. Corporate Social Responsibility: Communication About Social and Environmental Disclosure by Large and Small Copper Mining Companies. Resour. Policy 2016, 49, 53–60. [Google Scholar] [CrossRef]
- Cho, C.H.; Michelon, G.; Patten, D.M.; Roberts, R.W. CSR Disclosure: The More Things Change…? Account. Audit. Account. J. 2015, 28, 14–35. [Google Scholar] [CrossRef]
- Chen, Y.C.; Hung, M.; Wang, Y. The Effect of Mandatory CSR Disclosure on Firm Profitability and Social Externalities: Evidence from China. J. Account. Econ. 2018, 65, 169–190. [Google Scholar] [CrossRef]
- Tarquinio, L.; Posadas, S.C.; Pedicone, D. Scoring Nonfinancial Information Reporting in Italian Listed Companies: A Comparison of before and after the Legislative Decree 254/2016. Sustainability 2020, 12, 4158. [Google Scholar] [CrossRef]
- Manes-Rossi, F.; Tiron-Tudor, A.; Nicolò, G.; Zanellato, G. Ensuring More Sustainable Reporting in Europe Using Non-Financial Disclosure—De Facto and De Jure Evidence. Sustainability 2018, 10, 1162. [Google Scholar] [CrossRef]
- Doni, F.; Bianchi-Martini, S.; Corvino, A.; Mazzoni, M. Voluntary Versus Mandatory Non-financial Disclosure: EU Directive 95/2014 and Sustainability Reporting Practices Based on Empirical Evidence from Italy. Meditari Account. Res. 2019, 28, 781–802. [Google Scholar] [CrossRef]
- Venturelli, A.; Caputo, F.; Leopizzi, R.; Pizzi, S. The State of Art of Corporate Social Disclosure Before the Introduction of Non-financial Reporting Directive: A Cross Country Analysis. Soc. Responsib. J. 2018, 15, 409–423. [Google Scholar] [CrossRef]
- Venturelli, A.; Pizzi, S.; Caputo, F.; Principale, S. The Revision of Nonfinancial Reporting Directive: A Critical Lens on the Comparability Principle. Bus. Strategy Environ. 2020, 29, 1–14. [Google Scholar] [CrossRef]
- Nicolò, G.; Zanellato, G.; Tiron-Tudor, A. Integrated Reporting and European State-Owned Enterprises: A Disclosure Analysis Pre and Post 2014/95/EU. Sustainability 2020, 12, 1908. [Google Scholar] [CrossRef]
- Tiron-Tudor, A.; Nistor, C.S.; Ștefănescu, C.A.; Zanellato, G. Encompassing Non-Financial Reporting in A Coercive Framework for Enhancing Social Responsibility: Romanian Listed Companies’ Case. Amfiteatru Econ. 2019, 21, 590–606. [Google Scholar] [CrossRef]
- Balatbat, M.; Siew, R.; Carmichael, D. ESG Scores and Its Influence on Firm Performance: Australian Evidence. In Australian School of Business School of Accounting, School of Accounting Seminar Series Semester; University of New SouthWales: Sydney, Australia, 2012; Volume 2, pp. 1–30. [Google Scholar]
- Zhao, C.; Guo, Y.; Yuan, J.; Wu, M.; Li, D.; Zhou, Y.; Kang, J. ESG and Corporate Financial Performance: Empirical Evidence from China’s Listed Power Generation Companies. Sustainability 2018, 10, 2607. [Google Scholar] [CrossRef]
- Li, Y.; Gong, M.; Zhang, X.Y.; Koh, L. The Impact of Environmental, Social, and Governance Disclosure on Firm Value: The Role of CEO Power. Brit Account. Rev. 2018, 50, 60–75. [Google Scholar] [CrossRef]
- Sila, I.; Cek, K. The Impact of Environmental, Social and Governance Dimensions of Corporate Social Responsibility on Economic Performance: Australian Evidence. Procedia Comput. Sci. 2017, 120, 797–804. [Google Scholar] [CrossRef]
- McWilliams, A.; Siegel, D. Corporate Social Responsibility and Financial Performance: Correlation or Misspecification? Strateg. Manag. J. 2000, 21, 603–609. [Google Scholar] [CrossRef]
- Peiris, D.; Evans, J. The Relationship between Environmental Social Governance Factors and U.S. Stock Performance. J. Investig. 2010, 19, 104–112. [Google Scholar] [CrossRef]
- Choi, J.S.; Kwak, Y.M.; Choe, C. Corporate Social Responsibility and Corporate Financial Performance: Evidence from Korea. Aust. J. Manag. 2010, 35, 291–311. [Google Scholar] [CrossRef]
- Han, J.J.; Kim, H.J.; Yu, J. Empirical Study on Relationship between Corporate Social Responsibility and Financial Performance in Korea. Asian J. Sustain. Soc. Responsib. 2016, 1, 61–76. [Google Scholar] [CrossRef]
- Margolis, J.; Elfenbein, H.A.; Walsh, J. Does It Pay to Be Good... and Does It Matter? A Meta-Analysis of the Relationship between Corporate Social and Financial Performance. Available online: https://ssrn.com/abstract=1866371 (accessed on 25 January 2021).
- Oncioiu, I.; Petrescu, A.G.; Bîlcan, F.R.; Petrescu, M.; Popescu, D.M.; Anghel, E. Corporate Sustainability Reporting and Financial Performance. Sustainability 2020, 12, 4297. [Google Scholar] [CrossRef]
- Paun, D. Sustainability and Financial Performance of Companies in the Energy Sector in Romania. Sustainability 2017, 9, 1722. [Google Scholar] [CrossRef]
- Rastogi, R.; Jaiswal, R.; Jaiswal, R.K. Renewable Energy Firm’s Performance Analysis Using Machine Learning Approach. Procedia Comput. Sci. 2020, 175, 500–507. [Google Scholar] [CrossRef]
- Kurochkina, I.; Shuvalova, E.; Novozhilova, I. About Formation of the Integrated Reporting Performance in the Process of Building a Sustainable Business of Transport and Communication Companies. Procedia Eng. 2017, 178, 267–277. [Google Scholar] [CrossRef]
- Yoon, B.; Lee, J.H.; Byun, R. Does ESG Performance Enhance Firm Value? Evidence from Korea. Sustainability 2018, 10, 3635. [Google Scholar] [CrossRef]
- Baboukardos, D. The Valuation Relevance of Environmental Performance Revisited: The Moderating Role of Environmental Provisions. Brit Account. Rev. 2018, 50, 32–47. [Google Scholar] [CrossRef]
- Ielasi, F.; Ceccherini, P.; Zito, P. Integrating ESG Analysis into Smart Beta Strategies. Sustainability 2020, 12, 9351. [Google Scholar] [CrossRef]
- Achim, M.V.; Borlea, S.N. Developing of ESG Score to Assess the Non-financial Performances in Romanian Companies. Procedia Econ. Financ. 2015, 32, 1209–1224. [Google Scholar] [CrossRef]
- Oprean-Stan, C.; Oncioiu, I.; Iuga, I.C.; Stan, S. Impact of Sustainability Reporting and Inadequate Management of ESG Factors on Corporate Performance and Sustainable Growth. Sustainability 2020, 12, 8536. [Google Scholar] [CrossRef]
- Berrone, P.; Gomez-Mejia, L.R. Environmental Performance and Executive Compensation: An Integrated Agency-Institutional Perspective. Acad. Manag. J. 2009, 52, 103–126. [Google Scholar] [CrossRef]
- Garcia, S.; Cintra, Y.; Torres, R.C.S.R.; Lima, F.G. Corporate Sustainability Management: A Proposed Multi-criteria Model to Support Balanced Decision-Making. J. Clean. Prod. 2016, 136, 181–196. [Google Scholar] [CrossRef]
- Haţegan, C.D.; Sirghi, N.; Curea-Pitorac, R.I.; Hategan, V.P. Doing Well or Doing Good: The Relationship between Corporate Social Responsibility and Profit in Romanian Companies. Sustainability 2018, 10, 1041. [Google Scholar] [CrossRef]
- Mocan, M.; Rus, S.; Draghici, A.; Ivascu, L.; Turi, A. Impact of Corporate Social Responsibility Practices on the Banking Industry in Romania. Procedia Econ. Financ. 2015, 23, 712–716. [Google Scholar]
- Brammer, S.; Brooks, C.; Pavelin, S. Corporate Social Performance and Stock Returns: UK Evidence form Disaggregate Measures. Financ. Manag. 2006, 35, 97–116. [Google Scholar] [CrossRef]
- Lee, D.; Faff, R. Corporate Sustainability Performance and Idiosyncratic Risk: A Global Perspective. Financ. Rev. 2009, 44, 213–237. [Google Scholar] [CrossRef]
- Friede, G.; Busch, T.; Bassen, A. ESG and financial performance: Aggregated evidence from more than 2000 empirical studies. J. Sustain. Financ. Invest. 2015, 5, 210–233. [Google Scholar] [CrossRef]
- Cek, K.; Eyupoglu, S. Does Environmental, Social and Governance Performance Influence Economic Performance? J. Bus. Econ. Manag. 2020, 21, 1165–1184. [Google Scholar] [CrossRef]
- Broadstock, D.C.; Collins, A.; Hunt, L.C.; Vergos, K. Voluntary Disclosure, Greenhouse Gas Emissions and Business Performance: Assessing the First Decade of Reporting. Br. Account. Rev. 2018, 50, 48–59. [Google Scholar] [CrossRef]
- Eccles, R.G. The Importance of the Healthcare Sector to the Sustainable Development Goals. Forbes 2018. Available online: https://www.forbes.com/sites/bobeccles/2018/07/01/the-importance-of-the-healthcare-sector-to-the-sustainable-development-goals/?sh=38e0ff8b67a3 (accessed on 10 February 2021).
- Mojarad, A.A.S.; Atashbari, V.; Tantau, A. Challenges for Sustainable Development Strategies in Oil and Gas Industries. In Proceedings of the 12th International Conference on Business Excellence, Bucharest, Romania, 22–23 March 2018; Sciendo: Warszawa, Poland, 2018; Volume 12, pp. 626–638. [Google Scholar]
- Fuso-Nerini, F.; Tomei, J.; To, L.S.; Bisaga, I.; Parikh, P.; Black, M.; Borrion, A.; Spataru, C.; Castán Broto, V.; Anandarajah, G.; et al. Mapping Synergies and Trade-Offs Between Energy and the Sustainable Development Goals. Nat. Energy 2018, 3, 10–15. [Google Scholar] [CrossRef]
- Dumitru, M.; Dyduch, J.; GuȘe, R.G.; Krasodomska, J. Corporate Reporting Practices in Poland and Romania–An Ex-ante Study to the New Non-financial Reporting European Directive. Account. Eur. 2017, 14, 279–304. [Google Scholar] [CrossRef]
- Rivera-Arrubla, Y.A.; Zorio-Grima, A.; García-Benau, M.A. Integrated Reports: Disclosure Level and Explanatory Factors. Soc. Responsib. J. 2017, 13, 155–176. [Google Scholar] [CrossRef]
- Sierra-Garcia, L.; Garcia-Benau, M.A.; Bollas-Araya, H.M. Empirical Analysis of Non-Financial Reporting by Spanish Companies. Adm. Sci. 2018, 8, 29. [Google Scholar] [CrossRef]
- García-Sánchez, I.M.; Noguera-Gámez, L. Integrated reporting and stakeholder engagement: The effect on information asymmetry. Corp. Soc. Responsib. Environ. Manag. 2017, 24, 395–413. [Google Scholar] [CrossRef]
- Campbell, D. A Longitudinal and Cross-Sectional Analysis of Environmental Disclosure in UK Companies—A Research Note. Br. Account. Rev. 2004, 36, 107–117. [Google Scholar] [CrossRef]
- Linting, M.; Van der Kooij, A. Nonlinear Principal Components Analysis with CATPCA: A Tutorial. J. Pers. Assess. 2012, 94, 12–25. [Google Scholar] [CrossRef]
- Saukani, N.; Ismail, N.A. Identifying the Components of Social Capital by Categorical Principal Component Analysis (CATPCA). Soc. Indic. Res. 2019, 141, 631–655. [Google Scholar] [CrossRef]
- Šulc, Z.; Řezanková, H. Dimensionality Reduction of Categorical Data: Comparison of HCA and CATPCA Approaches. In Proceedings of the 18th International Scientific Conference Applications of Mathematics and Statistics in Economics (AMSE), Jindrichuv Hradec, Czech Republic, 2–6 September 2015. [Google Scholar]
- Coco, G.; Russo, M.A. Using CATPCA to Evaluate Market Regulation. In Data Analysis, Classification and the Forward Search; Studies in Classification, Data Analysis, and Knowledge Organization; Zani, S., Cerioli, A., Riani, M., Vichi, M., Eds.; Springer: Berlin/Heidelberg, Germany, 2006; pp. 369–376. [Google Scholar]
- Nunnally, J.C. An Overview of Psychological Measurement. In Clinical Diagnosis of Mental Disorders; Wolman, B.B., Ed.; Springer: Boston, MA, USA, 1978; pp. 97–146. [Google Scholar]
Publisher’s Note: MDPI stays neutral with regard to jurisdictional claims in published maps and institutional affiliations. |
© 2021 by the authors. Licensee MDPI, Basel, Switzerland. This article is an open access article distributed under the terms and conditions of the Creative Commons Attribution (CC BY) license (https://creativecommons.org/licenses/by/4.0/).