Abstract
The dynamic voltage restorer (DVR) combined with a photovoltaic–thermoelectric generator (PV-TEG) system is proposed for voltage disturbance compensation in the three-phase four-wire distribution system. The PV-TEG hybrid energy source is used in the DVR system to improve the system ability for deep and long-period power quality disturbance compensation. In addition, the DVR will save grid energy consumption when the hybrid PV-TEG module generates sufficient power to meet the load demand. An enhanced variable factor adaptive fuzzy logic controller (VFAFLC)-based maximum power point tracking (MPPT) control scheme is proposed to extract the maximum possible power from the PV module. Since the PV and TEG combine a hybrid energy source for generating power, the DVR can work efficiently for the voltage sag/swell, outage compensation, and energy conservation mode with minimum energy storage facilities. The in-phase compensation method and the three-leg voltage source inverter (VSI) circuit are chosen in the present system for better voltage and/or power compensation. To confirm the effectiveness of the proposed hybrid PV-TEG integrated DVR system, a simulation-based investigation is carried out with four different operational modes with MATLAB software. The study results confirm that the proposed DVR system can compensate power quality disturbances of the three-phase load with less total harmonics distortion (THD) and will also work efficiently under energy conservation mode to save grid energy consumption. Moreover, the proposed VFAFLC-based control technique performs better to achieve the maximum power point (MPP) quickly and accurately, thereby improving the efficiency of the hybrid energy module.
1. Introduction
Most of the recent electrical and electronic devices used in residential, commercial, and industrial buildings are quite sensitive to power supply quality. Power quality disturbances sometimes lead to adverse effects in their smooth functioning. When compared to conventional electrical loads, the modern devices that are used for the computing, communication, and monitoring systems in hospitals suffer malfunctions due to the poor power quality in the supply [1,2,3,4]. The voltage fluctuation, harmonics, supply outage, and transients are the major power quality problems that create various issues such as malfunction, overheating, reducing the life of the devices, data losses etc. [5,6,7,8]. Power quality problems, particularly voltage disturbances on the utility side, develop due to various reasons such as transmission line faults, distribution transformers, unequal single-phase loads among the three-phase supply system, connecting PV and/or wind power generation systems to the networks, and unequal system impedance [9]. Therefore, custom power devices have been widely preferred in recent years to maintain the power supply quality on the utility side. The Institute of Electrical and Electronics Engineers (IEEE) standard [10] recommends different kinds of customer devices that can be used on the customer side to prevent sensitive loads in the power quality issues [11,12,13].
A dynamic voltage restorer (DVR) is a custom power device that provides preferable solutions to power quality problems, and thereby the malfunctions with sensitive loads can be prevented. DVR is a power electronics device-based voltage source inverter generally connected at the utilization side to sustain the quality of the supply by injecting the necessary voltage and/or power to the load [14,15]. A DVR is primarily used to compensate power quality disturbances such as voltage swell/sag, harmonics, and outages [16]. The voltage compensation is made by injecting the voltage with the required phase angle, magnitude, and frequency on the utility side. The appropriate topology and control method is required for the DVR to achieve the correct amplitude and phase of the injecting voltage to prevent the load from forming disturbances. Many topology and control methods have been recommended for the compensation of power quality disturbances in the literature [17,18,19]. The well-accepted control methods are (i) the zero active power injection method, (ii) in-phase voltage compensation, and (iii) compensation using pre-sag voltage. The in-phase voltage compensation method is widely preferred because the amount of power required for the compensation is reasonably less when compared to other methods. The different types of topologies and control methods used in DVR for power quality disturbances can be found in [20].
In general, a DVR will perform compensation for a short amount of time and for lesser amplitude disturbances due to the limited energy storage facility. However, a DVR combined with energy systems such as photovoltaic (PV), wind power, etc., can possibly be used for a long time and for high amplitude voltage compensation. Currently, the installation of standalone PV systems for residential as well as commercial buildings is increasing due to various incentive schemes offered by the government in several countries. A standalone PV system installed in the utility area is used to supply the required power for the consumer loads directly, while at the same time minimizing the energy utilization from the grid, thereby reducing the electricity tariff for the consumers. Recent research has focused on integrating a standalone PV system with a DVR to enhance the power quality disturbance compensation [21,22,23,24,25]. The main drawback in the conventional finite compensation is limited energy storage, which can be eliminated by including the renewable energy source with the DVR system. At the same time, the renewable energy system needs improvement in the energy efficiency part to support the DVR for better power quality disturbance compensation. The conversion efficiency of the renewable energy system could be improved by implementing an effective maximum power point (MPP) tracking algorithm to extract and maintain maximum power with minimal losses. In addition, the use of a hybrid renewable energy system will always be preferable for obtaining sufficient power output.
This research study aims to implement a hybrid photovoltaic- thermoelectric generator (PV-TEG) integrated DVR system to maintain the supply power quality of a three-phase distribution system on the utility side. The proposed system will operate under energy conservation mode to save grid energy consumption with the support of the hybrid PV-TEG energy source. The TEG is combined with the PV array to improve the energy conversion efficiency of the solar energy conversion system by utilizing the waste heat energy produced on the PV panel for extra power generation and to reduce the PV cell temperature with the TEG and heat sink arrangement. The adaptive fuzzy logic controller (FLC) based maximum power point tracking (MPPT) control algorithm and the DC-DC boost converter circuit is used to extract the maximum power quickly from the PV array and to maintain stable power output. The in-phase voltage compensation method and the three-phase three-leg voltage source inverter (VSI) circuit are chosen for the voltage disturbance compensation with correct amplitude, frequency, and phase angle. The ability of the proposed PV-TEG combined DVR system is confirmed through an extensive simulation with five different case studies.
2. Description of the PV-TEG Integrated DVR System Configuration
The hybrid PV-TEG integrated DVR system is proposed to ensure the quality of the supply delivered to the three-phase sensitive loads that are connected on the utility side. The block diagram of the proposed system configuration is depicted in Figure 1. The DVR system is designed to compensate for the power quality disturbances as well as to conserve the grid energy consumption by consumers using an adequate power output of the PV-TEG hybrid energy module.
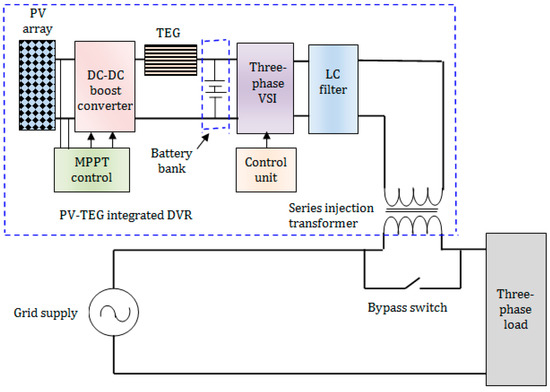
Figure 1.
The block diagram of the hybrid photovoltaic–thermoelectric generator (PV-TEG) integrated photovoltaic–thermoelectric generator (DVR) system.
2.1. The Hybrid PV-TEG Module
In general, most of the classic DVRs are used to mitigate the supply voltage disturbances only for a short duration because of limited energy storage facilities. However, a DVR can be used for deep and long-period power quality disturbance compensation by integrating renewable energy sources. In the case of the standalone PV array, a major part of the solar irradiation is converted into waste heat energy, so the energy efficiency of the system is considerably low. When comparing the capital investment, the amount of electricity procured from the PV array is not cost effective. Therefore, the use of a PV array for DVR operation may not be economically feasible. In this context, the proposed study uses a TEG to utilize the waste heat energy produced around the PV panel due to the incident solar irradiation for additional power generation. Furthermore, a TEG arranged with heat sinks will reduce the working temperature of the PV, and thus the energy efficiency of the PV array is improved. In the proposed system configuration, the TEG with a heat sink arrangement is mounted on the backside of the PV panel so that the temperature of the PV panel gets reduced at the same time the TEG uses the waste heat energy to produce additional electricity. A typical arrangement of the PV and TEG in the hybrid scheme is shown in Figure 2. In the proposed configuration, the PV and TEG are connected electrically in a series to provide a sufficient voltage output and to support the DVR for long-term and high-amplitude voltage compensation. The major functional blocks of the PV-TEG integrated DVR system are explained in the following sections.
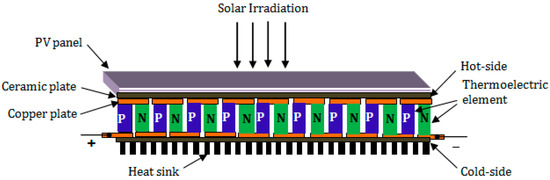
Figure 2.
A typical structure of the hybrid PV-TEG module.
2.2. The TEG Model
A TEG is a combination of several thermocouples and each thermocouple is made with a pair of thermoelectric elements (TEs) of n-type and p-type materials. The thermocouples are arranged in a series based on the required voltage and power output. The electrical equivalent circuit of the TEG is shown in Figure 3. The voltage induced in a thermocouple (Eteg) is expressed as
where Tc and Th are the temperatures on the cold side and hot side, respectively, in K. The Seebeck coefficient S can be given as [26]
where NT denotes the total number of thermocouples, and αn and αp are the Seebeck coefficients related to the n-type and p-type materials, respectively, in V/K. Using the equivalent circuit from Figure 3, the current flow (Iteg) is expressed as
where Rint is the TEG module internal resistance and RL is the load resistance. The output power produced by the TEG module is given as
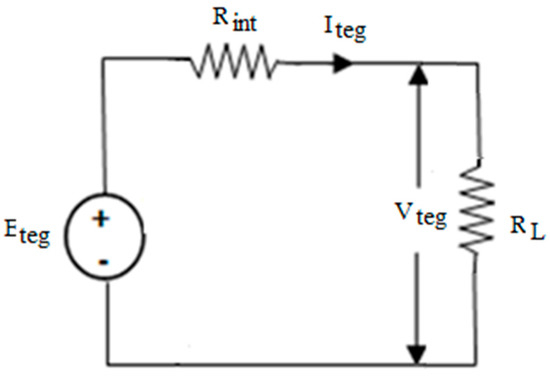
Figure 3.
The electrical equivalent circuit of the TEG.
A TEG module is usually made with a number of series-connected thermocouples, and the resistance Rint for NT number of thermocouples in a TEG module can be determined using Equation (5). The thermal conductance (kT) of the TEG module is given by Equation (6)
where σn and σp are the n-type and p-type materials’ electrical conductivity in S/m, respectively, kn and kp are the n-type and p-type materials’ thermal conductivities in W/mK, respectively, An and Ap are the n-type and p-type thermoelectric element cross-sectional areas in m2, respectively, and Ln and Lp are the n-type and p-type thermoelectric element lengths in m, respectively.
The familiar bismuth telluride (Bi2Te3)-type thermocouple was selected for the proposed system. Using the thermal and electrical properties, the model of the TEG was developed. The design parameters of the Bi2Te3 thermocouple are illustrated in Table 1. The validation of the TEG model was confirmed by comparing its electrical properties with the existing Bi2Te3 thermocouple study results in [27]. The electrical properties of the TEG were tested for the temperature difference of 0 to 40 K with the assumed numbers of thermocouples (NT) as 90, as shown in Figure 4. For the study purpose, a load resistance was chosen that was equal to the internal resistance (Rint) value of 1.59 ohm, which was obtained from Equation (5). From Figure 4, it was observed that the output voltage (Vteg) and power (Pteg) of the TEG were directly dependent on the temperature difference and the induced voltage (Eteg) was almost double the amount of Vteg, which confirmed the maximum power transfer theory and satisfied Equation (4). To regulate the output voltage, a low step-up DC-DC boost converter was included in the TEG module. The operation of the boost converter is described with a simple circuit diagram, as shown in Figure 5. The diode (D) is reverse biased when the S switch is on and the inductor (L) stores the energy during the period (TON) from the source. The voltage across the inductor (VI) corresponding to this mode can be given as

Table 1.
The design parameters of the Bi2Te3 thermocouple.
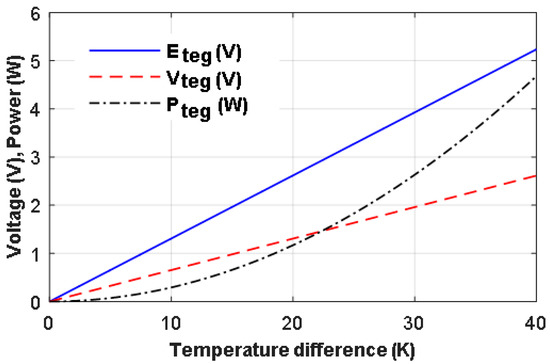
Figure 4.
The electrical characteristic of the thermoelectric generator.
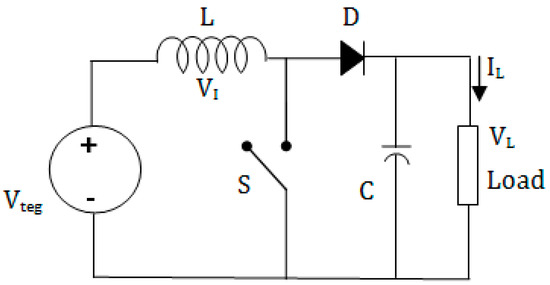
Figure 5.
The low step-up DC-DC boost converter.
When the S switch is off, the diode is forward biased and the inductor current starts to flow via the diode to the load for a period (TOFF). The output voltage (VL) corresponding to this mode is expressed as
The average output voltage of the converter is determined using the following expression
where D is the duty cycle of the DC-DC boost converter circuit. In the current study, a fixed value of 0.5 was used for the duty cycle. The power output of the TEG module can be calculated using Equation (4). In the proposed system configuration, the TEG module is connected in a series with the PV module, hence the current flow due to the PV module is also taken into consideration while calculating the DC-DC boost converter circuit parameters. The parameters’ value of the DC-DC boost converter used in the present study were inductor = 5.37 µH and capacitor = 175 µF.
2.3. The PV Cell Model
The PV array usually consists of many PV cells. The number of parallel and series-connected PV cells desire the output voltage and power [28]. The electrical equivalent circuit of the PV cell is shown in Figure 6. The current flow in a PV cell is given as
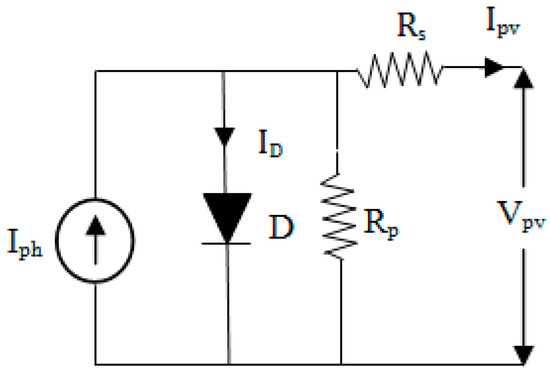
Figure 6.
The electrical equivalent circuit of the PV cell.
By considering the parallel and series-connected PV cells the above expression is rewritten as
where Iph denotes the photocurrent in A, ID denotes the diode current in A, Isat denotes the reverse saturation current in A, Vpv denotes the voltage output in V, q denotes the electron charge in C, k represents the Boltzmann constant, T denotes the junction temperature of the PV cell in K, A denotes the diode ideality factor, and np and ns are the numbers of parallel and series-connected PV cells, respectively. The Isat is sensitive to the T, which is expressed as
where Tref denotes the standard temperature in K, Is denotes the short-circuit current at Tref in A, Irev denotes the reverse saturation current at Tref in A, e denotes the energy in the energy gap, ks denotes the temperature coefficient of Is %/K, and IL is the solar irradiation in W/m2.
The design parameters of the PV cell are shown in Table 2. The important characteristics of the PV model, such as power vs. voltage (P-V) and current vs. voltage (I-V), were studied for different temperature levels with an assumed solar irradiation of 1000 W/m2 as shown in Figure 7. The PV cell characteristics indicated that the parameters were highly nonlinear and changing against temperature variation.
Table 2.
The design parameters of the PV module.
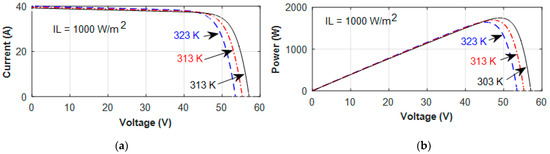
Figure 7.
The characteristics of the PV module: (a) current vs. voltage and (b) power vs. voltage.
2.4. Voltage Source Inverter (VSI)
The VSI circuit converts the DC-link voltage into AC voltage with the required amplitude, phase angle, and frequency. For the three-phase three-leg system with six switches, a VSI circuit is widely preferred. The arrangement of a typical three-leg VSI circuit for a three-phase system is shown in Figure 8. The 180° conduction mode is used for the proposed system. The switches at upper groups S1, S3, and S5 are turned on with an interval of 120°. Switch S1 is on at 0°, switch S3 is on at 120°, and switch S5 is on at 240°. The sequence of the on switch is S1, S6, and S5; S1, S6, and S2; S1, S3, and S2; S4, S3, and S2; S4, S3, and S5; and S4, S6, and S5. At each step of the 60° interval, three switches are on, two from the upper group and one from the lower group and vice versa. The three-phase voltage of the VSI circuit is given as
where Vrms is the line–line AC voltage and Vdc is the DC-link voltage.
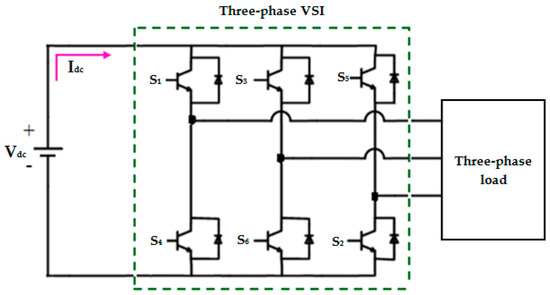
Figure 8.
The three-phase voltage source inverter (VSI) circuit.
2.5. Series Injection Transformer and Inductor-Capactor (LC) filter
A series injection was used in the DVR system to inject the voltage and/or power in the supply line during the power quality disturbance compensation. Three single-phase injection transformers were chosen, whose resistive and reactive parameters of the transformer are expressed as follows
where Vx and VR are the per-unit reactive and resistive voltage drops in V, respectively, Vp is the voltage of the injection transformer at the primary side in V, and P is the power rating of the injection transformer. The transformation ratio was chosen as 1:2 for the series injection transformer. The transformation ratio is generally selected based on the VSI circuit capability and the required injection voltage level. In order to inject the sinusoidal AC voltage, a passive LC filter is used because if the non-sinusoidal voltage is injected via the series injection transformer, the sensitive load performance is affected due to harmonics. A series inductor (LF) and shunt capacitor (CF) combined passive filter convert the output pulsated signal of the VSI circuit into a sinusoidal AC signal. The passive LC filter was included in each phase to eliminate the unwanted harmonics produced by the VSI circuit.
3. The Control Strategy Used in the Three-Phase PV-TEG DVR System
The DVR control strategy is used to detect the disturbances in the supply by comparing the measured grid voltage and generated reference voltages and then producing the correct gate pulses for the VSI circuit to perform the compensation. The exact amount of voltage and power compensation is essential for the sensitive loads connected to the distribution system to avoid any malfunctions. The in-phase voltage compensation method was chosen in the present study. The voltage injected under this compensation method is given as
The actual power required from the DC-link for the DVR during the compensation is expressed as
where ϕ denotes the phase angle between the voltage and current, and Vs, VL, and IL are the source voltage, load voltage, and load current, respectively.
3.1. Identification of Power Quality Disturbances
The prompt identification of the supply disturbances and accurate compensation are an essential requirement for a DVR. The disturbance identification process is explained using the block diagram depicted in Figure 9. The d-q transformation-based identification of the three-phase voltage Vrms is transformed into the synchronous reference frame (SRF) variables using a phase locked loop (PLL). The PLL continuously tracks the three-phase voltage and extracts its phase angle and amplitude simultaneously to detect the variation. The voltage of the distribution system after sampling is given as
where Va, Vb, and Vc are the distribution supply voltage and Vm is the maximum supply voltage. In the d-q transformation method, the voltages of each phase are transformed into Vd and Vq, which is expressed as
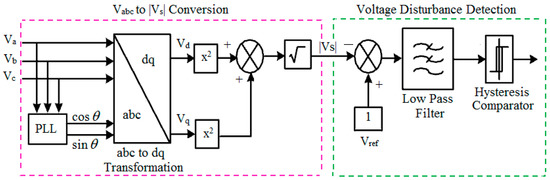
Figure 9.
The three-phase power quality disturbance detection.
Using the transformed voltages Vd and Vq, the voltage of |Vs| is determined [29] as given in Equation (25) and then the error is calculated using the expression in Equation (26). The absolute value of the error signal is applied to the hysteresis comparator to identify the voltage disturbances.
3.2. Method of Power Quality Disturbance Compensation
For the power quality disturbance compensation, the proposed study used the d-q transformation-based control algorithm. The disturbance compensation method used for the proposed system is described in Figure 10. The three-phase voltage is transformed into SRF variables dqo. If the supply voltage is unbalanced and contains harmonics then the park’s transformation is employed, which results as
where θ = ωt + ϕ, ϕ is the phase angle and ωt is the angular velocity of signals to be transformed. In the present study, a three-phase four-wire was considered so the flow of zero sequence current was prevented at the secondary winding of the transformer even there was voltage variation at the primary winding. Therefore, Equation (27) is modified by eliminating the zero-sequence current, and the resulting equation is given as
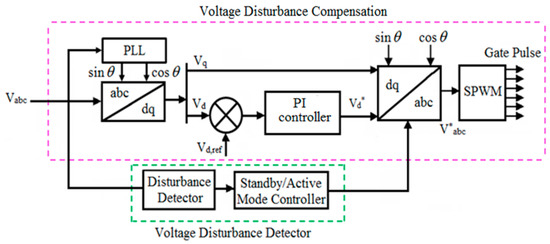
Figure 10.
The three-phase voltage disturbance compensation (Vd* is the direct axis component, V*abc is the reference voltage).
The discrete PLL is used to convert the per-unit three-phase supply voltage into Vd and Vq based on Equation (29). If the gridline voltage is normal, then the Vd = 1 and Vq = 0. The DC value of Vd is increased or dropped during the fault conditions and the error signal (Verror) is generated using the difference between the reference voltage Vd,ref and Vd, given as
The error signal (30) is transferred to the proportional-integral (PI) controller [30] to produce an output that is used by the d-q to abc transformation unit along with the Vq signals for the generation of three-phase reference voltage Vabc, which is expressed in the following equation:
The voltages Va, Vb, and Vc are modulated using the sinusoidal pulse width modulation (SPWM) technique to produce the required pulses for the VSI circuit; thus the voltage across the load is maintained at a normal level.
4. The Proposed MPPT Control Technique
The MPP tracking algorithm is a vital part of the PV system to extract the maximum power under varying environmental conditions. Well-known renewable energy sources such as PV, wind power, etc., generally have nonlinear characteristics and the system parameters usually have uncertainties due to the changing environmental factors. Hence, an effective MPP tracking algorithm is essential to obtain the possible maximum power with minimal power losses. Based on recent studies, the intelligent technique-based MPP tracking algorithms perform better than the conventional methods for extracting the maximum power efficiently [31,32,33,34,35]. The FLC is a well-accepted intelligent controller to deal with system uncertainties and nonlinearity. The FLC-based MPPT techniques are widely employed for various control applications [36,37,38,39,40]. The fast and accurate tracking of the MPP and maintaining constant power output without much oscillation are the essential requirements for the MPPT control algorithm. The classic FLC with a fixed universe of discourse and control rules may not be efficient for an uncertain and high nonlinearity system such as a PV array [41]. Adaptive fuzzy control techniques are an alternative way to achieve better control performance and have been successfully employed for MPPT control in recent years [42,43,44]. Hence, the VFAFLC-based MPPT control technique is proposed for the present study to harvest the maximum power from the PV array of the hybrid PV-TEG energy module. A variable factor γ (gamma) used in the MPPT control algorithm modifies the input linguistic variable value of the FLC according to the operating point in the power vs. voltage (P-V) curve of the PV array. The factor γ varies between 0 and 1 based on the change in voltage of the PV array. The factor γ influences the input parameter of the FLC so that the fuzzy controller is adapted according to the system parameter. Thus, a better control action could be achieved for the fast-tracking of the MPP as well as for the steady-stable output.
In the VFAFLC-based MPPT control scheme, the two-input parameters of the PV array, namely, the error and change in power at a unit time, are used. The inputs are determined using the following equations:
where Ppv and Vpv are the present instant power and voltage of the PV array, respectively, and Ppv(t − 1) and Vpv(t − 1) are the previous instant power and voltage of the PV array, respectively. From Equation (32), the FLC input linguistic variable error e(t) is influenced by factor γ, therefore the FLC chooses appropriate fuzzy sets and the related control rules based on the system operating condition. The change in voltage of the PV module is suitably converted into the range of 0 and 1 for factor γ. For example, the value of γ becomes 1 when the difference between two successive measured voltages is zero, which points out that the PV operating point is at the optimum level corresponding to the maximum power in the P-V curve. The value of γ is less than 1 (0 to 0.9) if the voltage difference is not equal to zero, which points out that the PV operating point has not reached the optimum point in the P-V curve. If the PV operating point is closer to the optimum level, in this case, the value of γ is nearly about 1. Alternatively, if the operating point is not closer to the optimum point then γ is set to a minimum fractional value. Therefore, the value of γ supports the FLC to keep a variable tracking step size based on the position of the PV operating point in the PV curve to attain MPP quickly and accurately. For instance, if the PV operating point is closer to the MPP in the P-V curve then the tracking step size will be smaller to maintain stable output without much oscillation. When compared to the classical fuzzy control, the proposed VFAFLC has better control performance for the MPPT due to the adaptive mechanism.
The effectiveness of the proposed MPPT control technique was tested for an assumed solar irradiation of 1000 W/m2 and a temperature difference of 30 K across the TEG. The test results are depicted in Figure 11a,b. It was noticed that the voltage and power outputs of the PV-TEG hybrid module reached maximum levels quickly. The variation in adapted factor γ and the corresponding controller output during this study is also shown in Figure 11c. It was observed that factor γ was promptly varied at the initial transient period and it made the FLC generate the appropriate output of the duty cycle according to Equation (32). The output of the FLC dynamically modified the duty cycle of the DC-DC converter so that the PV operating point moved towards the MPP within a short time. Once the PV operating point reached the MPP, the factor γ became 1, and thus the FLC generated a stable output, as illustrated in Figure 11c, which resulted in the power output from the energy module also reaching the maximum stable level without any oscillation. Therefore, the dynamically varying factor γ made the FLC to adapt according to the PV operating point, by which a better MPPT control was achieved in terms of speed and accuracy. The ability of the proposed MPPT control technique was also tested under varying environmental conditions and the results are shown in Figure 12 and Figure 13. Figure 12a shows the power output of the hybrid energy module for step-change in irradiation and the corresponding voltage is shown in Figure 12b. Similarly, the power and voltage parameter responses for the gradual variation of solar irradiation are shown in Figure 13a,b. These test results evidently prove that the VFAFLC-based MPPT control method can move the PV operating point efficiently towards the MPP, which results in the maximum power being attained within a short amount of time. The control logic of the VFAFLC-based MPPT control algorithm is explained in the flow chart in Figure 14.
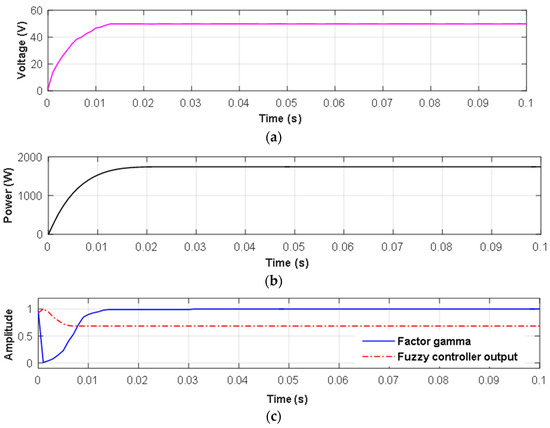
Figure 11.
The performance of the variable factor adaptive fuzzy logic controller (VFAFLC)-based MPPT control: (a) output voltage, (b) output power, and (c) variation in factor gamma and FLC controller output.
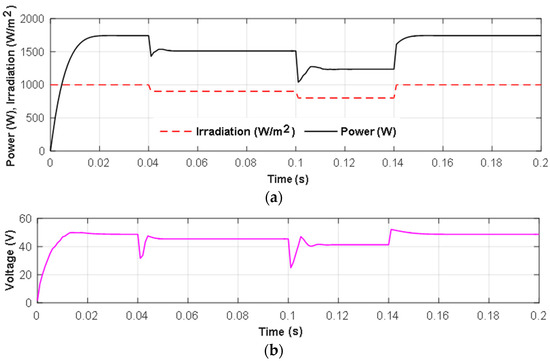
Figure 12.
The performance of the VFAFLC-based MPPT control method for step-change in irradiation: (a) power output and (b) output voltage.
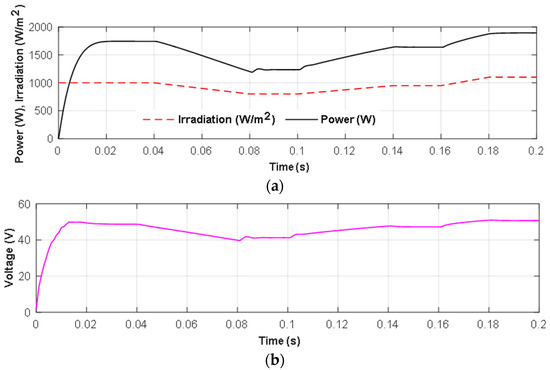
Figure 13.
The performance of the VFAFLC-based MPPT control method for the gradual change in irradiation: (a) power output and (b) output voltage.
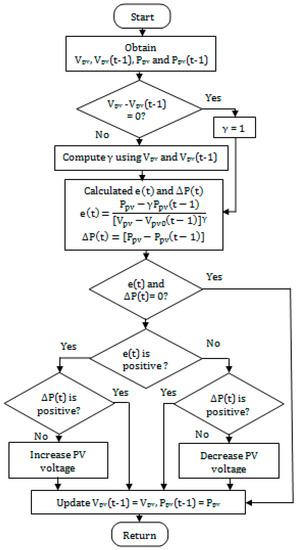
Figure 14.
The flow chart of the VFAFLC-based MPPT control scheme.
In the FLC design, the universe of discourse of the inputs and outputs were split into five fuzzy sets with a triangle shape, as shown in Figure 15. Each fuzzy set of the input and output were described with a linguistic term to apply the fuzzy control rules. The linguistic terms for the inputs were NB: negative big¸ NS: negative small, ZE: zero, PS: positive small, and PB: positive big. Similarly, the output linguistic terms were VL: very low, LW: low, ME: medium, HG: high, and VH: very high. The fuzzy control rules for the proposed scheme were developed based on the aforementioned control logic. The error input being negative (NB or NS) confirmed that the operating point of the PV was on the right side of the MPP in the P-V curve. Hence, the controller output needed to be below to achieve the MPP by reducing the PV voltage. Alternatively, a large error (PB or PS) confirmed that the PV operating point was on the left side of the MPP in the P-V curve, so the controller output was essentially high to achieve the MPP by increasing the PV voltage. In addition, the ΔP(t) input gave an idea about the movement of the operating point in the P-V curve. A negative value for this input indicated that the operating point was moving away from the MPP; therefore, a strong control action was required to bring the operating point back towards the MPP. If the operating point moved towards the MPP then the ΔP(t) became positive since it was not necessary to change the controller action. A total of 25 fuzzy rules were designed for the proposed system, which are given in table format as shown in Table 3.
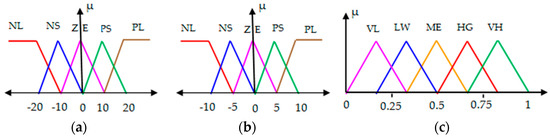
Figure 15.
Fuzzy sets: (a) error input, (b) change in power input, and (c) output.
Table 3.
The fuzzy control rules.
5. Implementation of the DVR System
The complete system implementation of the proposed DVR system is shown in Figure 16. The proposed system consists of the PV array connected electrically in a series with the TEG. The DC-DC boost converter with the proposed VFAFLC-based MPP tracking algorithm extracts the maximum power from the PV array.
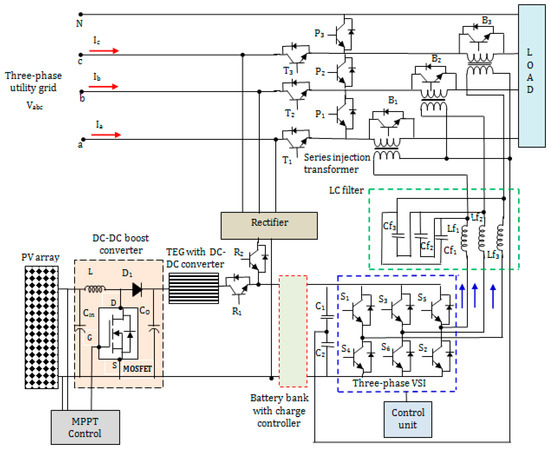
Figure 16.
Schematic of the three-phase four-wire PV-TEG DVR system.
In the proposed PV-TEG hybrid energy module the MPPT technique is applied only for the PV module by considering its maximum power contribution to the load. The voltage induced in the thermocouple is usually low and its magnitude is mainly dependent upon the temperature difference between the hot and cold sides. Hence, the TEG module was made with a low step-up DC-DC boost converter to regulate the voltage output. The converter was designed based on the design procedure in [45]. The hot side of the TEG was arranged on the back side of the PV panel to keep the high temperature and the cold side was fixed with heat sinks to maintain the low temperature. The TEG with heat sinks arrangement reduce the ambient temperature level of the PV cells so its energy efficiency could be increased compared to the standalone PV array. In addition, the heat energy produced on the PV panel is effectively used by the TEG for extra power generation. Therefore, the PV-TEG combined hybrid energy module efficiency could be improved.
The battery bank is used to store excess energy generated by the PV-TEG hybrid energy module. The battery power is used by the DVR when the hybrid energy module output is insufficient or there is a zero output condition during the nighttime. The charge controller unit manages the power flow for the DVR system during the power quality disturbance compensation. If the PV-TEG generates an adequate level of power output then the charge controller allows the DVR system to utilize this power for its operation. If the PV-TEG output is insufficient or during the nighttime the power output is zero, then the energy stored in the battery is used by the DVR system for the compensation operation. The charge controller operation is summarized in Table 4. The DVR operational modes are controlled with different switches, as illustrated in Table 5. Under normal working conditions switches T1, T2, T3, B1, B2, and B3 are on and P1, P2, and P3 are off. When there is a power quality disturbance or the PV-TEG module generates enough power to meet the load demand, the DVR moves to compensation mode to supply the necessary voltage and/or power to the load. The control unit of the DVR identifies the power quality disturbances using the control strategy discussed previously and carries out compensation using the VSI circuit and series injection transformer. The DVR operation is explained with four different modes such as compensation, Uninterruptable Power Supply (UPS), energy saving and idle, the switch status for these modes of operation is shown in Table 5.
Table 4.
The function of the charge controller.
Table 5.
Control signals for the DVR operational modes.
5.1. The Operational Modes of the Proposed DVR
5.1.1. Compensation Mode
In the case of compensation mode, the voltage swell/sag is identified by the DVR and the compensation is made according to the nature of the voltage disturbances for the three-phase load. The three-phase compensation voltages are injected in a series with the grid supply using the injection transformers to mitigate the disturbances. The bypass switches B1, B2, and B3 and parallel switches P1, P2, and P3 are turned off. The series switches T1, T2, and T3 are turned on and the DVR starts to compensate the voltage sag/voltage swell. The voltage, current, and power equations are expressed respectively as
where VL is the load side voltage, PL is the load side real power, QL is the load side reactive power, Vs is the supply voltage, Ps is the source real power, Qs is the source reactive power, VDVR is the DVR voltage, PDVR is the DVR real power, and QDVR is the DVR reactive power.
5.1.2. Uninterruptable Power Supply (UPS) Mode
When there is an interruption in the grid supply voltage (Vs) the DVR works under UPS mode by activating the related power electronics switches. In the case of UPS mode, the load and series injection transformers are connected in parallel to provide a continuous supply using the PV-TEG hybrid energy source and the battery bank. During this mode, the switches T1, T2, and T3 and bypass switches B1, B2, and B3 are turned off and the switches P1, P2, and P3 are on. Once the DVR identifies the voltage interruption it immediately starts to mitigate interruptions to maintain the load voltage. The load current, load voltage, and power equations of the DVR in the case of UPS mode are expressed respectively as
5.1.3. Energy-Saving Mode
The consumption energy from the utility grid by the customer can be saved under this mode. The DVR transfers the PV-TEG hybrid module output to the load. In this mode, the utility grid supply is disconnected from the load, and the load is in parallel to the series injection transformer. When the PV-TEG energy source-generated output is adequate to the load demand, the switch R1 is on and R2 is off. The PV-TEG module output is fed directly to the load through the battery bank. During this mode, the switches T1, T2, and T3 and bypass switches B1, B2, and B3 are off and the switches P1, P2, and P3 are on, similar to the UPS compensation mode. The load voltage, current, and power equations are given respectively as
5.1.4. Idle Mode
The idle mode is also called bypass mode. If the supply voltage Vs is at a rated level and the power generation on the PV-TEG module is less than the load demand then the DVR is made to operate in idle mode. In this mode, the DC voltage is blocked by turning off the upper and lower valves of the inverter legs. The switches T1, T2, and T3 and bypass switches B1, B2, and B3 are turned on to bypass the DVR. In idle mode, with VDVR = 0, the series injection transformer secondary winding is short-circuited through the switches B1, B2, and B3.
6. Analysis and Discussion of the Simulation Results
The performance of the proposed PV-TEG integrated DVR system was examined for voltage disturbance compensation as well as grid energy conservation. A three-phase voltage source with a 50 Hz frequency with a line-to-line voltage of 400 V was used. The system parameters considered for the simulation study and analysis are illustrated in Table 6. Initially, the power output by the hybrid PV-TEG energy module was examined to confirm its suitability for the DVR operation. The power output of the hybrid energy module for an irradiation of 1000 W/m2 with a standard temperature of 300 K and a temperature difference of 30 K between the cold and hot sides of the TEG are shown in Figure 17. From Figure 17, it was confirmed that the hybrid energy source can provide the stable and necessary power for DVR operation. The power output of the PV-TEG hybrid source was also compared with the standalone PV array output power. The comparison results shown in Figure 17 evidently proved that the power output of the hybrid energy module was greater with the inclusion of TEG. Hence, the TEG produced a reasonable amount of power from the waste heat energy developed because of the solar irradiation on the PV panel. Similarly, the efficiency of the standalone PV and the PV-TEG hybrid module are compared, as shown in Figure 18. It was observed that the efficiency of the PV combined TEG energy module showed an efficiency 2.5% higher than the standalone PV module. Therefore it was confirmed that the PV-TEG hybrid energy module can supply enough power to the DVR for power quality compensation. The performance of the proposed DVR system is demonstrated with the following five different case studies.
Table 6.
The system parameters of the PV-TEG integrated DVR.
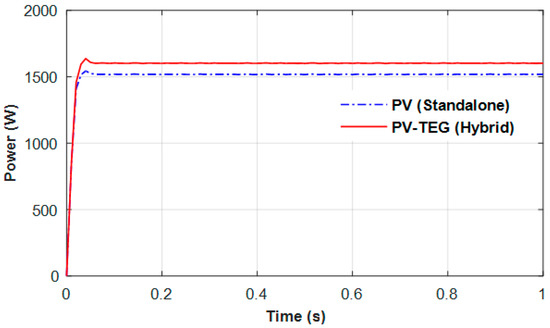
Figure 17.
The output power of the hybrid PV-TEG module and standalone PV array.
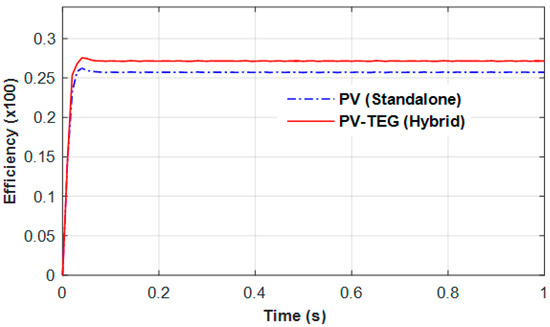
Figure 18.
The efficiency comparison between the PV-TEG module and standalone PV array.
6.1. Case 1: Voltage Sag Compensation
The hybrid energy source-based DVR system performance was analyzed for the supply voltage sag compensation. Voltage sags of 10% and 20% were introduced to the three-phase supply at 0.05 s and 0.15 s, as shown in Figure 19. The DVR system promptly detected the voltage sags and injected the compensating voltage with the supply voltage at a 0° phase shift. The voltage injected from the DVR and the load voltage for case 1 are illustrated in Figure 19b,c. From the inspection of the results, it was noticed that the voltage across the load was not affected due to the voltage sags of the distribution system. With the help of the hybrid PV-TEG module and the battery bank, the DVR system managed the voltage sags and maintained the load voltage at a normal level. The active and reactive power of the DVR during the voltage sag was also recorded, as shown in Figure 20a,b, respectively. During the initial period, there was no voltage sag in the supply voltage since the load was receiving the actual real and reactive power totally from the three-phase grid source. The real and reactive power supplied from the source was reduced during the voltage sags. Therefore, the DVR responded to the voltage sag and the necessary real and reactive power was injected into the load to maintain the power level without any deficiency. The load voltage instantaneous total harmonics distortion (THD) contents for case 1 were also verified, as shown in Figure 21. From the result, it was noticed that the THD contents of the three-phase load voltage were found to be 3.52% for phase A, 3.77% for Phase B, and 3.52% for phase C. These were found to be within the permissible limit of 5%.
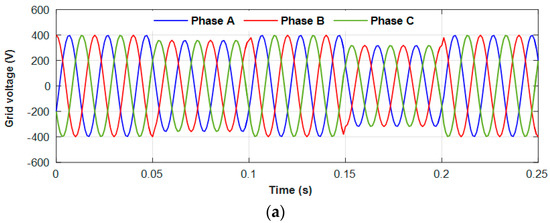
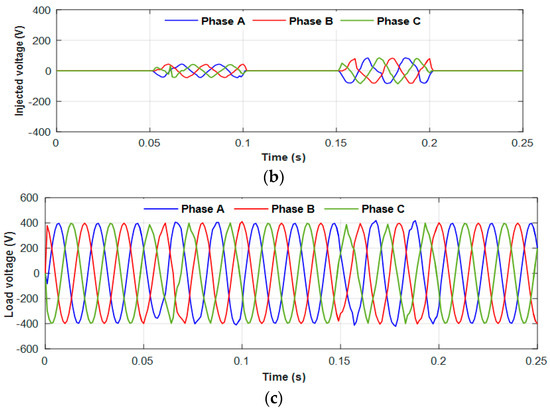
Figure 19.
The PV-TEG integrated DVR system during the voltage sag compensation: (a) supply voltage, (b) DVR injected voltage, and (c) voltage across the load.
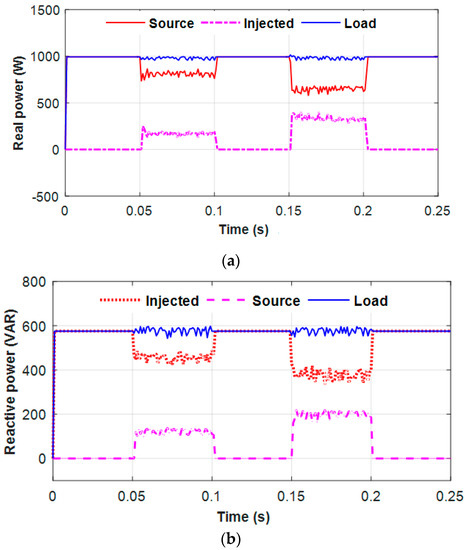
Figure 20.
Power flow during the voltage sag compensation: (a) real power and (b) reactive power.
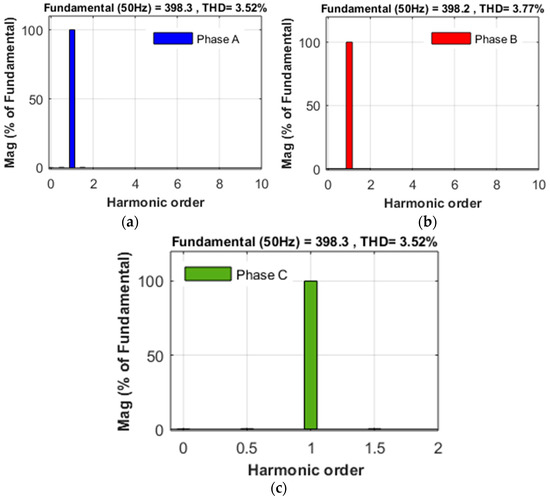
Figure 21.
The three-phase load voltage THD contents during voltage sag compensation: (a) phase-A, (b) phase-B, and (c) phase-C.
6.2. Case 2: Voltage Swell Compensation
The investigation of this case was to verify the performance of the DVR in voltage swell compensation. The balanced three-phase voltage swell with 10% of the normal value (400 V) was applied from 0.1 s to 0.15 s, as shown in Figure 22a. The DVR system supplied the compensating voltage series with the source voltage, which was equal to the excessive voltage with a 180° phase jump, as shown in Figure 22b. In this case, the load voltage was the difference between supply voltage Vs and injected voltage VDVR. Therefore, the voltage across the load was maintained at the same level during the voltage swell period, as illustrated in Figure 22c.
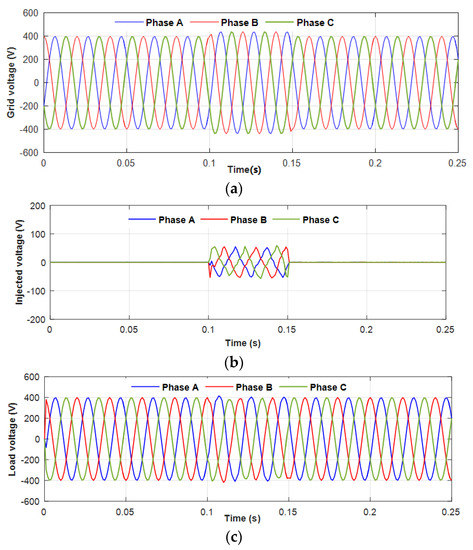
Figure 22.
The PV-TEG integrated DVR system during the voltage swell compensation: (a) source voltage, (b) DVR injected voltage, and (c) load voltage.
The real and reactive power of the source, injected by the DVR and load side during the voltage swell period, is depicted in Figure 23a–c. At the normal operating condition, the source supplied the total real power of about 993 W to the load. During the voltage swell, the real and reactive power feed from the three-phase AC source increased from the normal value, as shown in Figure 23a. The DVR correctly detected the abnormality in the system due to the voltage swell and it started to supply the necessary power for the load and maintain the real and reactive power of the load at the nominal level. Hence, the real and reactive power supplied to the load was maintained, which is essential for the trouble-free operation of the load.
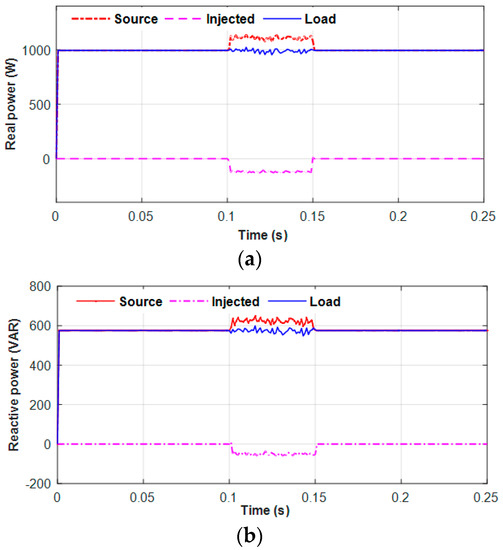
Figure 23.
Power flows during the voltage swell compensation: (a) real power and (b) reactive power.
6.3. Case 3: Unbalanced Voltage Sag Compensation
The performance of the proposed system was also tested for voltage sag compensation by introducing an unbalanced supply voltage for the specific phases. During the test, the three-phase unbalanced voltage sag was applied from the time of 0.1 s to 0.15 s, as shown in Figure 24a. In this case, the voltage level of phase A and phase B decreased from the nominal value of 400 V. When the voltage sag in phase A and phase B was detected, the DVR started to inject the deficit voltage to phase A and phase B of the system, as shown in Figure 24b. Thus, the DVR maintained a balanced nominal voltage across the load, as illustrated in Figure 24c.
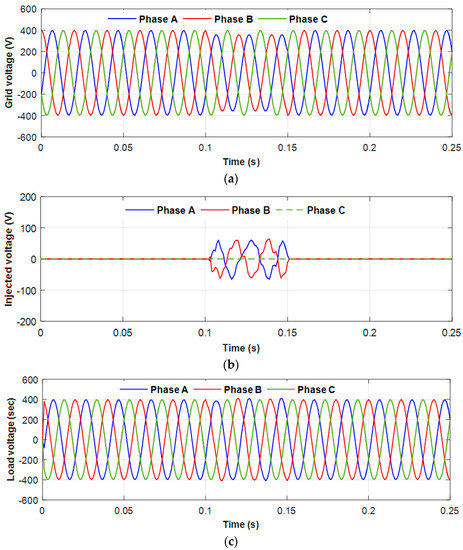
Figure 24.
The PV-TEG DVR system performance for the unbalanced voltage sag compensation: (a) source voltage, (b) DVR injected voltage, and (c) voltage across the load.
6.4. Case 4: Outage Compensation
In this case, the PV-TEG combined DVR system performance was investigated for outage compensation by disconnecting the grid supply voltage. In this case, the source voltage was set to 0 V, as shown in Figure 25a. The DVR system correctly identified the failure in the supply voltage and started injecting the sufficient voltage to the three-phase load to maintain an uninterruptable supply. The injected voltage by the DVR and the voltage across the load are in Figure 25b,c, respectively. From Figure 25c, it was noticed that for the load supplied with nominal voltage during the outage period, the hybrid PV-TEG source supported the DVR to manage the outage issue effectively. The outage compensation was able to prevent system malfunctions and data losses of the three-phase consumer loads due to supply failure.
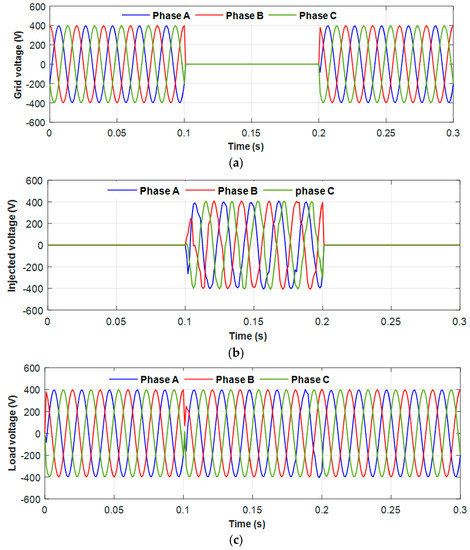
Figure 25.
Outage compensation by PV-TEG DVR system: (a) supply voltage, (b) DVR injected voltage, and (c) voltage across the load.
The power supplied to the load during the outage compensation is shown in Figure 26. Initially, the nominal voltage was applied between 0 s and 0.1 s. The power injected from the DVR during this period was almost zero. During the outage period, the DVR injected the nominal real and reactive power to maintain the load power at a nominal level during outage compensation. Since the DVR was integrated with the hybrid PV-TEG energy module and the battery bank, it was able to manage the total power demand of the load efficiently.
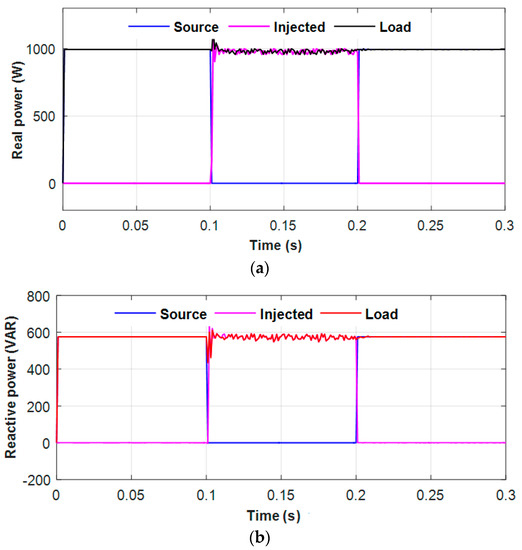
Figure 26.
Power flow during the outage compensation: (a) real power and (b) reactive power.
6.5. Case 5: Energy Conservation Mode
The grid energy conservation is one of the main advantages of the proposed DVR system, by which the energy consumption by the consumer from the distribution system can be saved at a significant level. When the PV-TEG system generates adequate power to meet out the load demand, the energy conservation mode of the DVR is activated, and the utility distribution system is disconnected from the load. With the support of the effective MPPT control algorithm, the PV-TEG hybrid module is able to feed the total power to the load. When the PV-TEG energy module generates excess energy, it accumulates in the battery bank for future use. In the proposed system, the hybrid energy module was designed to provide enough power to meet the load demand under varying environmental conditions. The performance of the DVR system during the energy conservation mode is illustrated in Figure 27. The grid supply voltage during this study period is made to be 0 V, as shown in Figure 27a. The corresponding injected voltage and voltage across the three-phase load are shown in Figure 26b,c, respectively. Once the energy conservation mode is activated the DVR supplies the total voltage of 400 V to the load directly without any deficit. During the energy conservation mode, the total grid supply is disconnected so that the energy conservation can be made for the consumer. By implementing this mode of operation in the DVR system, the additional financial benefit can be obtained for the consumer.
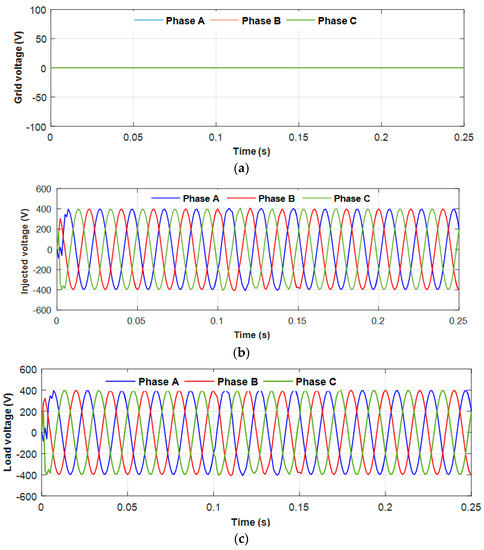
Figure 27.
The PV-TEG integrated DVR voltages during the energy conservation mode of (a) source voltage, (b) DVR injected voltage, and (c) voltage across the load.
The real and reactive power flow during the energy conservation mode is shown in Figure 28a,b. The DVR injected the real and reactive power of 993 W and 657 VAR, respectively, to the three-phase load with the support of the hybrid PV-TEG energy source. The three-phase load voltage THD contents during the energy conservation were also verified, as shown in Figure 29. By analyzing the result of THD, it was observed that the harmonic content in the load voltage of each phase was within the permissible level, which confirms the quality of the power delivered from the DVR to the load. Thus, the power quality supplied to the three-phase sensitive load ensured its smooth and trouble-free operation.
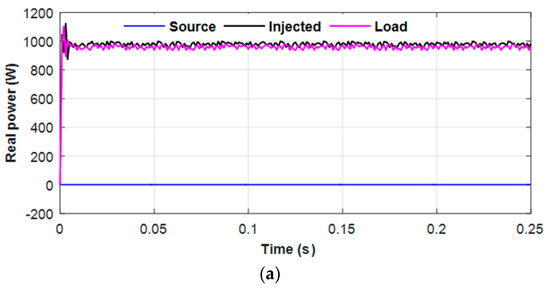
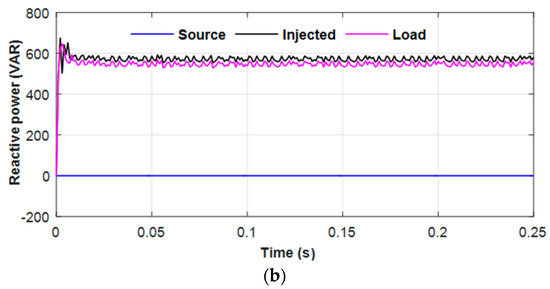
Figure 28.
The energy conservation mode power flow to the load: (a) real power and (b) reactive power.
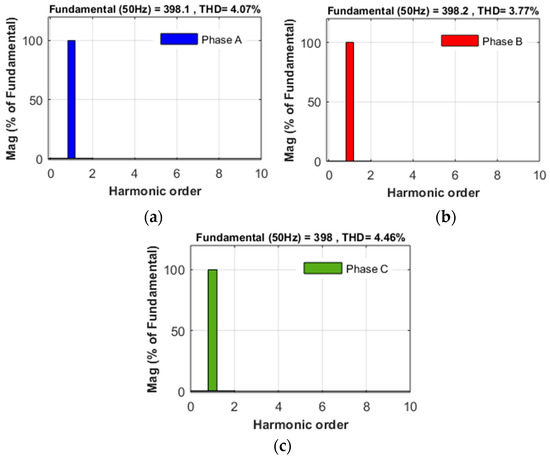
Figure 29.
The three-phase load voltage THD contents during the energy conservation mode: (a) phase-A, (b) phase-B, and (c) phase-C.
7. Conclusions
In this paper, a new system configuration for a PV-TEG integrated DVR was proposed to compensate for the power quality disturbances in the three-phase distribution system and conserve the utility grid energy for the consumer. The model of the PV and TEG was developed and integrated with a DVR to supply enough voltage and/or power during power quality disturbance compensation. A novel VFAFLC-based MPPT control technique was implemented to rapidly extract maximum power from the PV array, which ensured the prompt supply of sufficient voltage and power for the DVR in mitigating deep and long-period power quality disturbances. The variable factor used in the MPPT control algorithm modified the fuzzy input linguistic variable value, which resulted in the MPP tracking performance being enhanced in terms of speed and accuracy. The effectiveness of the proposed DVR system was tested under five different case studies, including the grid energy conservation mode. The test results confirmed that the PV-TEG integrated DVR can mitigate power quality issues such as voltage sag/swell, unbalanced voltage sag, and outages of the three-phase sensitive loads effectively. In addition, the DVR system succeeded in utilizing the PV and TEG renewable sources to conserve the grid energy for the consumer as well as compensating for voltage disturbances. The inclusion of the TEG module increased the power output of the hybrid energy system and thereby higher efficiency was achieved for the given solar irradiation. Moreover, the quality of the power supplied from the DVR system was confirmed based on the THD contents of the compensated load voltage. The THD contents of all three phases during the voltage sag and energy conservation mode were found to be less than 5%, which ensured the smooth and trouble-free operation of the loads connected in the distribution system.
Author Contributions
Conceptualization, N.K. and H.R.; Data curation, N.K.; Formal analysis, N.K., and H.R.; Investigation, N.K. and H.R.; Methodology, N.K. and H.R.; Software, N.K.; Writing—original draft, N.K. and H.R.; Writing—review & editing, N.K. and H.R. All authors have read and agreed to the published version of the manuscript.
Funding
This project was supported by the Deanship of Scientific Research at Prince Sattam Bin Abdulaziz University under research project no. 2020/01/11742.
Institutional Review Board Statement
Not applicable.
Informed Consent Statement
Not applicable.
Conflicts of Interest
The authors declare no conflict of interest.
References
- Jimichi, T.; Fujita, H.; Akagi, H. Design and experimentation of a dynamic voltage restorer capable of significantly reducing an energy-storage element. IEEE Trans. Ind. Appl. 2008, 44, 817–825. [Google Scholar] [CrossRef]
- Khadkikar, V.; Chandra, A. A novel structure for three-phase four-wire distribution system utilizing unified power quality conditioner (UPQC). In 2006 International Conference on Power Electronic, Drives and Energy Systems; IEEE: New Delhi, Delhi, India, 2006; pp. 1–6. [Google Scholar]
- Kumar, C.; Mishra, M.K. Predictive voltage control of transformerless dynamic voltage restorer. IEEE Trans. Ind. Electron. 2014, 62, 2693–2697. [Google Scholar] [CrossRef]
- Ghosh, A.; Ledwich, G. Power Quality Enhancement Using Custom Power Devices; Springer Science & Business Media: New York, NY, USA, 2012. [Google Scholar]
- Cavalcanti, M.C.; Limongi, L.R.; Gomes, M.D.; Azevedo, G.M.; Genu, L.G. Eight-switch power conditioner for current harmonic compensation and voltage sag mitigation. IEEE Trans. Ind. Electron. 2015, 62, 4655–4664. [Google Scholar] [CrossRef]
- Javadi, A.; Hamadi, A.; Woodward, L.; Al-Haddad, K. Experimental investigation on a hybrid series active power compensator to improve power quality of typical households. IEEE Trans. Ind. Electron. 2016, 63, 4849–4859. [Google Scholar] [CrossRef]
- Rauf, A.M.; Sant, A.V.; Khadkikar, V.; Zeineldin, H.H. A novel ten-switch topology for unified power quality conditioner. IEEE Trans. Power Electron. 2015, 31, 6937–6946. [Google Scholar] [CrossRef]
- Xiong, L.; Zhuo, F.; Wang, F.; Liu, X.; Zhu, M.; Yi, H. A quantitative evaluation and comparison of harmonic elimination algorithms based on moving average filter and delayed signal cancellation in phase synchronization applications. J. Power Electron. 2016, 16, 717–730. [Google Scholar] [CrossRef]
- Von Jouanne, A.; Banerjee, B. Assessment of voltage unbalance. IEEE Trans. Power Deliv. 2001, 16, 782–790. [Google Scholar] [CrossRef]
- IEEE Recommended Practice and Requirements for Harmonic Control in Electric Power Systems; IEEE: Park Avenue, NY, USA, 2014.
- Rauf, A.M.; Khadkikar, V. An enhanced voltage sag compensation scheme for dynamic voltage restorer. IEEE Trans. Ind. Electron. 2014, 62, 2683–2692. [Google Scholar] [CrossRef]
- Chandrasekaran, K.; Ramachandaramurthy, V.K. An improved dynamic voltage restorer for power quality improvement. Int. J. Electr. Power Energy Syst. 2016, 82, 354–362. [Google Scholar] [CrossRef]
- Khooban, M.H.; Javidan, R. A novel control strategy for DVR: Optimal bi-objective structure emotional learning. Int. J. Electr. Power Energy Syst. 2016, 83, 259–269. [Google Scholar] [CrossRef]
- Jowder, F.A.L. Design and analysis of dynamic voltage restorer for deep voltage sag and harmonic compensation. IET Gener. Transm. Distrib. 2009, 3, 547–560. [Google Scholar] [CrossRef]
- Babaei, E.; Kangarlu, M.F. Sensitive load voltage compensation against voltage sags/swells and harmonics in the grid voltage and limit downstream fault currents using DVR. Electr. Power Syst. Res. 2012, 83, 80–90. [Google Scholar] [CrossRef]
- Omar, R.; Rahim, N.A. Voltage unbalanced compensation using dynamic voltage restorer based on supercapacitor. Int. J. Electr. Power Energy Syst. 2012, 43, 573–581. [Google Scholar] [CrossRef]
- Shahnia, F.; Majumder, R.; Ghosh, A.; Ledwich, G.; Zare, F. Voltage imbalance analysis in residential low voltage distribution networks with rooftop PVs. Electr. Power Syst. Res. 2011, 81, 1805–1814. [Google Scholar] [CrossRef]
- Lee, S.J.; Kim, H.; Sul, S.K.; Blaabjerg, F. A novel control algorithm for static series compensators by use of PQR instantaneous power theory. IEEE Trans. Power Electron. 2004, 19, 814–827. [Google Scholar] [CrossRef]
- Marei, M.I.; El-Saadany, E.F.; Salama, M.M. A new approach to control DVR based on symmetrical components estimation. IEEE Trans. Power Deliv. 2007, 22, 2017–2024. [Google Scholar] [CrossRef]
- Nielsen, J.G.; Blaabjerg, F. A detailed comparison of system topologies for dynamic voltage restorers. IEEE Trans. Ind. Appl. 2005, 41, 1272–1280. [Google Scholar] [CrossRef]
- Hassanein, W.S.; Ahmed, M.M.; Abed el-Raouf, M.O.; Ashmawy, M.G.; Mosaad, M.I. Performance improvement of off-grid hybrid renewable energy system using dynamic voltage restorer. Alex. Eng. J. 2020, 59, 1567–1581. [Google Scholar] [CrossRef]
- Olamaei, J.; Ebrahimi, S.; Moghassemi, A. Compensation of voltage sag caused by partial shading in grid-connected PV system through the three-level SVM inverter. Sustain. Energy Technol. Assess. 2016, 18, 107–118. [Google Scholar] [CrossRef]
- Sagha, H.; Mokhtari, G.; Arefi, A.; Nourbakhsh, G.; Ledwich, G.; Ghosh, A. A new approach to improve PV power injection in LV electrical systems using DVR. IEEE Syst. J. 2017, 12, 3324–3333. [Google Scholar] [CrossRef]
- Jayakumar, T.; Alexander Stonier, A. Implementation of solar PV system unified ZSI-based dynamic voltage restorer with U-SOGI control scheme for power quality improvement. Automatika 2020, 61, 371–387. [Google Scholar] [CrossRef]
- Kanagaraj, N.; Ramasamy, M.; Rezk, H.; Manesh, T. Modified bidirectional DC-DC Boost converter fed three-phase four-wire PV-DVR. J. Test. Eval. 2020, 48, 3087–3115. [Google Scholar] [CrossRef]
- Laird, I.; Lu, D.D.C. High step-up DC/DC topology and MPPT algorithm for use with a thermoelectric generator. IEEE Trans. Power Electron. 2012, 28, 3147–3157. [Google Scholar] [CrossRef]
- Chen, M.; Rosendahl, L.A.; Condra, T. A three-dimensional numerical model of thermoelectric generators in fluid power systems. Int. J. Heat Mass Transf. 2011, 54, 345–355. [Google Scholar] [CrossRef]
- Ding, F.; Li, P.; Huang, B.; Gao, F.; Ding, C.; Wang, C. Modeling and simulation of grid-connected hybrid photovoltaic/battery distributed generation system. In Proceedings of the CICED 2010 Proceedings, Nanjing, China, 13–16 September 2010; IEEE: Park Avenue, NY, USA, 2010; pp. 1–10. [Google Scholar]
- Teke, A.; Bayindir, K.Ç.; Tümay, M. Fast sag/swell detection method for fuzzy logic controlled dynamic voltage restorer. IET Gener. Transm. Distrib. 2010, 4, 1–12. [Google Scholar] [CrossRef]
- Ramasamy, M.; Thangavel, S. Experimental verification of PV based Dynamic Voltage Restorer (PV-DVR) with significant energy conservation. Int. J. Electr. Power Energy Syst. 2013, 49, 296–307. [Google Scholar] [CrossRef]
- Subudhi, B.; Pradhan, R. A comparative study on maximum power point tracking techniques for photovoltaic power systems. IEEE Trans. Sustain. Energy 2012, 4, 89–98. [Google Scholar] [CrossRef]
- Chaicharoenaudomrung, K.; Areerak, K.; Areerak, K.; Bozhko, S.; Hill, C.I. Maximum Power Point Tracking for Standalone Wind Energy Conversion System Using FLC and P&O Method. IEEJ Trans. Electr. Electron. Eng. 2020, 15, 1723–1733. [Google Scholar]
- Kanagaraj, N.; Rezk, H.; Gomaa, M.R. A Variable Fractional Order Fuzzy Logic Control Based MPPT Technique for Improving Energy Conversion Efficiency of Thermoelectric Power Generator. Energies 2020, 13, 4531. [Google Scholar] [CrossRef]
- Chouksey, A.; Awasthi, S.; Singh, S.K. Fuzzy cognitive network-based maximum power point tracking using a self-tuned adaptive gain scheduled fuzzy proportional integral derivative controller and improved artificial neural network-based particle swarm optimization. Fuzzy Sets Syst. 2020, 381, 26–50. [Google Scholar] [CrossRef]
- Li, Y.; Samad, S.; Ahmed, F.W.; Abdulkareem, S.S.; Hao, S.; Rezvani, A. Analysis and enhancement of PV efficiency with hybrid MSFLA–FLC MPPT method under different environmental conditions. J. Clean. Prod. 2020, 271, 122195. [Google Scholar] [CrossRef]
- Farajdadian, S.; Hosseini, S.H. Design of an optimal fuzzy controller to obtain maximum power in solar power generation system. Sol. Energy 2019, 182, 161–178. [Google Scholar] [CrossRef]
- Wang, Y.; Yang, Y.; Fang, G.; Zhang, B.; Wen, H.; Tang, H.; Chen, X. An advanced maximum power point tracking method for photovoltaic systems by using variable universe fuzzy logic control considering temperature variability. Electronics 2018, 7, 355. [Google Scholar] [CrossRef]
- Kanagaraj, N. Design and Performance Evaluation of Fuzzy Variable Fractional-Order [PI]λ Dµ Controller for a Class of First-Order Delay-Time Systems. Stud. Inform. Control 2019, 28, 443–452. [Google Scholar] [CrossRef]
- Verma, P.; Garg, R.; Mahajan, P. Asymmetrical interval type-2 fuzzy logic control based MPPT tuning for PV system under partial shading condition. ISA Trans. 2020, 100, 251–263. [Google Scholar] [CrossRef] [PubMed]
- Veeramanikandan, P.; Selvaperumal, S. Investigation of different MPPT techniques based on fuzzy logic controller for multilevel DC link inverter to solve the partial shading. Soft. Comput. 2021, 25, 3143–3154. [Google Scholar] [CrossRef]
- Shan, W.; Ma, Y.; Newcomb, R.W.; Jin, D. Analog circuit implementation of a variable universe adaptive fuzzy logic controller. IEEE Trans. Circuits Syst. II Express Briefs 2008, 55, 976–980. [Google Scholar] [CrossRef]
- Qin, L.; Hu, J.; Li, H.; Chen, W. Fuzzy logic controllers for specialty vehicles using a combination of phase plane analysis and variable universe approach. IEEE Access 2017, 5, 1579–1588. [Google Scholar] [CrossRef]
- Tang, S.; Sun, Y.; Chen, Y.; Zhao, Y.; Yang, Y.; Szeto, W. An enhanced MPPT method combining fractional-order and fuzzy logic control. IEEE J. Photovolt. 2017, 7, 640–650. [Google Scholar] [CrossRef]
- Datta, M.; Senjyu, T. Fuzzy control of distributed PV inverters/energy storage systems/electric vehicles for frequency regulation in a large power system. IEEE Trans. Smart Grid 2013, 4, 479–488. [Google Scholar] [CrossRef]
- Ramasamy, M.; Thangavel, S. Photovoltaic based dynamic voltage restorer with power saver capability using PI controller. Electr. Power Energy Syst. 2012, 36, 51–59. [Google Scholar] [CrossRef]


Publisher’s Note: MDPI stays neutral with regard to jurisdictional claims in published maps and institutional affiliations. |
© 2021 by the authors. Licensee MDPI, Basel, Switzerland. This article is an open access article distributed under the terms and conditions of the Creative Commons Attribution (CC BY) license (http://creativecommons.org/licenses/by/4.0/).