Next Article in Journal
Eco-Economic Coordination Analysis of the Yellow River Basin in China: Insights from Major Function-Oriented Zoning
Next Article in Special Issue
On the Role of Perception: Understanding Stakeholders’ Collaboration in Natural Resources Management through the Evolutionary Theory of Innovation
Previous Article in Journal
Examining Soil Erosion Responses to Grassland Conversation Policy in Three-River Headwaters, China
Previous Article in Special Issue
What Hinders the Promotion of the Green Mining Mode in China? A Game-Theoretical Analysis of Local Government and Metal Mining Companies
 
 
Correction published on 21 May 2021, see Sustainability 2021, 13(11), 5806.
Article

Household-Level Determinants of Participation in Forest Support Programmes in the Miombo Landscapes, Zambia

1
Institute of International Forestry and Forest Economics, Thünen Institute, 21031 Hamburg-Bergedorf, Germany
2
Ecosystem Dynamics and Forest Management in Mountain Landscapes, Technical University of Munich, D-85354 Freising, Germany
3
Plant and Environmental Sciences Department, School of Natural Resources, Copperbelt University, Kitwe 10101, Zambia
*
Author to whom correspondence should be addressed.
Sustainability 2021, 13(5), 2713; https://doi.org/10.3390/su13052713
Submission received: 6 January 2021 / Revised: 8 February 2021 / Accepted: 25 February 2021 / Published: 3 March 2021
(This article belongs to the Special Issue Sustainable Management of Natural Resources)

Abstract

:
The need to protect forest resources from unsustainable, yet rational, human actions has attracted global attention. This is because smallholder dependence on forests can degrade forest resources and cause deforestation. While efforts to understand forest programmes and motivations to protect forests have increased in recent decades, there remains a limited understanding of household factors affecting participation in forest support programmes, especially in the context of high-pressure areas, such as the Miombo woodlands. This study was conducted in the North-Western, Copperbelt and Eastern Province of Zambia. In each province, we selected landscapes consisting of protected and non-protected forest areas. We administered structured interviews to 1123 households and used logistic regression to estimate determinants of participation. We found that better education, landholding size, increased share of forest income, cash crops and non-farm income, and access to forests and markets have a negative impact on participation in forest support programmes. Being located in landscapes with protected areas was positively associated with participation. We suggest that, in order to increase participation, forest programmes should focus on households with low levels of education, limited livelihood opportunities, and poor access to markets. Besides, programmes should provide incentives, including support for farm inputs and at the same time encourage reforestation and agroforestry methods.

1. Introduction

Globally, there is a consensus among scholars and policymakers that forests need to be protected from unsustainable, yet rational, human actions [1,2,3,4]. This is of particular concern for tropical and subtropical dry forests because of the continuous dependence on forest resources and forestlands’ conversion to agricultural fields [5,6,7]. As such, efforts to understand forest support (FS) programmes and stakeholders’ motivation to protect forest resources have intensified in recent decades [8,9,10,11]. However, there remains a limited understanding of the contextual factors affecting household participation in FS programmes [12,13].
FS programmes can include protected areas and collaborative forest management strategies, including community forest management, joint forest management, co-management, and payment for environmental services [14,15,16,17,18]. Collaborative forest management strategies are often developed to empower households to manage their forest resources. It is suggested that by taking care of forests, households’ livelihoods will improve and deforestation will reduce [19]. On the other hand, the protected area strategy emphasises strict control to access and allows for sustainable human use [20]. This strategy aims to protect and preserve biological diversity and natural and cultural resources under legal management or other effective means [20]. Lastly, payment for environmental services involves voluntary transactions under agreed rules for the management of natural resources between service users (communities) and service providers [21]. Together, these forest management strategies are considered complementary for achieving biodiversity conservation and improving household livelihoods [22,23]. Hence, FS programmes can be defined as forest management strategies that incorporate local (household) needs and ensure sustainable development while contributing to the reduction of deforestation (see [1,18]).
In most countries, however, FS programmes are often designed to achieve specific outcomes, which can be related either to forest conservation [24] or sustainable use of forest resources (i.e., conservation and rural development) [25,26]. For example, in the high tropical rainforests such as Brazil or Ecuador, FS programme design emphasises species conservation and deforestation reduction [27,28]. In the tropical dry forest areas, such as the Miombo woodlands of Zambia, forest areas are a source of land for rotational fallows and new agricultural fields [7]. Moreover, forest products’ extraction is intertwined with most households’ livelihood strategies [29,30]. The high forest use and demographic changes can increase pressure on forest resources, which leads to deforestation and forest degradation [5,6,31].
Until recently, FS programme designs in the tropical dry forest areas often emphasised sustainable use of forest resources [1,32]. However, there is a need for programme designs to consider the claim for alternative land uses. FS programmes designs should aim to balance both agriculture and forest livelihood components [33,34]. Therefore, balancing forest management and livelihood improvements can have economic implications on forest programmes and households [8,35]. Despite continued efforts by countries to sign global frameworks (e.g., UNFCCC and REDD+) that guide the design and implementation of FS programmes, it is recognised that many factors can influence households participation in FS programmes [36]. These factors may include institutional arrangements [9,23], socio-demographic factors, economic aspects, and access to forest resources and markets (access factors) [37,38], and have been found to vary across different countries [11,39,40].
Socio-demographic factors such as age, education and household size are especially important because experience and skills development and household size can enhance environmental attitude change and increase labour availability, which can be associated with participation in FS programmes [39,40,41]. Economic attributes such as landholding size and income source can either motivate or discourage participation if perceived as limiting the use of forest resources [41,42]. Lastly, access factors, including access to forestlands and distances to markets, can either encourage or discourage participation in FS programmes [37,40].
Given the increasing pressure on forest resources in the dry forest areas and Miombo in particular [32,43,44], it becomes crucial to understand household-level factors associated with participation in FS programmes. Despite past interests in understanding the impacts of these contextual factors on forest programmes, there is still a weak understanding of how these factors affect participation in FS programmes in the Miombo area [45,46]. Moreover, in these areas, woodland management and forest uses are highly intertwined with households’ livelihood strategies [32,34]. For example, in Zambia, the National Forestry Policy [47] and the Forests Act [48] stipulate multistakeholder co-management and benefits sharing among stakeholders. However, given differences in the rural economy and prevalent heterogeneity among rural households, it becomes essential to understand whether participation in FS programmes results from differences in household attributes or merely by nature of the rural economy [36,39,42]. Failure to understand the impact of these factors on FS programmes may lead to a low level of acceptance of forest programmes in some areas, resulting in a potential failure of the programmes to meet their objectives [45,49].
Past attempts in Zambia to understand FS programmes’ success mainly focused on analysing the governance structures that can ensure successful participation [26,46,49]. This is based on the view that a well-functioning governance structure guarantees sustainable outcomes such as improved livelihood outcomes [23,50,51]. However, the designs and the broader policy context guiding FS programmes in Zambia often do not align with the local context in which households operate, which creates confusion on prioritising forest conservation or enhancing livelihood benefits [52,53]. For instance, previous studies reveal that rural households in Zambia highly depend on forests for their livelihoods [29,54,55]. Yet, Zambia’s management of forests is still under “old-style” forestry that focuses on the regulatory functions [32]. This has, however, created uncertainty in the design and implementation of most FS programmes.
While some attempts have been made to introduce FS programmes in protected areas (i.e., areas with limited access to and use of forests) and non-protected sites [47,48,56], the majority of FS programmes in Zambia are characterised by deficiencies in design and implementation [49,53]. For example, in their study, Bwalya and Vedeld [45], and Phiri [46] highlights the mismatch between households’ livelihood expectations and programme goals, leading to FS programmes’ failure to deliver successful outcomes. Despite low acceptance rates and the failure of most forest programmes to achieve sustainable outcomes, previous studies in Zambia have not exhaustively examined how household-level attributes can influence participation in FS programmes [13,57]. Therefore, understanding household-level factors can be a good starting point for prioritising forestry sector policies to increase the effectiveness of FS programmes and contribute to poverty reduction among households in tropical dry forest areas [1,58,59].
Against this backdrop, we assess participation in FS programmes based on household survey data collected in the Miombo area consisting of landscapes with partly restricted access to and use of forest resources (protected areas) and landscapes with non-restricted access to and use of forest resources (non-protected areas). We examine households’ socio-demographic aspects, economic attributes and access factors (access to forest and markets) that can affect participation in FS programmes. The quantitative measures of household-level attributes reflect local and contextual factors that can determine participation. As such, we can check the competing hypotheses that affect participation, as described in Section 3.3 (Table 1). The following question guides our study: how do socio-demographic factors, economic attributes, and access to forest resources and markets affect households’ participation in FS programmes in the Miombo forest landscapes of Zambia?

2. Theoretical Concept

In tropical and subtropical dry forest areas, forest use and agricultural land use form the most significant sources of household livelihood portfolios [2]. However, due to forest resources and agricultural production’s seasonal nature, rural households often have multiple income sources; thus, rural households are recognised to engage mainly in diversified livelihood strategies [60]. These livelihood strategies mainly include forest products extraction, crop production, livestock grazing and off-farm activities [29,61] and are considered to be associated with deforestation and forest degradation [5,6]. As such, efforts to reduce smallholder deforestation and forest degradation can have an economic implication, especially on households that depend on forests and agriculture for livelihoods.
While previous studies agree that livelihood benefits can affect participation differently, households’ decisions to adopt specific livelihood strategies are suggested to be influenced by multiple underlying processes and livelihood benefits [38,40]. The decision to participate can depend on the economic costs and benefits of household activities and participation [8,35]. For example, household sizes can reflect household labour allocation to various forest products, leading to increases in households’ total income compared to their counterparts with relatively smaller household sizes [62]. Hence, the opportunity cost approach can be used to assess the relationship between underlying household processes, including sources of income, access to forest resources and participation in forest support programmes [8,63].
The costs and benefits depict the trade-offs between benefits to households now and in the future through sustainable forest resources management [8,64]. This can be important in understanding household processes, motivations, and expected benefits from participating in forest support programmes [35,65]. Given that rural households are often involved in many livelihood strategies [60], in the Miombo area it is recognised that forest support programmes should aim at improving rural livelihoods and minimise actions leading to unsustainable use of forests [32,46]. However, the challenge in forest programme design is to balance the attainment of programme objectives, while ensuring the improvement of the benefits that households gain from forest resources [1,57]. Assessing the incentives that motivate participation in forest programmes, requires an inventory of the competing activities and contextual factors, including costs and benefits of livelihood sources that influence household’s participation [8,10,38]. This study contributes to understanding the relationship between household-level factors, including economic costs and benefits of forest use and participation in forest support programmes.

3. Material and Methods
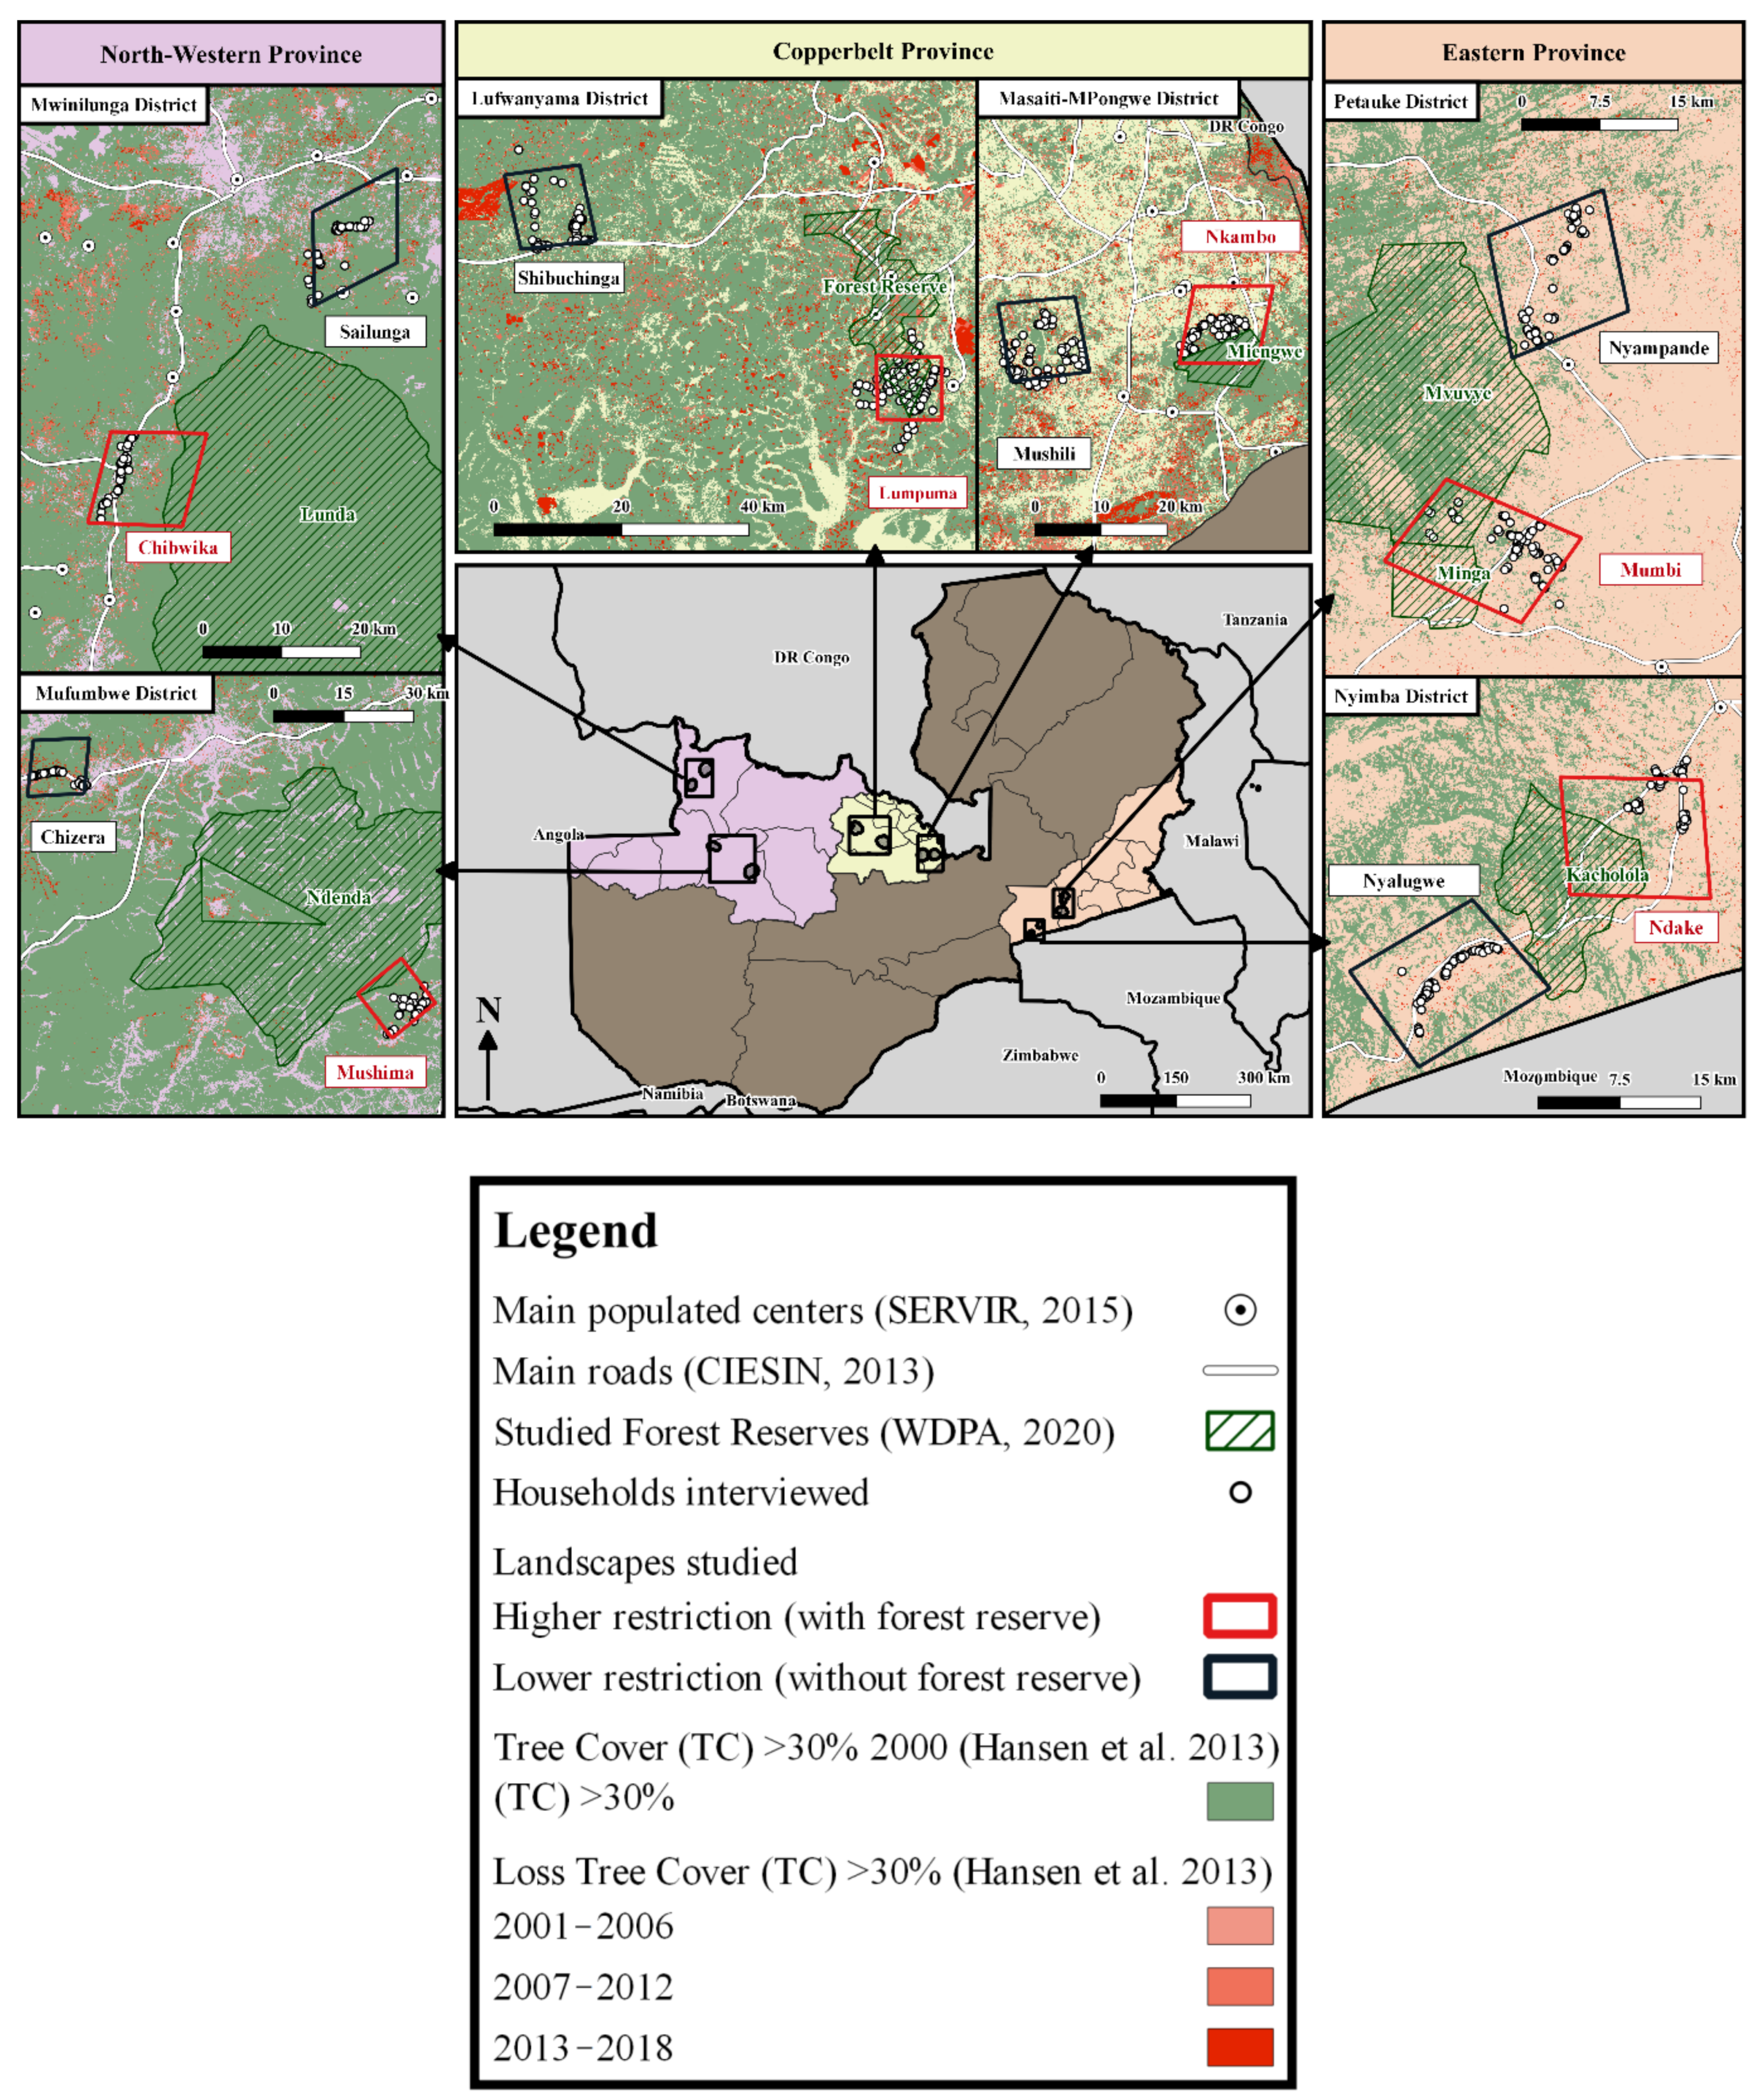
3.1. Study Area

This study was conducted in the North-Western, Copperbelt and the Eastern Provinces of Zambia (Figure 1). The study provinces have Miombo vegetation, characterised by trees of the genera Brachystegia, Julbernadia and Isoberlinia [66,67]. These provinces receive annual rainfall ranging from 600 to 1500 mm [67,68,69]. Additionally, the North-Western Province, Copperbelt and the Eastern Province are further characterised by considerable variation in the forest cover (i.e., the Copperbelt Province = 64.4%, North-Western = 74.5%, and Eastern Province = 17.5%) [70]. Forest management strategies and programmes in these provinces seem to have varying goals aligned with each province’s remaining forest cover (Figure A1). For instance, in the Eastern Province, FS programmes are predominantly intended for replenishing soil fertility while increasing forest cover (i.e., reforestation) [71,72]. In the North-Western Province, FS programmes are mainly structured to achieve conservation outcomes (Figure A1).
Hence, following the methods defined by Kazungu [29] and Nansikombi [73], the study selected paired landscapes consisting of landscapes with restricted access to and use of forest resources and non-restricted landscape (i.e., with open access forests). In both areas (i.e., the restricted and non-restricted landscapes), households acknowledged FS programmes’ existence (Figure A2). Overall, 12 landscapes consisting of protected and non-protected landscapes were surveyed in the North-Western Province, the Copperbelt and the Eastern Province (Figure 1).

3.2. Sampling and Household Survey

This study drew a random sample from households located in 37 villages across the North-Western Province, Copperbelt, and the Eastern Province of Zambia (Figure 1). In each province, enumerators conversant with the regional dialect and who fluently spoke the local language [74] were recruited and trained in survey data collection. Data were collected through in-person, structured interviews, and validated before being uploaded into the database. Before interviews, respondents were asked for their consent to participate in the research programme (Appendix C). The interviews lasted between one hour and one-and-a-half hours. The methods used for selecting participating households are described in Kazungu [29]. Overall, we interviewed 1200 households; however, a subset of 1123 households is included in the analysis due to missing values and outliers in some variables. The study collected information about household composition, livelihood activities (i.e., forest products, land and non-land activities), land-use trajectories, and forest support programmes.
This study uses self-reported quantities for own consumption and sold and average village-level market prices to estimate income values. The respondents reported weekly and monthly amounts of different crops, forest products, livestock, and gifts, consumed or sold. The weekly and monthly product amounts were aggregated to give annual income estimates. Income was calculated as net values by subtracting all the costs associated with the production. However, household’s labour was not deducted from the income calculation because there was no standard for quantifying own labour in Zambia’s rural areas (see also Cavendish [75]).
In order to assess the participation of households in FS programmes, we first sought to understand household awareness of the existence of FS programmes in their communities. Respondents were asked to name all forest programmes that aimed to increase forest cover, preserve forests and improve forest management in their villages (Appendix A). In this study, about 65% of the households were aware of forest programmers’ existence. Of the 1123 respondents, 413 households registered and successfully participated in FS programmes (Table 1). Households identified multiple FS programmes that were later categorised into six broad groups: conservation programmes, land rights, advocacy and capacity building, agroforestry programmes, government initiatives, beekeeping programmes and other programmes (name of programme unknown) (Figure A1 and Figure A2).

3.3. Data Analysis

3.3.1. Variable Selection and Research Hypotheses

The purpose of our analysis is to test specific hypotheses and to determine factors that motivate households to participate in FS programmes. Participating in FS programmes in this study means participation through membership, where a household registers and participates in FS programmes (i.e., successfully participated in FS programmes). On the other hand, non-participating households did not participate in programmes even though some had registered with forest support programmes. Therefore, based on the literature on forest programmes, we selected several characteristics for inclusion in the analysis with their expected sign (Table 1). However, it is noteworthy that the means calculated in Table 1 do not, in every case, confirm the expected signs. This study’s household-level factors are thus categorised into three broad dimensions: socio-demographic aspects, economic and access factors (Table 1).
In the first dimension, we assess socio-demographic factors such as the age of household head, gender, education level of household head, household size, and duration of residence in the village. In our study areas, the socio-demographic attributes vary between households that participated and those that did not participate in FS programmes (Table 1). The age of the household head provides information about the household head’s experience and integration level in group and community activities [76]. This variable has been noted to have contrasting effects on participation. Some studies suggest that as the household head’s age increases, the likelihood of participation in forest programmes reduces [42,76]. This view suggests that group activities are time and labour intensive; thus, the elderly members find it challenging to participate. On the other hand, it is recorded that older household heads are more likely to participate in FS programmes because participating in programmes can be perceived to enhance households’ livelihood options [41]. We hypothesise that households headed by older heads in our study area are more likely to participate in FS programmes because, in rural areas, members are likely to perceive participation as a means that can provide an additional and alternative source of livelihood.
Regarding gender differences in participation in FS programmes, in our study areas, more than 80% of the households interviewed were male-headed (Table 1). As such, we hypothesise that male-headed households are more likely to positively participate in FS programmes than female-headed households. In rural areas in most developing countries, social inequalities and institutional constraints are more likely to reduce the likelihood for participation among female-headed households [39,77,78].
Education is used to measure environmental attitude, behavioural change, and socio-economic status of households [11,77,79]. Attaining higher education levels can increase the ability of a community member to process information regarding the goals and requirements for participation in FS programmes, thereby increasing households’ chances to participate in FS programmes [40,41]. In this study, education levels considerably vary between households that participated in FS programmes and those that did not participate (Table 1). Of the 413 households reported to have participated in FS programmes, 19% had attained above primary education level, while for the households that did not participate about 27% had attained above primary education (Table 1). These suggest that better access to education increases households’ opportunities to engage in non-forest activities, thereby enhancing resources conservation [11]. We hypothesise that households that attained above primary education in the Miombo areas are more likely to participate in FS programmes because better-educated households can presumably better understand the value of forests and thus participate in FS programmes.
For household size, studies suggest rural households with large membership are more likely to depend on forest resources to diversify their livelihood portfolios [2,80]. In rural economies, large household size can provide a sufficient labour force that can be deployed in various household activities. The opportunity cost of participation in FS programmes becomes less when household size is large [76]. We hypothesise that households with large size will be positively associated with participation in FS programmes.
Regarding residence in the village, in our study area participating households had resided in the village longer (approx. 18 years) than their counterparts who did not participate (Table 1). Accordingly, we expect that the residence duration will be positively associated with participation. The longer a member stays in the community, the greater their chances of participating in programmes that seek to conserve forests for the future generation [40].
The second dimension reflects a household’s dependence on land and forest resources for generating income. These factors are designated as economic factors (Table 1) and are expected to have mixed effects on participation (Table 1). Hence, households that engage in crop production and subsistence forest activities are likely to view FS programmes as opportunities to diversify or complement their income portfolios [38,42,81]. Thus, we hypothesise that higher shares of crop incomes (i.e., cash crop and subsistence income) and forest subsistence income are more likely to increase the probability of participation in FS programmes. On the other hand, we expect that households engaged in prohibited activities, such as charcoal production [48,82], are likely to view FS programmes to restrict their charcoal production, thereby increasing the opportunity costs associated with participation. As such, we expect that higher shares from forest income are more likely to reduce the likelihood of participation in FS programmes.
Although the share of capture fish income, off-farm and non-farm incomes (i.e., non-farm operations) in households livelihood portfolios is low (Table 1), non-farm operations are often considered to attract high wages and incomes [40]. Besides, these non-farm operations are often considered labour-intensive; thus, it is likely that the opportunity costs associated with these activities can be higher in rural areas [83]. We hypothesise that higher shares of non-farm incomes (operations) are more likely to reduce the likelihood of participation in FS programmes.
In our study area, access to credit was associated with less participation (Table 1). Of the 413 households participating in the FS programmes, only 33% had access to credit. In rural areas, access to credit facilities can provide the means to increase production and diversify sources of income, thereby increasing participation in FS programmes (see also Coulibaly-Lingani, Savadogo [39]). We expect that access to credit will more likely increase the probability for participation in FS programmes. This is because, in most rural areas of Zambia, credit facilities are limited [84]. Yet, most households are engaged in multiple production activities that require capital [85].
Landholdings and livestock ownership represent important assets held by households [79]. These assets can provide the means for complementary livelihood strategies to rural households [2]. We expect that households with large land size and livestock ownership are more likely to spend their time in land use management and livestock and, therefore, less likely to participate in FS programmes [40].
The third dimension are the factors that reflect access to markets and forest resources (Table 1). In this analysis, access to markets is represented by access and distances that household walked to the main road. About half (48%) of the households that participated in FS programmes had access to main roads and walked a shorter distance (about half an hour) compared to their counterparts that did not participate (Table 1). In Zambia’s rural areas, just like elsewhere [40], forests and agricultural produce are mainly sold by the roadside to the travelling public and intermediary traders. Therefore, access to main roads and distances are important for rural households as they represent access to markets [86]. The lack of access to main roads or longer distance walked increases the transportation costs associated with forest products. This affects the quantities collected and consumed [87], which reduces the incentives among households to engage in forest-related issues. Hence, we expect a negative relationship between access to the main road and distances to main roads with participation in FS programmes.
As used in this analysis, distance to forestlands reflects costs and time associated with harvesting forest resources (Table 1). In this study, households that participated in FS programmes stayed closer to public forestland than their counterparts that did not participate. Therefore, we hypothesise that increasing households’ distances from forestlands is more likely to reduce the probability of participation in FS programmes [37].
Lastly, households located in landscapes with restricted access to and use of forest resources (protected areas) are expected to participate more in FS programmes than their counterparts found in landscapes without restriction. This can presumably be due to the high level of awareness among households in landscapes with protected areas. However, it can also be because of increased benefits derived from being closer to protected areas such as access to the edge of parklands for crop cultivation [81], or increased illegal harvesting of forests resources [29,37]. Consequently, we expect that being located in landscapes with protected areas will be positively associated with the likelihood of participation in FS programmes.

3.3.2. Statistical Analysis

Our analysis included 1,123 households surveyed in the study area. The dependent variable is participation in FS programmes, which is a binary outcome that contains one (1) for households that registered and successfully participated in FS programmes, and zero (0) for those not participating (Table 1). Being a binary outcome implies that ordinary least squares (OLS) regression cannot be appropriate in modelling factors affecting households’ participation [89]. Such outcome, however, is best explained with binary choice models [90]; in this study, we use a logistic regression model. The logistic model was chosen because it provides precise, meaningful estimates of the impact of the explanatory variables (Table 1) on an observed set of data (dependent variable) [91].
The descriptive variables presented in Table 1 were statistically diagnosed, which resulted in the exclusion of four variables with a correlation coefficient greater than 0.3 (r > 0.3). Notably, the variables excluded were residence duration, correlated with age; access to credit, correlated with charcoal income; tropical livestock unit (TLU), correlated with livestock income; and crop subsistence income, correlated with charcoal income. Additionally, cash crop income was correlated with forest subsistence income (r = 0.4). These variables were still retained because there was a substantial difference in cash crop incomes and subsistence forest income among households that participated and those who did not participate in FS programmes (Table 1). Furthermore, by using backward elimination, we excluded variables with p > 0.5 , which included off-farm income, access to permanent road, and distance to exclusively used forestlands.
To interpret the model outcome, we estimate the coefficients (i.e., coefficients correspond to the log of odds ratio), and the result is interpreted by estimating the marginal changes. The marginal effects for the continuous variables measure the instantaneous rates of change. The marginal effects are interpreted as discrete changes for the dummy variables, which means how the predicted probability changes as the binary independent variable changes from 0 to 1 [92].
Thus, the binary outcome for participation in FS programmes takes the form:
Y i = 1   if   Y = β 1 X i + ε i > 0 = 0   if   otherwise
where Y is the observed dependent variable (Participation), and Y is the unobserved variable (latent), β is a vector of unknown parameters (coefficients) to be estimated. X is the vector of explanatory variables, including the age of household head, gender, education, household size, landholding size, incomes (crop, forest, non-farm incomes), distance to forestland, markets and restriction to access and use of forest resources (Table 1). The term ε is the error expressing observations’ deviations from the conditional mean. i represents the observations i = 1 , 2 , 3 . For clarity, the subscript i is suppressed.
Thus, the logit model shall be as follows [91,93]:
P x = e β 1 X 1 + e β 1 X
where P x represents the conditional probability of Y i = 1 given x i , (i.e., P ( Y i = 1 | x i ) ).
Thus, from Equation (1), the dependent variable ( Y ) will be; Y = P x + ε .
Accordingly, if Y = 1 , then ε = 1 P x with a probability of P x .
If Y = 0 , then ε = P x with a probability of 1 P x .
Hence, the conditional distribution of the outcome variable follows a binomial distribution with a mean of zero and variance equal to P x 1 P x .
To estimate the logistic regression, we apply the maximum likelihood (ML) method. The ML yield values for unknown parameters that maximise the probability of obtaining the observed set of data. Therefore, we maximise the log-likelihood function to estimate the probability of the observed data, as shown in Equation (3):
log ( L β = l o g i = 1 N P x y i   1 P x i 1 y i =   i = 1 N y i log Ρ x i + 1 y i log 1 P x i .
Thus, the parameter estimates obtained are used to find the marginal impact of the change of each explanatory variable ( x i ) when the probability of observing Y i = 1 [94].

4. Results

The logistic regression results that were estimated to determine the factors that influence households’ participation in FS programmes are shown in Table 2. The McFadden R2 and chi-square (X2) indicates that our full model predicts significantly better or more accurately than the null model [95,96]. This suggests that household-level factors (i.e., first column of Table 2) chosen in this study statistically explain variations in participation among households. Consequently, the second column in Table 2 includes the coefficients and shows the effects of explanatory variables on the outcome variable (participation). The third column shows the magnitude of change (marginal effects) of the coefficients.
Generally, our results show that socio-demographic attributes were less prominent factors explaining participation in FS programmes; instead, participation can be explained mainly by economic and access factors (Table 2). However, surprisingly, we note that the education variable has a negative sign and is significant (p < 0.05). The marginal effect is −0.074, which implies that a household whose head attained above primary education is 7.4 percentage points less likely to participate in FS programmes than a household whose head did not attain above primary level education, holding all other factors constant. This result is supported by descriptive data (Table 1). Younger and more educated households’ heads (about 27%) chose not to participate in FS programmes than their counterparts participating in FS programmes.
With regard to economic factors, the results show that the effect of household economic attributes on participation in FS programmes was negative and mainly significant at the 0.01 alpha level. Although some economic variables confirmed our hypotheses, others were surprising (Table 2). As expected, we found that increases in landholding size (ha) reduces the probability of participation in FS programmes, although only significant at 0.1 level (Table 2). The predicted probability is −0.0068, which means that an additional one-hectare increase in landholdings reduces the likelihood of participation by 0.68 percentage points, keeping all other factors constant.
We note with surprise that a unit increase in the share of forest subsistence income decreases the probability for participation by 0.4 percentage points, holding all other factors constant. At the same time, though expected, a unit increase in the share of charcoal income reduced the probability for participation by 0.25 percentage points, holding all factors constant (Table 2).
Furthermore, we found surprisingly that a unit increase in the share of cash crops income reduces the likelihood of participation by 0.5 percentage points, keeping all other factors constant (Table 2). This finding suggests that households with a relatively higher share of crop incomes (Table A1) have a lesser interest in participation in FS programmes.
Other income variables, including capture fish income and non-farm income, had the expected negative signs and were highly significant (p < 0.01) (Table 2). Our results indicate that for every unit increase in the share of capture fish income, the probability for participation decreases by 5.8 percentage points, keeping all other factors constant. For non-farm incomes, we found that a unit increase in the share of non-farm income reduces the probability of participation by 0.42 percentage points, holding all other factors constant. Altogether, these findings indicate that increases in the proportion of non-forest-based income (i.e., crop income, fish catch and non-farm income) are more likely to have adverse effects on participation than increases in the proportion of forest income (Table 2).
The access factors included in the analysis are distance to main roads, forestlands and household’s location (i.e., in protected forest areas) (Table 2). Distance variables (i.e., distance to the road and forestland) have the expected negative signs and are statistically significant (i.e., p < 0.01) (Table 2). Although the distance variables exhibit similar signs, the magnitude of their impact on participation substantially varies (Table 2). An increase in the walking time to the main road decreases the probability for participation by 0.08 percentage points, holding all other factors constant. On the other hand, increases in the walking distance to the forestlands decreases the probability for participation by 6.8 percentage points, holding all other factors constant (Table 2). This result is supported by the descriptive findings in Table 1, which shows substantial variations in distances to the markets and forestlands in the study area. Households participating in FS programmes walked averagely shorter distances (about half an hour) to the markets than their counterparts that did not participate (Table 1).
The variable for access to and using forest resources (i.e., landscape with protected forest areas) has the expected positive sign and is strongly significant. The marginal effect is 0.136 for households in landscapes with protected forest areas (Table 2). This implies that the likelihood of participation in FS programmes for households in landscapes without protected forest areas is 13.6% lower than households in landscapes with protected forest areas, holding all other factors constant.

5. Discussion

In tropical dry forest areas, forestlands and woodlands support millions of people living close to and within the forest landscapes [2,32,97]. As such, households’ actions can lead to unsustainable forest resource use [6]. In recent decades, there has been a growing urge to understand contextual factors that influence households’ decision to participate in forest support programmes [1,10,26,49]. This is because household-level attributes are highly heterogeneous in rural areas and, therefore, influence participation in FS programmes differently [38,42]. Since rural households are often suggested to engage in diversified livelihood strategies [60], the costs and benefits associated with different livelihood choices may influence household decisions to participate in FS programmes [8,35,65]. However, there is a weak understanding of the strength and the relationships between household-level factors, including livelihood choices, and participation in FS programmes in high-pressure areas such as the Miombo woodlands [45,57]. Using household data from the Miombo landscapes of Zambia, our study analyses household-level factors affecting participation in FS programmes.
Our results indicate that socio-demographic factors, economic attributes, and access factors in Zambia’s Miombo landscapes do not foster or improve participation in FS programmes. Instead, findings demonstrate that increased economic benefits among households and access to forestlands are likely to reduce participation incentives. For example, once the household’s landholding increases, the likelihood that they will participate in FS programmes decreases. This can be true for most rural households in Zambia, given that livelihoods are mainly from land-based activities [56,98]. This finding indicates that households with more agricultural land for cultivation have less incentive to participate in FS programmes than their counterparts with smaller landholdings [63]. This result means that dependencies on forest resources are linked to lack of access to other livelihood sources [40,88]. This result suggests that, to increase participation among households, FS programmes should target resource-poor households as long as participating in FS programmes can enhance forest preservation and improve the economic status of households. The ten significant variables in the model provide a better explanation of these results’ implications for research and practice.
Our results show that households’ socio-demographic attributes, economic attributes, and access factors considerably vary between households that participated in FS programmes and those that did not participate (Table 1). With respect to household-level factors that influence participation in FS programmes (Table 2), we found that the socio-demographic attributes of households are not generally important factors, except for the educational variable. Households that attained above primary education had lesser incentives to participate in FS programmes. This outcome is surprising and therefore has important implications for practice. In our study area (Table 1), most household heads that attained above primary education level chose not to participate in FS programmes. The finding suggests that better-educated households have broader livelihood opportunities and are therefore less interested in forest-related issues, as was also found in Uganda’s rural areas, particularly among younger household heads [81], and in Ghana [99]. This finding implies that, in order to increase participation in the Miombo areas of Zambia, FS programmes should focus on reaching out to household heads with low educational levels (i.e., below primary school). This can enhance households’ understanding of the value of forest resources and their socio-economic status [11].
Previous studies highlighting forest resources’ contribution to rural livelihoods suggest that forest resources provide supporting roles to many rural households, including seasonal gap filling and safety functions [59,100]. While the share of forest income (i.e., subsistence and cash income) in total household income is highest in our study landscapes (Table A1), we found that higher shares of forest income adversely affected participation. In part, our results indicate that forest-based livelihoods do not just provide gap-filling and safety roles, but form part of the household’s livelihood strategies [29].
Secondly, this finding implies that increased dependence on forest resources for subsistence and cash income is likely to jeopardise participation because households may perceive FS programmes as restrictive to their extractive tendencies [40]. Additionally, the cash gains from charcoal production and subsistence contribution of forest products appear to suggest a higher opportunity cost associated with FS programmes for forest livelihoods [101]. Accordingly, participation in FS programmes becomes a secondary activity with lesser gains [45,46].
Other important sources of income analysed in our study include cash crop, capture fish and non-farm income. These non-forest-based incomes also have a negative and statistically significant relationship with FS programme participation. For cash crop income, particularly, the results were surprising; in part, this could be because the opportunity cost of crop production might have been higher in our study areas [102]. As such, the pursuit of income (economic concerns) becomes more of a household’s priority than participating in forest programmes. Additionally, we found that higher shares of capture fish and non-farm incomes were associated with reduced participation in FS programmes. This is likely to be true because the opportunity costs for non-farm operations and fish capture in rural areas are often high [40,83]. However, the low levels of capture fish income and non-farm income in our analysis (Table A1) do not imply that income from these sources’ is lacking. Instead, our finding demonstrates that not all households had the opportunity to derive these incomes.
On the one hand, these results show that, when non-forest-based activities become more profitable, participation in FS programmes, on the other hand, becomes less attractive among rural households [103]. This implies that FS programmes would have to provide better incentives to attract households to participate in forest-related activities. Incentives can promote farming and intensify crop production while encouraging households to engage in forestry issues [101,102]. Such incentives may include the provision of specific farm support to households (i.e., provision of inputs) [104,105], off-farm activities and reforestation efforts [106,107].
Access factors analysed in this study include distances to main roads and forestlands. Previous studies have highlighted that access to forest areas and markets for forest products are key elements that affect rural households’ participation in FS programmes [40,87]. In Zambia, just like in other countries in the region, forest products are mainly sold by the roadsides to the travelling public. Therefore, distances to the forestland and the main roads signify ease of access to the production areas and markets, respectively [4,86]. These variables in our study had the expected negative signs, which suggest that, if walking distances to the forestlands and markets increases, participation in FS programmes is likely to reduce.
However, we note that increases in distances to the forestlands have a relatively stronger effect than increases in distances to the markets. On the one hand, this result implies that distances to the production areas are of greater concern to rural households than distances to the markets. On the other hand, the result means that households that stayed further away from the forestlands have less interest in forest-related issues [37,87]. Consequently, these findings suggest that, in order to stimulate participation in FS programmes in the Miombo areas, the FS programmes should focus on households that are located closer to forest resources as these households are more likely to participate. FS programmes may not be relevant to households living further away from the forests because such households that stay further away from the forest areas are more likely to be engaged in non-forest-related activities [37,40].
Lastly, our results demonstrate that in landscapes without protected forest areas (non-restricted access to and use of forest resources) households were less likely to participate than their counterparts in landscapes with protected areas. This contrasting outcome could be possible because, in the Miombo area, households’ extractive tendencies have been recorded to be higher in landscapes with protected areas [29]. Therefore, it is likely that forest-dependent livelihoods may be possible because of the illegal extraction of forest resources [47,48]. Accordingly, our findings show that greater environmental awareness (Figure A2) and increased direct benefits from forest resources could explain strong participation in protected areas. This could be true because, as a result of forest support programmes, households could be afraid of potentially more control measures [47,108].

6. Conclusions and Policy Implications

This study examined the impact of household-level factors on participation in forest support (FS) programmes in high-pressure areas such as the Miombo woodlands. In the Miombo area, forest management is integrated with a large population of people whose livelihoods are intertwined with forest use. Moreover, households are the de facto managers of forest resources, whose decisions to participate depend on the economic costs and benefits of participation in forest programmes. Taking this into context, we used the economic dimension of costs and benefits to explain how household-level factors affect participation in FS programmes in the Miombo landscapes of Zambia.
We found that households’ socio-demographic attributes were not significant factors determining participation, except for the educational variable that was negative and significant. Economic attributes and access factors were largely significant and negatively associated with participation in FS programmes. In particular, we found that attaining above primary education level, large landholding, increased shares of forest income, cash crops, capture fish and non-farm income, and access to forests and markets were negative and significantly associated with participation in FS programmes, while being in landscapes with protected areas was positive and significantly associated with participation in FS programmes.
The finding regarding education suggests that better-educated households appear to have broader livelihood opportunities and are, therefore, less interested in forest-related issues.
Regarding economic attributes, our results demonstrate that dependencies on forest resources are linked to lack of access to other livelihood sources. This finding suggests that in order to increase participation among households, FS programmes should target resource-poor households as long as participating in FS programmes can enhance forest preservation and improve households’ economic status.
Finally, to encourage more households to participate, the FS programmes should seek to provide incentives, such as farm input support and access to off-farm activities, and promote measures to increase the availability of forest resources, such as reforestation and agroforestry (e.g., adopting fast-growing trees). We recommend that future studies that analyze factors influencing participation in FS programmes should focus on understanding livelihood typologies between households that attained better education (above primary school) and their counterparts with no education or with lower educational levels (below primary school). As such, researchers and policymakers will be able to understand whether better education improves environmental attitudes and livelihoods, while at the same time enhancing forest conservation.

Author Contributions

Conceptualization, M.K., E.Z. and S.G.; methodology, M.K., E.Z., G.K., and S.G.; software, M.K. and E.Z.; validation, M.K., E.Z., G.K. and S.G.; formal analysis, M.K.; investigation, M.K., E.Z., G.K. and S.G.; resources, S.G. and G.K.; data curation, M.K., E.Z. and S.G.; writing—original draft preparation, M.K.; writing—review and editing, M.K., E.Z., G.K. and S.G.; visualization, M.K.; supervision, S.G.; project administration, S.G. and E.Z.; funding acquisition, S.G. All authors have read and agreed to the published version of the manuscript.

Funding

This research was funded by the German Federal Office of Agriculture and Food (BLE) based on the decision of the German Bundestag, project number 281-006-01 and the APC was funded by Thünen Institute internal funds.

Institutional Review Board Statement

The study was conducted according to the guidelines of the Declaration of Helsinki, and approved by the Thünen Institute Ombudsman.

Informed Consent Statement

Informed consent was obtained from all subjects in-volved in the study (Appendix C).

Data Availability Statement

The data presented in this study are available on request from the Thünen Institute of International Forestry and Forest Economics. The data are not publicly available due to institutional policies on data management and personal privacy.

Acknowledgments

Sincere gratitude to Matthias Dieter, Director of Thünen Institute of International Forestry and Forest Economics, Hamburg, Germany, for his valuable suggestions on an earlier draft of this research. Special thanks to Felix Kalaba, the Dean School of Natural Resources at the Copperbelt University, for his insightful comments in this manuscript’s final version. Additionally, we thank all the households in the Copperbelt Province, North-Western and the Eastern Province of Zambia for participating in our project; Landscape Forestry in the Tropics (LaForeT). We sincerely thank; Benjamin Ilunga, Michael Bwembya, Mwaba Shikaputo, Sarah Chinyemba, Mwenda Nzowa, Jameson Mapupu, Columbus Nyamwana, Simbarashe Soko, and Mubanga Kasonde for participating in the data collection, capture and entry. We acknowledge the support provided by the district forest offices, chiefs and traditional affairs offices, and the chiefdoms in their respective jurisdictions. This enabled the smooth flow of the research activities; thank you. Sincere appreciation to Ruben Ferrer for providing the maps used in this study and thank you to all the Scientists in the research lab-Forestry Worldwide of the Thünen Institute. Lastly, we thank the anonymous reviewers for their insightful and fruitful comments that have greatly improved our manuscript. The authors are responsible for all errors resulting from this work and acknowledge that the views expressed here are their own and do not reflect the views and opinions of their respective institutions.

Conflicts of Interest

The authors declare no conflict of interest.

Appendix A

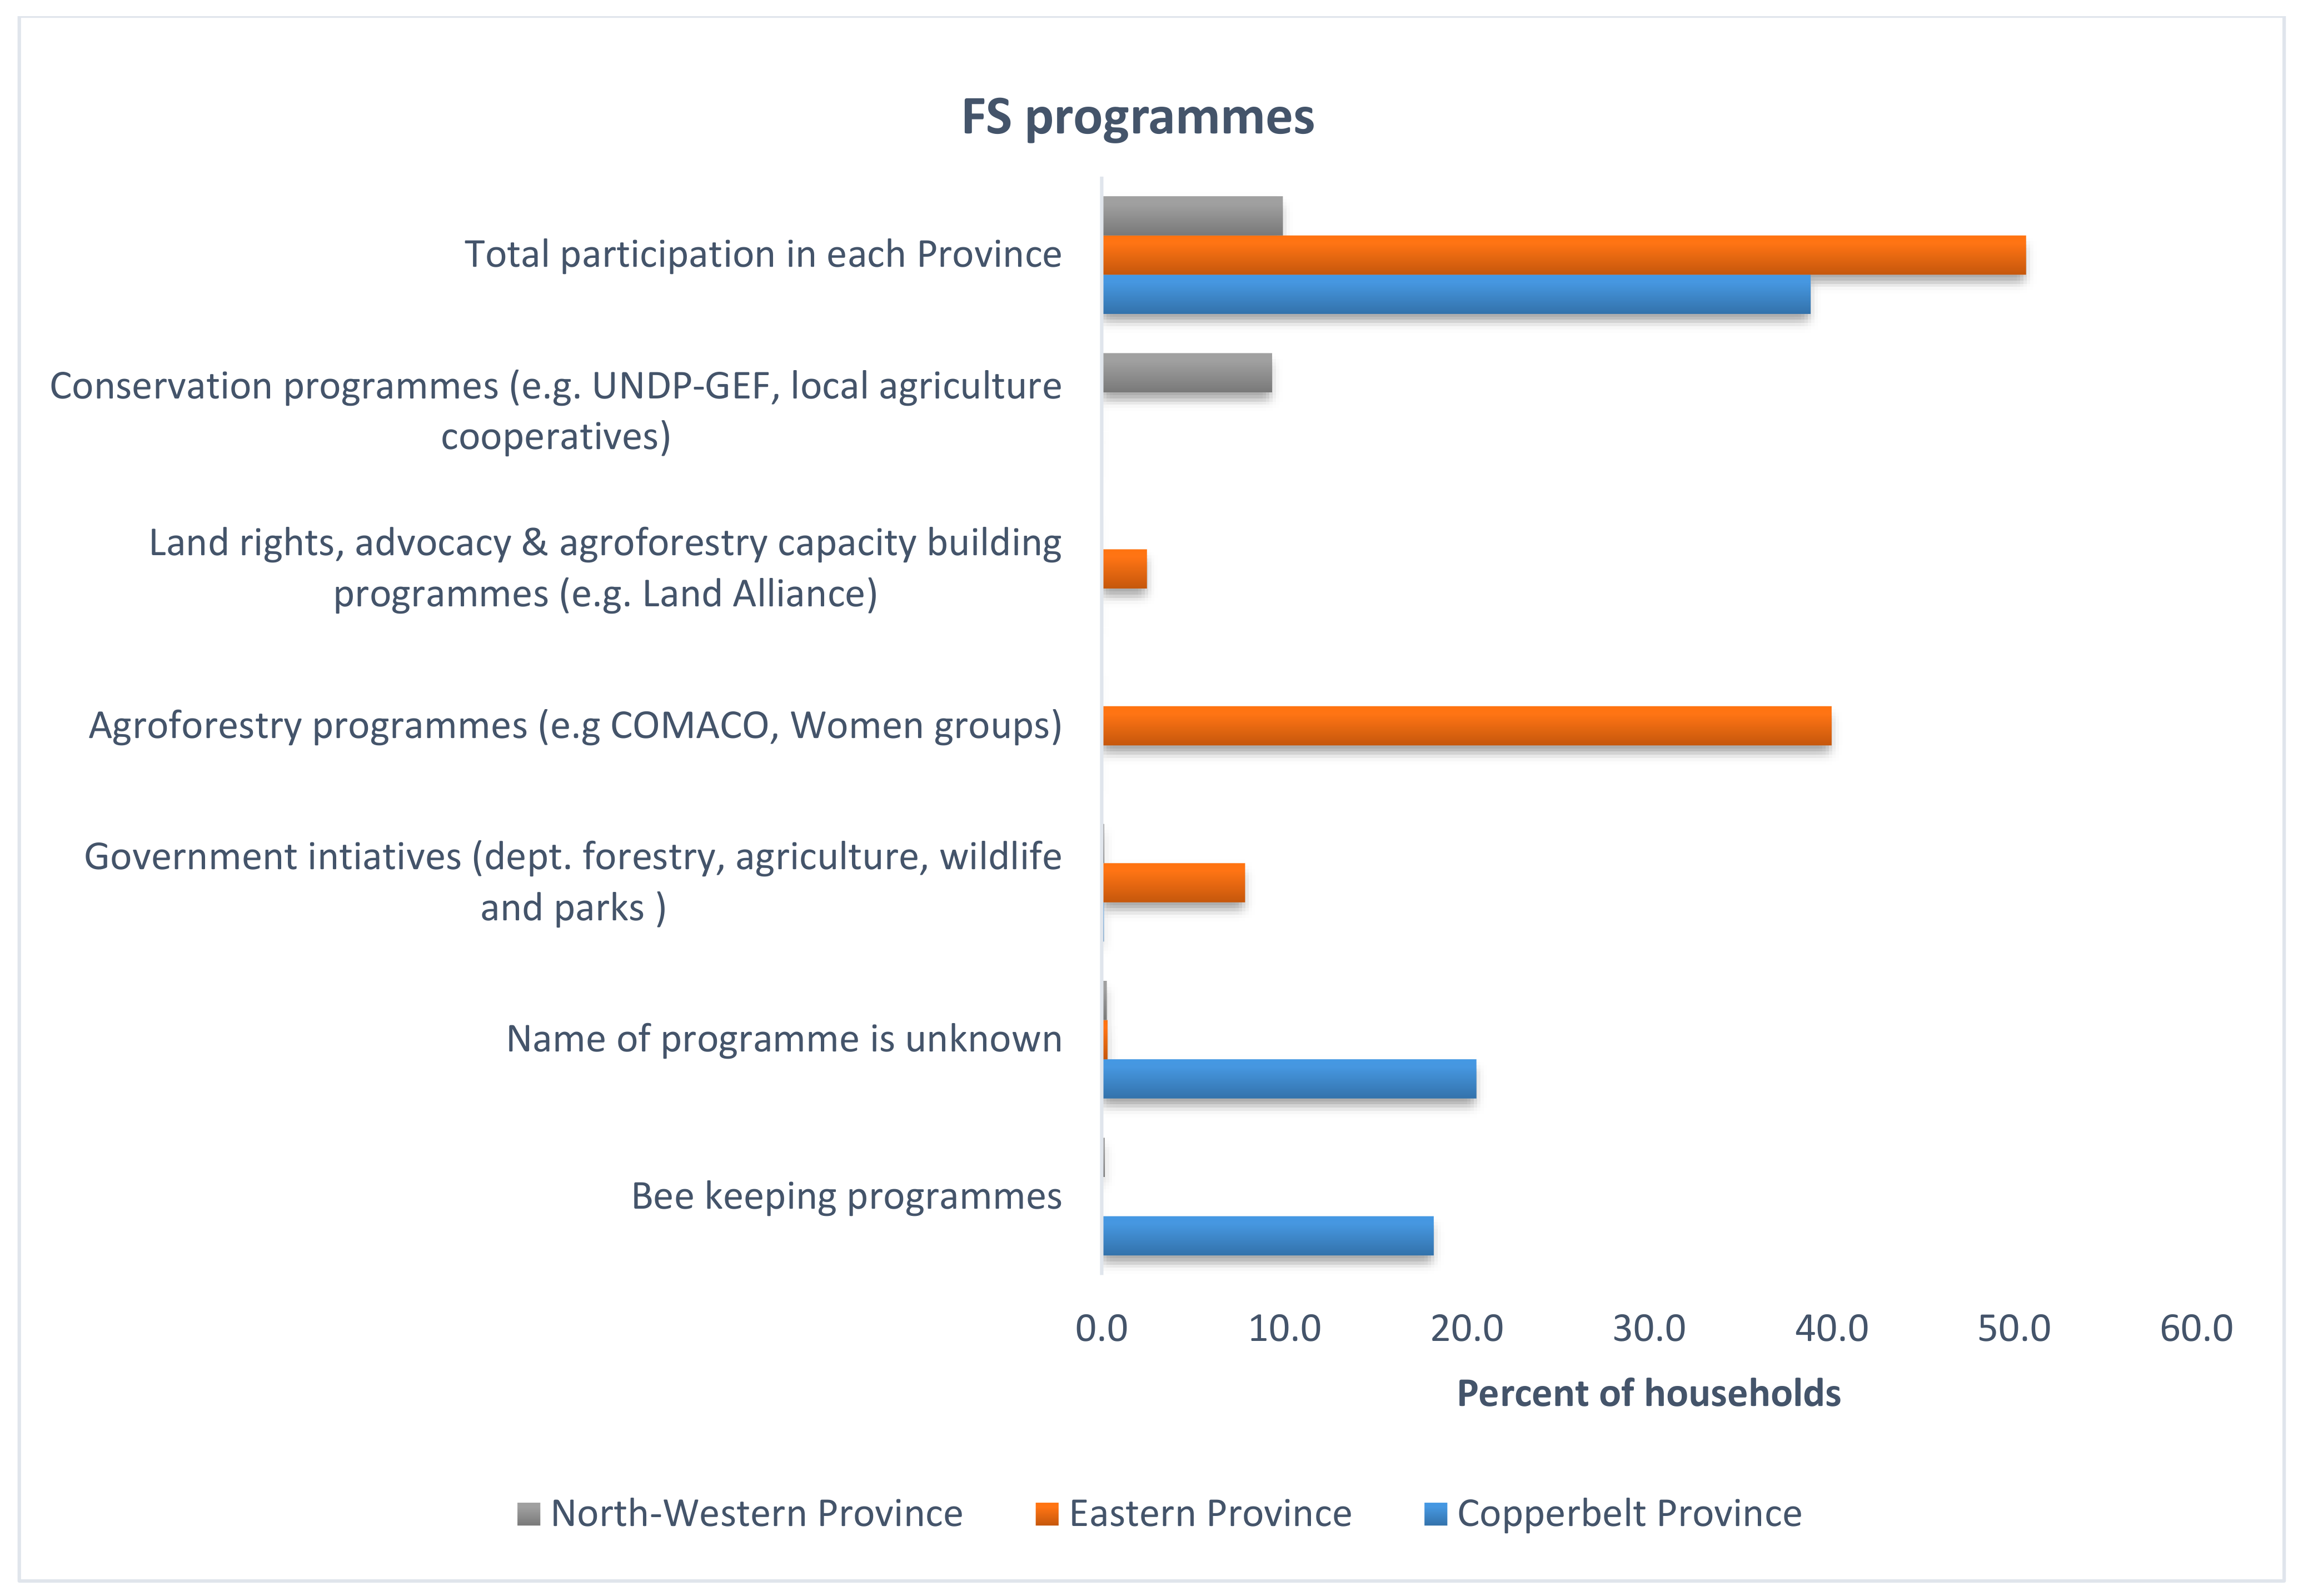
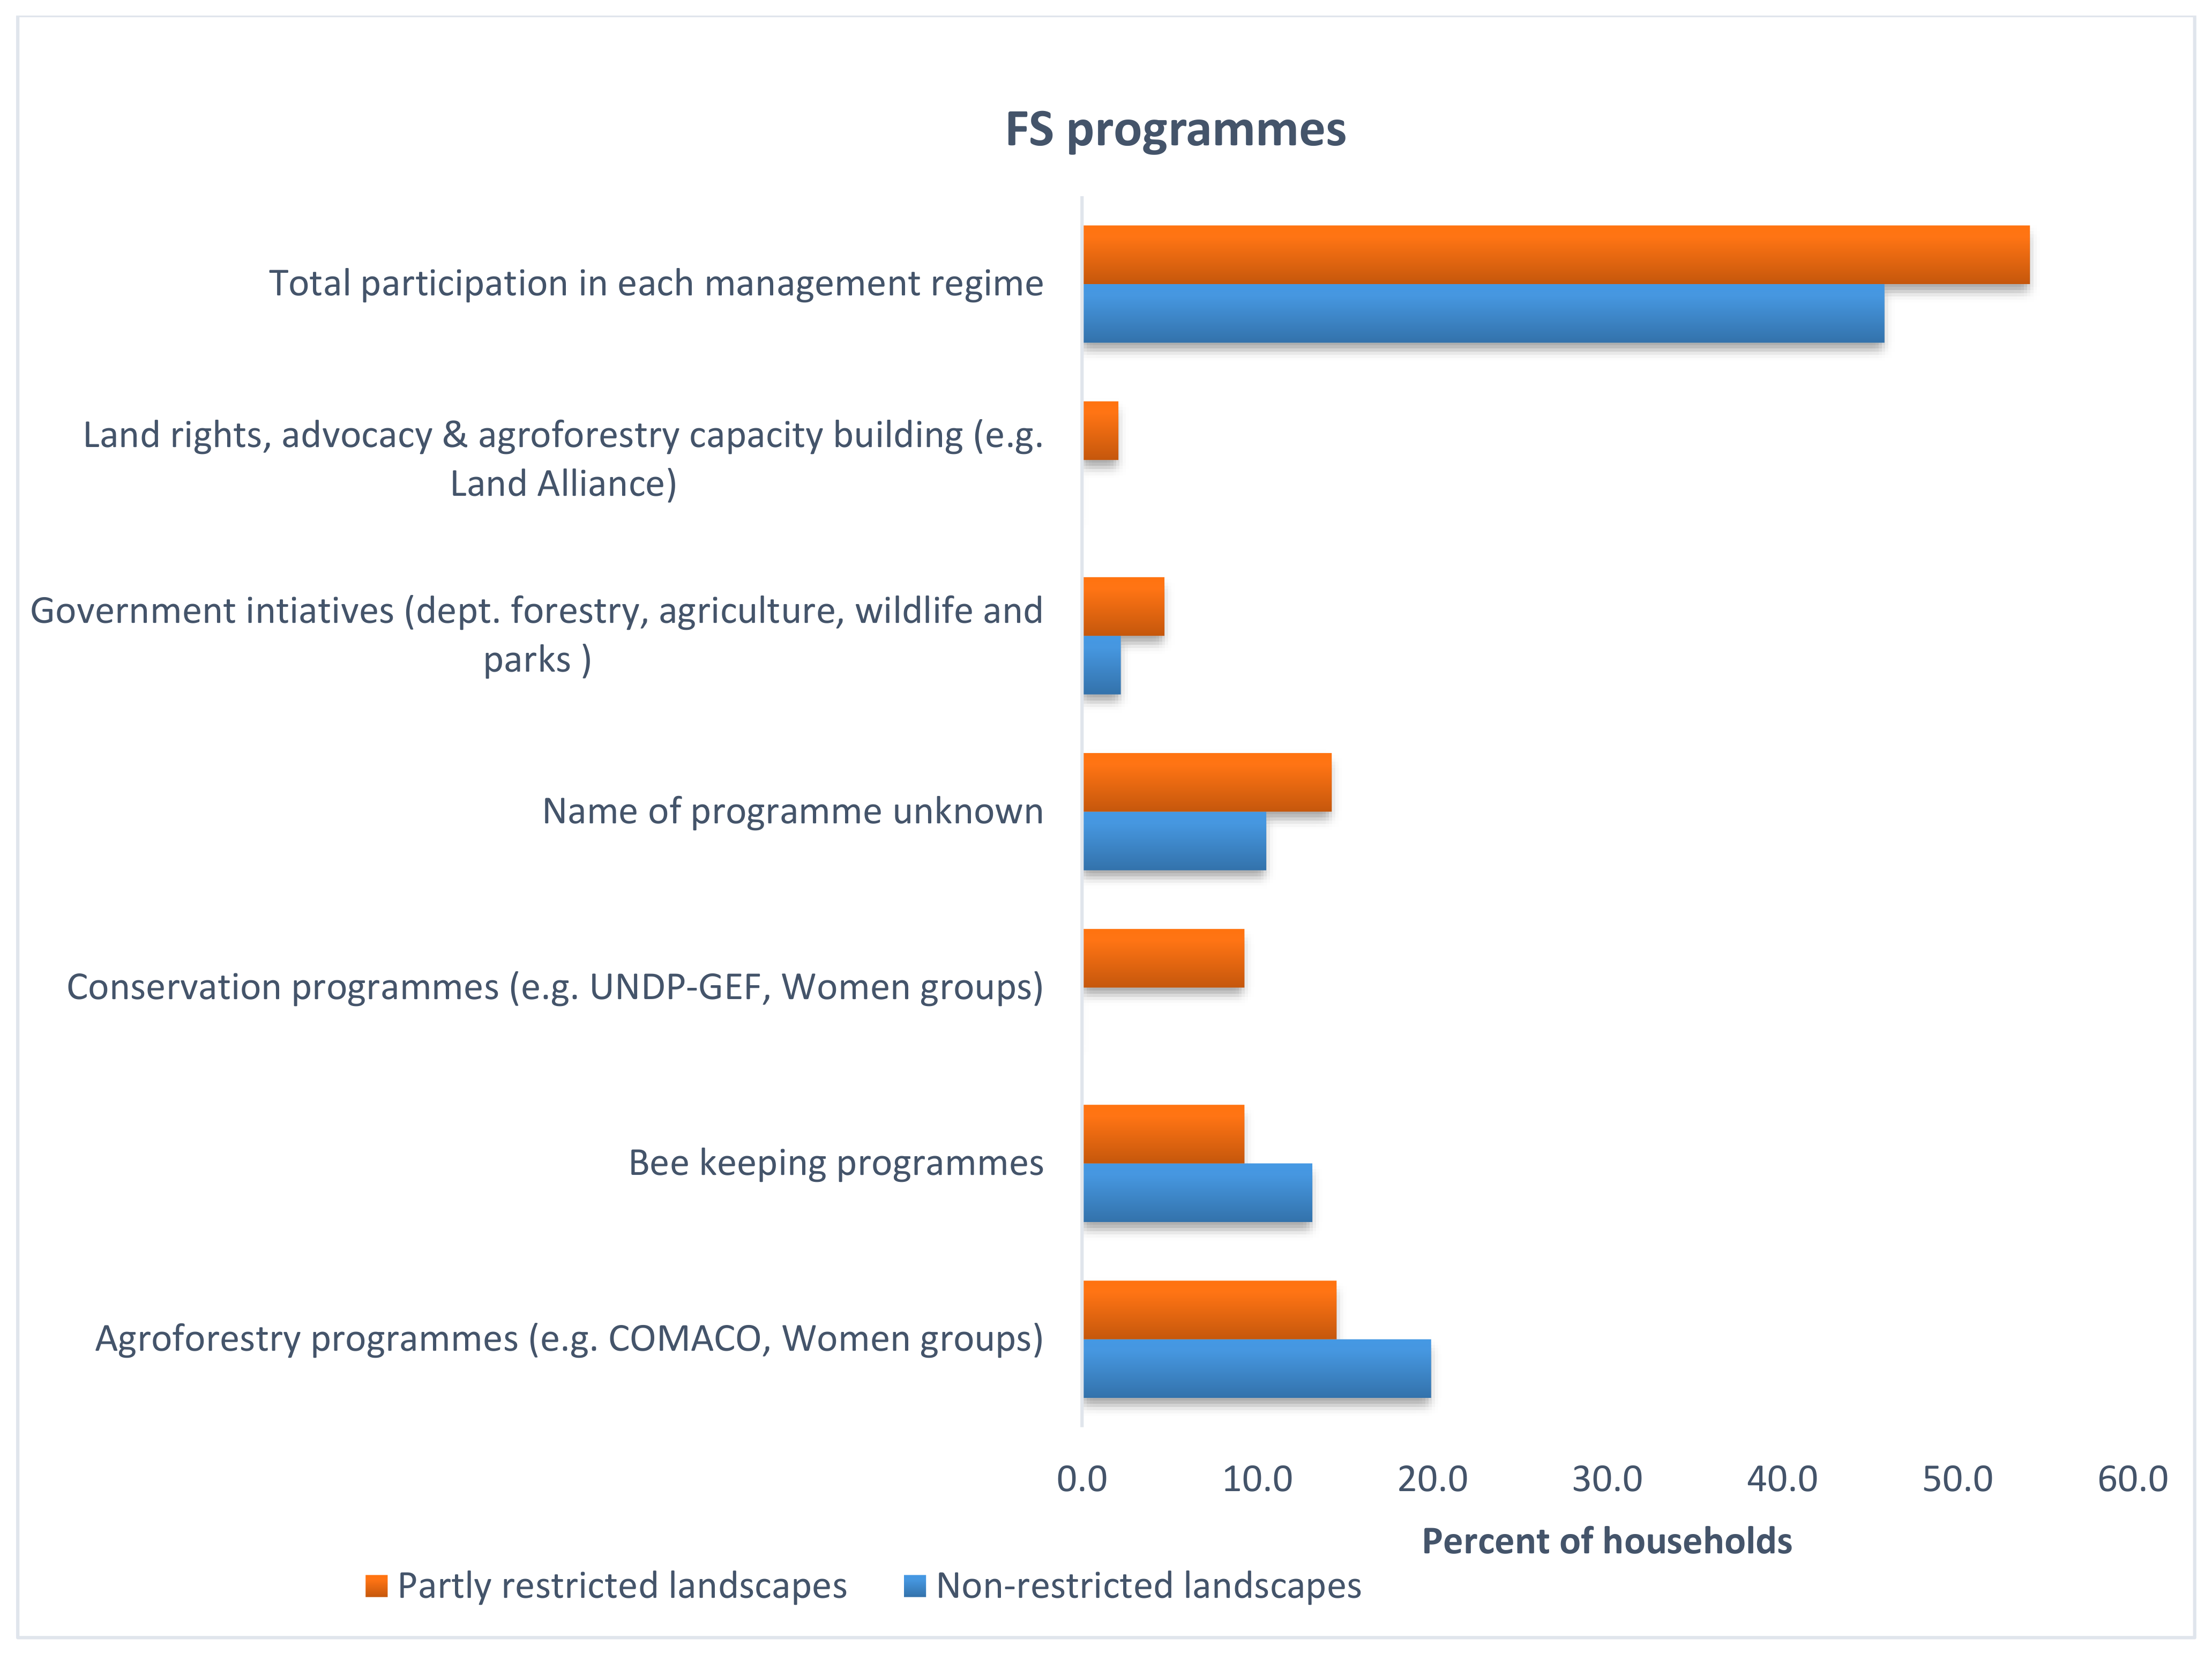
Forest Support (FS) Programmes in the Miombo Landscapes of Zambia

Forest support programmes have been defined as any forest support programme that provides any payments or benefits to households or communities under mutually accepted conditions to support reforestation and forest-based activities to increase or maintain forest cover in the study area. As a result, these programmes were categorised into six groups, as shown in Figure A1 and Figure A2.
Figure A1. Households reporting FS programmes in the study areas of the North-Western Province, Eastern Province and Copperbelt Province. Source: Own computation from household survey 2017–2019.
Sustainability 13 02713 g0a1
Figure A2. Households reporting FS programmes in restricted landscapes (partly restricted) and non-restricted landscapes in the study area. Source: Own computation from household survey 2017–2019.
Sustainability 13 02713 g0a2

Appendix B

Table A1. Absolute household income in the study area.
Source of IncomeMean a (SD)Share of the Sample (%)
Forest subsistence income (unprocessed products)2630.7 (2677.2)27.1 (15.8)
Charcoal income (processed forest product)2224.0 (6690.9)22.9 (39.4)
Crop income, subsistence1457.5 (1482.9)15.0 (8.7)
Crop income, cash 1928.5 (3237.7)19.9 (19.1)
Livestock income834.1 (1556.1)8.6 (9.2)
Capture fish income37.2 (114.1)0.4 (0.7)
Off-farm income211.5 (425.6)2.2 (2.5)
Non-farm income374.2 (806.9)3.9 (4.8)
Total household income9697.7 (9770.2)100
a Income is calculated as net values in Zambian kwacha (ZMW). At the time of data collection (2017–2019), 1 USD = 10.13 ZMW [109]. Standard Deviation (SD) in parentheses.

Appendix C

In the first page of the household questionnaire, the following words were read to the respondent:
We are conducting a survey about how people in your village use the land and the role that forests play for their livelihoods. This research aims to understand how forest management can be improved and benefit the local people. This study is conducted in several villages in this province and other parts of the country. The data will be exclusively used for scientific purposes, published in scientific publications, and presented at national, regional, or local workshops at the end of the research. You will benefit from the knowledge gained through the discussion.
Your participation in this survey is voluntary. If you do not want to participate or answer some questions, you can say it without any problem. If you feel uncomfortable at some point and do not want to continue, please let me know.
Your response is anonymous and confidential; no one in the community will know your answers. We also have no relationship with the government authorities, so your answers will not be shared.
If my question is not clear or if you want any further explanation, please feel free to ask.
Your household has been randomly selected to answer some questions about this topic, and we would like to know if it would be possible for you to answer a survey, which lasts around 1 h? Yes ____ No ___
If the answer is no, say thank you and proceed with the next selected household.
Before we start with the questions, I would like to confirm with you:
Do you give your consent to continue the survey? _____Y/N___

References

  1. Hutton, J.; Adams, W.M.; Murombedzi, J.C. Back to the barriers? Changing narratives in biodiversity conservation. In Forum for Development Studies; Taylor & Francis Group: London, UK, 2005; Volume 32, pp. 341–370. [Google Scholar]
  2. Angelsen, A.; Jagger, P.; Babigumira, R.; Belcher, B.; Hogarth, N.J.; Bauch, S.; Börner, J.; Smith-Hall, C.; Wunder, S. Environmental Income and Rural Livelihoods: A Global-Comparative Analysis. World Dev. 2014, 64, S12–S28. [Google Scholar] [CrossRef] [Green Version]
  3. Vincent, J.R.; Carson, R.T.; DeShazo, J.; Schwabe, K.A.; Ahmad, I.; Chong, S.K.; Chang, Y.T.; Potts, M.D. Tropical countries may be willing to pay more to protect their forests. Proc. Natl. Acad. Sci. USA 2014, 111, 10113–10118. [Google Scholar] [CrossRef] [PubMed] [Green Version]
  4. Babigumira, R.; Angelsen, A.; Buis, M.; Bauch, S.; Sunderland, T.; Wunder, S. Forest clearing in rural livelihoods: Household-level global-comparative evidence. World Dev. 2014, 64, S67–S79. [Google Scholar] [CrossRef] [Green Version]
  5. Hosonuma, N.; Herold, M.; De Sy, V.; De Fries, R.S.; Brockhaus, M.; Verchot, L.; Angelsen, A.; Romijn, E. An assessment of deforestation and forest degradation drivers in developing countries. Environ. Res. Lett. 2012, 7, 044009. [Google Scholar] [CrossRef]
  6. Rudel, T.K. The national determinants of deforestation in sub-Saharan Africa. Philos. Trans. R. Soc. B Biol. Sci. 2013, 368, 20120405. [Google Scholar] [CrossRef] [Green Version]
  7. Gibbs, H.K.; Ruesch, A.S.; Achard, F.; Clayton, M.K.; Holmgren, P.; Ramankutty, N.; Foley, J.A. Tropical forests were the primary sources of new agricultural land in the 1980s and 1990s. Proc. Natl. Acad. Sci. USA 2010, 107, 16732–16737. [Google Scholar] [CrossRef] [PubMed] [Green Version]
  8. Fisher, J. No pay, no care? A case study exploring motivations for participation in payments for ecosystem services in Uganda. Oryx 2012, 46, 45–54. [Google Scholar] [CrossRef] [Green Version]
  9. Larson, A.M.; Dahal, G.R. Introduction: Forest Tenure Reform: New Resource Rights for Forest-based Communities? Conserv. Soc. 2012, 10, 77–90. [Google Scholar] [CrossRef]
  10. Danquah, J.A. Analysis of factors influencing farmers’ voluntary participation in reforestation programme in Ghana. For. Trees Livelihoods 2015, 24, 176–189. [Google Scholar] [CrossRef]
  11. Agrawal, A.; Gupta, K. Decentralization and participation: The governance of common pool resources in Nepal’s Terai. World Dev. 2005, 33, 1101–1114. [Google Scholar] [CrossRef]
  12. Geldmann, J.; Barnes, M.; Coad, L.; Craigie, I.D.; Hockings, M.; Burgess, N.D. Effectiveness of terrestrial protected areas in reducing habitat loss and population declines. Biol. Conserv. 2013, 161, 230–238. [Google Scholar] [CrossRef]
  13. Börner, J.; Schulz, D.; Wunder, S.; Pfaff, A. The effectiveness of Forest conservation policies and programs. Annu. Rev. Resour. Econ. 2020, 12, 45–64. [Google Scholar] [CrossRef]
  14. Wily, L.A. Participatory forest management in Africa: An overview of progress and issues. In Second International Workshop on Participatory Forestry in Africa. Defining the Way Forward: Sustainable Livelihoods and Sustainable Forest Management through Participatory Forestry; Citeseer: Arusha, Tanzania, 2002. [Google Scholar]
  15. Wunder, S. Payments for Environmental Services: Some Nuts and Bolts; Occasional paper No.42; CIFOR: Bogor, Indonesia, 2005; Available online: https://www.cifor.org/publications/pdf_files/OccPapers/OP-42.pdf (accessed on 2 December 2020).
  16. Porter-Bolland, L.; Ellis, E.A.; Guariguata, M.R.; Ruiz-Mallén, I.; Negrete-Yankelevich, S.; Reyes-García, V. Community managed forests and forest protected areas: An assessment of their conservation effectiveness across the tropics. For. Ecol. Manag. 2012, 268, 6–17. [Google Scholar] [CrossRef]
  17. Alix-Garcia, J.M.; Shapiro, E.N.; Sims, K.R. Forest conservation and slippage: Evidence from Mexico’s national payments for ecosystem services program. Land Econ. 2012, 88, 613–638. [Google Scholar] [CrossRef]
  18. Pretty, J. Social capital and the collective management of resources. Science 2003, 302, 1912–1914. [Google Scholar] [CrossRef] [PubMed] [Green Version]
  19. Schreckenberg, K.; Luttrell, C. Participatory forest management: A route to poverty reduction? Int. For. Rev. 2009, 11, 221–238. [Google Scholar] [CrossRef]
  20. Dudley, N. Guidelines for Applying Protected Area Management Categories; IUCN: Gland, Switzerland, 2008. [Google Scholar]
  21. Wunder, S. Revisiting the concept of payments for environmental services. Ecol. Econ. 2015, 117, 234–243. [Google Scholar] [CrossRef]
  22. Bray, D.B.; Duran, E.; Ramos, V.H.; Mas, J.-F.; Velazquez, A.; McNab, R.B.; Barry, D.; Radachowsky, J. Tropical deforestation, community forests, and protected areas in the Maya Forest. Ecol. Soc. 2008, 13, 56. [Google Scholar] [CrossRef]
  23. Chhatre, A.; Agrawal, A. Trade-offs and synergies between carbon storage and livelihood benefits from forest commons. Proc. Natl. Acad. Sci. USA 2009, 106, 17667–17670. [Google Scholar] [CrossRef] [PubMed] [Green Version]
  24. Harvey, C.A.; Dickson, B.; Kormos, C. Opportunities for achieving biodiversity conservation through REDD. Conserv. Lett. 2010, 3, 53–61. [Google Scholar] [CrossRef]
  25. Brandt, J.S.; Allendorf, T.; Radeloff, V.; Brooks, J. Effects of national forest-management regimes on unprotected forests of the Himalaya. Conserv. Biol. 2017, 31, 1271–1282. [Google Scholar] [CrossRef] [PubMed]
  26. Dyer, J.; Stringer, L.C.; Dougill, A.J.; Leventon, J.; Nshimbi, M.; Chama, F.; Kafwifwi, A.; Muledi, J.I.; Kaumbu, J.M.K.; Falcao, M.; et al. Assessing participatory practices in community-based natural resource management: Experiences in community engagement from southern Africa. J. Environ. Manag. 2014, 137, 137–145. [Google Scholar] [CrossRef] [PubMed]
  27. Jones, K.W.; Holland, M.B.; Naughton-Treves, L.; Morales, M.; Suarez, L.; Keenan, K. Forest conservation incentives and deforestation in the Ecuadorian Amazon. Environ. Conserv. 2017, 44, 56–65. [Google Scholar] [CrossRef] [Green Version]
  28. Simonet, G.; Subervie, J.; Ezzine-de-Blas, D.; Cromberg, M.; Duchelle, A.E. Effectiveness of a REDD+ project in reducing deforestation in the Brazilian Amazon. Am. J. Agric. Econ. 2019, 101, 211–229. [Google Scholar] [CrossRef] [Green Version]
  29. Kazungu, M.; Zhunusova, E.; Yang, A.L.; Kabwe, G.; Gumbo, D.J.; Günter, S. Forest use strategies and their determinants among rural households in the Miombo woodlands of the Copperbelt Province, Zambia. For. Policy Econ. 2020, 111, 102078. [Google Scholar] [CrossRef]
  30. Njana, M.A.; Kajembe, G.C.; Malimbwi, R.E. Are miombo woodlands vital to livelihoods of rural households? Evidence from Urumwa and surrounding communities, Tabora, Tanzania. For. Trees Livelihoods 2013, 22, 124–140. [Google Scholar] [CrossRef]
  31. Ferrer Velasco, R.; Köthke, M.; Lippe, M.; Günter, S. Scale and context dependency of deforestation drivers: Insights from spatial econometrics in the tropics. PLoS ONE 2020, 15, e0226830. [Google Scholar] [CrossRef] [PubMed]
  32. Dewees, P.A.; Campbell, B.M.; Katerere, Y.; Sitoe, A.; Cunningham, A.B.; Angelsen, A.; Wunder, S. Managing the Miombo woodlands of southern Africa: Policies, incentives and options for the rural poor. J. Nat. Resour. Policy Res. 2010, 2, 57–73. [Google Scholar] [CrossRef] [Green Version]
  33. Chidumayo, E.N.; Gumbo, D.J. The Dry Forests and Woodlands of Africa: Managing for Products and Services; Earthscan: London, UK, 2010. [Google Scholar]
  34. Blackie, R.; Baldauf, C.; Gautier, D.; Gumbo, D.; Kassa, H.; Parthasarathy, N.; Paumgarten, F.; Sola, P.; Pulla, S.; Waeber, P. Tropical Dry Forests: The State of Global Knowledge and Recommendations for Future Research; Cifor: Bogor, Indonesia, 2014; Volume 2. [Google Scholar]
  35. Larson, B.A. Changing the economics of environmental degradation in Madagascar: Lessons from the National Environmental Action Plan process. World Dev. 1994, 22, 671–689. [Google Scholar] [CrossRef]
  36. Baynes, J.; Herbohn, J.; Smith, C.; Fisher, R.; Bray, D. Key factors which influence the success of community forestry in developing countries. Glob. Environ. Chang. 2015, 35, 226–238. [Google Scholar] [CrossRef]
  37. Shrestha, S.; Shrestha, U.B. Beyond money: Does REDD+ payment enhance household’s participation in forest governance and management in Nepal’s community forests? For. Policy Econ. 2017, 80, 63–70. [Google Scholar] [CrossRef]
  38. Lise, W. Factors influencing people’s participation in forest management in India. Ecol. Econ. 2000, 34, 379–392. [Google Scholar] [CrossRef]
  39. Coulibaly-Lingani, P.; Savadogo, P.; Tigabu, M.; Oden, P.-C. Factors influencing people’s participation in the forest management program in Burkina Faso, West Africa. For. Policy Econ. 2011, 13, 292–302. [Google Scholar] [CrossRef]
  40. Jumbe, C.; Angelsen, A. Forest dependence and participation in CPR management: Empirical evidence from forest co-management in Malawi. Ecol. Econ. 2007, 62, 661–672. [Google Scholar] [CrossRef]
  41. Neitzel, K.C.; Caro-Borrero, A.P.; Revollo-Fernandez, D.; Aguilar-Ibarra, A.; Ramos, A.; Almeida-Leñero, L. Paying for environmental services: Determining recognized participation under common property in a peri-urban context. For. Policy Econ. 2014, 38, 46–55. [Google Scholar] [CrossRef]
  42. Dolisca, F.; Carter, D.R.; McDaniel, J.M.; Shannon, D.A.; Jolly, C.M. Factors influencing farmers’ participation in forestry management programs: A case study from Haiti. For. Ecol. Manag. 2006, 236, 324–331. [Google Scholar] [CrossRef]
  43. Chaturvedi, R.; Raghubanshi, A.; Tomlinson, K.; Singh, J. Impacts of human disturbance in tropical dry forests increase with soil moisture stress. J. Veg. Sci. 2017, 28, 997–1007. [Google Scholar] [CrossRef]
  44. McNicol, I.M.; Ryan, C.M.; Mitchard, E.T. Carbon losses from deforestation and widespread degradation offset by extensive growth in African woodlands. Nat. Commun. 2018, 9, 1–11. [Google Scholar] [CrossRef]
  45. Bwalya Umar, B.; Vedeld, P. Joint Forest Management in Katanino, Zambia: Inappropriate property regime change? Open For. Sci. J. 2012, 5, 42–52. [Google Scholar] [CrossRef] [Green Version]
  46. Phiri, M.; Chirwa, P.W.; Watts, S.; Syampungani, S. Local community perception of joint forest management and its implications for forest condition: The case of Dambwa Forest Reserve in southern Zambia. South For. A J. For. Sci. 2012, 74, 51–59. [Google Scholar] [CrossRef] [Green Version]
  47. MTENR. National Forestry Policy; GRZ: Lusaka, Zambia, 2009; p. 52. [Google Scholar]
  48. GRZ. The Forests Act of Zambia; Government of Zambia (GRZ): Lusaka, Zambia, 2015; p. 60. Available online: http://www.parliament.gov.zm/sites/default/files/documents/acts/The%20Forest%20Act%202015.pdf (accessed on 21 September 2019).
  49. Leventon, J.; Kalaba, F.K.; Dyer, J.C.; Stringer, L.C.; Dougill, A.J. Delivering community benefits through REDD+: Lessons from joint forest management in Zambia. For. Policy Econ. 2014, 44, 10–17. [Google Scholar] [CrossRef] [Green Version]
  50. Larson, A.M.; Barry, D.; Dahal, G.R. New rights for forest-based communities? Understanding processes of forest tenure reform. Int. For. Rev. 2010, 12, 78–96. [Google Scholar] [CrossRef]
  51. Cronkleton, P.; Bray, D.B.; Medina, G. Community forest management and the emergence of multi-scale governance institutions: Lessons for REDD+ development from Mexico, Brazil and Bolivia. Forests 2011, 2, 451–473. [Google Scholar] [CrossRef] [Green Version]
  52. Kalaba, F.K.; Quinn, C.H.; Dougill, A.J. Policy coherence and interplay between Zambia’s forest, energy, agricultural and climate change policies and multilateral environmental agreements. Int. Environ. Agreem-P 2014, 14, 181–198. [Google Scholar] [CrossRef]
  53. Kalaba, F.K. Barriers to policy implementation and implications for Zambia’s forest ecosystems. For. Policy Econ. 2016, 69, 40–44. [Google Scholar] [CrossRef]
  54. Mulenga, B.; Richardson, R.B.; Tembo, G.; Mapemba, L. Rural household participation in markets for non-timber forest products in Zambia. Environ. Dev. Econ. 2014, 19, 487–504. [Google Scholar] [CrossRef]
  55. Handavu, F.; Chirwa, P.W.C.; Syampungani, S. Socio-economic factors influencing land-use and land-cover changes in the miombo woodlands of the Copperbelt province in Zambia. For. Policy Econ. 2019, 100, 75–94. [Google Scholar] [CrossRef] [Green Version]
  56. Kalinda, T.; Bwalya, S.; Mulolwa, A.; Haantuba, H. Use of Integrated Land Use Assessment (ILUA) Data for Forestry and Agricultural Policy Review and Analysis in Zambia; Report Prepared for the Forestry Management and Planning Unit of the Department of Forestry, FAO, and the Zambian Forestry Department; Ministry of Tourism, Environment, and Natural Resource Management: Lusaka, Zambia, 2008; p. 119. [Google Scholar]
  57. Börner, J.; Baylis, K.; Corbera, E.; Ezzine-de-Blas, D.; Ferraro, P.J.; Honey-Rosés, J.; Lapeyre, R.; Persson, U.M.; Wunder, S. Emerging evidence on the effectiveness of tropical forest conservation. PLoS ONE 2016, 11, e0159152. [Google Scholar]
  58. Sunderlin, W.D.; Angelsen, A.; Belcher, B.; Burgers, P.; Nasi, R.; Santoso, L.; Wunder, S. Livelihoods, forests, and conservation in developing countries: An Overview. World Dev. 2005, 33, 1383–1402. [Google Scholar] [CrossRef]
  59. Kalaba, F.K.; Quinn, C.H.; Dougill, A.J. The role of forest provisioning ecosystem services in coping with household stresses and shocks in Miombo woodlands, Zambia. Ecosyst. Serv. 2013, 5, 143–148. [Google Scholar] [CrossRef]
  60. Ellis, F. Rural Livelihoods and Diversity in Developing Countries; Oxford University Press: Oxford, UK, 2000. [Google Scholar]
  61. Soltani, A.; Angelsen, A.; Eid, T.; Naieni, M.S.N.; Shamekhi, T. Poverty, sustainability, and household livelihood strategies in Zagros, Iran. Ecol. Econ. 2012, 79, 60–70. [Google Scholar] [CrossRef]
  62. Adhikari, B.; di Falco, S.; Lovett, J.C. Household characteristics and forest dependency: Evidence from common property forest management in Nepal. Ecol. Econ. 2004, 48, 245–257. [Google Scholar] [CrossRef]
  63. Bush, G.; Hanley, N.; Rondeau, D. Comparing Opportunity Cost Measures of Forest Conservation in Uganda; Implications for Assessing the Distributional Impacts of Forest Management Approaches; Economics discussion paper 12; University of Stirling: Stirling, UK, 2011. [Google Scholar]
  64. Kumar, S. Does “participation” in common pool resource management help the poor? A social cost–benefit analysis of joint forest management in Jharkhand, India. World Dev. 2002, 30, 763–782. [Google Scholar] [CrossRef]
  65. Pearce, D.W.; Pretty, J.N. Economic Values and the Natural World; Earthscan: London, UK, 1993. [Google Scholar]
  66. Timberlake, J.; Chidumayo, E.; Sawadogo, L. Distribution and characteristics of african dry forests and woodlands. In The Dry Forest and Woodlands of Africa: Managing for Products and Services; Earthscan: Abingdon, UK, 2010; pp. 11–42. [Google Scholar]
  67. Chidumayo, E.N. Is charcoal production in Brachystegia-Julbernardia woodlands of Zambia sustainable? Biomass Bioenergy 2019, 125, 1–7. [Google Scholar] [CrossRef]
  68. Chidumayo, E. Species structure in Zambian miombo woodland. J. Trop. Ecol. 1987, 3, 109–118. [Google Scholar] [CrossRef]
  69. MTNER. National Climate Change Response Strategy; Government of the Republic of Zambia: Lusaka, Zambia, 2010. [Google Scholar]
  70. Hansen, M.C.; Potapov, P.V.; Moore, R.; Hancher, M.; Turubanova, S.; Tyukavina, A.; Thau, D.; Stehman, S.; Goetz, S.; Loveland, T. High-resolution global maps of 21st-century forest cover change. Science 2013, 342, 850–853. [Google Scholar] [CrossRef] [PubMed] [Green Version]
  71. Kwesiga, F.R.; Franzel, S.; Place, F.; Phiri, D.; Simwanza, C.P. Sesbania sesban improved fallows in eastern Zambia: Their inception, development and farmer enthusiasm. Agrofor. Syst. 1999, 47, 49–66. [Google Scholar] [CrossRef]
  72. Place, F.; Franzel, S.; DeWolf, J.; Rommelse, R.; Kwesiga, F.; Niang, A.; Jama, B. Agroforestry for soil fertility replenishment: Evidence on adoption processes in Kenya and Zambia. In Natural Resources Management in African Agriculture: Understanding and Improving Current Practices; CAB International: Wallingford, UK, 2002; pp. 155–168. [Google Scholar]
  73. Nansikombi, H.; Fischer, R.; Kabwe, G.; Günter, S. Exploring patterns of forest governance quality: Insights from forest frontier communities in Zambia´s Miombo ecoregion. Land Use Policy 2020, 99, 104866. [Google Scholar] [CrossRef]
  74. CSO. Zambia 2010 Census of Population and Housing; Central Statistical Office: Lusaka, Zambia, 2012; p. 17. [Google Scholar]
  75. Cavendish, W. Quantitative methods for estimating the economic value of resource use to rural households. In Uncovering the Hidden Harvest; Earthscan: London, UK, 2002; pp. 17–65. [Google Scholar]
  76. Owusu, F.Y.; Sseguya, H.; Mazur, R.E.; Njuki, J.M. Determinants of participation and leadership in food security groups in Southeast Uganda: Implications for development programs and policies. J. Rural Community Dev. 2013, 8, 77. [Google Scholar]
  77. Coleman, E.A.; Mwangi, E. Women’s participation in forest management: A cross-country analysis. Glob. Environ. Chang. 2013, 23, 193–205. [Google Scholar] [CrossRef]
  78. Bwalya, S.M. Rural Livelihoods and Collective Action in Joint Forest Management in Zambia; Final Report for SAGA Competitive Research Grants Program; Clark Atlanta University: Atlanta, GA, USA, 2004; Available online: http://www.saga.cornell.edu/images/cau-bwalya.pdf (accessed on 12 December 2020).
  79. Kauneckis, D.; York, A.M. An empirical evaluation of private landowner participation in voluntary forest conservation programs. Environ. Manag. 2009, 44, 468–484. [Google Scholar] [CrossRef] [PubMed]
  80. Jana, S.K.; Lise, W.; Ahmed, M. Factors affecting participation in joint forest management in the West Bengal state of India. J. For. Econ. 2014, 20, 317–332. [Google Scholar] [CrossRef]
  81. Nakakaawa, C.; Moll, R.; Vedeld, P.; Sjaastad, E.; Cavanagh, J. Collaborative resource management and rural livelihoods around protected areas: A case study of Mount Elgon National Park, Uganda. For. Policy Econ. 2015, 57, 1–11. [Google Scholar] [CrossRef]
  82. Zulu, L.C.; Richardson, R.B. Charcoal, livelihoods, and poverty reduction: Evidence from sub-Saharan Africa. Energy Sustain. Dev. 2013, 17, 127–137. [Google Scholar] [CrossRef]
  83. Badal, P.; Kumar, P.; Bisaria, G. Dimensions and determinants of peoples’ participation in watershed development programmes in Rajasthan. Agric. Econ. Res. Rev. 2006, 19, 57–70. [Google Scholar]
  84. Fink, G.; Jack, B.K.; Masiye, F. Seasonal Credit Constraints and Agricultural Labor Supply: Evidence from Zambia; NBER working paper No. 20218; National Bureau of Economic Research (NBER), Massachusetts Ave: Cambridge, MA, USA, 2014. [Google Scholar]
  85. Gebresilassie, L.; Bekele, A. Factors determining allocation of land for improved wheat variety by smallholder farmers of northern Ethiopia. J. Dev. Agric. Econ. 2015, 7, 105–112. [Google Scholar]
  86. Jansen, H.G.; Rodriguez, A.; Damon, A.; Pender, J.; Chenier, J.; Schipper, R. Determinants of income-earning strategies and adoption of conservation practices in hillside communities in rural Honduras. Agric. Syst. 2006, 88, 92–110. [Google Scholar] [CrossRef]
  87. Mushtaq, T.; Sood, K.K.; Peshin, R. Delineating key determinants of domestic fuelwood consumption of rural households in western Himalaya-policy implications. J. Mt. Sci. 2014, 11, 195–204. [Google Scholar] [CrossRef]
  88. Dokken, T.; Angelsen, A. Forest reliance across poverty groups in Tanzania. Ecol. Econ. 2015, 117, 203–211. [Google Scholar] [CrossRef] [Green Version]
  89. Maddala, G.S. Limited-Dependent and Qualitative Variables in Econometrics; Cambridge University Press: Cambridge, UK, 1986. [Google Scholar]
  90. Verbeek, M. A Guide to Modern Econometrics, 2nd ed.; John Wiley & Sons: West Sussex, UK, 2004; pp. 189–201. [Google Scholar]
  91. Hosmer, D.W., Jr.; Lemeshow, S.; Sturdivant, R.X. Applied Logistic Regression; John Wiley & Sons: Hoboken, NJ, USA, 2013; Volume 398. [Google Scholar]
  92. Williams, R. Marginal Effects for Continuous Variables; University of Notre Dame: Paris, France, 2019. [Google Scholar]
  93. Hosmer, D.W.; Lemesbow, S. Goodness of fit tests for the multiple logistic regression model. Commun. Stat. Theory Methods 1980, 9, 1043–1069. [Google Scholar] [CrossRef]
  94. Bierens, H.J. The Logit Model: Estimation, Testing and Interpretation. PennState. Department of Economics. 2008. Available online: http://econ.la.psu.edu/~hbierens/ML_LOGIT.PDF (accessed on 25 October 2008).
  95. Hensher, D.A.; Johnson, L.W. Applied Discrete-Choice Modelling; Routledge: Abington, UK, 2018; pp. 163–178. [Google Scholar]
  96. Bell, C.D.; Roberts, R.K.; English, B.C.; Park, W.M. A logit analysis of participation in Tennessee’s Forest Stewardship Program. J. Agric. Appl. Econ. 1994, 26, 463–472. [Google Scholar] [CrossRef] [Green Version]
  97. Chao, S. Forest Peoples: Numbers across the World; Forest Peoples Programme: Moreton-in-Marsh, UK, 2012; Volume 10, p. 2017. [Google Scholar]
  98. Tembo, S.; Sitko, N. Technical Compendium: Descriptive Agricultural Statistics and Analysis for Zambia; IAPRI working paper No.76; Indaba Agricultural Policy Research Institute: Lusaka, Zambia, 2013. [Google Scholar]
  99. Afoakwah, C.; Deng, X.; Onur, I. Opportunity Cost, Market Returns and Post-Primary Schooling: Evidence from Ghana. Aresearch paper submitted to CSAE 2018. Conference on Economic Development in Africa. 2018. Available online: https://www.semanticscholar.org/paper/opportunity-cost%2C-Market-Returns-and-post-Primary-Afoakwah-Deng/abe71c9265fcb96a42b0382d4d4fa2057265afaa (accessed on 2 December 2020).
  100. Wunder, S.; Börner, J.; Shively, G.; Wyman, M. Safety Nets, Gap Filling and Forests: A Global-Comparative Perspective. World Dev. 2014, 64, S29–S42. [Google Scholar] [CrossRef] [Green Version]
  101. Luoga, E.J.; Witkowski, E.T.F.; Balkwill, K. Economics of charcoal production in miombo woodlands of eastern Tanzania: Some hidden costs associated with commercialization of the resources. Ecol. Econ. 2000, 35, 243–257. [Google Scholar] [CrossRef]
  102. Nyirenda, V.R.; Myburgh, W.J.; Reilly, B.K.; Phiri, A.I.; Chabwela, H. Wildlife crop damage valuation and conservation: Conflicting perception by local farmers in the Luangwa Valley, eastern Zambia. Int. J. Biodivers. Conserv. 2013, 5, 741–750. [Google Scholar]
  103. Mulenga, B.; Hadunka, P.; Richardson, R. Rural households’ participation in charcoal production in Zambia: Does agricultural productivity play a role? J. For. Econ. 2017, 26, 56–62. [Google Scholar] [CrossRef]
  104. Burke, W.J.; Hichaambwa, M.; Banda, D.; Jayne, T.S. The Cost of Maize Production by Smallholder Farmers in Zambia. Working paper No. 50, Food Security Research Project. Lusaka, Zambia. 2011. Available online: https://citeseerx.ist.psu.edu/viewdoc/download?doi=10.1.1.224.9428&rep=rep1&type=pdf (accessed on 17 December 2020).
  105. Mason, N.M.; Jayne, T.; Mofya-Mukuka, R. Zambia’s input subsidy programs. Agric. Econ. 2013, 44, 613–628. [Google Scholar] [CrossRef]
  106. Weston, P.; Hong, R.; Kaboré, C.; Kull, C.A. Farmer-managed natural regeneration enhances rural livelihoods in dryland West Africa. Environ. Manag. 2015, 55, 1402–1417. [Google Scholar] [CrossRef] [PubMed] [Green Version]
  107. Adams, C.; Rodrigues, S.T.; Calmon, M.; Kumar, C. Impacts of large-scale forest restoration on socioeconomic status and local livelihoods: What we know and do not know. Biotropica 2016, 48, 731–744. [Google Scholar] [CrossRef]
  108. GRZ. The Lands Act; Ministry of Legal Affairs, Government of the Republic of Zambia: Lusaka, Zambia, 1995; p. 36. [Google Scholar]
  109. Bank of Zambia. Bank of Zambia Mid Rates. 2018. Available online: http://www.boz.zm/StatisticsFortnightly2018Vol25No12.pdf (accessed on 6 February 2019).
Figure 1. Map of Zambia showing landscapes with protected and non-protected areas in the study provinces of North-Western, Copperbelt and Eastern Province.
Sustainability 13 02713 g001
Table 1. Characteristics of non-participating and participating households in FS programmes in the study area.
Variable DefinitionUnitNon-Participants
(n = 710)
Participants
(n = 413)
The Expected Sign of the Impact on Participation
Mean (SD)
Socio-demographic factors
Age of head of householdYears44.1
(15.0)
46.4
(13.8)
+
Male-headed household%82.581.4+
Head of household attained above primary education%26.619.1+
Household sizeAEU a4.6
(1.9)
4.8
(2.0)
+
Duration of residence in the villageYears15.2
(14.1)
18.1
(15.7)
+
Economic factors
Landholding sizeHectare (Ha)3.5
(6.2)
2.9
(4.1)
-
Access to credit%38.332.7+
Livestock ownershipTLU b0.9
(1.7)
1.2
(2.0)
-
Share of livestock income%8.19.6+
Share of forest income-subsistence (unprocessed products)%27.227.1+
Share of charcoal income (processed product)%21.825.2-
Share of crop income-subsistence%14.615.9+
Share of crop income-cash%21.616.5+
Share of off-farm income%2.12.3-
Share of capture fish income%0.50.2-
Share of non-farm income%4.13.3-
Access factors
Access to permanent roads%41.148.2-
Walking distance from household to the main roadMinutes71.0
(121.4)
27.5
(57.9)
-
Walking distance from household to exclusively used forestlandkm2.5
(1.9)
2.5
(2.2)
-
Walking distance from household to public forestlandkm2.6
(1.8)
1.7
(1.6)
-
Households in landscapes that have a restriction (protected areas) %45.556.2+
Standard deviation (SD) in parentheses. a Adult equivalent units (AEU) as defined by Dokken and Angelsen [88]. b TLU—tropical livestock unit. N= 1123. Source: Own computation from household surveys (2017–2019).
Table 2. Logistic regression results of determinants of participation in Forest Support (FS) programmes.
VariablesCoefficientsMarginal Effect (dy/dx)
Socio-demographic factors
Age of head of household (Years)0.0060.001
(0.005)(0.001)
Male-headed household (Yes = 1; No = 0)0.2360.052
(0.190)(0.041)
Household head attained above primary education (Yes = 1; No = 0)−0.339 **−0.074
(0.169)(0.037)
Household size (Adult equivalent units-AEU)0.0350.008
(0.037)(0.008)
Economic factors
Land holding size (ha)−0.031 *−0.007
(0.016)(0.003)
Livestock income (%)−5.80 × 10⁻⁵−1.27 × 10⁻⁵
(4.97 × 10⁻⁵)(1.09 × 10⁻⁵)
Subsistence forest income (unprocessed forest products) (%)−0.018 ***−0.004
(0.005)(0.001)
Charcoal income (processed forest products) (%)−0.012 ***−0.003
(0.004)(0.001)
Cash crop income (%)−0.023 ***−0.005
(0.005)(0.001)
Capture fish income (%)−0.264 ***−0.058
(0.065)(0.014)
Non-farm income (%)−0.019 ***−0.004
(0.007)(0.001)
Access factors
Walking distance from household to main road (minutes)−0.004 ***−0.001
(0.001)(0.000)
Walking distance from household to public forestland (km) −0.310 ***−0.068
(0.051)(0.011)
Household in landscapes with protected forest area (Yes = 1; No = 0)0.620 ***0.136
(0.141)(0.031)
Constant0.878 **
(0.435)
LR X2 (14)197.56
Prob > X20.000
McFadden’s R20.13
Log-likelihood−639.88
Observations11231123
*** p < 0.01, ** p < 0.05, * p < 0.1. Standard errors in parentheses.
Publisher’s Note: MDPI stays neutral with regard to jurisdictional claims in published maps and institutional affiliations.

