Article

Evaluation of Food Waste at a Portuguese Geriatric Institution

by
Margarida Liz Martins
1,2,3,4,
Ana Sofia Henriques
5 and
Ada Rocha
3,5,6,*
1
Biology and Environment Department, University of Trás-Os-Montes e Alto Douro, 5000-801 Vila Real, Portugal
2
CBQF—Centro de Biotecnologia e Química Fina—Laboratório Associado, Universidade Católica Portuguesa, 4169-005 Porto, Portugal
3
GreenUPorto—Sustainable Agrifood Production Research Centre, 4485-646 Vairão, Portugal
4
CITAB—Centre for the Research and Technology of Agro-Environmental and Biological Sciences, 5000-801 Vila Real, Portugal
5
Faculty of Food Science and Nutrition, University of Porto, 4150-180 Porto, Portugal
6
LAQV-Requimte, University of Porto, 4150-180 Porto, Portugal
*
Author to whom correspondence should be addressed.
Sustainability 2021, 13(5), 2452; https://doi.org/10.3390/su13052452
Submission received: 28 January 2021 / Revised: 8 February 2021 / Accepted: 22 February 2021 / Published: 24 February 2021
(This article belongs to the Special Issue Sustainable Food Production and Consumption)

Abstract

:
Care institutions attending to older adults are responsible for their food supply, which influences their health and quality of life. Food waste at care institutions has been reported to be a matter of great concern, that requires regular monitoring. In this study, we aim to quantify food waste in the food service of an elderly institution, both as leftovers and plate waste. Data collection was performed over 15 consecutive days, at lunch and dinner served to older adults. The aggregate weighing of food was performed before and after distribution, as well as after consumption. Leftovers and plate waste were calculated by the differences in weight. During the study period, 2987 meals were evaluated, corresponding to 1830 kg of food produced, of which only 67% was consumed. For each meal, approximately 610 g of food was produced per older adult, and only about 410 g were consumed, corresponding to 150 g of leftovers and 50 g of plate waste. Food waste represented 36.1% of meals served, composed of 24.1% leftovers and 12.0% plate waste. The wasted meals would be enough to feed 1486 older adults and would correspond to annual losses of approximately €107,112. Leftovers and plate waste were above the limits of acceptability (below 6% and 10%, respectively), indicating excessive food waste. High values of leftovers are related to the food service system and staff, pointing to the need for improvements during the planning and processing of meals. On the other hand, high plate waste values are associated with consumers, indicating the low adequacy of the menu regarding to older adults’ habits and preferences.

1. Introduction

The increasing proportion of older adults over the age of 65 is a reality that has been emerging over the last decades. It is expected that, in the next 50 years, the proportion of the elderly in the population will grow significantly; by one estimate, in 2060, there will be three elderly people for each young person [1]. According to the latest official national data, in Portugal, about 19% of the population is over the age of 65 and about 4.2% is institutionalized in care support institutions [2].
Care institutions attending to older adults are responsible for their food supply, which influences older adults’ nutritional status and consequently their health and quality of life. Food and meals are a central issue in the life of old people and play a significant role in elderly institutions [3,4,5].
The satisfaction of older adults with meals is one of the main factors contribution to reducing malnutrition and optimizing institutional service [6,7,8]. High levels of plate waste contribute to malnutrition-related complications in institutionalized older adults [7,8,9]. Inadequate food intake can result from multiple causes associated with the aging process, such as motor and cognitive constraints, losses of gastrointestinal function (dentition, swallowing, digestion, etc.), loss of appetite and decreased sensory abilities, among other physiological processes which may result from pathological situations [9,10]. Several other causes have been described related to institutionalization itself, the loss of family or a spouse, isolation and social marginalization, reduction of purchasing power [10,11,12], entrenched eating habits, preferences [3,12,13] and the lack of quality of the food service [3,14,15].
Food waste assessment allows dietary intake to be estimated and intervention needs in the food service to be identified. An efficient food service should deliver both good value meals for older adults and high-quality nutrition with minimal waste. The main goal is to promote the acceptability of meals, contributing to an adequate nutritional intake while at the same time minimizing food waste [15]. Waste at a food service is usually associated with inefficiencies in the food production system, and food waste quantification may be used as an indicator of service quality [16].
Food waste is a matter of great concern for governments and institutions as it has financial, environmental, ethical, political and social impacts [17,18,19,20,21]. In food service, it may occur at all stages of the food production system, including storage, meal preparation, cooking and distribution [17,21,22]. Monitoring plate waste (corresponding to food that is served but not consumed) allows for the evaluation of the adequacy of portions in relation to consumers’ needs as well as menu acceptability [13,23]. According to several authors, food waste below 10% is considered acceptable [24,25]. Plate waste in hospitals and geriatric institutions has been found to be higher than in other food service settings [7,10,16,20,22,23].
The objective of this study is to evaluate the food waste at an elderly institution determined by leftovers and plate waste and its economic impact, with the aim of improving food service efficiency, as well as contributing to the promotion of older adults’ nutritional status.

2. Materials and Methods

This study was developed in a private long-stay geriatric institution with a capacity of 120 beds. The food service works in a cook-and-serve system with a staff of 10 persons.
The typical meal included a soup, a main dish (meat or fish, carbohydrates and vegetable sources) or a diet dish and dessert (fruit or sweet). All meals served at lunch and dinner to 103 older adults during the study period were included. Lunch was served from 12.00 to 13.00 and dinner from 18.00 to 19.00.
Food waste was evaluated by leftovers and plate waste determination, using the aggregated weighing method by weighing all meal components together.
Leftovers correspond to the food that is prepared and cooked but not served to consumers, and it is usually associated with inefficiencies of meal planning. To evaluate leftovers, all containers were weighed empty and after the plating of meals. At the end of the meal, containers were collected and weighed. The amount of leftovers was determined by the weight difference between initial and final values. The percentage of leftovers was calculated by the ratio of leftovers (g) to the food produced (g) [25,26]. According to NHSE Hospitality, values of 6% are considered acceptable [25].
Plate waste refers to food left on the plate by consumers that is discarded. To evaluate plate waste, plates were collected after the meal, non-edible items were removed and food waste was separated into individual garbage bags for the soup, dish, diet dish and dessert. Food served (g) was determined by the difference between the total food produced (g) and the amount of leftovers (g). Food consumed (g) was calculated by the difference between the amount of food served (g) and plate waste (g). The amounts of food served, consumed and wasted per capita were obtained by the ratio between these values and the number of meals served. The percentage of plate waste was calculated by the ratio of food discarded to the food served to older adults [26]. Different guidelines state that values below 10% are considered acceptable [24,25].
The hypothetical number of older adults that could be fed with food that was not wasted was obtained by the ratio between the amount of leftovers (g) or plate waste (g), respectively, and the individual portion.
Meal cost was determined by taking into account the expenses involved with raw materials, labor and resources for meal planning and preparation. The cost associated with plate waste was calculated by the number of older adults that could be fed with plate waste multiplied by the meal cost.
All weighing was performed on a digital scale accurate to the nearest gram (SECA_ model 851, Germany).
Statistical software package IBM SPSS Statistics, version 22.0 and Excel Microsoft Office Program Professional Plus 2010 were used for data analyses. Mean, standard deviations (SD) and maximum and minimum values were used to provide descriptive analysis. The Mann–Whitney test was used to compare plate waste and leftovers according to the protein source (meat or fish) and meal (lunch or dinner), and the Spearman correlation was used to correlate food produced, leftovers and plate waste. The confidence level was set at 95%.

3. Results

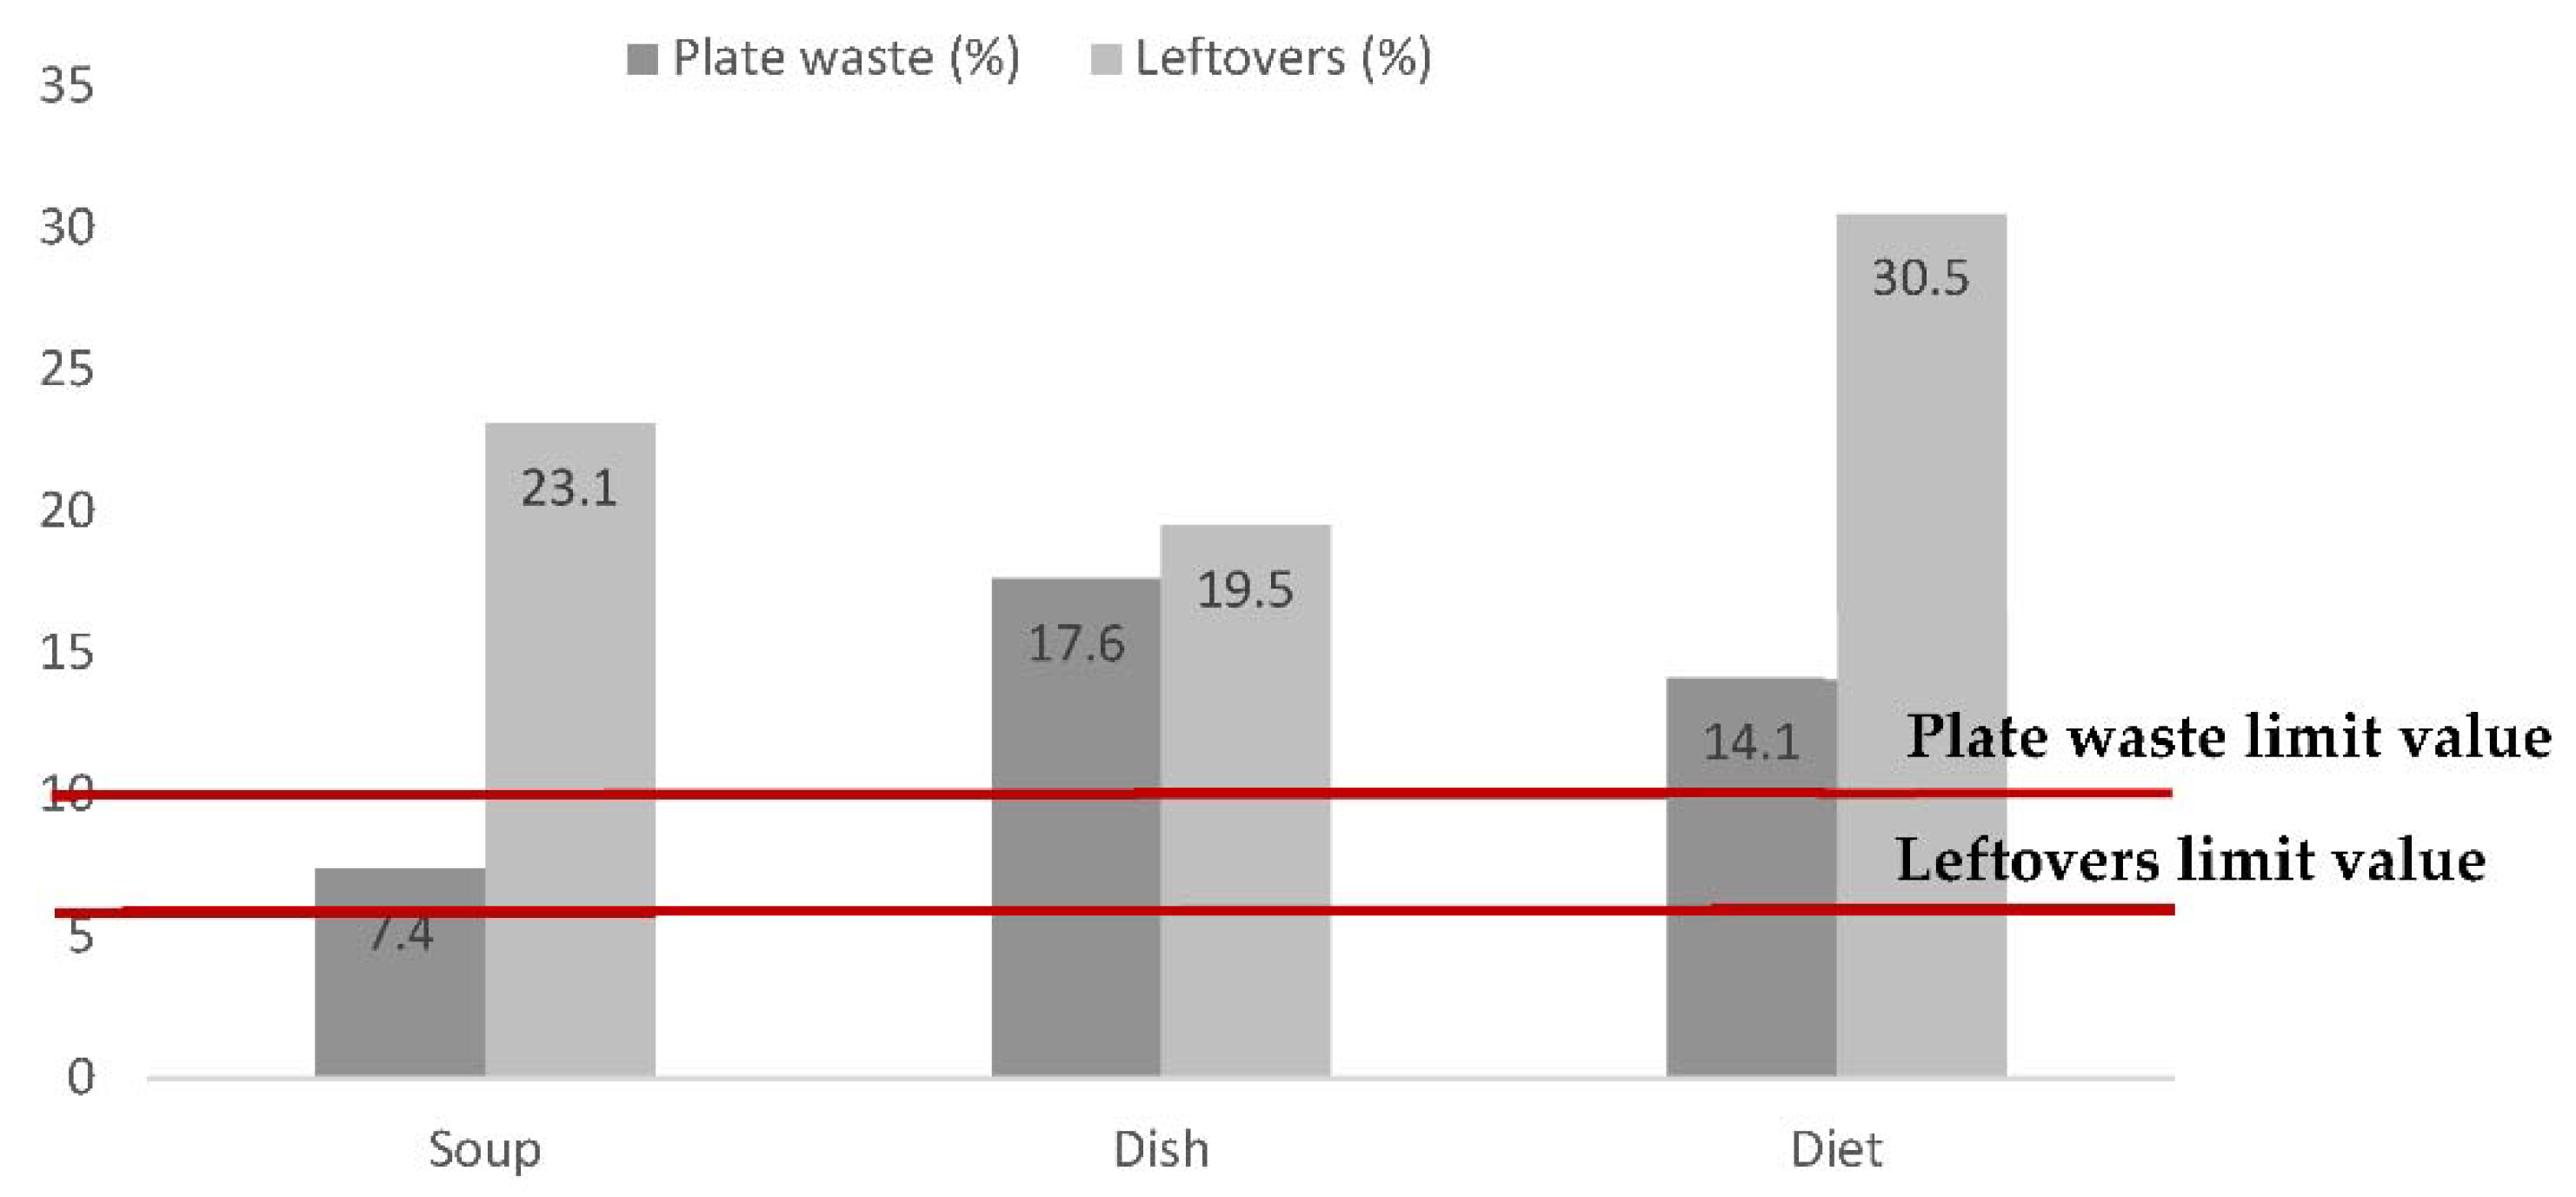
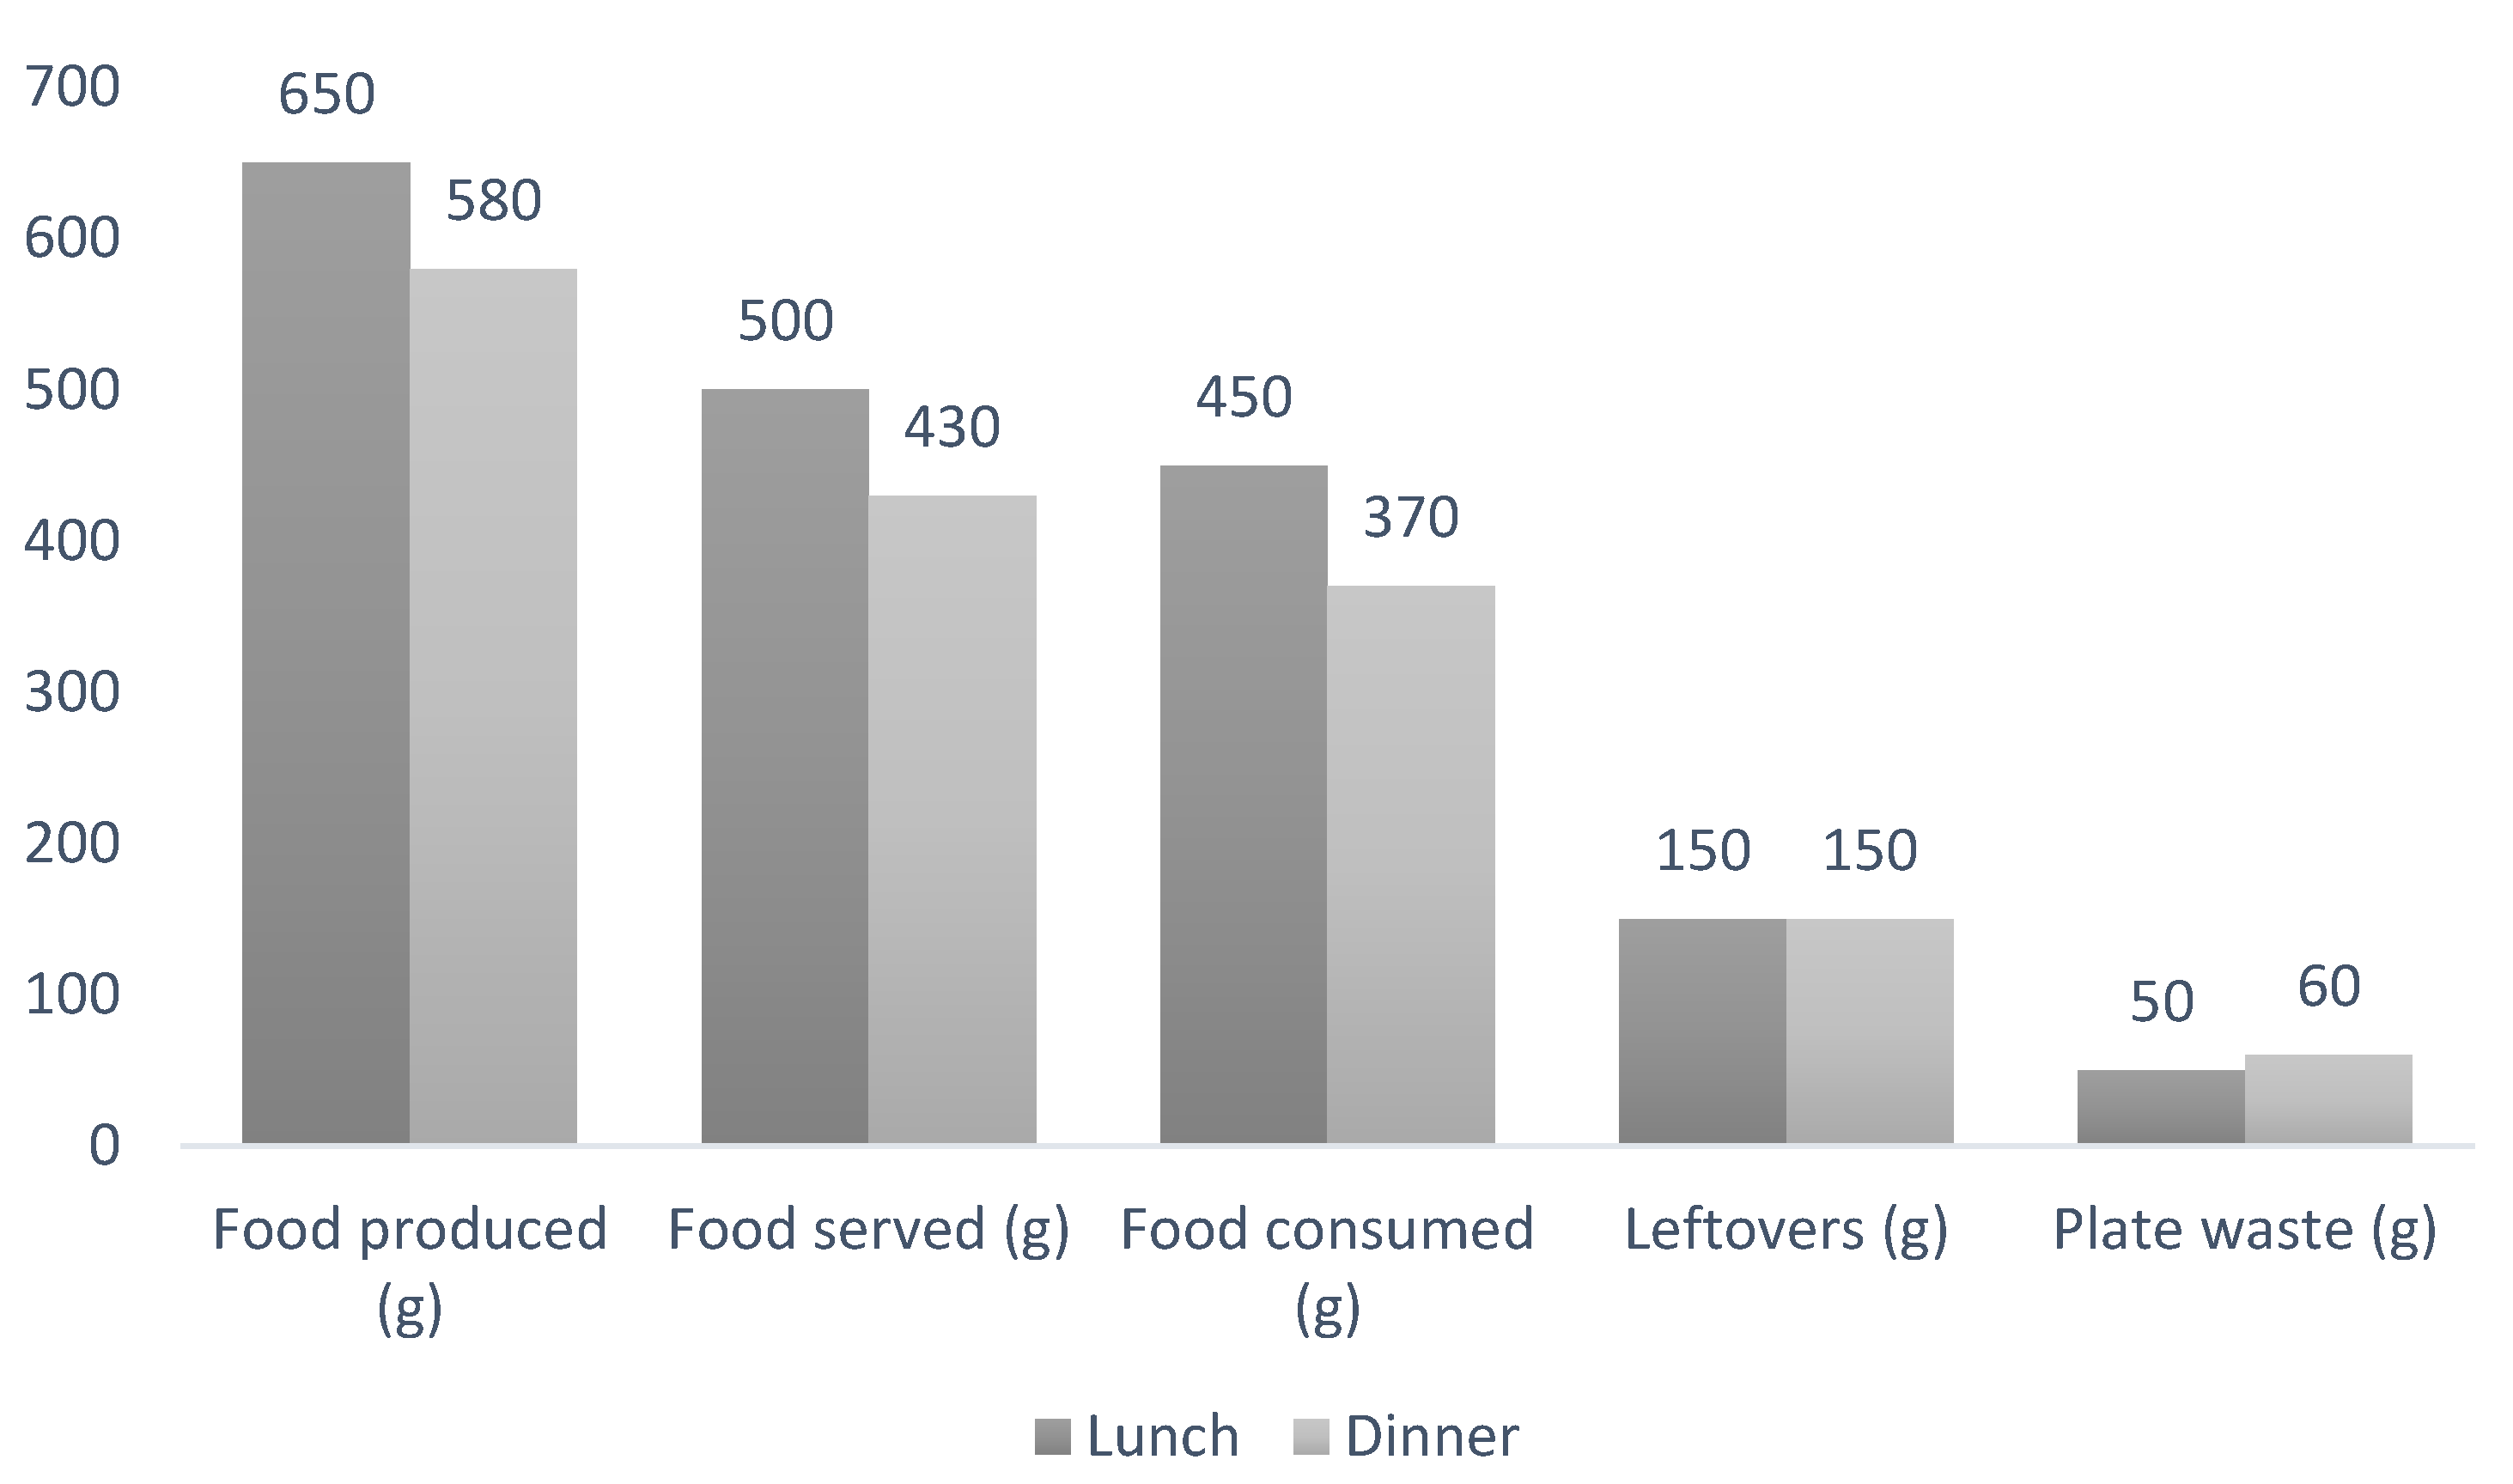
3.1. Food Produced, Served, Consumed and Wasted

During the study period, 2987 meals were evaluated, corresponding to about 1830 kg of food produced, of which only 67% was consumed. Approximately 608 kg was wasted, corresponding to about 40.5 kg of food wasted per day. For each meal, approximately 610 g of food was produced for each older adult, while only about 410 g was consumed, corresponding to 150 g of leftovers and 50 g of plate waste.
Food waste represented 36.1% of meals served during the study period, corresponding to 24.1% of leftovers and 12.0% of plate waste. The food produced, served, consumed and wasted according to the meal component is presented in Table 1.
Soup leftovers ranged between 12.2% and 27.8%, with an average value of 23.1%, and plate waste ranged between 4.7% and 9.3%, with an average value of 7.4% (Table 1).
An average value of 19.5% of leftovers was found for the main dish, with the highest value for a fish dish (48.8%) and the lowest for a meat dish (3.2%). The main dish plate waste ranged between 9.2% and 27.5%, both corresponding to fish dishes, presenting an average value of 17.6% (Table 1).
Regarding the diet dish, 16 different types of dishes were included, and leftovers ranged between 14.7% and 57.1%, with an average value of 30.5%. About 8 kg was wasted after meal consumption, corresponding to 370 g per older adult. Plate waste ranged between 0% and 30.9%, with an average value of 14.1% (Table 1).
Leftovers were above the limit of acceptability for all different meal components (6%). Soup waste values were the only values below the limit of acceptability (10%) (Figure 1).
Plate waste was higher for fish dishes (19.0%) than meat dishes (16.6%) (Table 2) for both the main dish and diet dish (p < 0.05).
Comparing the food produced and wasted during lunch and dinner, leftovers were higher at dinner (25.9%) than at lunch (22.8%). The same tendency was observed for plate waste, which was higher at dinner (13.4%) than t lunch (10.9%) (p < 0.05). Considering the food produced and served per older adult, a higher quantity was observed for lunch than for dinner. Each older adult wasted about 50 g at lunch and 60 g at dinner (Figure 2).

3.2. Food Waste—Social and Economic Impact

Considering the mean portion consumed by older adults, the amount of wasted meals would be enough to feed 1486 older adults (Table 3). Taking into account the meal cost, it is possible to estimate that the financial losses resulting from food waste corresponded to approximately €4458 during the study period and resulted in annual losses of approximately €107112 (Table 3).

4. Discussion

Food waste was determined to be 36% in this study, corresponding to approximately 150 g per capita per meal—far above the limits of acceptability according to previous studies developed in different settings [9,15,16,18,27]. According to other authors, since there is no standard limit for food waste, each food service must monitor food waste as a routine to develop a target and define the limits according to specific characteristics and consumers [16,18,25]. The values found in this study are considered unacceptable since the target population includes long-term residents and the number of older adults is constant; this should allow more accurate estimations of quantities to be produced.
Other authors in an Italian hospital setting reported a food waste value of 41.6% [15].
In a Portuguese case study developed at a hospital, it was observed that plate waste represented 35% of the food served. The authors showed that 0.5% of the Portuguese National Health budget is squandered as food waste considering economic losses [18].
In our study, plate waste was higher at dinner. Opposite results were found in a Spanish study, showing a plate waste of 37.7 ± 29.9% for lunch and 30.4 ± 23.6% for dinner [9].
Williams and Walton reviewed 32 studies in health settings and showed that plate waste values ranged between 9.1% and 42.9% [7].
The amount of food waste may be affected by several factors, such as the poor diversity of the menu, the inadequacy of menus to the food and cultural habits of older adults, inadequate per capita portions and poor appearance of meals [6,10,12,15,27]. Considering that meal portions are determined to satisfy the nutritional needs of older adults, high continuous values of plate waste may compromise their nutritional intake and contribute to undernutrition, reported as an important concern in this age group [4,9,15].
Monitoring food portions that are effectively plated and evaluating consumer’s intake and satisfaction may be useful to identify the specific causes of food waste. This may allow the implementation of measures to avoid waste and optimize foodservice efficiency [15,16]. The use of standard recipes for every meal preparation would enable menu standardization, contribute to meal planning and decrease food waste. Food handlers’ awareness about the importance of waste control is essential to engage the whole food service team on this effort [15,16].
In this study the average amount of plate waste was 12%—slightly above the 10% recommended. This value was probably related to the target group. Older adults usually have constraints that affect food behavior, such as physiological changes associated with aging. Loss of sensorial capacities, difficulties in chewing and other physical limitations usually compromise food intake, contributing to plate waste [6,9,10,15]. Additionally, psychological factors such as widowhood, leaving home, depression and loss of cognitive capacity may also affect food intake. Changes in the food offer and the modification of routines also affect food intake and the satisfaction of institutionalized older adults. Inadequate portioning, the poor appearance of meals, diet inadequacy with regards to chewing limitations and the absence of assistance during meals are usually associated with higher values of food waste by older adults [6,8,9,10,15].
According to Sanga, in a hospital setting, lack of appetite was mentioned by 50% of consumers as the main factor affecting the acceptance of meals. The causes for poor appetite are related to aging, medication, poor dentition and loss of sensorial capacity [28]. Additionally, food waste was also related to consumers’ lack of awareness of the environmental/social/economic costs of food waste.
Only soup presented a food waste value in the range of acceptability, pointing to a higher satisfaction of older adults with this specific food preparation.
The high food waste values found for diet dishes may be related to consumers rather than to preparation characteristics. This type of meal is mainly served to consumers with diet restrictions, which is frequently associated with a lack of appetite. On the other hand, this kind of preparation is usually less flavored and has low amounts of salt. Satisfaction with food is highly related to sensorial meal characteristics, such as taste, flavor, texture, temperature and smell [6,8]. Considering the poor diversity of diet preparations and their poor sensory characteristics, the higher waste values were expected.
Fish-based dishes presented higher leftovers and plate waste values. Constraints associated to older adults’ loss of hand mobility may contribute to the higher plate waste; for example, difficulties cutting and removing bones from fish.
Plate waste can be evaluated by weighing food, a visual estimation of the amount of food remaining on the plate or by a consumer report after the meal. The weighing method is the most accurate method to evaluate food waste, minimizing the bias associated with the observer’s subjectivity and to memory and social desires that frequently occur in visual estimation and self-reporting, respectively [26]. Additionally, in these specific target group—older adults with some cognitive disabilities—methodologies that do not interfere with individuals should be preferred.
Taking into account the results from this study, it is important to develop strategies to reduce food waste. Combined efforts, consisting of engaging employees involved in meal preparation and distribution, as well as increasing consumers’ awareness about food waste, are required. Additionally, it is important for each institution to monitor their own food waste and identify effective strategies to improve the nutritional intake of their vulnerable users [7].
It is also important to define limits for food waste in different settings in order to establish institutional goals for food handlers that should be evaluated and monitored continuously. This goal will help food services to meet the sustainable development goals: “By 2030, halving per capita global food waste at the retail and consumer levels and reducing food losses along production and supply chains, including post-harvest losses” [29].
In order to promote food acceptability by consumers, it is recommended to standardize processes to ensure the quality of meals. Satisfaction surveys may also be useful to evaluate older adults’ satisfaction. Consumer participation in menu planning may also be useful to promote menu adequacy.

5. Conclusions

The value of food waste was 36% in this study, corresponding to approximately 150 g per capita per meal. This amount would be enough to feed 1486 older adults and corresponds to an annual loss of approximately €107,112.
Leftovers and plate waste were above the limits of acceptability (below 6% and 10%, respectively), indicating excessive food waste. High values of leftovers are related to the food service system and staff, pointing to the need for improvements during planning and processing of meals. On the other hand, high plate waste values are associated to consumers, indicating low menu adequacy to older adults’ habits and preferences. Control of food waste will deliver significant benefits, including a decrease in the amount of organic residues produced, increases of profits and the improvement of the satisfaction and nutritional status of older adults.

Author Contributions

Methodology, formal analysis, data curation and writing—original draft preparation, M.L.M.; data curation and investigation, A.S.H.; conceptualization, writing—review and editing and supervision, A.R. All authors have read and agreed to the published version of the manuscript.

Funding

This research received no external funding.

Institutional Review Board Statement

Not applicable.

Informed Consent Statement

Not applicable.

Acknowledgments

This research was supported by National Funds by FCT—Portuguese Foundation for Science and Technology—within the scope of UIDB/50016/2020, UIDB/05748/2020, UIDP/05748/2020 and UIDB/04033/2020. The authors thank Phil Lonsdale for the English grammar and structure revision of the manuscript.

Conflicts of Interest

The authors declare no conflict of interest.

References

  1. Instituto Nacional de Estatística (INE). Projeções de População Residente em Portugal 2008–2060. 2009. Available online: https://www.ine.pt/ (accessed on 14 March 2020).
  2. Instituto Nacional de Estatística (INE). Estatísticas de Portugal. Recenseamento da População e Habitação—Census 2011. 2012. Available online: http://censos.ine.pt (accessed on 4 January 2021).
  3. Hansen, K.V. Food and meals in caring institutions—A small dive into research. Int. J. Health Care Qual. Assur. 2016, 29, 380–406. [Google Scholar] [CrossRef]
  4. Sellier, C. Malnutrition in the elderly, screening and treatment. Soins Gerontol. 2018, 23, 12–17. [Google Scholar] [CrossRef] [PubMed]
  5. Iuliano, S.; Olden, A.; Woods, J. Meeting the nutritional needs of elderly residents in aged-care: Are we doing enough? J. Nutr. Health Aging 2013, 17, 503–508. [Google Scholar] [CrossRef] [PubMed]
  6. Lee, K.H.; Mo, J. The Factors Influencing Meal Satisfaction in Older Adults: A Systematic Review and Meta-analysis. Asian Nurs. Res. (Korean Soc. Nurs. Sci.) 2019, 13, 169–176. [Google Scholar] [CrossRef] [Green Version]
  7. Williams, P.; Walton, K. Plate waste in hospitals and strategies for change. Eur. J. Clin. Nutr. Met. 2011, 6, 235–241. [Google Scholar] [CrossRef] [Green Version]
  8. McAdams, B.; von Massow, M.; Gallant, M. Food Waste and Quality of Life in Elderly Populations Living in Retirement Living Communities. J. Hous. Elder. 2018, 33, 1–13. [Google Scholar] [CrossRef]
  9. Simzari, K.; Vahabzadeh, D.; Nouri Saeidlou, S.; Khoshbin, S.; Bektas, Y. Food intake, plate waste and its association with malnutrition in hospitalized patients. Nutr. Hosp. 2017, 34, 1376–1381. [Google Scholar] [PubMed]
  10. Keller, H.H.; Carrier, N.; Slaughter, S.E.; Lengyel, C.; Steele, C.M.; Duizer, L.; Morrison, J.; Brown, K.S.; Chaudhury, H.; Yoon, M.N.; et al. Prevalence and Determinants of Poor Food Intake of Residents Living in Long-Term Care. J. Am. Med. Dir. Assoc. 2017, 18, 941–947. [Google Scholar] [CrossRef] [Green Version]
  11. Stroebele-Benschop, N.; Depa, J.; de Castro, J.M. Environmental Strategies to Promote Food Intake in Older Adults: A Narrative Review. J. Nutr. Gerontol. Geriatr. 2016, 35, 95–112. [Google Scholar] [CrossRef]
  12. Whitelock, E.; Ensaff, H. On Your Own: Older Adults’ Food Choice and Dietary Habits. Nutrients 2018, 10, 413. [Google Scholar] [CrossRef] [Green Version]
  13. Oliveira, D.; Liz Martins, M.; Rocha, A. Food waste index as an indicator of menu adequacy and acceptability in a Portuguese mental health hospital. Acta Portuguesa Nutrição 2020, 20, 14–18. (In Portuguese) [Google Scholar]
  14. Wilson, E.D.; Garcia, A.C. Environmentally friendly health care food services: A survey of beliefs, behaviours, and attitudes. Can. J. Diet. Pract. Res. 2011, 72, 117–122. [Google Scholar] [CrossRef]
  15. Schiavone, S.; Pelullo, C.P.; Attena, F. Patient Evaluation of Food Waste in Three Hospitals in Southern Italy. Int. J. Environ. Res. Public Health 2019, 16, 4330. [Google Scholar] [CrossRef] [PubMed] [Green Version]
  16. Ferreira, M.; Liz Martins, M.; Rocha, A. Food waste as an index of foodservice quality. Br. Food J. 2013, 115, 1628–1637. [Google Scholar] [CrossRef]
  17. Betz, A.; Buchli, J.; Gobel, C.; Muller, C. Food waste in the Swiss food service industry—Magnitude and potential for reduction. Waste Manag. 2015, 35, 218–226. [Google Scholar] [CrossRef]
  18. Dias-Ferreira, C.; Santos, T.; Oliveira, V. Hospital food waste and environmental and economic indicators—A Portuguese case study. Waste Manag. 2015, 46, 146–154. [Google Scholar] [CrossRef] [PubMed]
  19. Food and Agriculture Organization of the United Nations. The State of Food and Agriculture—Moving forward on Food Loss and Waste Reduction; FAO: Rome, Italy, 2019. [Google Scholar]
  20. Garcia-Herrero, L.; De Menna, F.; Vittuari, M. Food waste at school. The environmental and cost impact of a canteen meal. Waste Manag. 2019, 100, 249–258. [Google Scholar] [CrossRef]
  21. Ishangulyyev, R.; Kim, S.; Lee, S.H. Understanding Food Loss and Waste-Why Are We Losing and Wasting Food? Foods 2019, 8, 297. [Google Scholar] [CrossRef] [PubMed] [Green Version]
  22. Eriksson, M.; Persson Osowski, C.; Malefors, C.; Bjorkman, J.; Eriksson, E. Quantification of food waste in public catering—A case study from a Swedish municipality. Waste Manag. 2017, 61, 415–422. [Google Scholar] [CrossRef]
  23. Liz Martins, M.; Rodrigues, S.S.; Cunha, L.M.; Rocha, A. School lunch nutritional adequacy: What is served, consumed and wasted. Public Health Nutr. 2020, 1–9. [Google Scholar] [CrossRef] [PubMed]
  24. Conselho Federal de Nutricionistas. Resolução CFN N° 380/2005; CFN: Brasília, Brazil, 2005. [Google Scholar]
  25. NHSE Hospitality. Managing Food Waste in the NHS; Department of Health: Leeds, UK, 2005. [Google Scholar]
  26. Carr, D.; Levins, J. Plate Waste Studies. Available online: http://www.nfsmi.org/Information/recipes4.pdf (accessed on 20 October 2020).
  27. Liz Martins, M.; Rodrigues, S.S.P.; Cunha, L.M.; Rocha, A. Factors influencing food waste during lunch of fourth-grade school children. Waste Manag. 2020, 113, 439–446. [Google Scholar] [CrossRef] [PubMed]
  28. Stanga, Z.; Zurfluh, Y.; Roselli, M.; Sterchi, A.B.; Tanner, B.; Knecht, G. Hospital food: A survey of patients’ perceptions. Clin. Nutr. 2003, 22, 241–246. [Google Scholar] [CrossRef]
  29. United Nations. Resolution Adopted by the General Assembly 70/1. Transforming Our World: The 2030 Agenda for Sustainable Development; UN: New York, NY, USA, 2015. [Google Scholar]
Figure 1. Comparison between plate waste and leftovers by meal component with relation to the limit values of acceptability (n = 2987) [25].
Sustainability 13 02452 g001
Figure 2. Comparison between food produced, served, consumed, plate waste and leftovers by meal (n = 2987) [25].
Sustainability 13 02452 g002
Table 1. Food produced, served, consumed and wasted according to the meal component (n = 2987).
Food Produced (kg)Food Served (kg)Food Consumed (kg)Leftovers (kg)Plate Waste (kg)Leftovers (%)Plate Waste (%)
Soup (n = 29)Mean37.328.626.58.62.123.17.4
SD3.22.62.41.70.44.01.4
Maximum46.736.433.510.52.927.89.3
Minimum34.736.424.64.21.312.24.7
Main Dish (n = 29)Mean24.218.715.45.53.319.517.6
SD10.35.34.66.21.311.35.0
Maximum65.635.029.830.65.848.827.5
Minimum8.87.46.70.70.73.39.2
Diet Dish (n = 20)Mean3.62.42.11.20.430.514.1
SD1.81.080.90.90.311.28.1
Maximum7.54.53.73.01.057.130.9
Minimum1.560.670.560.310.014.70.0
1 SD—Standard Deviation.
Table 2. Leftovers and plate waste according to the protein source of the main dish (n = 2987).
Food Produced
(kg)
Leftovers
(kg)
Leftovers
(%)
Plate Waste
(kg)
Plate Waste
(%)
Meat dishes (n = 24)338.179.923.643.016.6
Fish dishes (n = 21)330.581.124.547.519.0
p-value *0.75 0.16 0.03
* p-value according to the Mann–Whitney test at a confidence level of 95%.
Table 3. Social and economic impact of food waste.
Food WasteTotal Food Waste (kg)Food Waste Per Capita (kg)Nº of Older Adults That Could Be FedCost (Euros)
Study PeriodDuring One MonthDuring One Year
Plate waste166.10.054061219.32438.629,262.6
Leftovers441.90.1510813243.76487.577,849.8
Total608.00.2014874463.08926.0107,112.4
Publisher’s Note: MDPI stays neutral with regard to jurisdictional claims in published maps and institutional affiliations.

