Abstract
The growth of technological revolutions and the subsequent acceptance of smart devices has increased the influence of sustainable marketing activities in the tourism industry. Due to the explosion of mobile technologies (e.g., smartphones, tablets) and social media adoption, consumers have been able to use these technologies at any time for destination marketing. However, understanding consumers’ sustainable marketing experiences from a destination perspective is a complex issue. At the moment, very few studies have focused on the effectiveness of smartphone-based social media in destination marketing. Hence, the main purpose of this study is to explore how consumers interpret and utilize smartphone-based social media for sustainable destination marketing. This study proposes an integrated framework that consists of the mobile technology acceptance model (MTAM) and the social media-based interaction, trendiness, and electronic-word-of-mouth (e-WoM). A questionnaire survey was used to collect data (n = 365), and valid data were analyzed by the structural equation modeling (SEM) technique. The findings revealed that interaction, trendiness, and e-WoM indirectly affected satisfaction through mobile usefulness and mobile ease of use. At the same time, mobile usefulness and mobile ease of use directly affected satisfaction, which then significantly influenced the intention to utilize those factors towards sustainable destination marketing. This study highlights the technological affordances and the satisfaction of smartphone-based social media in sustainable marketing. Furthermore, the results can be used in the resource allocation process to ensure the success of the vision and mission of sustainable destination marketing efforts.
1. Introduction
The continuous proliferation of information technology and the advanced diffusion rate of smartphones have created the revolutionary marketing medium of mobile ads (i.e., m-advertising) [1]. One creative feature of smartphones enables users to download an extensive variety of mobile applications [2]. Fundamental progressions in digital technology, social networking, and mobile communication have shaped new concepts, pushing marketers to reimagine the consumer experience, efficiently communicate value ideas, and to sustain positive customer–marketing relationships [3]. The use of smart devices (i.e., mobile devices) and social networking (e.g., Facebook, Renren, Sina Weibo or Weibo, Twitter, video platforms, Linkedln, TikTok, Flickr, Google apps, WeChat) has become a vital part of peoples’ daily lives [4]. Consumers have very personalized smartphones and utilities, with different features and applications used in their day-to-day activities [5]. Smartphones offer a great number of functions, e.g., camera, dual functionality, internet and email access, calendar, weather information, banking, payments, social networking, shopping, and multimedia players [6]. According to a statistical report, the number of smartphone users was 3.5 billion [7], while global penetration has reached 41.5% [7]. One study has shown that the USA (97.1%) and Europe (93.6%) have the highest mobile broadband subscription penetration rate as of 2019 [8]. In 2019, mobile phone internet users reached more than 872 million (in China) [8] and 2.95 billion people were active users of social media worldwide [9]. This is projected to escalate to almost 3.43 billion by 2023. Information technology and smart devices have become an important part of the lives of many people around the world.
Mobile technology (e.g., the smartphone) has a specific and beneficiary role in the tourism industry. Additionally, the use of mobile technologies has seen a rapid progression in the tourism industry [10]. Studies show that travel marketing is cocreated and technology-driven. In reality, the use of smartphones enables visitors to create more meaningful interactions and to learn about travel and marketing opportunities at any time [11]. One study found that mobile devices were most commonly used for online hotel bookings and about 25% of mobile users prefer the firm’s travel transactions facilities [12]. Moreover, 50% of consumers have used mobile devices to browse travel websites (e.g., TripAdvisor) and complete their purchase [12]. As a result, the use of smartphones has led to an innovative sustainable business model for tourism organizations, a global trend (or mega-trend) that has become a priority for the destination marketing industry [13]. Sustainable marketing is highly complex, occupying an important position in tourism, and consists of two facets: on one hand, encouraging organizations and businesses to adopt sustainable practices (best practice research), and on the other hand, motivating tourists to consume and behave as sustainably as possible [14]. Taking into account the proliferation of smartphone applications, implementation would assist consumers and destination marketing providers. However, the role of destination marketers in creating and shaping a sustainable marketplace is critical [15]. Nevertheless, knowledge of smartphone-based social media in sustainable destination marketing is still limited. Therefore, it is necessary to explore the sustainability of destination marketing through technology acceptance.
So far, a significant number of studies have explored effective technology usage and its determining factors to evaluate destination marketing. To examine technology usage behavior, various models have been introduced. Some of the determinants of mobile app users have been researched for transactions [11], financial services [16], hedonic services (e.g., mobile gaming) [17], hotel payments [18], and tourism shopping [10]. Prior studies predominantly adopted and extended the technology acceptance model (TAM) [19], TAM-2 [20], and the unified theory of technology acceptance and usage of technology (UTAUT) [21] toward the technology or system. However, evidence regarding the mobile technology acceptance model (MTAM) for sustainable destination marketing has not been explored. In the MTAM, behavioral intention (instead of actual usage as in the TAM) acts as the dependent variable, while mobile usefulness and mobile ease of use are the fundamental constructs [22]. Therefore, the present study aims to identify a new dimensional framework of sustainable destination marketing, revolving around the following questions:
- RQ1: Do social media marketing activities satisfy consumers’ to use it for destination purposes?
- RQ2: Does the smartphone have a role in convincing consumers’ to accept it, in terms of sustainable destination marketing?
The contributions of this study are threefold. Firstly, the proposed model integrated three influential factors (i.e., interaction, trendiness, and e-word-of-mouth), which have been employed from the social media marketing activities (SMMAs), as projected by Kim and Ko [23], to understand consumers’ behavioral intention to use it for destination marketing. Secondly, it provides a “dynamic view” to assess the importance of smartphone-based technology acceptance based on the mobile technology acceptance model (MTAM) offered by Ooi and Tan [22]. Finally, by considering the intensive use of smartphone-based social media, this study investigated the underlying mechanism of satisfaction towards the sustainable destination marketing perspective. To achieve this aim, data were collected through a questionnaire survey and structural equation modeling (SEM) research is used to analyze the relationship between the proposed constructs. This work has significant theoretical and managerial contributions in the context of sustainable destination marketing.
This paper is organized as follows. An overview of sustainable destination marketing is first outlined, followed by social media marketing activities (SMMAs) and the mobile technology acceptance model (MTAM) in the context of tourism marketing. Following that, ten (10) hypothetical relationships and a proposed conceptual model are developed. Next, the method’s design, data analysis, study findings, and discussions are presented. Finally, the implications and conclusions are discussed, followed by the study limitations and suggestions for future research.
2. Literature Review and Theoretical Framework
This section is divided into two subsections. Firstly, a sustainable marketing strategy in the destination context is found in Section 2.1. Then, the theoretical importance of social media marketing activities (SMMAs), the mobile technology acceptance model (MTAM), and satisfaction is discussed in Section 2.2, Section 2.3, Section 2.4.
2.1. Sustainable Marketing: Destination Context
Sustainability in the area of marketing has conventionally concentrated on how to overtly market sustainable products, with the aim to mobilize sustainable behavior as an essential, rather than peripheral, activity [14]. This has contributed to the discussion of sustainability product features as the main promotional attributes [24]. The United Nations defines the concept of sustainability as “development that meets the needs of the present without compromising the ability of future generations to meet their own needs” [25]. Social media marketing has changed the contact strategy between customers and providers around the world in recent years. In this way, businesses have begun to see a technology-based digital world as their present and prospective context [26]. From this long-term viewpoint, emerging enterprises (specifically in tourism) are aware of sustainability. The economic importance of the global tourism sector has transformed tourism into a highly competitive industry for sustainable destinations [27,28]. The successful marketing of destinations’ sustainability may potentially minimize the uncertainty of consumers and serve as a key component in the decision-making judgment as long as overall satisfaction is achieved [29]. Thus, sustainable marketing has gained attention in the tourism industry as a competitive advantage that cannot avoid the question of sustainability.
In destination marketing, mobile advertisement and social media have become an integral component of the destination experience and have a major consequence on customers’ decision-making behavior [30]. This means that target-specific research is needed to understand how sustainability marketing differs from marketing products to behavioral change in normal contexts. Though there seems to be a persistent absence of consumers’ acceptance intention towards technology with sustainability in destination marketing [31], it is necessary to consider how sustainability relates to customer satisfaction to promote sustainable growth. Previous studies do not consider clear sustainability steps in destination marketing and ignore the characteristics of SMMAs as an objective data source [14,28]. Therefore, this study investigates the extent to which sustainability aspects play a role in smartphone-based SMMAs and how sustainability is linked to consumers’ satisfaction. The purpose of this article is to better understand the questions that emerge as to how the customers’ engagement and response to smartphone-based SMMAs are intrinsically linked to the effective marketing of sustainability for a tourism destination.
2.2. Social Media Marketing Activities (SMMAs)
Social media marketing activities (SMMAs) suggested by Kim and Ko [23] are aimed at promoting connections, partnerships, and the sharing of content with social media communities. This research pointed out that the group-based marketing strategies involve five main aspects, namely interaction, entertainment, trendiness, customization, and word-of-mouth (e-WoM), which have a key effect on the brand equity of consumers. To follow this concept, emerging industries and organizations have been focusing on SMMAs as a necessary and integral factor of their business plans and have significantly benefitted from it [32,33]. This also creates a sustainable platform for business-to-consumer (B2C) and contribute to accomplishing marketing goals at a relatively low cost, which increase revenues [34]. They offer significant opportunities to connect with consumers, improve awareness of products or brands, receive feedback, and improve the quality of products or services [33,35]. Presently, a huge number of social media pages have registered businesses and corporations for their marketing purposes [36].
In the tourism sector, social media have a huge effect on the way individuals search for and exchange travel information and even make choices regarding their destinations. Since tourism-related products and services are highly expensive, customers typically gather and review a wide variety of information for their decision-making processes [31]. Consumers also see social media as an even more reliable source of product and service knowledge than corporate-sponsored marketing communication networks, which have historically acted as a means of marketing products and services [30,37]. Therefore, social media are changing the decision-making processes of tourism consumers. Additionally, SMMAs influence consumers’ attitudes towards tourism-product-related advertisements, and destination features, which creates opportunities to improve their understanding of marketing activities [37]. Tourism companies and brands are embracing social networking sites as a contemporary way to communicate with potential consumers while also improving their sustainable marketing performance [38,39]. The booming development of smartphones and the increasing sophistication of navigation functions have spurred the constant development of sustainable destination marketing. This fact reshapes a variety of social practices, such as ticket purchase, content creation, and sharing experiences with peers [40].
Therefore, SMMAs have some unique characteristics regarding the interaction with target consumers and about branding, distribution, and, more generally, the promotion of services. Engaging with consumers through social media marketing conveys numerous benefits to companies, such as producing word-of-mouth advertising in the airline industry [35], positively affecting customer equity in the brand industry [23,32,33], fostering social capital through advertisements [41], and enhancing satisfaction towards content-related marketing activities [38]. Addressing these issues, the current study focuses on the influential factors of SMMAs to create sustainable destination marketing.
2.3. Mobile Technology Acceptance Model (MTAM)
The mobile technology acceptance model (MTAM) was suggested by Ooi and Tan [38] to complement the inadequacies in the popular information technology or system (i.e., IT or IS) models [42], which were adapted from electronic commerce literature. According to the IT/IS models, six factors, i.e., system quality, information quality, system use, user satisfaction, the effect on the individual user, and the effect on the organization, are employed to assess the performance of an information system [42]. IT and Diffusion of Innovation (DoI) [43] have also focused on performance expectancy (PE), relative advantage (RA), effort expectancy (EE), and complexity (CO) in the study of Information technology and system adoptions [21,44]. Ooi and Tan [22] elaborated this explanation for the background of mobile technology and included two important constructs, i.e., mobile usefulness (MU) and mobile ease of use (MEOU). Both constructs were given priority based on the similarity of perceived usefulness (PU) and perceived ease of use (PEOU) in TAM [19]. In today’s context, however, MU and MEOU cannot be regarded exclusively as the key objective that leads to the acceptance of the consumer. Therefore, In smart devices and technology adoption, consumers’ trust, perceived risk, and financial resources are equally important in determining the satisfactory level and success rate [2,22]. Hence, the MTAM also proposes four constructs, namely mobile perceived security risk (MPSR), mobile perceived compatibility (MPC), mobile perceived trustworthiness (MPT), and mobile perceived financial resource (MPFR), to enhance overall predictability [22]. This collective framework characterizes a perspective from the viewpoint of technology.
In the last decade, the advancement of mobile technology offers plentiful benefits, comprising flexibility, connectivity, interactivity, and location awareness [3,45]. Today, billions of consumers have mobile devices that are opening up original potentials in countless areas, providing access to information and nowledge sharing [46], processes, and communication anytime and anywhere [1]. In the tourism industry, mobile-based social media marketing activities deals with tourism products and services, such as accommodation, transportation, tour operator, food and beverage, booking or purchasing, tours, theme parks, festivals, and recreation activities, regardless of time and place [2,47,48]. Market-generated content, such as information, photos, and videos, can be easily created and shared by mobile devices as a promotion or marketing [2,47,49].
Most research applied TAM [19] to predict user’s behavioral intention to assume mobile applications, but very few adapted or extended the MTAM [22]. However, research concerning models of technology acceptance is scarce, even more so in tourism research [2]. In response to this gap, this article is an endeavor to answer the question of whether smartphone-based social media can be an effective tool for providing sustainable destination marketing. Therefore, in light of the consumption of mobile technology, the existing study integrated the MTAM with social media marketing attributes (i.e., interaction, trendiness, and e-WoM) to examine consumers’ acceptance intention which influences their satisfaction towards sustainable destination marketing.
2.4. Satisfaction
Expectation Confirmation Theory (ECT) describes satisfaction as the expectations of the customer for the service and the degree to which the service meets these expectations [50,51]. According to this theory, consumers “expect” before they “purchase” or “experience”. If the actual result is higher than their expectations, this leads to a positive disabling, which means that the customer is pleased. Consumers compare actual performance with their expectations before paying for or experiencing the service. According to ECT [50,51], users’ satisfaction and perceived usefulness are two basic and pivotal predictors of continuance usage of IS/IT, which have a strong influence on the success or failure of purchase [37,52]. The theory also postulates the user-perceived utility of IS/IT [52] as having a positive impact on its satisfaction. Positive affects (such as excitement, impression, pleasure, enjoyment) can be attributions for a judgment of satisfaction [53].
In the context of smartphone technology, systems applications evolve as a service, and the issue of quality has become the most important factor in such services [15,54]. Service quality and perceived value of mobile devices also influence consumer satisfaction [55]. Consequently, customer satisfaction has been widely considered to be an antecedent for behavioral intentions and actual behavior [56,57]. Comprehension of system satisfaction is important for assessing the efficiency of technology and for customers to benefit from goods and services. According to destination marketing, the use of smartphones improves consumers’ marketing experience and contributes to trip satisfaction [15]. This satisfaction is based on a good match and a positive relationship between expectations and perceived outcomes. Customer satisfaction occurs when received services or purchased products meet or exceed customers’ expectations, which increases the positive emotions experienced toward the services or products [37,38]. Users who were more satisfied with their experience of using social media would have a higher level of continuance intention. Previous studies evidenced that social media marketing activities (i.e., interaction, e-WoM) have a positive influence on its usefulness, and thus significantly affect users’ acceptance intention to use the system [57,58]. Accordingly, the main purpose of this study is to analyze smartphone-based technology and its satisfaction towards sustainable destination marketing.
3. Conceptual Model and Hypotheses Formulation
This section develops a conceptual framework based on social media marketing activities and the mobile technology acceptance model to examine consumers’ intention to use it towards a sustainable destination marketing context.
3.1. Interaction, Mobile Usefulness, and Mobile Ease of Use
Social-media-based interaction has created a vital shift in connectivity between products, services, and users. According to the extant literature, interactive characteristics of social media and its communities contain three main features, i.e., sharing, communicating, and engagement, which influence consumers’ perceived benefits [2,23]. The landscape of the interaction is significant for the social network group, as it can affect the user’s perceived assistance. Consumers have very frequent interactivity and may share textual or image features on the group “wall”. Moreover, they may add members to the group [23,37]. Therefore, numerous varieties of interactions may arise, i.e., member to member, a group to a member, or member to a group [37].
According to the mobile technology acceptance model [22], this theory has the power to increase adoption and acceptance in mobile-related studies and to predict technology adoption for m-commerce, m-transaction, and related applications [2,46,59]. In this theory, mobile ease of use (MEOU) refers to the perception of the complexity of learning and using for potential users of m-devices. When consumers feel that smartphone-based social media are easy to use and learn; they are more likely to adopt this innovation. According to the TAM [19], “ease of use” is measured by two questions on the user’s interaction with the application. Another construct, i.e., mobile utility (MU), is described as an overall assessment of the usefulness of potential users in the adoption of mobile devices [22]. If the user can complete the task easily and effectively, the understanding of mobile utility increases. Mobile usefulness has been corroborated in mobile commerce and market studies, which have been shown to improve the intention to use [60,61].
In response to the advent of social media marketing, interactivity and its unique characteristics provide opportunities for travel consumers to make better decisions about travel products or services [59]. In this sense, mobile social media content has interacted with the buyer and seller as it enables real-time contact through interactive features such as replying, re-tweeting, follow-up, and commenting [23,60]. There are also additional functions such as chat rooms, feedback forms, and email links that could contribute to sustainable interaction. With these features, tourists can easily connect online by sharing, clicking on links, liking, or instantly commenting on marketing posted by tourism organizations [2]. Consumers have also learning interactivity through mobile technology [61]. In this research, social media-based interaction allows users to communicate with travel-related content and marketing activities with other users, which may develop their satisfaction. Hence, mobile usefulness and mobile ease of use may progress due to users’ interaction with social media marketing. Based on this discussion, the following hypotheses have been projected:
Hypothesis 1a (H1a):
Interaction has a positive significant relationship with mobile usefulness towards destination marketing activities.
Hypothesis 1b (H1b):
Interaction has a positive significant relationship with mobile ease of use towards destination marketing activities.
3.2. Trendiness, Mobile Usefulness, and Mobile Ease of Use
Trendiness is defined as providing the newest information about products or services [23]. Nevertheless, a new trend was not a salient motive for social media marketing. In addition, users were motivated to follow this by the ease of use and enjoyment and information sharing [37]. Overall, the literature offers evidence that people tend to be affected internally and externally by the use of modern media tools such as social networking sites [32,62]. Social media platforms bring pleasant focus, even intimacy, to emerging trends in information sharing. Radical developments in digital marketing and smartphone-based social media communication have led to a new trend, imagining online experience to efficiently express value ideas and sustain meaningful relationships with customers [35]. It has changed consumers’ trends towards mobile social media recognition for product advertisements.
Consumers are more likely to turn to different forms of social media to receive information, as they see it as a more credible source of information than corporate-sponsored contact through conventional marketing activities [2,63]. Smartphone-based social media provide up-to-date information, allowing consumers to follow the most competitive offers. This service provides the latest news and trendy discussion topics [64,65]. Social networking innovations have continued to allow the development of new and creative consumer experiences for the destination industry, representing equity [64]. This is influenced by perceived usefulness and ease of use and creates a new movement to use it, as mentioned in the studies on the information technology or system (IT or IS) [23,37]. Therefore, this study conceptualizes trendiness as the utility derived by the customer acceptance towards up-to-date information about destination products, and services, which influences their sustainable destination marketing activities. Hence, the following hypotheses have been formulated:
Hypothesis 2a (H2a):
Trendiness has a positive significant relationship with mobile usefulness towards destination marketing activities.
Hypothesis 2b (H2b):
Trendiness has a positive significant relationship with mobile ease of use towards destination marketing activities.
3.3. Word-of-Mouth, Mobile Usefulness, and Mobile Ease of Use
Social media word-of-mouth (e-WoM) is defined as “informal communication directed at consumers through Internet-based technology, concerning the use or characteristics of particular goods and services or their sellers” [23]. Thus, it has been identified as a dominant force in influencing customer behavior [66]. It is an ideal tool since customers produce and transmit product-related knowledge to their friends, colleagues, and others without restrictions [32]. Subsequently, it has become the most prevalent marketing channel due to its ubiquity, versatility, and interactivity. Mobile-based social media and e-WoM are evolving as a more influential marketing instrument than traditional WoM, which is characterized by rapidity, convenience, amplitude, and absence of face-to-face human communication and pressure [60].
Research shows that e-WoM has a higher degree of reputation, sympathy, and importance for mobile customers than the marketer-created sources of knowledge on the Internet [60]. This factor allows mobile users to interact and connect more frequently with social networking. In addition, consumers’ perceived usefulness and ease of use towards mobile social media are largely driven by their positive experiences of e-WoM [23,67]. In tourism, e-WoM communications have a substantial effect on PEOU and PU towards destination visit intentions [68]. Moreover, travel experience has a significant impact on the use of e-WoM. Relevant studies have investigated key drivers of e-WoM and their impact on tourism shopping [60], travel decision-making [68], and selection of luxury brands [32,37], destination choice intention [69], positive travel decision making [70], and multiple studies have analyzed the significant impact of social media in the creation and dissemination of e-WoM marketing destinations [70,71]. To close the research gap, the present study used e-WoM as one of the influential factors affecting mobile ease of use and mobile usefulness to accept it for sustainable destination marketing. This integration posits that connections and linkages among members of a social group facilitate and form relational resources, thus yielding overall satisfaction. Therefore, this study proposed the following hypotheses:
Hypothesis 3a (H3a):
The electronic-word-of-mouth has a positive significant relationship with mobile usefulness towards destination marketing activities.
Hypothesis 3b (H3b):
The electronic-word-of-mouth has a positive significant relationship with mobile ease of use towards destination marketing activities.
3.4. Mobile Ease of Use, Mobile Usefulness, and Satisfaction
According to MTAM, mobile ease of use (MEOU) refers to the ease of use in a particular system and represents the degree of complexity of the information technology [22]. The ease of use of technology was found to affect the adoption of new technology as lesser efforts are required to learn to use the technology. Moreover, mobile usefulness (MU) is characterized as the overall evaluation of the usefulness rendered to potential adopters when adopting mobile devices [2]. When perceived usefulness is high, users believe that information technology will help them perform their jobs better, thus increasing their intention to use said technology [22,52]. Given that social media marketing has high accessibility for smartphone platforms, MTAM is a suitable model and as such was adopted as the basic framework for this study [2,22].
The empirical findings show that perceived usefulness is the key predictor of the intention to use the system [71,72]. When the complexity of the information technology is minor, the system is easier to operate, increasing users’ satisfaction and thus intent to use [57,73]. According to the information system (IS) continuance theory [19,52], user’s satisfaction and perceived usefulness are two basic and pivotal predictors of continuing IS usage. Users who were more satisfied with their experience of online social networking would have a higher level of continuance intention [74,75]. Thus, the present study used satisfaction integrated with mobile usefulness and mobile ease of use, which has been applied in prior research as a significant effect to predict consumers engagement, such as continuance intention to accept social media [75], loyalty towards social media [72], social media for travel purchase and repurchase intention [76], mobile social tourism and travel-related content creation [59]. It has been also adopted as the primary catalyst of product and service innovation for firms advertisements [76,77] and added value towards products or services. These activities can increase perceived usefulness for consumers and intent to adopt the service for overall satisfaction. On this basis, the following hypotheses have proposed:
Hypothesis 4a (H4a):
Mobile ease of use has a positive significant effect on mobile usefulness.
Hypothesis 4b (H4b):
Mobile ease of use has a positive significant effect on satisfaction in the context of destination marketing.
Hypothesis 5 (H5):
Mobile usefulness has a positive significant effect on satisfaction in the context of destination marketing.
3.5. Satisfaction and Behavioral Intention
In the context of destination marketing, when consumers perceived that they had a higher level of marketing information, they intended to interact with the online community and perceived satisfaction towards the mobile-based social media [21,73]. These activities influence consumers’ intention to adopt it in receiving tourism-related promotions. On the other hand, satisfaction in the context of smartphone-based marketing is the summary of the emotional response (variable intensity) and is stimulated by several aspects such as the quality of information, system, and service [50,51,53]. The impact of technology satisfaction depends on perceived usefulness, which increases the intention to use it [21,57].
The technology acceptance model (TAM) measures behavioral intention (BI) specifically as usage intention, grounded in the high association of intention and behavior [19]. Accordingly, TAM [19] and UTAUT [21] have been used to describe users’ acceptance of information technology or system (IT/IS). When perceived ease of use and usefulness of IS is high, users believe that it will upsurge the performance of their jobs, thus increasing their intention to use it [78,79]. In this vein, if users have a high dependency on smartphone-based social media marketing information, they are believed to proactively and positively spend more time and energy using these services to increase feelings of possession [38,80]. Therefore, the present study adopted behavioral intention, which represents the individual’s subjective probability of following the smartphone-based social media marketing activities in terms of technology acceptance and the relationship between satisfaction toward a given object or behavior. From this perspective, satisfaction can be best understood as consumer’s attitudes to adopt the technology, and there is a statistically significant and direct association between these two variables. Thus, the following hypothesis is proposed:
Hypothesis 6 (H6):
Satisfaction has a positive significant effect on the intention to use it in the context of destination marketing.
Based on the above discussion, the conceptual model has been proposed in Figure 1.
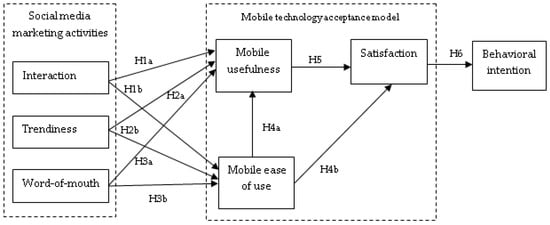
Figure 1.
The conceptual model.
4. Materials and Methods
4.1. Instrument Development and Measures
To test the hypotheses, a cross-sectional self-administered survey questionnaire was designed followed by prior research on customer response in the airline industry [35] and the green hotel industry [81]. The proposed research model comprises seven constructs (i.e., interaction, trendiness, word-of-mouth, mobile ease of use (MEOU), mobile usefulness (MU), satisfaction, and behavioral intention (BI). The research questionnaire was planned through the literature review on smartphone-based social media marketing from the destination perspective. It had six sections: (i) two filter questions, i.e., whether the respondents own a smartphone and are familiar with the social media marketing activities; (ii) questions about social media-based destination marketing during the previous year; (iii) questions about the interaction, trendiness, and word-of-mouth, measured using a 5-point Likert scale ranging from “1 = strongly disagree” to “5 = strongly agree”; (iv) questions about the technology acceptance (MEOU, MU, and BI), also measured using a 5-point Likert scale, ranging from “1 = strongly disagree” to “5 = strongly agree”; (v) questions on satisfaction, measured on a 5-point Likert scale, ranging from “1 = strongly disagree” to “5 = strongly agree”; and finally, (vi) respondents’ demographics.
The questionnaire was initially developed in English, and it was then translated into Chinese. Back-translation was applied by two researchers who are fluent in both languages to enhance translation accuracy [82]. After the completion of the questionnaire, a pilot study was conducted with a sample of 50 consumers from different shopping malls through a purposive sampling technique who were acquainted with the smartphone-based marketing activities [35,72,81]. Following the pilot test, the questions were revised and improved for the final survey to assure that the questions were clear and unambiguous.
To ensure the reliability and validity of the questionnaire, every construct is supported with the measurement items that were selected from appropriate existing literature (see Appendix A). For instance, interaction (five-item scale), trendiness (five-item scale), and word-of-mouth (five-item scale) are based on the categories of social media marketing activities (SMMAs) by Kim and Ko (i.e., in the context of luxury brands) [23] and were also adapted in different studies, such as for luxury brand equity [32], for the effectiveness of social media marketing activities [37], for mobile-based tourism advertisements [2], and consumers’ purchase intentions through e-WoM influence [66]. Mobile usefulness (four-item scale) and mobile ease of use (four-item scale) were adapted from Davis (i.e., in the context of information technology acceptance) [83] and Ooi and Tan (i.e., in the context of mobile payment) [22] and modified under this research purposes. Satisfaction was adapted and modified with a four-item scale to examine the satisfaction towards smartphone-based social media activities [50,51,52], which were also adapted in prior studies for social media-based loyalty [72] and intention to use smartphones for shopping [80]. Finally, behavioral intention (four-item scale) was adapted from Davis [83] (technology acceptance), Ooi and Tan [22] (mobile technology acceptance), and Venkatesh in the context of IS/IT use intention [21], which then revised as a research setting.
4.2. Sample and Data Collection Procedures
For this study, the sample consisted of Chinese consumers, because China has a diversified destination marketing opportunity compared to other Asian countries, receiving around RMB 5.7 trillion in 2019 [84]. Moreover, China has the highest number of different active social media platforms (e.g., WeChat, Sina Weibo, Weibo, Meimei, Renren) and the most active Internet users at 883.11 million (45% internet penetration rate, 50% of the world’s online users) [85]. Chinese consumers spend 25 h online per week, progressively connected through smart devices, and 70% of the bookings are made online [86]. Therefore, this study chose China as the most appropriate sample area.
The data for this study were collected through a paper-based survey from the five major shopping malls (i.e., IFC mall, Shanghai Times Square, Yuyuan Garden, Raffles Square, and the Bund) located in the Eastern province (Shanghai) of China using the mall-intercept technique [87]. These locations were selected because of their high population density, with an approximate population of 26 million in 2019 [88], and the diversity of consumers. In other words, they can be generalized as a good demonstration of different ages, backgrounds, and races of the Chinese population. In addition, the mall-intercept approach is the most efficient method for marketers to collect data [59,89]. Moreover, the mall-intercept method “is considered as a random and unbiased method for data collection wherein respondents experience a sense of anonymity”, as explained by Khare [90]. Additionally, the approach also constitutes an adequate sampling universe [59,91], which has also been adopted by prior research in the context of mobile advertisements [2] and social media engagement for city branding [92].
For the main survey, a non-probability convenience sampling technique was used due to the unavailability of a consumers’ sampling frame. This survey approach has been widely used in tourism research [15,93,94,95] and research on social media [75], when the entire population is too large and impossible to use independent random sampling representing the entire population, which is expected to reduce confirmation bias [96]. The data collection was continued from 1 April to 25 May 2019 on both weekdays and weekends to get a representative sample. The survey was carried out by three researchers who understood the subject matter and given to consumers two pre-qualifying questions to confirm the eligibility (i.e., that the respondents own a smartphone and are familiar with social media marketing activities). Every fifth person entering or exiting the shopping mall was randomly selected (i.e., who had a smartphone and used to social media-based marketing activities) to verify their willingness to participate in the survey. Only those who displayed a constructive attitude were chosen for this survey. To encourage completeness, respondents were provided with a souvenir pen.
In total, 500 questionnaires were distributed by surveyors to the consumers at the points of exit-entry of each shopping mall. A total of 450 questionnaires were collected, and 365 valid questionnaires were used in the data analysis. The return rate and validity rate of the survey were 90% and 81.11%, respectively. Concerning sample size, it is suggested that there should be a minimum of 10 cases per parameter or item necessary for statistical analysis [97,98], which was fulfilled in this study. The sample size also exceeds the rule of thumb that the minimum sample size should be greater or equal to 10 times the largest number of arrows pointing to a particular latent variable in the structural model [99]. Therefore, a minimum of 310 responses was required as the study has 31 items with seven constructs. Therefore, a sample size of 365 is justified.
In order to test the non-response bias, an independent sample t-test was employed to explore initial respondents (first-week respondents) and late respondents (last-week respondents) [100,101]. The findings indicate that there are no substantial differences between any of these respondents. Consequently, it can be stated that non-bias is not a major concern in this research.
4.3. Descriptive Analysis
Among the 365 respondents (see Table 1), there was a higher percentage of female (56.7%) than male (43.3%) respondents. The respondents’ ages ranged from 18 to above 42 years. A plurality of respondents was 34–41 years old (37%), followed by 26–33 (32.9%), 18–25 (21.9%), and 42 and above (8.2%), and a majority of the respondents had a Master’s degree or above (52.1%), followed by an undergraduate degree (35.6%), and high school or less (12.3%). Among them, 49.3% were employed, followed by 36.2% students, and 14.5% were unemployed. They indicated their monthly income to be RMB 7001–9000 (47.7%), followed by RMB 5001–7000 (34%), and RMB 5000 or below (18.4%). They also indicated that 51.2% had experience on a social-media-based destination for 4 years or above, followed by 2–3 years (33.7%) and 0–1 year (15.1%). The frequency of social media use was several times a year (49.3%), followed by several times a month (36.2%), and once to several times a week (14.5%). Finally, the popular social media platforms used for destination marketing were WeChat (34%), followed by Sina Weibo or Weibo (24.7%), Renren (18.4%), Youku (14.5%), and others (8.5%).

Table 1.
Respondents’ profile (n = 365).
The results are presented and discussed in the following section.
5. Results
5.1. Data Analysis
In the current research, two statistics packages were used for data analysis, i.e., the IBM SPSS V. 23.0 and AMOS V. 24.0. Two-step data analyses were performed, i.e., the measurement model and the structural model [102]. In the first step, confirmatory factor analysis (CFA) was conducted to test a theory-based overall model fit, construct reliability, and validity of the constructs. In the second step, structural equation modeling (SEM) and the model fit indices were performed to evaluate the causal relationships [98]. To validate the survey instrument, this study analyzed the convergent and discriminant validity. The data analysis strategy is shown in Figure 2.
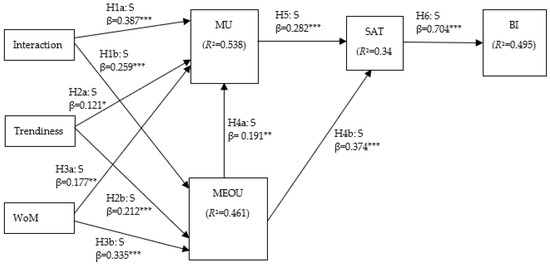
Figure 2.
Estimates of structural equation modeling (SEM). β = path coefficient, *** p-value < 0.001, ** p-value < 0.01, * p-value < 0.05, R2 = squared multiple correlations, S = supported.
5.2. Reliability and Validity Testing
This study has applied the Harman’s one-factor test, which is widely accepted for the common method bias (CMB) to understand the model fit indices [103]. In total, 37.192% common variance was found, which is lower than the suggested value of 70% [104]. This study does not, therefore, suffer from the CMB problem.
The measurement model was evaluated using a confirmatory factor analysis (CFA), and validation was performed with discriminant and convergent validity and reliability (see Table 2). A Cronbach’s alpha (α) coefficient of each construct ranged from 0.856 to 0.900. Thus, the reliability of each construct was demonstrated to be high, since they exceeded the suggested cut-off point of 0.7 [105,106]. At the same time, the composite construct reliability (CR) was also measured to evaluate the multi-item scales [107]. The values ranged from 0.797 to 0.914, thus exceeding the minimum requirement of 0.60. Moreover, the factor loadings ranged from 0.702 to 0.918, i.e., exceeding the threshold value of 0.60 for established items [108]. All average variance extracted (AVE) values ranged between 0.569 and 0.727, exceeding the cut-off point of 0.50 [97].
Table 2.
Reliability and convergent validity testing.
The Pearson’s product-moment correlation coefficient (r) discloses the strength and the direction of the relationships between all the constructs or items (see Table 3). There is a significantly positive correlation between the constructs. The Pearson’s product-moment correlation coefficient (r) was between 0.375 and 0.662, n = 365 (** p < 0.01), with a moderate significance.
Table 3.
Pearson’s correlation coefficient.
5.3. Discriminant Validity
In terms of discriminant validity (see Table 4), it was assessed by comparing the AVE values and the squared correlations. Since all AVE values of all constructs (diagonal elements) surpass the square correlations (0.375 to 0.662) between any two constructs (off-diagonal elements) [109]. The square root of AVE (0.75 to 0.85) for each construct exceeds the correlations between the given construct and others, and thus the discriminant validity of the instrument was supported [98,108]. The CFA results show that the model closely fits the data (chi-square (X2) = 636.964; degrees of freedom (df) = 412; X2/df = 1.546; Probability level (p) = 0.000; Root mean square residual (RMR) = 0.019; Goodness of Fit index (GFI) = 0.903; Adjusted Goodness of fit index (AGFI) = 0.883; Normed Fit Index (NFI) = 0.916; Relative Fit Index (RFI) = 0.905; Incremental Fit Index (IFI) = 0.969; Tucker-Lewis Index (TLI) = 0.964; Comparative Fit Index (CFI) = 0.968; and Root Mean Square Error of Approximation (RMSEA) = 0.039.
Table 4.
Discriminant validity.
5.4. Structural Equation Modeling (SEM)
The proposed relationships were empirically tested using the covariance matrix. All variables in the measurement model reach the relevant threshold in the reliability and validity tests, thus testing the structural model study assumptions [107]. The structural model was estimated using a maximum likelihood estimation method and a correlation matrix. Figure 2 indicates the standardized regression coefficient (β) and explanatory power (R2), and R2 exceeds 0.2, indicating substantial explanatory power [96].
The overall model fit indicates that chi-square (X2) = 634.951; degrees of freedom (df) = 419; and it is significant at probability level (p) = 0.000. The X2/df ratio of less than 5 (1.515) is used as the common decision rule of an acceptable overall model fit. The results indicate there is a good fit of the theoretical framework, while other indicators of goodness-of-fit are as follows: Root mean square residual (RMR) = 0.026; Goodness of Fit index (GFI) = 0.902, which is significant; Adjusted Goodness of fit index (AGFI) = 0.884; Normed Fit Index (NFI) = 0.916; Relative Fit Index (RFI) = 0.907; Incremental Fit Index (IFI) = 0.970; Tucker-Lewis Index (TLI) = 0.966; Comparative Fit Index (CFI) = 0.970; Root Mean Square Error of Approximation (RMSEA) = 0.038 [98]. Therefore, the estimates of the structural coefficients offer the basis for testing the hypotheses (see Figure 2).
5.5. Hypotheses Testing
According to the hypothetical testing results (see Table 5), all of the (10) hypothetical relationships are supported. In the analysis of hypotheses 1a and 1b, interaction has a positive significant relationship with MU (H1a: β = 0.387***, p < 0.001, t-value = 5.702) and MEOU (H1b: β = 0.259***, p < 0.001, t-value = 3.719). The same is the case for the analysis of hypotheses 2a and 2b: trendiness has a positive significant relationship with MU (H2a: β = 0.121*, p < 0.05, t-value = 2.051) and MEOU (H2b: β = 0.212***, p < 0.001, t-value = 3.338). Word-of-mouth has also a positive significant relationship with MU (H3a: β = 0.177**, p < 0.01, t-value = 2.828) and MEOU (H3b: β = 0.335***, p < 0.001, t-value = 5.044). Thus, H1a, H1b, H2a, H2b, H3a, and H3b are supported. Moreover, in the analysis of hypotheses 4a and 4b, MEOU has a positive significant relationship with MU (H4a: β = 0.191**, p < 0.01, t-value = 2.937) and satisfaction (H4b: β = 0.374***, p < 0.001, t-value = 5.419), respectively. Thus, H4a and H4b are supported. Finally, in the analysis of hypotheses 5 and 6, MU has a significant relationship with satisfaction (H5: β = 0.282***, p < 0.001, t-value = 4.305), and satisfaction has a significant relationship with behavioral intention (H6: β = 0.704***, p < 0.001, t-value = 14.408), which supports H5 and H6. These results imply that all the variables of SMMAs and the MTAM are significantly related to consumers’ satisfaction towards the sustainable destination marketing.
Table 5.
Results of hypotheses testing for direct relationships.
5.6. Indirect-Impact Assessment
The indirect impact evaluation allows further analyses to be carried out on the mediation effect between variables within the proposed model. The roles of MEOU, MU, and satisfaction as mediators between interaction, trendiness, WoM and behavioral intention are examined via the bootstrapping method (see Table 6). MEOU, MU, and satisfaction significantly mediated the impact of interaction, trendiness, and WoM on behavioral intention. Among them, MEOU and satisfaction have the most significantly mediating impact of WoM on behavioral intention (0.125***; p < 0.001), whereas, MU and satisfaction have the least significant mediating impact of Trendiness on behavioral intention (0.034*; p < 0.05).
Table 6.
Results of indirect-impact.
6. Discussion and Implications
Rapid improvements in wireless technology, coupled with the rise in content offerings to consumers, mean that companies that provide mobile services or create mobile content increased overall satisfaction towards its acceptance. Smart devices have introduced both convenience and ease to contemporary consumers regarding marketing features. These devices have the options to satisfy consumers’ marketing choices and acceptance intention regarding its usefulness [2,3,53]. These studies did not document smartphone and social media-based sustainable destination marketing. Moreover, very few studies have focused on the mobile technology acceptance model (MTAM) in the context of social media interactivity with tourism advertisements [2,22]. To minimize the research gap, the current study was based on the MTAM proposed by Ooi and Tan [22] and investigated the influencing factors of social media marketing activities by Kim and Ko [23] to explore consumers’ acceptance intention towards smartphone-based destination marketing. Based on the conceptual model, a quantitative cross-sectional survey was conducted in Shanghai, China. The respondents were a sample of Chinese consumers (n = 365).
Next, this study shall some aspects of the results obtained. Firstly, three independent variables; interaction, trendiness, and word-of-mouth, showed positive significant associations with mobile usefulness and mobile ease of use. Hence, the hypotheses H1a, H1b, H2a, H2b, H3a, and H3b are supported. These almost similar to prior research based on the technology acceptance and consumers’ adoption of mobile commerce [2,3,110]. Secondly, mobile ease of use also showed a positive significant connection with mobile usefulness and satisfaction, which supports H4a and H4b. These findings are similar to prior research on mobile advertising [2], whereas different results were found in the study on mobile tourism applications [3]. Thirdly, mobile usefulness was also found to show a positive significant association with satisfaction, which supports H5. This is similar to previous findings on smartphone use for shopping [80] and social media-based marketing satisfaction [37,53,56]. Finally, satisfaction has a positive significant relationship with behavioral intention, thus supporting H6. Based on the full model (see Figure 2), the results revealed that all ten hypothetical relationships were supported empirically. The finding corroborates the study on social media marketing activities [10,111] and mobile acceptance by students [112]. The analysis results show that destination marketing based on smartphone and social media is more effective to use and thus satisfies consumers’ acceptance intention. The research findings suggest that the explanatory power of MEOU is 54%, i.e., R2 = 0.538, MU is 46%, i.e., R2 = 0.461, satisfaction is 34%, i.e., R2 = 0.342, and BI is 70%, i.e., R2 = 0.495. Therefore, these results indicate that all the variables of MTAM were significantly related to the respondents’ intention to use it towards sustainable destination marketing. Based on the results, this study supports the prevailing discovery of the mobile technology acceptance model (MTAM) and offers peripheral validity for the new technological-relative setting (smartphone-based social media marketing activities).
6.1. Theoretical Implications
This study contributes to several theoretical implications for academic research. Firstly, the study proposes a new research framework by integrating three factors, i.e., interaction, trendiness, and word-of-mouth, to examine consumers’ satisfaction towards the smartphone-based social media and intent to use it for sustainable destination marketing. It constitutes a recent contribution and empirical research into the destination consumers’ perspectives towards the acceptance of smart technology, as it allows a better realization of the smart paradigm. It is also expected that the system can be a valuable source of reference in the digital sense for other tourism and marketing scholars interested in replicating smartphone-based social media marketing in further studies.
Secondly, the applicability of smartphone-based social media marketing practices in the sense of destination is still a novel possibility of research among academics and practitioners. Finally, this study is the first to integrate the mobile technology acceptance model (MTAM) with a smartphone-based social media to explore their effects on consumers’ satisfaction towards destination marketing context. As a result, this study adds to the scarce destination marketing literature from an emerging economy perspective by shedding light on smartphone-based social media [6,59]. Additionally, in view of the fact that little concern has been devoted to the role of the mobile technology acceptance model, our study contributes to the development of IT/IS adoption literature.
The analytical results of this study include valuable recommendations for different areas of practice as well as potential researchers to improve customer interest in marketing. This indicates that the research model is applicable to explore the implications of smart devices and can be a reference for follow-up studies in different perspectives [80]. All the exterior factors used in the current study support the technology from the perspective of sustainable destination marketing, which exemplifies that intended users are adopting smartphone-based social media platforms within their destination marketing arena to get overall satisfaction and access to various dimensions.
6.2. Managerial Implications
Firstly, as the usability of the smartphone is one of the main drivers of behavioral purpose, authorities should concentrate on promoting the advantages of using it for social media marketing as part of their specific selling proposals. Thus, mobile utilities must be focused on the behaviors of customers, for example, allowing customers who are constantly on their smartphones to receive trendy, up-to-date, and tailored marketing advertisements [6]. Consumers can also seek and request responses from destination marketing organizations (DMOs) in real-time whenever they need them [29]. Secondly, since mobile ease of use is another driver of behavioral intention, experts should highlight the accessibility, availability, and user-friendliness of their social media platforms, particularly when using smartphones. When the interface is quick, straightforward, easy to process and easily available, it helps to resolve the difficulty and uncertainty surrounding the use of social networking platforms to obtain tourism-related marketing information on smartphones.
Thirdly, interaction, trendiness, and word-of-mouth also may play a vital role in predicting the adoption of smartphone-based social media marketing activities, as these three factors have an indirect influence over the behavioral intention and reduce consumers’ anxiety. One realistic approach for practitioners to improve social media marketing practices is to provide step-by-step instruction and tutorials, probably a video, on how to successfully operate smartphones for destination-related activities. With sufficient support and guidance, customers would be more open to using smartphone-based social media marketing practices to obtain destination-related promotional contents. This ultimately helps to enhance the easiness and useful functions of smartphone-based social media marketing.
Fourthly, enhancing trendiness among smartphone-based consumers and DMOs shall be given the top importance as this is the less influential predictor of behavioral intention. Additionally, importance shall be given to including customer support functions through mobile commerce, which showed positive attitudes towards mobile apps [6]. Finally, social media service providers should explore how to maximize the influence of social media marketing practices on smart devices. It is also recommended for social media group managers to increase the content and activities of the forum (e.g., testing reports for new goods, experimenting with community members, sharing how to become a fan, sharing user experience, and using a motivational method to increase member interaction) before social media marketing activities. Thus, this study significantly contributes to the literature by providing evidence of how smartphone-based social media marketing activities (interaction, trendiness, word-of-mouth) influence consumers’ satisfaction towards its use for destination purposes.
Currently, consumers have a range of smart tools for destination marketing purposes at all stages. Some of these tools are more efficient and effective in guiding, assisting, and engaging them intensively. Management organizations could and should use interactive channels and platforms for this purpose. In this case, social media platforms are the most appropriate and persuasive channels due to their features and functions. Therefore, management organizations should adopt the appropriate approach (interactive communication, trendy news, engaging discussions) and implement suitable strategies to communicate with their smart consumers to make them co-designers of sustainable marketing experiences of tourism resources. It is worth noticing that smart technologies and social media marketing integration are not a magic potion. This article simply suggests that collaboration and engagement with smart devices and communication of sustainable marketing practices are more effective when interactive channels (i.e., social media) are adopted adequately and used properly.
7. Conclusions
The advent of smartphones and the enormous appearance of social media have resulted in a burning need to understand the motivations of consumers to adopt it for sustainable destination marketing purposes. Since smartphone-based social media marketing is a comparatively new research possibility, this study proposed an integrated framework by combining interaction, trendiness, and WoM, and the mobile technology acceptance model to study the adoption of smartphone-based social media in the sustainable destination marketing setting. The integrated framework provides useful clues not only for tourism organizations but also for government agencies, software developers, and other practitioners providing destination products and services. The smartphones and social media technologies, if appropriately used, are the suitable platforms to co-design, co-manage, and co-market sustainable marketing experiences and can have a positive impact on local or host communities. Furthermore, the outcomes are useful to improve the achievement, maintenance, and expansion of existing and prospective consumers, which will give tourism organizations a sustainable competitive edge in the marketplace. Thus, the current study is useful in numerous ways and can be considered for further research.
Limitations and Future Research
Despite the effort to conduct rigorous research structure, methodology, and data collection, several limitations can be addressed in future studies. Firstly, the research model tested in this study has been empirically assessed only in terms of three factors (i.e., interaction, trendiness, and WoM) in the context of social media marketing activities. Thus, the generalizability of the results of this study is not known. Future research should apply and test the research model to other factors. Secondly, the research model only takes the MTAM and three factors from SMMAs into consideration. While the integrated model accounts for a sizeable amount of variance in the endogenous variable (i.e., satisfaction and intention to use a smartphone-based social media towards sustainable destination marketing), there are other types of factors that show important roles in influencing consumers’ intention. For instance, mobile self-efficacy, technology self-efficacy, perceived risk, and trustworthiness can be included in future research. Future researchers may consider incorporating them to facilitate the understanding of smartphone adoption among consumers.
Finally, this research was restricted to Chinese consumers, so the generalizability may be reduced. Forthcoming research may be applied to other technology-centric countries or compare the present results with other cultures. Furthermore, stronger clarification of the behavioral intention to participate in smartphone-based social media marketing practices across various backgrounds should be investigated. Researchers are encouraged to investigate the system within a broader geographical spectrum or to carry out a comparative analysis with other smart devices to address this limitation.
Author Contributions
Conceptualization, F.S. and M.T.S.; data curation, F.S. and M.T.S.; formal analysis, F.S., M.T.S., D.B. and A.B. (Afrodita Borma); investigation, F.S., M.T.S., and B.L.; methodology, F.S. and M.T.S.; project administration, B.L.; resources, D.B., A.B. (Alina Badulescu), and B.L.; software, F.S.; supervision, B.L.; validation, F.S. and M.T.S.; writing, original draft, F.S. and M.T.S.; writing, review and editing, F.S., M.T.S., D.B., A.B. (Alina Badulescu), and A.B. (Afrodita Borma). All authors have read and agreed to the published version of the manuscript.
Funding
This research received no external funding.
Institutional Review Board Statement
Not applicable.
Informed Consent Statement
Not applicable.
Conflicts of Interest
The authors declare no conflict of interest in this study.
Appendix A
Table A1.
Constructs and Scale Items.
Table A1.
Constructs and Scale Items.
| Latent Variable | Observed Variable | Item Text | Reference |
|---|---|---|---|
| Interaction | INTER1 | Social media enables quick responses from the community about destination marketing. | [23,32] |
| INTER2 | Social media enables destination marketing information sharing with others. | ||
| INTER3 | Social media enables close interactions with others about destination marketing. | ||
| INTER4 | Social media enables opinion exchange with others about destination marketing. | ||
| INTER5 | Social media enables intensive interactions with others about destination marketing. | ||
| Trendiness | TREND1 | Social media provides the latest content about destination marketing. | [23,32] |
| TREND2 | Social media is very trendy about destination marketing. | ||
| TREND3 | Social media is very popular in destination marketing. | ||
| TREND4 | Social media is cool about destination marketing. | ||
| TREND5 | Social media provides exclusive features of destination marketing. | ||
| Word-of-Mouth | WoM1 | I would like to share destination marketing information through a social media platform. | [23,32] |
| WoM2 | I would like to share destination marketing content through a social media platform. | ||
| WoM3 | I would like to read destination marketing reviews through a social media platform. | ||
| WoM4 | I would like to get the destination marketing opinion from others through a social media platform. | ||
| WoM5 | I would like to recommend others about social media-based destination marketing. | ||
| Mobile usefulness | MU1 | Using the smartphone-based social media enables to book travel accommodation and air tickets faster. | [19,22,83] |
| MU2 | Using the smartphone-based social media enables the chances of getting more competence in travel planning. | ||
| MU3 | Using the smartphone-based social media improves travel planning efficiency. | ||
| MU4 | Using the smartphone-based social media saves a lot of time in planning my trip. | ||
| Mobile ease of use | MEOU1 | Learning to use smartphone-based social media platform for destination marketing will be easy for me. | [19,22,83] |
| MEOU2 | Using the smartphone-based social media platform towards destination marketing does not require a lot of mental effort. | ||
| MEOU3 | It would be easy for me to become skilful at using smartphone-based social media platform for destination marketing. | ||
| MEOU4 | I think that I can use a smartphone-based social media platform for destination marketing without the help of an expert. | ||
| Satisfaction | SAT1 | I am satisfied with the experience of using a smartphone-based social media platform for destination marketing. | [50,51,52] |
| SAT2 | I am pleased with the experience of using a smartphone-based social media platform for destination marketing. | ||
| SAT3 | My decision to use smartphone-based social media platform for destination marketing was a wise one. | ||
| SAT4 | I have achieved my goal towards smartphone-based social media for destination marketing. | ||
| Behavioral intention | BI1 | I am likely to increase my use of smartphone-based social media platform for destination marketing shortly. | [21,22,83] |
| BI2 | I will continue to use smartphone-based social media platform for the destination marketing frequently. | ||
| BI3 | I will always try to use smartphone-based social media platform for destination marketing in my daily life. | ||
| BI4 | I will think about using smartphone-based social media platform for destination marketing. |
References
- Wong, C.; Tan, G.W.; Tan, B.; Ooi, K. Mobile advertising: The changing landscape of the advertising industry. Telemat. Inform. 2015, 32, 720–734. [Google Scholar] [CrossRef]
- Tan, G.W.H.; Lee, V.H.; Hew, J.J.; Ooi, K.B.; Wong, L.W. The interactive mobile social media advertising: An imminent approach to advertise tourism products and services? Telemat. Inform. 2018, 35, 2270–2288. [Google Scholar] [CrossRef]
- Chen, C.; Tsai, J. Determinants of behavioral intention to use the Personalized Location-based Mobile Tourism Application: An empirical study by integrating TAM with ISSM. Future Gener. Comput. Syst. 2019, 96, 628–638. [Google Scholar] [CrossRef]
- Zhang, T.; Cobanoglu, C. Generation Y’s positive and negative eWOM: Use of social media and mobile technology. Int. J. Contemp. Hosp. Manag. 2017, 29, 732–761. [Google Scholar] [CrossRef]
- Chen, H.; Li, X. The contribution of mobile social media to social capital and psychological well-being: Examining the role of communicative use, friending and self-disclosure. Comput. Hum. Behav. 2017, 75, 958–965. [Google Scholar] [CrossRef]
- McLean, G.; Osei-Frimpong, K.; Al-Nabhani, K.; Marriott, H. Examining consumer attitudes towards retailers’ m-commerce mobile applications-An initial adoption vs. continuous use perspective. J. Bus. Res. 2020, 106, 139–157. [Google Scholar] [CrossRef]
- O’Dea, S. Number of Smartphone Users Worldwide. Available online: https://www.statista.com/statistics/330695/number-of-smartphone-users-worldwide/ (accessed on 10 December 2020).
- Clement, J. Mobile Internet Usage Worldwide-Statistics & Facts. Available online: https://www.statista.com/topics/779/mobile-internet/ (accessed on 11 September 2019).
- Clement, J. Number of Social Network Users Worldwide. Available online: https://www.statista.com/statistics/278414/number-of-worldwide-socialnetwork-users/ (accessed on 15 July 2020).
- Tan, G.W.; Ooi, K. Gender and age: Do they really moderate mobile tourism shopping behavior? Telemat. Inform. 2018, 35, 1617–1642. [Google Scholar] [CrossRef]
- Alnawas, I.; Aburub, F. The effect of benefits generated from interacting with branded mobile apps on consumer satisfaction and purchase intentions. J. Retail. Consum. Serv. 2016, 31, 313–322. [Google Scholar] [CrossRef]
- Odgers, T. The State of Mobile Bookings for Tours and Activities. Available online: https://www.checkfront.com/mobile-bookings-report (accessed on 20 April 2020).
- Font, X.; McCabe, S. Sustainability and marketing in tourism: Its contexts, paradoxes, approaches, challenges and potential. J. Sustain. Tour. 2017, 25, 869–883. [Google Scholar] [CrossRef]
- McDonagh, P.; Prothero, A. Sustainability marketing research: Past, present and future. J. Mark. Manag. 2014, 30, 1186–1219. [Google Scholar] [CrossRef]
- Tan, W.; Lu, K. Smartphone use at tourist destinations: Interaction with social loneliness, aesthetic scope, leisure boredom, and trip satisfaction. Telemat. Inform. 2019, 39, 64–74. [Google Scholar] [CrossRef]
- Lee, Y.; Park, J.; Chung, N.; Blakeney, A. A unified perspective on the factors influencing usage intention toward mobile financial services. J. Bus. Res. 2012, 65, 1590–1599. [Google Scholar] [CrossRef]
- Liu, Y.; Li, H. Exploring the impact of use context on mobile hedonic services adoption: An empirical study on mobile gaming in China. Comput. Hum. Behav. 2011, 27, 890–898. [Google Scholar] [CrossRef]
- Morosan, C.; Defranco, A. It’s about time: Revisiting UTAUT2 to examine consumers’ intentions to use NFC mobile payments in hotels. Int. J. Hosp. Manag. 2016, 53, 17–29. [Google Scholar] [CrossRef]
- Davis, F.D. User Acceptance of Computer Technology: A Comparison of Two Theoretical Models. Manag. Sci. 1989, 35, 982–1003. [Google Scholar] [CrossRef]
- Venkatesh, V. Determinants of Perceived Ease of Use: Integrating Control, Intrinsic Motivation, and Emotion into the Technology Acceptance Model. Inf. Syst. Res. 2000, 11, 342–365. [Google Scholar] [CrossRef]
- Venkatesh, V.; Morris, M.G.; Hall, M.; Davis, G.B.; Davis, F.D.; Walton, S.M. User acceptance of information technology: Toward a Unified view. MIS Q. 2003, 27, 425–478. [Google Scholar] [CrossRef]
- Ooi, K.B.; Tan, G.W.H. Mobile technology acceptance model: An investigation using mobile users to explore smartphone credit card. Expert Syst. Appl. 2016, 59, 33–46. [Google Scholar] [CrossRef]
- Kim, A.J.; Ko, E. Do social media marketing activities enhance customer equity? An empirical study of luxury fashion brand. J. Bus. Res. 2012, 65, 1480–1486. [Google Scholar] [CrossRef]
- Gerdt, S.; Wagner, E.; Schewe, G. The relationship between sustainability and customer satisfaction in hospitality: An explorative investigation using eWOM as a data source. Tour. Manag. 2019, 74, 155–172. [Google Scholar] [CrossRef]
- Keeble, B.R. The Brundtland Report: “Our Common Future”. Med. War 1988, 4, 17–25. [Google Scholar] [CrossRef]
- Minton, E.; Lee, C.; Orth, U.; Kim, C.-H.; Kahle, L. Sustainable Marketing and Social Media. A Cross-Country Analysis of Motives for Sustainable Behaviors. J. Advert. 2012, 41, 69–84. [Google Scholar] [CrossRef]
- Hanna, P.; Font, X.; Scarles, C.; Weeden, C.; Harrison, C. Tourist destination marketing: From sustainability myopia to memorable experiences. J. Destin. Mark. Manag. 2018, 9, 36–43. [Google Scholar] [CrossRef]
- Wang, H.; Ko, E.; Woodside, A.; Yu, J. SNS marketing activities as a sustainable competitive advantage and traditional market equity. J. Bus. Res. 2020. [Google Scholar] [CrossRef]
- Pike, S.; Page, S.J. Destination Marketing Organizations and destination marketing: A narrative analysis of the literature. Tour. Manag. 2014, 41, 202–227. [Google Scholar] [CrossRef]
- Buhalis, D.; Foerste, M. SoCoMo marketing for travel and tourism: Empowering co-creation of value. J. Destin. Mark. Manag. 2015, 4, 151–161. [Google Scholar] [CrossRef]
- Hudson, S.; Thal, K. The Impact of Social Media on the Consumer Decision Process: Implications for Tourism Marketing. J. Travel Tour. Mark. 2013, 30, 156–160. [Google Scholar] [CrossRef]
- Godey, B.; Manthiou, A.; Pederzoli, D.; Rokka, J.; Aiello, G.; Donvito, R.; Singh, R. Social media marketing efforts of luxury brands: Influence on brand equity and consumer behavior. J. Bus. Res. 2016, 69, 5833–5841. [Google Scholar] [CrossRef]
- Khan, Z.; Yang, Y.; Shafi, M.; Yang, R. Role of social media marketing activities (SMMAs) in apparel brands customer response: A moderated mediation analysis. Sustainability 2019, 11, 5167. [Google Scholar] [CrossRef]
- Fotiadis, A.K.; Stylos, N. The effects of online social networking on retail consumer dynamics in the attractions industry: The case of ‘E-da’ theme park, Taiwan. Technol. Forecast. Soc. Chang. 2017, 124, 283–294. [Google Scholar] [CrossRef]
- Seo, E.; Park, J. A study on the effects of social media marketing activities on brand equity and customer response in the airline industry. J. Air Transp. Manag. 2018, 66, 36–41. [Google Scholar] [CrossRef]
- Syed-Ahmad, S.F.; Murphy, J. Social Networking as a Marketing Tool: The Case of a Small Australian Company. J. Hosp. Mark. Manag. 2010, 19, 700–716. [Google Scholar] [CrossRef]
- Chen, S.; Lin, C. Understanding the effect of social media marketing activities: The mediation of social identification, perceived value, and satisfaction. Technol. Forecast. Soc. Chang. 2019, 140, 22–32. [Google Scholar] [CrossRef]
- Kaosiri, Y.N.; Fiol, L.J.C.; Tena, M.Á.M.; Artola, R.M.R.; García, J.S. User-Generated Content Sources in Social Media: A New Approach to Explore Tourist Satisfaction. J. Travel Res. 2019, 58, 253–265. [Google Scholar] [CrossRef]
- Xiang, Z.; Gretzel, U. Role of social media in online travel information search. Tour. Manag. 2010, 31, 179–188. [Google Scholar] [CrossRef]
- Dwivedi, Y.K.; Ismagilova, E.; Hughes, D.L.; Carlson, J.; Filieri, R.; Jacobson, J.; Jain, V.; Karjaluoto, H.; Kefi, H.; Krishen, A.S.; et al. Setting the future of digital and social media marketing research: Perspectives and research propositions. Int. J. Inf. Manag. 2020, 102168. [Google Scholar] [CrossRef]
- Shareef, M.A.; Mukerji, B.; Dwivedi, Y.K.; Rana, N.P. Social media marketing: Comparative effect of advertisement sources. J. Retail. Consum. Serv. 2019, 46, 58–69. [Google Scholar] [CrossRef]
- Delone, W.H.; Mclean, E.R. Information systems success: The quest for the dependent variable. Inf. Syst. Res. 1992, 3, 60–95. [Google Scholar] [CrossRef]
- Rogers, E.M. Diffusion of Innovations, 4th ed.; The Free Press: New York, NY, USA, 1995; ISBN 1451602472. [Google Scholar]
- Casaló, L.V.; Flavián, C.; Guinalíu, M. Determinants of the intention to participate in firm-hosted online travel communities and effects on consumer behavioral intentions. Tour. Manag. 2010, 31, 898–911. [Google Scholar] [CrossRef]
- Hew, J.; Leong, L.; Tan, G.W.; Lee, V.; Ooi, K. Mobile social tourism shopping: A dual-stage analysis of a multi-mediation model. Tour. Manag. 2018, 66, 121–139. [Google Scholar] [CrossRef]
- Wong, C.H.; Tan, G.W.H.; Loke, S.P.; Ooi, K.B. Mobile TV: A new form of entertainment? Ind. Manag. Data Syst. 2014, 114, 1050–1067. [Google Scholar] [CrossRef]
- Tsang, M.M.; Ho, S.; Liang, T. Consumer Attitudes Toward Mobile Advertising: An Empirical Study. Int. J. Electron. Commer. 2004, 8, 65–78. [Google Scholar] [CrossRef]
- Huang, Y.C.; Chang, L.L.; Yu, C.P.; Chen, J. Examining an extended technology acceptance model with experience construct on hotel consumers’ adoption of mobile applications. J. Hosp. Mark. Manag. 2019, 28, 957–980. [Google Scholar] [CrossRef]
- Stal, J.; Grażyna, P.-P. Mobile Technology Acceptance Model: An Empirical Study on Users’ Acceptance and Usage of Mobile Technology for Knowledge Providing. In Proceedings of the European, Mediterranean, and Middle Eastern Conference on Information Systems, Limassol, Cyprus, 4–5 October 2018; Springer: Cham, Switzerland, 2019; pp. 547–559. [Google Scholar]
- Oliver, R.L. Cognitive, Affective, and Attribute Bases of the Satisfaction Response. J. Consum. Res. 1993, 20, 418. [Google Scholar] [CrossRef]
- Oliver, R.L. A cognitive model of the antecedents and consequences of satisfaction decisions. J. Mark. Res. 1980, 17, 460. [Google Scholar] [CrossRef]
- Bhattacherjee, A. Understanding Information Systems Continuance: An Expectation-Confirmation Model. MIS Q. 2001, 25, 351–370. [Google Scholar] [CrossRef]
- Shin, D.H. Effect of the customer experience on satisfaction with smartphones: Assessing smart satisfaction index with partial least squares. Telecommun. Policy 2015, 39, 627–641. [Google Scholar] [CrossRef]
- Tse, D.K.; Wilton, P.C. Models of Consumer Satisfaction Formation: An Extension. J. Mark. Res. 1988, 25, 204. [Google Scholar] [CrossRef]
- Kuo, Y.; Wu, C.; Deng, W. The relationships among service quality, perceived value, customer satisfaction, and post-purchase intention in mobile value-added services. Comput. Hum. Behav. 2009, 25, 887–896. [Google Scholar] [CrossRef]
- Wang, C.; Hsu, M.K.; Wang, C.; Hsu, M.K. The relationships of Destination image, satisfaction, and Behavioral Intentions: An Integrated Model. J. Travel Tour. Mark. 2010, 27, 829–843. [Google Scholar] [CrossRef]
- Sun, Y.; Liu, L.; Peng, X.; Dong, Y.; Barnes, S.J. Understanding Chinese users’ continuance intention toward online social networks: An integrative theoretical model. Electron. Mark. 2014, 24, 57–66. [Google Scholar] [CrossRef]
- Choi, E.C.; Fowler, D.; Goh, B.; Yuan, J.J. Social Media Marketing: Applying the Uses and Gratifications Theory in the Hotel Industry. J. Hosp. Mark. Manag. 2016, 25, 771–796. [Google Scholar] [CrossRef]
- Hew, J.; Tan, G.W.; Lin, B.; Ooi, K. Generating travel-related contents through mobile social tourism: Does privacy paradox persist? Telemat. Inform. 2017, 34, 914–935. [Google Scholar] [CrossRef]
- Natarajan, T.; Balasubramanian, S.A.; Kasilingam, D.L. Understanding the intention to use mobile shopping applications and its influence on price sensitivity. J. Retail. Consum. Serv. 2017, 37, 8–22. [Google Scholar] [CrossRef]
- Zhonggen, Y.; Xiaozhi, Y. An extended technology acceptance model of a mobile learning technology. Comput. Appl. Eng. Educ. 2019, 27, 721–732. [Google Scholar] [CrossRef]
- Mangold, W.G.; Faulds, D.J. Social media: The new hybrid element of the promotion mix. Bus. Horiz. 2009, 52, 357–365. [Google Scholar] [CrossRef]
- Voorveld, H.A.M.; Van Noort, G.; Muntinga, D.G.; Bronner, F. Engagement with Social Media and Social Media Advertising: The Differentiating Role of Platform Type. J. Advert. 2018, 47, 38–54. [Google Scholar] [CrossRef]
- Pornsakulvanich, V.; Dumrongsiri, N. Internal and external influences on social networking site usage in Thailand. Comput. Hum. Behav. 2013, 29, 2788–2795. [Google Scholar] [CrossRef]
- Muntinga, D.G.; Moorman, M.; Smit, E.G. Introducing COBRAs: Exploring motivations for Brand-Related social media use. Int. J. Advert. 2011, 30, 13–46. [Google Scholar] [CrossRef]
- Erkan, I.; Evans, C. The influence of eWOM in social media on consumers’ purchase intentions: An extended approach to information adoption. Comput. Hum. Behav. 2016, 61, 47–55. [Google Scholar] [CrossRef]
- Wang, T.; Yeh, R.K.J.; Chen, C.; Tsydypov, Z. What drives electronic word-of-mouth on social networking sites? Perspectives of social capital and self-determination. Telemat. Inform. 2016, 33, 1034–1047. [Google Scholar] [CrossRef]
- Jalilvand, M.R.; Samiei, N. The impact of electronic word of mouth on a tourism destination choice Testing the theory of planned behavior (TPB). Internet Res. 2012, 22, 591–612. [Google Scholar] [CrossRef]
- Tham, A.; Croy, G.; Mair, J. Social Media in Destination Choice: Distinctive Electronic Word-of-Mouth Dimensions. J. Travel Tour. Mark. 2013, 30, 144–155. [Google Scholar] [CrossRef]
- Hernández-méndez, J.; Muñoz-leiva, F.; Sánchez-fernández, J. The influence of e-word-of-mouth on travel decision-making: Consumer profiles. Curr. Issues Tour. 2015, 18, 1001–1021. [Google Scholar] [CrossRef]
- Yap, S.; Gaur, S.S. Integrating functional, social, and psychological determinants to explain online social. Behav. Inf. Technol. 2016, 35, 166–183. [Google Scholar] [CrossRef]
- Zhao, Q.; Chen, C.; Wang, J. The effects of psychological ownership and TAM on social media loyalty: An integrated model. Telemat. Inform. 2016, 33, 959–972. [Google Scholar] [CrossRef]
- Xia, M.; Zhang, Y.; Zhang, C. A TAM-based approach to explore the effect of online experience on destination image: A smartphone user’s perspective. J. Destin. Mark. Manag. 2018, 8, 259–270. [Google Scholar] [CrossRef]
- Kim, T.T.; Karatepe, O.M.; Lee, G.; Demiral, H. Do Gender and Prior Experience Moderate the Factors Influencing Attitude toward Using Social Media for Festival Attendance? Sustainability 2018, 10, 3509. [Google Scholar] [CrossRef]
- Lisha, C.; Fei, C.; Yifan, S.; Rasli, A. Integrating guanxi into technology acceptance: An empirical investigation of WeChat. Telemat. Inform. 2017, 34, 1125–1142. [Google Scholar] [CrossRef]
- Liu, Y.; Pu, B.; Guan, Z.; Yang, Q. Online Customer Experience and Its Relationship to Repurchase Intention: An Empirical Case of Online Travel Agencies in China. Asia Pac. J. Manag. 2016, 21, 1085–1099. [Google Scholar] [CrossRef]
- Kim, K.J. Can smartphones be specialists? Effects of specialization in mobile advertising. Telemat. Inform. 2014, 31, 640–647. [Google Scholar] [CrossRef]
- Lu, H.; Hsiao, K. The influence of extro/introversion on the intention to pay for social networking sites. Inf. Manag. 2010, 47, 150–157. [Google Scholar] [CrossRef]
- Lu, J.; Yao, J.E.; Yu, C.S. Personal innovativeness, social influences and adoption of wireless Internet services via mobile technology. J. Strateg. Inf. Syst. 2005, 14, 245–268. [Google Scholar] [CrossRef]
- Agrebi, S.; Jallais, J. Explain the intention to use smartphones for mobile shopping. J. Retail. Consum. Serv. 2015, 22, 16–23. [Google Scholar] [CrossRef]
- Verma, V.K.; Chandra, B.; Kumar, S. Values and ascribed responsibility to predict consumers’ attitude and concern towards green hotel visit intention. J. Bus. Res. 2019, 96, 206–216. [Google Scholar] [CrossRef]
- Brislin, R.W. Back-Translation For Cross-Cultural Research. J. Cross Cult. Psychol. 1970, 1, 185–216. [Google Scholar] [CrossRef]
- Davis, F.D. Perceived Usefulness, Perceived Ease of Use, and User Acceptance of Information Technology. MIS Q. 1989, 13, 319–340. [Google Scholar] [CrossRef]
- Textor, C. China’s Revenue from Tourism. Available online: https://www.statista.com/statistics/236040/revenue-from-tourism-in-china/ (accessed on 20 December 2020).
- Thomala, L.L. Number of Internet Users in China. Available online: https://www.statista.com/statistics/278417/number-of-internet-users-in-china/ (accessed on 20 February 2021).
- Statista Number of Smartphone Users in China. Available online: https://www.statista.com/statistics/467160/forecast-of-smartphone-users-in-china/ (accessed on 20 February 2021).
- Bush, A.J.; Hair, J.F. An assessment of the mall intercept as a data collection method. J. Mark. Res. 1985, 22, 158–167. [Google Scholar] [CrossRef]
- World Population Review Shanghai Population. Available online: https://worldpopulationreview.com/world-cities/shanghai-population (accessed on 10 August 2020).
- Kasim, A.; Alfandi, A. Managing destination image for potential gulf countries tourists via communication effects assessment: The case of Malaysia. Int. J. Bus. Soc. 2014, 15, 503–518. [Google Scholar]
- Khare, A. Consumers’ susceptibility to interpersonal influence as a determining factor of ecologically conscious behaviour. Mark. Intell. Plan. 2014, 32, 2–20. [Google Scholar] [CrossRef]
- Prakash, G.; Pathak, P. Intention to buy eco-friendly packaged products among young consumers of India: A study on developing nation. J. Clean. Prod. 2017, 141, 385–393. [Google Scholar] [CrossRef]
- Priporas, C.; Stylos, N.; Eirini, I. City image, city brand personality and generation Z residents’ life satisfaction under economic crisis: Predictors of city-related social media engagement. J. Bus. Res. 2019. [Google Scholar] [CrossRef]
- Recuero, N.; Gomez, J.; Francisca, M.; López, B.; Figueiredo, J.; Rey, U.; Carlos, J. Perceived relationship investment as a driver of loyalty: The case of Conimbriga Monographic Museum. J. Destin. Mark. Manag. 2019, 11, 23–31. [Google Scholar] [CrossRef]
- Ilieş, A.; Dehoorne, O.; Ilies, D.C. The cross-border territorial system in Romanian-Ukrainian Carpathian Area. Elements, mechanisms and structures generating premises for an integrated cross-border territorial system with tourist function. Carpath. J. Earth Environ. Sci. 2012, 7, 27–38. [Google Scholar]
- Filieri, R.; Alguezaui, S.; Mcleay, F. Why do travelers trust TripAdvisor? Antecedents of trust towards consumer-generated media and its influence on recommendation adoption and word of mouth. Tour. Manag. 2015, 51, 174–185. [Google Scholar] [CrossRef]
- Nickerson, R.S. Confirmation bias: A ubiquitous phenomenon in many guises. Rev. Gen. Psychol. 1998, 2, 175–220. [Google Scholar] [CrossRef]
- Kline, R.B. Principles and Practice of Structural Equation Modeling, 3rd ed.; The Guilford Press: New York, NY, USA; London, UK, 2011. [Google Scholar]
- Hair, J.F.; Black, W.C.; Babin, B.J.; Anderson, R.E. Multivariate Data Analysis, 7th ed.; Pearson New International Edition: Essex, UK, 2014. [Google Scholar]
- Chin, W.W. The Partial Least Squares Approach to Structural Equation Modeling. Adv. Hosp. Leis. 1998, 8, 295–336. [Google Scholar]
- Armstrong, J.S.; Overton, T.S. Estimating Nonresponse Bias in Mail Surveys. J. Mark. Res. 1977, 14, 396. [Google Scholar] [CrossRef]
- Sax, L.J.; Gilmartin, S.K.; Bryant, A.N. Assessing response rates and nonresponse bias in web and paper surveys. Res. High. Educ. 2003, 44, 409–432. [Google Scholar] [CrossRef]
- Anderson, J.C.; Gerbing, D.W. Structural Equation Modeling in Practice: A Review and Recommended Two-Step Approach. Psychol. Bull. 1988, 103, 411–423. [Google Scholar] [CrossRef]
- Podsakoff, P.M.; MacKenzie, S.B.; Lee, J.Y.; Podsakoff, N.P. Common Method Biases in Behavioral Research: A Critical Review of the Literature and Recommended Remedies. J. Appl. Psychol. 2003, 88, 879–903. [Google Scholar] [CrossRef] [PubMed]
- Fuller, C.M.; Simmering, M.J.; Atinc, G.; Atinc, Y.; Babin, B.J. Common methods variance detection in business research. J. Bus. Res. 2016, 69, 3192–3198. [Google Scholar] [CrossRef]
- Cronbach, L.J. Coefficient alpha and the internal structure of Tests. Psychometrika 1951, 16, 297–334. [Google Scholar] [CrossRef]
- Hundleby, J.D.; Nunnally, J. Psychometric Theory. Am. Educ. Res. J. 1968, 5, 431. [Google Scholar] [CrossRef]
- Bagozzi, R.R.; Yi, Y. On the Evaluation of Structural Equation Models. J. Acad. Mark. Sci. 1988, 16, 74–94. [Google Scholar] [CrossRef]
- Fornell, C.; Larcker, D.F. Evaluating Structural Equation Models with Unobservable Variables and Measurement Error. J. Mark. Res. 1981, 18, 39–50. [Google Scholar] [CrossRef]
- Gefen, D.; Straub, D.; Boudreau, M.-C. Structural Equation Modeling and Regression: Guidelines for Research Practice. Commun. Assoc. Inf. Syst. 2000, 4, 7. [Google Scholar] [CrossRef]
- Chi, T. Understanding Chinese consumer adoption of apparel mobile commerce: An extended TAM approach. J. Retail. Consum. Serv. 2018, 44, 274–284. [Google Scholar] [CrossRef]
- Nikou, S.A.; Economides, A.A. Mobile-Based Assessment: Integrating acceptance and motivational factors into a combined model of Self-Determination Theory and Technology Acceptance. Comput. Hum. Behav. 2017, 68, 83–95. [Google Scholar] [CrossRef]
- Huang, L.; Mou, J.; See-to, E.W.K.; Kim, J. Perceived value preferences for mobile marketing in China: A mixed method approach. J. Retail. Consum. Serv. 2019, 48, 70–86. [Google Scholar] [CrossRef]
Publisher’s Note: MDPI stays neutral with regard to jurisdictional claims in published maps and institutional affiliations. |
© 2021 by the authors. Licensee MDPI, Basel, Switzerland. This article is an open access article distributed under the terms and conditions of the Creative Commons Attribution (CC BY) license (http://creativecommons.org/licenses/by/4.0/).