Abstract
Bangkok, the capital city of Thailand, is one of the most developed and expansive cities. Due to the ongoing development and expansion of Bangkok, urbanization has continued to expand into adjacent provinces, creating the Bangkok Metropolitan Region (BMR). Continuous monitoring of human mobility in BMR aids in public transport planning and design, and efficient performance assessment. The purpose of this study is to design and develop a process to derive human mobility patterns from the real movement of people who use both fixed-route and non-fixed-route public transport modes, including taxis, vans, and electric rail. Taxi GPS open data were collected by the Intelligent Traffic Information Center Foundation (iTIC) from all GPS-equipped taxis of one operator in BMR. GPS probe data of all operating GPS-equipped vans were collected by the Ministry of Transport’s Department of Land Transport for daily speed and driving behavior monitoring. Finally, the ridership data of all electric rail lines were collected from smartcards by the Automated Fare Collection (AFC). None of the previous works on human mobility extraction from multi-sourced big data have used van data; therefore, it is a challenge to use this data with other sources in the study of human mobility. Each public transport mode has traveling characteristics unique to its passengers and, therefore, specific analytical tools. Firstly, the taxi trip extraction process was developed using Hadoop Hive to process a large quantity of data spanning a one-month period to derive the origin and destination (OD) of each trip. Secondly, for van data, a Java program was used to construct the ODs of van trips. Thirdly, another Java program was used to create the ODs of the electric rail lines. All OD locations of these three modes were aggregated into transportation analysis zones (TAZ). The major taxi trip destinations were found to be international airports and provincial bus terminals. The significant trip destinations of vans were provincial bus terminals in Bangkok, electric rail stations, and the industrial estates in other provinces of BMR. In contrast, electric rail destinations were electric rail line interchange stations, the central business district (CBD), and commercial office areas. Therefore, these significant destinations of taxis and vans should be considered in electric rail planning to reduce the air pollution from gasoline vehicles (taxis and vans). Using the designed procedures, the up-to-date dataset of public transport can be processed to derive a time series of human mobility as an input into continuous and sustainable public transport planning and performance assessment. Based on the results of the study, the procedures can benefit other cities in Thailand and other countries.
1. Introduction
The Bangkok Metropolitan Region (BMR) consists of eight provinces: Bangkok, Samut Prakan, Nonthaburi, Pathum Thani, Nakhon Pathom, Samut Sakhon, Ayutthaya, and Chachoengsao. For some time, urbanization has expanded outside of central Bangkok to the outer zones of BMR. Although modern and wealthy work areas are still located in the central business district (CBD), residential zones have recently expanded into the suburban area of Bangkok and surrounding provinces. Understanding the human mobility patterns between areas helps planners to design efficient and appropriate public transport for people commuting among BMR areas.
Human mobility is the movement of people from one location to others based on their needs. The study of human mobility patterns can reflect the urban structure, the distribution of facilities, and the required transport services [1]. It can also be applied to monitoring disease spread, social behavior, socio-economic outcomes, and economic growth [2]. The common form of human mobility is the origin–destination matrix, or OD matrix for short, which indicates the travel demand between places. Traditionally, the OD matrix is generated from surveys, such as household travel surveys and roadside interviews. These kinds of surveys are extremely expensive to regularly update [3]. Moreover, it is impossible to obtain travel demand or human mobility data for immediate use. These problems are worsening in developing countries, in which land use has rapidly and continuously changed [4]. Due to the plans of the Thai government to extend the existing electric rail lines and construct new lines to cover the residential and business areas of BMR [5], continuous monitoring of human mobility patterns, including movements of real people, is crucial for both public transport planning and performance evaluation. Using time series of human mobility data, the impact of newly constructed or extended public transport routes can be effectively evaluated, and planners can use the data in the planning process to ensure the quality of life of Bangkok residents.
Due to ubiquitous mobile computing and big data, new data sources, such as GPS probe and electric rail smartcard data, are available. In Thailand, GPS probe data recently became available for public transport modes, including taxis and vans, due to the regulation of the Ministry of Transport’s Department of Land Transport (DLT). Typically, the taxi mode is a good choice for non-fixed route transport in the Bangkok area because it is a flexible and comfortable door-to-door service. Furthermore, Thailand has the third cheapest taxi fares in the world according to the taxi fare statistics of www.taxi-calculator.com (accessed on 19 December 2020). An eight-kilometer taxi ride in Thailand costs USD 2.47 [6]. Generally, van routes complement the unavailability of bus services, and vans provide a commuter service from a defined origin to a defined destination without stopping. Therefore, vans save travelling time and are more popular than fixed-route buses. Unfortunately, the bus GPS probe data is not available because the bus tracking system was recently established, and the Bangkok Mass Transit Authority (BMTA) did not implement an open data policy at the time of this study. In addition to public transport GPS probe data, the entry and exit records of electric rail for each smartcard are stored by Automated Fare Collection (AFC). There are three electric rail operators in Thailand, namely, Bangkok Mass Transit System (BTS), Mass Rapid Transit (MRT), and Airport Rail Link (ARL). These systems are connected at specific interchange stations to serve residents of Bangkok and surrounding provinces.
The big data of GPS probes is naturally subject to errors and outliers. Preprocessing of GPS probe big data was introduced in recent studies to eliminate these outliers and errors [7,8,9]. The OD trips were generated from taxi GPS probes based on the occupancy status to reveal human mobility from taxi trajectories [7,10,11]. Smartcards have also been used to derive the OD trips of human mobility. AFC has been globally utilized in public transport modes, such as electric rail, and is highly useful for recording the origin location and destination location of an individual. By determining the trajectory of each smartcard, human mobility has been revealed in numerous studies [12,13,14,15]. Moreover, previous studies have combined multiple sources of data to investigate human mobility, such as using taxi GPS probes and electric rail smartcards [16]; using taxi GPS probes, call detail records (CDRs), and smartcard subway data [17]; using smartcards with a household travel survey [18]; using taxi GPS probes, subway transactions, and bus transactions [19]; and using taxi GPS probes, transit smartcards, and a resident travel survey [20].
To the best of our knowledge, many previous studies have examined taxis, buses, and subways to investigate human mobility based on public transport big data; however, no study has used van data in conjunction with data of other transport modes. The characteristics of van trips are different from those of taxis and buses. Buses typically operate according to a routine with a specific interval. However, van trips begin when the number of passengers reaches the van’s capacity. It is a challenge to determine human mobility from the combination of van data and other sources. This study aims to design and develop a process of deriving human mobility patterns of the rapidly growing BMR using the available sources of public transport data for taxis, vans, and electric rail. The goal was to continuously monitor the change in public transport human mobility for public transport planning and assessment.
The contributions of this paper are as follows:
- An empirical technique for trip extraction of multi-level data sources, including taxis, vans, and electric rails.
- Determination of the travel demands and characteristics of each public transport mode during morning and evening peak hours.
- Determination of the human mobility patterns of each mode between Bangkok CBD and other BMR zones during morning and evening peak hours.
- This study can be replicated for processing of future up-to-date data sources to continuously monitor the changes in human mobility for public transport planning and evaluation.
2. Method and Data
2.1. Case Study
Bangkok is the capital city of Thailand, with an area of 157 km2. In 2018, according to the statistics data of the Bangkok Metropolitan Administration, Bangkok had a population of about 5.7 million people and 3 million residential buildings, and the wider BMR had a population of about 10.9 million inhabitants [21]. Figure 1 illustrates the land use of Bangkok in 2015. The inner or center area of Bangkok consists of the commercial area and CBD (red), government and state enterprise offices (blue), and residential area (yellow), whereas the western and eastern areas are mostly residential and agricultural (green). Figure 2 shows the public transport in BMR, including airports, provincial bus terminals, electric rail lines, and interchange stations. There were five electric rail lines in 2018, namely, the ARL line (in dark red), two lines of MRT (in purple and blue), and two lines of BTS (in dark and light green). There were eight ARL stations, 34 MRT stations, and 36 BTS stations. In addition to these public transport modes, other modes include city buses, vans, taxis, and motorcycle taxis.
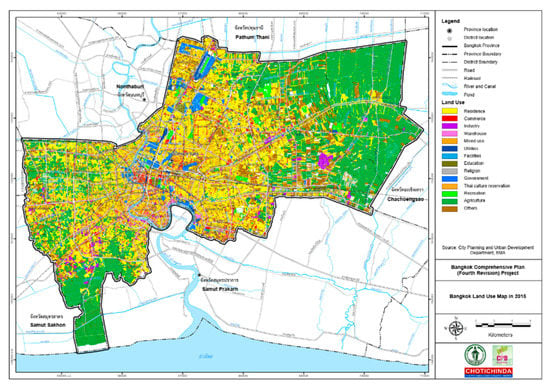
Figure 1.
The 2015 land use map of Bangkok produced by the City Planning and Urban Development Department, Bangkok Metropolitan Administration (BMA).
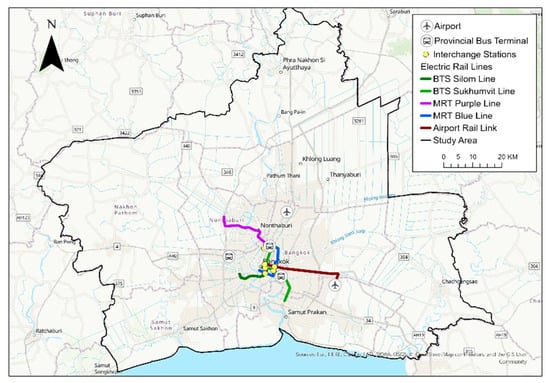
Figure 2.
Bangkok and surrounding provinces with public transport.
The government provides public transport for traveling inside Bangkok and between BMR provinces. Bangkok public transport can be categorized into two types, which are fixed-route and non-fixed-route transports. Fixed-route transport modes are electric rail, public vans, and buses. The route of each mode has been designed by the operators. Electric rail operates in the city and among the three provinces in BMR. Van routes serve the need of traveling between provinces or from the suburb to city areas. Popular non-fixed route transport modes are taxis and motorcycle taxis, which provide door-to-door services. Travelling by taxi is the choice for long-distance travel in the city. Motorcycle taxis are more popular for short-distance travel, such as from the main road to the end of the alley.
According to the 2017 Extended Bangkok Urban Model of the Ministry of Transport’s Office of Transport and Traffic Policy and Planning (OTP), the estimated number of public transport travel trips per day in BMR is 7.96 million [22]. Trips via taxi and motorcycle taxi, electric rail, and van represent 32% of all public transport trips, as shown in Figure 3.

Figure 3.
The public transport ratios in 2017 according to the Office of Transport and Traffic Policy and Planning.
2.2. Transport Data
Table 1 describes the data sources available for this study. Due to the availability of van GPS probes from the Ministry of Transport’s Department of Land Transport, seven days of data, from August 27 to September 2, 2018, were used in the study. In contrast, the taxi GPS probe and electric rail data were available for entire month of February 2018.

Table 1.
Data sources.
2.2.1. Taxi GPS Probe
The Intelligent Traffic Information Center Foundation (iTIC) collects GPS probe data from many sources, including trucks, buses, and taxis. This GPS probe dataset is provided as open data by the iTIC. Regarding taxis, iTIC gathered GPS probe data from all taxis of one taxi operator. The taxi service area of this operator covers all of the BMR area, as shown in Figure 4. The taxi GPS data are regularly collected each 1 min if the car key status is active. Otherwise, the data are collected every 3 min. This collection produces the big data of the taxi GPS probe. The raw data of taxi GPS probes is stored in the comma separated value (CSV) format, as shown in Table 2. The data of taxis equipped with a GPS are collected based on one day per CSV file, starting from midnight and going to the following midnight. In this paper, the taxi GPS probe data of February 2018 was used for designing, developing, and testing the processes. A total of 96,240,215 records from 5646 vehicles were recorded in the CSV files for the month of February 2018.
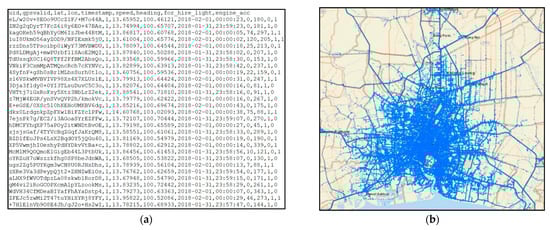
Figure 4.
The taxi GPS probe data. (a) The raw comma separated value (CSV) data and (b) the distribution of taxi GPS probe.
Table 2.
The taxi GPS probe data CSV file description.
2.2.2. Van GPS Probe
The GPS center of the Department of Land Transport collects GPS probe data from all operating GPS-equipped vans to monitor the vehicle speed and driving behavior. The van GPS probe data in CSV format contains the timestamp, unique ID of the vehicle, latitude, longitude, speed, and type, as shown in Figure 5 and Table 3. Only seven days of GPS data can be kept in the system. The data used in this study were collected from 27 August to 2 September 2018. The total number of van GPS probe records was 15,650,249 from 12,476 vehicles.
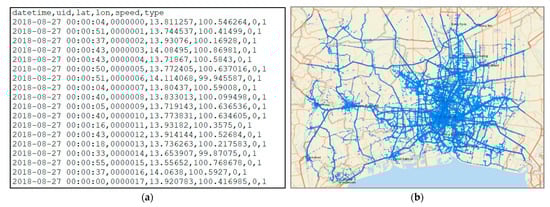
Figure 5.
The van GPS probe data. (a) The raw comma separated value (CSV) data and (b) the distribution of van GPS probe.
Table 3.
The van GPS probe data CSV file description.
2.2.3. Electric Rail Data
In addition to the road mode of transportation, electric rail ridership data in BMR, namely that of ARL (Airport Rail Link), BTS (Bangkok mass Transit System), and MRT (Mass Rapid Transit), are collected from smartcards by the Automated Fare Collection (AFC) system. However, the electric rail operators release only the aggregated ridership on an hourly basis in the form of OD matrix Excel files. Figure 6 illustrates a sample of the aggregated number of passengers of each OD station pair of ARL on 1 February 2018 from 7 a.m. to 8 a.m.
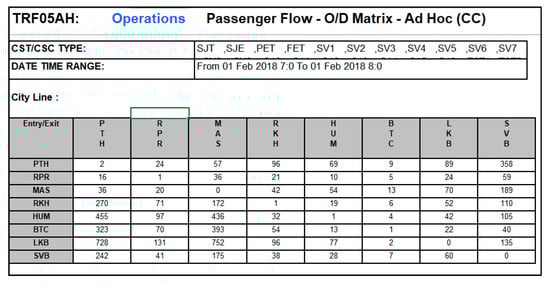
Figure 6.
The aggregated number of passengers of each origin–destination (OD) station pair on 1 February 2018, from 7 a.m. to 8 a.m.
2.3. Transportation Analysis Zones (TAZ)
In transportation planning models, the study area is typically divided into smaller units called transportation analysis zones (TAZs). The data for transportation planning analysis, such as that collected by OD survey, is based on these TAZs. In Thailand, the Office of Transport and Traffic Policy and Planning (OTP), which is part of the Ministry of Transport, is responsible for transportation planning for BMR and the whole country. The official 2018 TAZs cover eight provinces, namely, Bangkok, Samut Prakan, Nonthaburi, Pathum Thani, Nakhon Pathom, Samut Sakhon, Ayutthaya, and Chachoengsao. These eight provinces are divided into 1867 TAZs, as shown in Figure 7a. In this study, raw data was collected and aggregated into these TAZs and the coarser level of 10 BMR zones, as shown in Figure 7b: (1) Inner Bangkok, (2) East Bangkok, and (3) West Bangkok, (4) Nonthaburi, (5) Pathum Thani, (6) Samut Prakan, (7) Samut Sakhon, (8) Chachoengsao, (9) Nakhon Pathom, and (10) Ayutthaya.
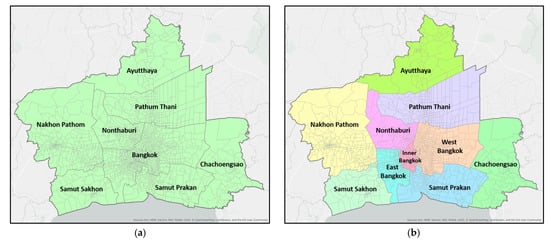
Figure 7.
The Office of Transport and Traffic Policy and Planning (OTP) transportation analysis zones. (a) 1867 transportation analysis zones (TAZs) and (b) TAZs and 10 Bangkok Metropolitan Region (BMR) zones.
2.4. Trip Data Extraction
The overall trip extraction process is illustrated in Figure 8. The processes used were: (1) loading raw data, (2) extracting each OD of the trip, (3) aggregating the OD locations to TAZs and 10 BMR areas, (4) deriving the average morning and evening trips, and (5) calculating the trip distance and travel time. However, the derivation of the OD trips of these three data sets was not identical because of the nature and characteristics of each mode.
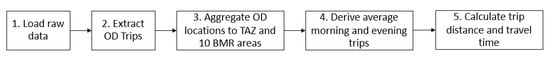
Figure 8.
Overall trip extraction process.
2.4.1. Taxi Trips
The procedures for taxi GPS probe data processing were based on the Hadoop platform, as shown in Figure 9. The process began with loading GPS probe data into Hadoop Hive. Typically, GPS probe data contains outliers or errors from the GPS signal or equipment errors. Vehicles with only one vacant status record were eliminated because a valid taxi typically has both an occupied and a vacant status. Then, records with zero values of coordinates, insufficient GPS signal, and inactive car key status were filtered out. In addition to errors, duplicate records were also removed to compact the data set. Finally, the OD matrix was derived from the taxi trips using the unique vehicle ID and vacant status.
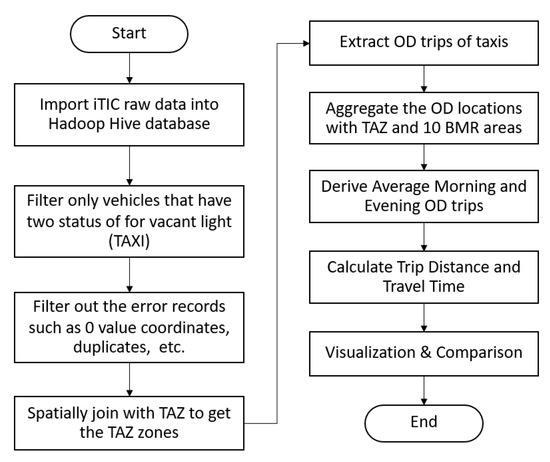
Figure 9.
Processing of taxi GPS probe OD trips in Hadoop.
To create the taxi GPS probe trips, the records must be arranged by date, unique vehicle ID, and time in ascending order. The taxi trips can be identified from the vacant light status. The status of “0” means that the light is off, and the taxi is occupied. The status of “1” means that the light is on and there is no passenger. The output is the taxi OD table. Each record indicates a taxi trip from an origin TAZ (o_taz) to a destination TAZ (d_taz), with the pick-up location and time, and drop-off location and time. The occupied and vacant trips are indicated by the vacant light status. The sample of a taxi OD in Table 4 illustrates an occupied trip which started at 13:28:21 (light status is off) on 2nd February 2018 and ended at 13:39:21 (light status is on). The total number of taxi trips was 2,221,049, comprising 1,105,408 occupied trips and 1,115,641 vacant trips. The number of vehicles was 3223.
Table 4.
A sample of the taxi trip table. Highlighted is an occupied taxi trip (light status = 0) from 13:28:21 in zone 334 to 13:39:21 in zone 355.
2.4.2. Van Trips
All van GPS probe data CSV files were imported into a PostgreSQL database. Unlike taxi GPS probe data, there is no occupied or vacant status in the van GPS probe data file. All vans must wait for the passengers at the defined van queues. Then, vans carry the passengers to the defined destination van queue. Thus, the main characteristics of van trips are: (1) staying at the van queue location for more than 10 min, (2) traveling more than 10 km, (3) having more than 20 GPS points, and (4) traveling more than 20 min. Based on these characteristics, vehicles with fewer than 21 records were filtered out. Then, van OD trips of each vehicle were constructed using a Java program based on the main characteristics of van trips. Finally, outlier trips, such as over speed, and long drive time or distance, were removed. The process of van trip construction is illustrated in Figure 10.
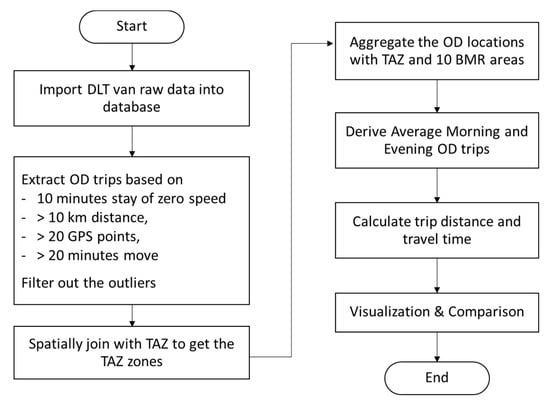
Figure 10.
Processing of van GPS probe data OD trips.
Figure 11 illustrates a sample of a van trip based on the above process. The van stay queue location or origin, trip, and destination can be identified using this process.
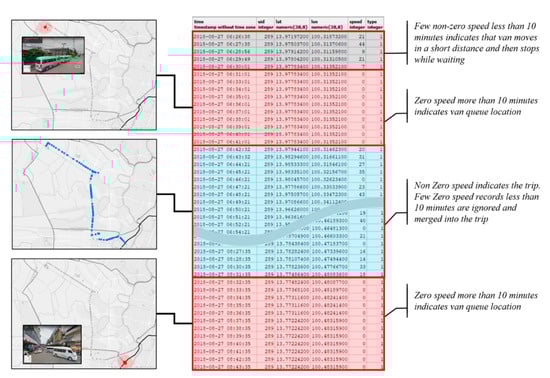
Figure 11.
Sample of a van OD trip.
Van trips are calculated based on the above procedures. The origin and destination attributes, such as time and TAZ, are derived with the trip information, including drive time in minutes and trip distance in kilometers. Table 5 represents the OD table of the sample OD information in Figure 11. The origin is in Nonthaburi (TAZ 1278) and the destination is in the inner Bangkok area (TAZ 56). The total number of van trips from 27 August 2018 to 2 September 2018 was 48,468. The number of vehicles was 6553.
Table 5.
A sample of a van trip in the van OD table from 06:42:32 in zone 1278 to 08:31:35 in zone 56 on 27 August 2018.
2.4.3. Electric Rail (ARL, BTS, and MRT) Trips
The process for electric rail AFC data is shown in Figure 12. Using a Java program, the Excel ridership files of ARL, BTS, and MRT were transformed into a table in a relational database management system based on the pattern of the OD data, as shown in Table 6. The OD pair unique numbers were defined using each OD station pair in each system. All electric rail stations are spatially joined with TAZs. The Java program transformed the passengers’ OD matrix into the OD table of each electric rail. Then, the consolidated output OD table of all electric rail types (ARL, BTS, and MRT) were derived, as shown in Table 7.
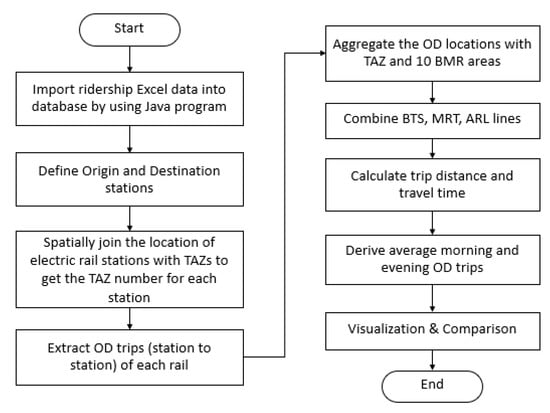
Figure 12.
Electric rail OD trip processing.
Table 6.
Sample of the transformed data in the relational database management system that shows 358 passengers traveled from Phaya Thai (PTH) station to Suvarnabhumi (SVB) station (od_pair = 7) on 1 February 2018, from 7 a.m. to 8 a.m.
Table 7.
Sample of the consolidated electric rail average passengers during February 2018.
3. Results
First, the results of each public transport mode were aggregated into 1867 TAZs to obtain the human mobility OD trips based on the BMR TAZs. When plotting all TAZ-based OD pairs of taxi and van trips, and electric rail passengers, the movements of people in BMR can be visualized, as shown in Figure 13. The longer-distance trips of vans, in cyan, indicate that van mode supports people commuting from the surrounding provinces and suburban areas of Bangkok to the CBD. In contrast, taxi trips are shorter and denser in Bangkok and adjacent areas. The patterns of passengers of electric rail are clearly dense for BTS and MRT, but not for ARL.
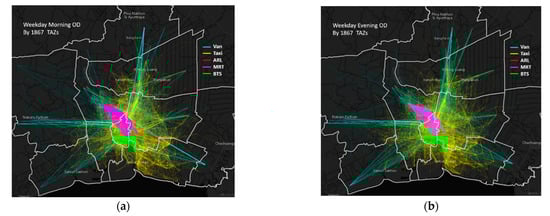
Figure 13.
The visualization of all Transportation Analysis Zone based ODs of taxi, van, and electric rail (Airport Rail Link or ARL, Mass Rapid Transit or MRT, and Bangkok mass Transit System or BTS) trips. (a) Weekday morning OD and (b) Weekday evening OD.
Second, the 1867 TAZs were aggregated into 10 BMR zones to reveal human mobility at the level of 10 BMR zones, namely, (1) Inner Bangkok (BKK-Inner), (2) East Bangkok (BKK-East), (3) West Bangkok (BKK-West), (4) Nonthaburi (NBR), (5) Pathum Thani (PTN), (6) Samut Prakan (SPK), (7) Samut Sakhon (SSK), (8) Chachoengsao (CCS), (9) Nakhon Pathom (NPT), and (10) Ayutthaya (AYY).
The characteristics and ODs of all modes are described in the following subsections.
3.1. Taxi Trip Characteristics and ODs
The total number of output taxi vehicles was 3223, which accounted for 4.1% of the 77,995 accumulative registered taxis in Bangkok. The taxi trip summary of February 2018 is presented in Table 8. Of the total taxi trips, 49.77% were occupied and 50.23% were vacant. The trip ratios between weekday and weekend for occupied and vacant trips were similar. The trip ratios of the morning peak period, evening peak period, and other periods were similar for all categories. Table 8 shows the average number of occupied taxi trips during each period of the weekday. In Figure 14, the demand for taxi service declines after 1 a.m., dramatically rises around 6 a.m., and then declines after 9 p.m. This implies that most passengers demand taxi services from daytime to late evening.
Table 8.
Summary of taxi trips in February 2018.
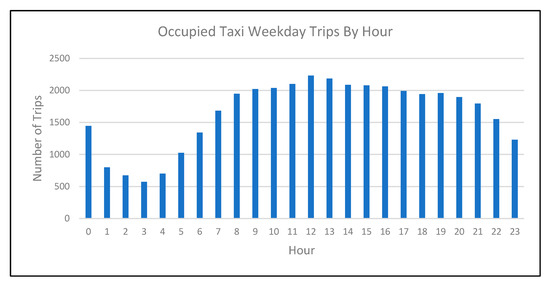
Figure 14.
The average occupied weekday taxi trips by hour.
Each trip distance was calculated and accumulated into the trip distance distribution of the morning peak period and evening peak period. The result reveals that approximately 58% of both morning (6–10 a.m.) and evening (4–8 p.m.) OD trips were of a distance of 1–10 km, as shown in Figure 15.
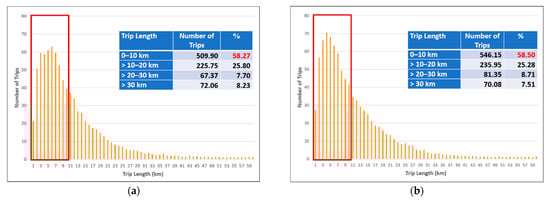
Figure 15.
Average taxi trip length distribution, weekday morning (a) and evening (b).
Figure 16 represents significant OD locations of both taxi morning and evening trips. For morning trips, the highest origin locations were Don Mueang International Airport, Suvarnabhumi International Airport, northern and north-eastern bus terminal, Mega Bangna department store area, and hospital and government office areas. The significant destination locations in the morning were also the two international airports, northern and north-eastern bus terminal, Mega Bangna department store area, and hospitals and government offices. In the evening period, the highest similar OD locations were the two international airports, northern and north-eastern bus terminal, and Mega Bangna department store area. Though not as popular as the prior mentioned destinations, the southern bus terminal in west Bangkok also has remarkable high traffic in the evening. This implies that taxis are commonly used for reaching other public transport modes.
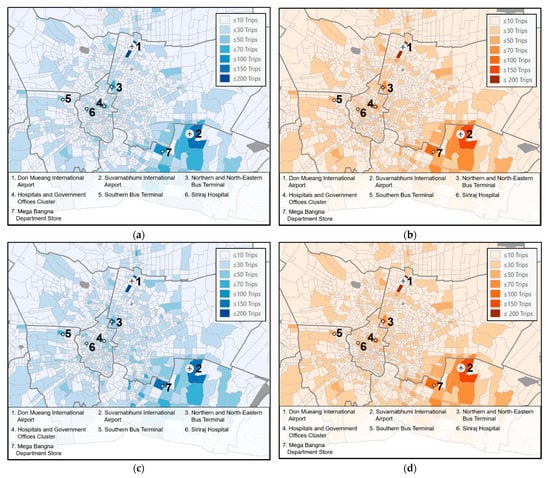
Figure 16.
The number of OD taxi trips by TAZ for morning and evening peak periods: (a) Taxi morning origin; (b) Taxi morning destination; (c) Taxi evening origin and (d) Taxi evening destination.
Then, the occupied taxi trips were aggregated into 10 BMR zones using the TAZs. OD maps and OD matrices shown in Figure 17 illustrate the average number of inter-BMR-zones taxi trips for morning and evening periods. The greater the volume of occupied taxi trips, the larger the plotted link. For the OD matrix, higher volumes of occupied taxi trips are shown in red. Insignificant inter-BMR-zone trips, of less than five trips, are displayed in a dark gray color. Light gray cells indicate that there were no trips between these 10 BMR OD pairs. In the case of morning trips, the top three highest trips were from Samut Prakan to eastern Bangkok, from Bangkok CBD to eastern Bangkok, and from eastern Bangkok to Samut Prakan. By comparison, traveling from Samut Prakan to eastern Bangkok, western Bangkok to Bangkok CBD, and eastern Bangkok to Samut Prakan were the top three evening taxi inter-BMR-zone trips. Traveling from Samut Prakan to eastern Bangkok was the most frequent taxi trip for both the morning and evening periods.
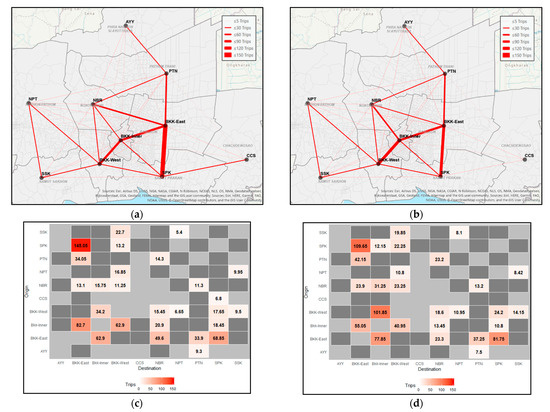
Figure 17.
The morning and evening taxi inter-OD trips of 10 BMR zones (Inner Bangkok or BKK-Inner, East Bangkok or BKK-East, West Bangkok or BKK-West, Nonthaburi or NBR, Pathum Thani or PTN, Samut Prakan or SPK, Samut Sakhon or SSK, Chachoengsao or CCS, Nakhon Pathom or NPT, and Ayutthaya or AYY): (a) Taxi inter-OD map of weekday morning; (b) Taxi inter-OD map of weekday evening; (c) Taxi inter-OD matrix of weekday morning and (d) Taxi inter-OD matrix of weekday evening.
3.2. Van Trip Characteristics and ODs
According to the statistics of the Department of Land Transport, in September 2018 the number of vans for the routes related to Bangkok was 10,485 vehicles. The output contained 6553 vehicles, accounting for 62% of all registered vans. The total number of van trips from August 27, 2018, to September 2, 2018, was 48,468. Weekday trips represented 66.72% and weekend trips represented 33.28%. The ratios of morning peak, evening peak, and other periods are listed in Table 9. During the weekday, the average number of trips per hour, derived as shown in Figure 18, shows that there were high volumes of van trips from 6 a.m. to 10 a.m. and 4 p.m. to 8 p.m. These two periods correspond to travel to the workplace in the morning and travel after working hours.
Table 9.
The summary of van trips from 27 August 2018, to 2 September 2018.
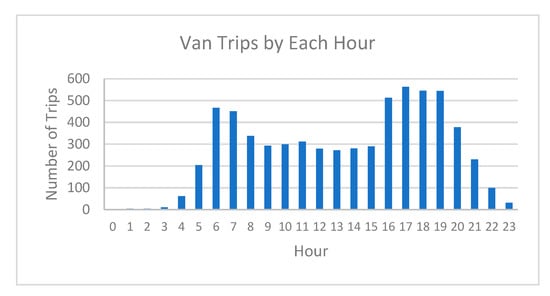
Figure 18.
The average van weekday trips per hour.
The trip length distribution of the morning and evening van trips was created from the result of van OD trip generation, as shown in Figure 19. The distance of the van OD trips indicates that around 70% of trips were of a distance of 10–40 km in both the morning and evening periods. The inter-BMR-zone van trips had a greater distribution among the 10 BMR zones than those of taxis.
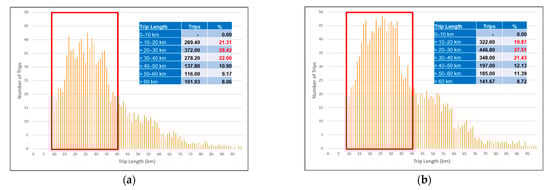
Figure 19.
The van average trip length distribution, weekday morning (a) and evening (b).
The maps of origin and destination TAZs of morning and evening van trips, as shown in Figure 20, reveal that there were many van trips from and to the surrounding provinces, such as Pathum Thani, Ayutthaya, Chachoengsao, Nonthaburi, Nakhon Pathom, and Samut Sakhon. The significant origins and destinations for both morning and evening periods in Bangkok were the northern and north-eastern bus terminal, southern bus terminal, victory monument public van hubs, and BTS and MRT interchange stations. In the case of Pathum Thani and Nonthaburi, the origins and destinations were the big van hubs in the Future Park Rangsit department store and the Mall Ngamwongwan department store. It is interesting that Rojana industrial estate in Ayutthaya and Wellgrow industrial estate in Chachoengsao were significant origins and destinations for van passengers.
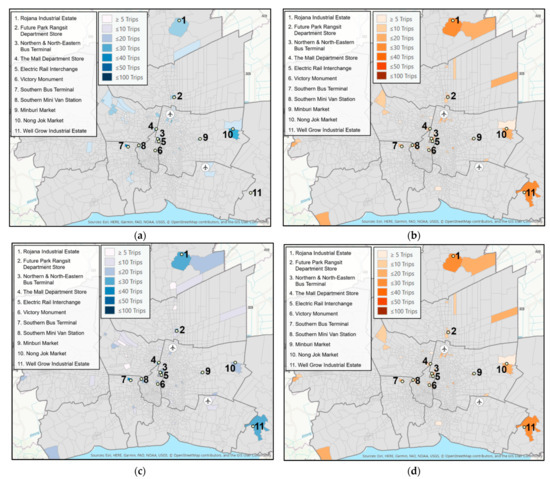
Figure 20.
The number of OD van trips by TAZ for morning and evening peak periods: (a) Van morning origin; (b) Van morning destination; (c) Van evening origin and (d) Van evening destination.
At the 10-BMR-zone level, the top three inter-OD BMR zones accounted for about 30% of the inter-province zone van trips, as shown in the OD maps and OD matrices of Figure 21. The top three morning inter-BMR-zone ODs were (1) from Pathum Thani to eastern Bangkok, (2) from Nonthaburi to eastern Bangkok, and (3) from Nonthaburi to Bangkok CBD. For the evening van trips, by comparison, the top three OD pairs were (1) from Bangkok CBD to Nonthaburi, (2) from eastern Bangkok to Pathum Thani, and (3) from Pathum Thani to eastern Bangkok.

Figure 21.
The morning and evening van inter-OD trips of 10 BMR zones (Inner Bangkok or BKK-Inner, East Bangkok or BKK-East, West Bangkok or BKK-West, Nonthaburi or NBR, Pathum Thani or PTN, Samut Prakan or SPK, Samut Sakhon or SSK, Chachoengsao or CCS, Nakhon Pathom or NPT, and Ayutthaya or AYY): (a) Van inter-OD map of weekday morning; (b) Van inter-OD map of weekday evening; (c) Van OD matrix of weekday morning and (d) Van inter-OD matrix of weekday evening.
3.3. Electric Rail Trip Characteristics and ODs
The number of passengers of the electric rail services (ARL, MRT, and BTS) were consolidated by hour to illustrate the peak periods. Figure 22 illustrates the high number of passengers in the morning and evening peak periods.
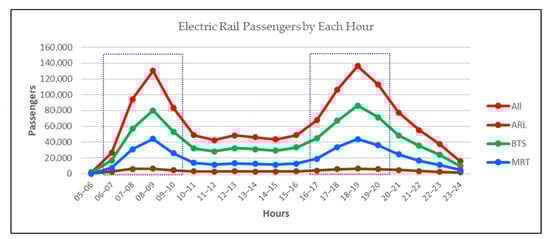
Figure 22.
The number of weekday electric rail passengers by hour. The morning and evening peak periods are shown in the dashed-line blocks.
Integrating ARL, MRT, and BTS data shows that about 70% of OD trips were less than 10 km for both morning and evening trips, as shown in Figure 23. However, the 0–5 km trips account for approximately 40% of all trips.
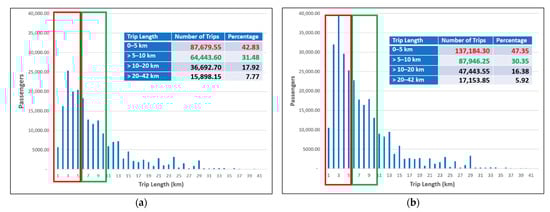
Figure 23.
The weekday morning (a) and evening (b) average trip length distribution of all electric rail systems.
The output of the processing, as shown in Figure 24, shows that the significant origins and destinations for electric rail were the interchange stations between these five lines, especially those between BTS and MRT in the inner and northern part of Bangkok. In addition to the interchanges, the inner CBD with dense workplaces, such as Silom-Sathorn and Ploenchit areas, were significant origins and destinations. Although ARL provides the linkage to Suvarnabhumi International Airport, the outcome reveals that fewer passengers use the electric rail commuter to the airport compared to the interchanges or the CBD area. It is clear, moreover, that electric rail lines to and from western Bangkok and Samut Prakan carry a significantly larger number of passengers than to and from Nonthaburi.
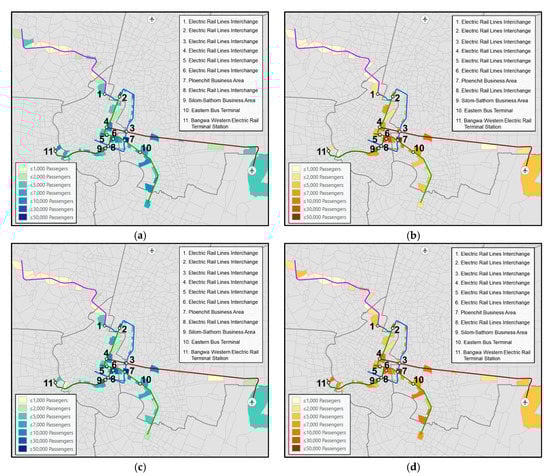
Figure 24.
The number of passengers of the OD electric rail by TAZ for morning and evening peak periods: (a) Electric rail morning origin; (b) Electric rail morning destination; (c) Electric rail evening origin and (d) Electric rail evening destination.
From the aggregation of TAZs into 10 BMR zones, the two highest counts of electric rail passenger ODs were the trips between eastern Bangkok and Bangkok CBD for both morning and evening trips. For the inter-BMR-zone trips, the two significant ODs with the highest volume were for travel between Bangkok CBD and eastern Bangkok. In the morning period, around 80,000 people traveled from eastern Bangkok to Bangkok CBD. On the contrary, only around 40,000 people traveled from Bangkok CBD to the east. After working hours, around 90,000 people traveled back from Bangkok CBD to eastern Bangkok. It is clear that the area of western Bangkok is smaller than that of the east and there is only one electric rail station in the west. Hence, the number of passengers traveling from the west to the Bangkok CBD is significantly fewer than the number traveling from the east. The extended electric rail line was constructed to carry more passengers from the west and other zones. The OD patterns are illustrated in the OD maps and OD matrices shown in Figure 25. The service area of electric rail covers only five BMR zones, as shown in the OD matrices.
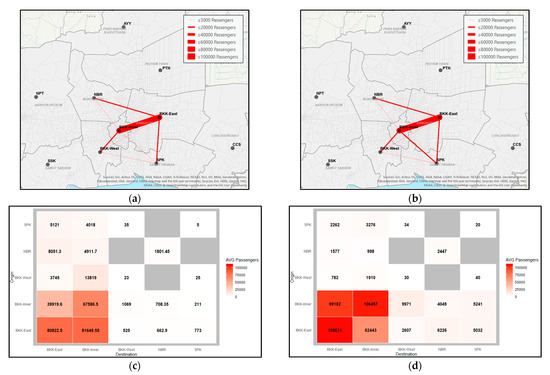
Figure 25.
The morning and evening electric rail OD passengers of BMR zones (Inner Bangkok or BKK-Inner, East Bangkok or BKK-East, West Bangkok or BKK-West, Nonthaburi or NBR, and Samut Prakan or SPK): (a) Electric rail inter-OD map of weekday morning; (b) Electric rail inter-OD map of weekday evening; (c) Electric rail OD matrix of weekday morning and (d) Electric rail OD matrix of weekday evening.
3.4. Human Mobility Patterns: The Human Movement between Bangkok CBD and Other BMR Zones
The next step was to focus on the human movement of each mode between Bangkok CBD and other BMR zones. Only records that had Bangkok CBD as the origin or destination were processed and visualized using chord diagrams. Each chord diagram is divided into two parts. The bottom part contains the origin BMR zones, and the upper part shows the destination zones. The border of each zone is annotated with the number of trips (taxis and vans) or number of passengers (electric rail). The links imply the human movement from origin to destination zones. The highest volume link is on the left and the lowest is on the right of the zone. The arrows show the direction of movement for the significant ODs. The Bangkok CBD zone or inner Bangkok is in green.
3.4.1. Taxi Human Mobility Patterns
In the morning peak period, a large number of people moved from Bangkok CBD to eastern Bangkok, western Bangkok, Nonthaburi, Samut Prakan, and other BMR zones, as shown in Figure 26. In addition, the significant trips were from residential areas of eastern and western Bangkok to Bangkok CBD. Comparing the number of inbound and outbound trips, the number of outbound trips was more than the number of inbound trips. For the evening peak period, the chord diagram illustrates the opposite relationship to that of the morning peak period. The significant inbound trips to Bangkok CBD were from western Bangkok, eastern Bangkok, and Nonthaburi, whereas the significant outbound trips from Bangkok CBD were to the residential areas of eastern and western Bangkok.
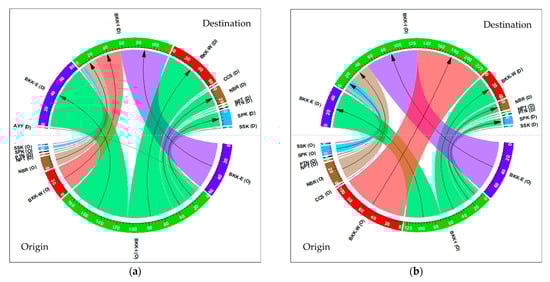
Figure 26.
The human movement between inner Bangkok and other BMR zones (Inner Bangkok or BKK-Inner, East Bangkok or BKK-East, West Bangkok or BKK-West, Nonthaburi or NBR, Pathum Thani or PTN, Samut Prakan or SPK, Samut Sakhon or SSK, Chachoengsao or CCS, Nakhon Pathom or NPT, and Ayutthaya or AYY) by taxi: (a) Average taxi trips of weekday morning and (b) Average taxi trips of weekday evening.
3.4.2. Van Human Mobility Patterns
Unlike taxi human mobility patterns, in the morning, the number of van inbound trips to Bangkok CBD was higher than the number of outbound trips, as shown in Figure 27. The significant inbound trips were from residential areas of eastern Bangkok, Nonthaburi, western Bangkok, Nakhon Pathom, and Pathum Thani. It is clear that vans are a popular transportation mode for people in the residential area of Nonthaburi. The outbound links reveal that the significant movements were from Bangkok CBD to eastern Bangkok, the government center in Nonthaburi, Nakhon Pathom, and the transport hub in Pathum Thani. For the evening period, the significant outbound destinations were the residential areas in Nonthaburi, eastern Bangkok, western Bangkok, Nakhon Pathom, Pathum Thani, and Samut Sakhon. These morning and evening patterns imply that there is the significant travel demand between the residential areas of both Nonthaburi and eastern Bangkok to Bangkok CBD.
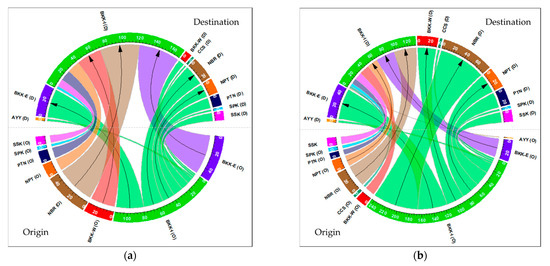
Figure 27.
The human movement between inner Bangkok and other BMR zones (Inner Bangkok or BKK-Inner, East Bangkok or BKK-East, West Bangkok or BKK-West, Nonthaburi or NBR, Pathum Thani or PTN, Samut Prakan or SPK, Samut Sakhon or SSK, Chachoengsao or CCS, Nakhon Pathom or NPT, and Ayutthaya or AYY) by van: (a) Average van trips of weekday morning and (b) Average van trips of weekday evening.
3.4.3. Electric Rail Human Mobility Patterns
Figure 28 illustrates the human mobility of the electric rail mode. Although electric rail was extended to the residential areas in western Bangkok, Nonthaburi, and Samut Prakan, the biggest movement of humans in the morning is from the residential area of eastern Bangkok to Bangkok CBD. In contrast, the most significant outbound movement from Bangkok CBD is to the commercial area of eastern Bangkok. For the evening movement, travel of electric rail passengers showed the opposite relationship to that of the morning. A large number of outbound passengers travel from Bangkok CBD to eastern Bangkok, and vice versa for inbound passengers.
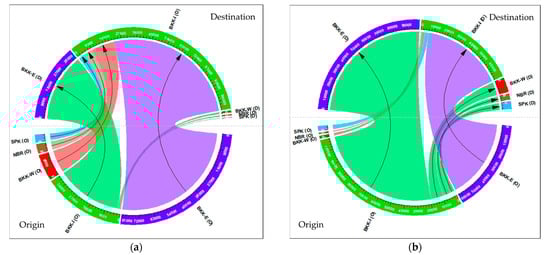
Figure 28.
The human movement between inner Bangkok and other BMR zones zones (Inner Bangkok or BKK-Inner, East Bangkok or BKK-East, West Bangkok or BKK-West, Nonthaburi or NBR, and Samut Prakan or SPK) by electric rail: (a) Average electric rail passengers on weekday morning and (b) Average electric rail passengers on weekday evening.
4. Discussion and Conclusions
Recent studies on human mobility have used multi-source datasets to avoid single-source data bias, and have fused them for better understanding of human mobility [17,19,20]. In this research, we proposed a process of deriving human mobility from the raw data of both non-fixed-route and fixed-route public transport modes. Fixed-route public transport includes vans and electric rail, and taxis operate on non-fixed routes. These three public transport modes have different characteristics and users. The processing steps for each mode were designed differently due to characteristics of the data. The vacant status light of taxis was used to derive OD locations of taxi trips, whereas OD locations of van trips were derived from the stay time, movement duration, and distance. By comparison, the electric rail OD locations were the station locations. The outcome of each mode was the OD matrix. The OD locations were aggregated to TAZ polygons using the spatial relationship between TAZs and their OD locations.
We then focused on the inbound and outbound human mobility between Bangkok CBD and other BMR zones by aggregating TAZ origins and destinations to the BMR level. The inbound movements to Bangkok CBD, in the morning, were mainly from the residential eastern Bangkok area for all three modes. Moreover, taxis and vans also undertook a large number of trips from western Bangkok and Nonthaburi. In contrast, the significant outbound movements from Bangkok CBD were to eastern Bangkok. In addition, western Bangkok and Nonthaburi were also the destinations of taxi and van trips. During the evening period, people traveled to return to their origins. Electric rail carried a high volume of passengers from adjacent zones, particularly the eastern residential area, into Bangkok CBD.
The methodology and techniques of this study can be used to process, transform, and extract human mobility data from multiple sources of public transport big data, which are difficult to understand and access. The data sources in this study were recently collected by government and private organizations, and are highly useful for human mobility analysis. Although data of only three modes (taxi, van, and electric rail) are available in a certain period, the human mobility results are practical and useful for understanding the public transport situation resulting from the integration of these three modes. To enhance the accuracy of BMR human mobility, the completion and availability of data sources is crucial. Currently, the taxi GPS probe open data is regularly collected from one BMR taxi operator, which accounts for about 4% of all registered taxis. If more taxi operators join the open policy, more accurate human mobility can be derived. In the case of van data, at present the Department of Land Transport does not openly provide public access to the van GPS probe data. Therefore, the van data acquisition plan is important to ensure the identical time window to other data sources is used. For electric rail, the available data is the aggregated hourly basis ridership of each OD pair. However, the interchange between electric rail lines cannot be derived because each operator has its own proprietary smartcard system. The Ministry of Transport has a plan to introduce a common ticketing system for all electric rail lines in the future. With this system, the real electric rail ODs can be derived from all electric rail lines. Bus data are commonly used in public transport human mobility research [17,18,19]. Unfortunately, bus data was not available during the current study. Once the data is open and available, the process of human mobility extraction can be designed and added into the procedures. With four public transport modes, BMR human mobility can be assessed more accurately, and be useful for further public transport planning, design, and assessment.
One of the most important issues relating to public transport is the accessibility of the service. Using the study results, inaccessibility to high-demand areas by public mass transit can be identified. The results reveal that the electric rail service does not cover some significant or high-demand origins and destinations. For instance, many taxi trips are taken to and from Suvarnabhumi International Airport, even though ARL operates an electric rail station at the airport. Moreover, the electric rail service is not available at Don Mueang International Airport, which is the most frequent taxi trip origin and destination. Figure 29 illustrates the inaccessibility of the electric rail station service areas and the high-demand areas of taxi and van evening destinations. Due to the lack of electric rail lines to these high-demand origins and destinations, the passengers must use gasoline vehicles, such as taxis. One of the missions in the strategic plan of the Ministry of Transport is to promote electric rail over gasoline vehicles to reduce environmental impact, such as carbon dioxide and PM2.5 emissions. More than 10 electric rail lines in Bangkok and adjacent areas are to be completed by 2029 [5]. These high-demand origins and destinations must be considered for the future electric rail expansion to serve citizens’ actual needs and environmental sustainability.
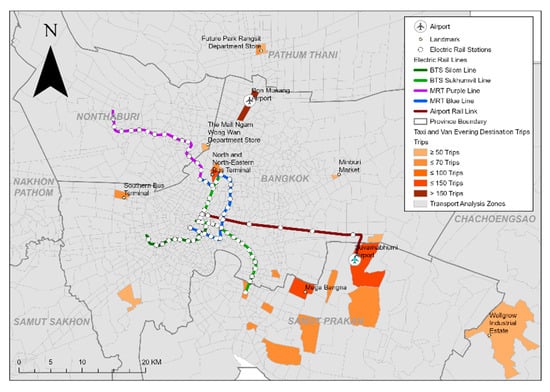
Figure 29.
The taxi and van evening destinations, and the available electric rail service.
Continuous monitoring of human mobility using up-to-date data is essential for sustainable public transport planning and performance assessment that ensures citizens’ quality of life. Using the available multi-source datasets, D. Zhang et al. designed and developed a system architecture for processing the real-time datasets to continuously monitor human mobility [17]. In the current study, up-to-date taxi, van, and electric rail datasets of the real movements of passengers were not available to access. However, human mobility at a certain period can be derived once these datasets are available. Then, a time series of human mobility of public transport in BMR can be regularly created or extracted. More effective assessment of public transport usage and change could be achieved because planners can use the time series data of the real movements of public transport passengers instead of the small sample population from traditional travel surveys.
This research collected the available multi-source datasets of public transport and illustrated the human mobility extraction methodology. These three complementary public transport modes were then fused together to obtain the overall picture of human mobility in BMR. The contributions of this study are as follows:
- The designed procedure of taxi GPS probe big data in Hadoop Hive was used to extract taxi trips.
- A process was designed for van trip creation from van GPS probe data.
- The electric rail AFC data process to derive electric rail trips was developed.
- The human mobility patterns of each public transport mode were derived based on transportation analysis zones (TAZs), and can be used as the OD matrix for transport planning.
- The overall picture of human mobility between Bangkok CBD and BMR zones can be produced from the aggregation of the TAZ level.
- The designed procedure can be applied for the available up-to-date data to extract human mobility. Moreover, this procedure can be applied for other cities in Thailand and other countries.
In future work, the human mobility analysis of the expanding public transport in Bangkok should be regularly analyzed to gain the up-to-date demand or flow of the passengers for a better service. In addition, the public transport service quality should be evaluated in the aspects of frequency, schedules, comfort, safety, personal security, and so on, since evaluating the satisfaction of the public transport service is critical to identify priority areas for future improvements. Moreover, the connectivity or interchangeability among public transport modes (taxi, van, and electric rail) should be studied to reveal their characteristics and relationship. The related detailed tasks include locating multi-modal transport hubs, determining the characteristics of the transport hubs from the surrounding points of interest and populations, and deriving the correlation among fixed and non-fixed public transport modes. These future works would be useful for evaluating service quality, understanding the existing transport hub qualifications, and locating potential future transport hubs.
Author Contributions
Conceptualization, S.S. and S.N.; methodology, S.S., S.N., A.W. and S.P.; software, S.S.; validation, S.N., A.W. and S.P.; formal analysis, S.S.; investigation, S.S., S.N. and A.W.; data curation, S.S., S.N., A.W., and S.P.; writing—original draft preparation, S.S.; writing—review and editing, S.S., S.N. and A.W.; visualization, S.S.; supervision, S.N. All authors have read and agreed to the published version of the manuscript.
Funding
This research received no external funding.
Institutional Review Board Statement
Not applicable.
Informed Consent Statement
Not applicable.
Data Availability Statement
Not applicable.
Acknowledgments
The authors would like to thank all of the organizations that gave permission to use their data, including the Intelligent Traffic Information System Foundation (iTIC), Department of Land Transport (DLT), Bangkok Mass Transit System Public Company (BTS), Bangkok Express and Metro Public Company (BEM), S.R.T Electrified Train Co., Ltd. (SRTET), Office of Transport and Traffic Policy and Planning (OTP), Bangkok Mass Transit Authority (BMTA), and Bangkok Metropolitan Administration (BMA).
Conflicts of Interest
The authors declare no conflict of interest.
References
- Siła-Nowicka, K.; Vandrol, J.; Oshan, T.; Long, J.A.; Demšar, U.; Fotheringham, A.S. Analysis of human mobility patterns from GPS trajectories and contextual information. Int. J. Geogr. Inf. Sci. 2016, 30, 881–906. [Google Scholar] [CrossRef]
- Toole, J.L.; Montjoye, Y.-A.; González, M.C.; Pentland, A.S. Modeling and Understanding Intrinsic Characteristics of Human Mobility. In Social Phenomena: From Data Analysis to Models; Springer: Berlin/Heidelberg, Germany, 2015; pp. 15–35. [Google Scholar] [CrossRef]
- Mellegard, E.; Moritz, S.; Zahoor, M. Origin/Destination-estimation Using Cellular Network Data. In Proceedings of the IEEE 11th International Conference on Data Mining Workshops, Vancouver, BC, Canada, 11 December 2011; pp. 891–896. [Google Scholar] [CrossRef]
- Baek, S.; Lim, Y.; Rhee, S.; Choi, K. Method for estimating population OD matrix based on probe vehicles. KSCE J. Civ. Eng. 2010, 14, 231–235. [Google Scholar] [CrossRef]
- Office of Transport and Traffic Policy and Planning. Development of the Second Blueprint for Bangkok Mass Transit Master Plan (M-MAP2). 2017. Available online: http://www.otp.go.th/uploads/tiny_uploads/PolicyPlan/1-PolicyPlan/M-MAP2/25600629-SmallOTP.pdf (accessed on 14 December 2020).
- TAXI Calculator. Taxis Fares in Comparison with Other Countries. 2020. Available online: https://www.taxi-calculator.com/statistics (accessed on 19 December 2020).
- Siangsuebchart, S.; Ninsawat, S.; Witayangkurn, A.; Pravinvongvuth, S. Assessment of Human Mobility from Taxi GPS Probe Data in Bangkok, Thailand. In Proceedings of the 40th Asian Conference on Remote Sensing (ACRS2019), Daejeon, Korea, 14–18 October 2019; pp. 1–3. [Google Scholar]
- Ranjit, S. Bangkok Taxi Probe’s Big Data Processing for Traffic Hotspot Analysis and Visualization Using the Apache Hadoop Distributed System. In Proceedings of the Asian Transportation Research Society Symposium, Bangkok, Thailand, 22 August 2014. [Google Scholar]
- Zheng, Z.; Rasouli, S.; Timmermans, H. Evaluating the Accuracy of GPS-based Taxi Trajectory Records. Procedia Environ. Sci. 2014, 22, 186–198. [Google Scholar] [CrossRef]
- Peungnumsai, A.; Witayangkurn, A.; Nagai, M.; Miyazaki, H. A Taxi Zoning Analysis Using Large-Scale Probe Data: A Case Study for Metropolitan Bangkok. Rev. Socionetwork Strateg. 2018, 12, 21–45. [Google Scholar] [CrossRef]
- Cui, J.X.; Liu, F.; Janssens, D.; An, S.; Wets, G.; Cools, M. Detecting urban road network accessibility problems using taxi GPS data. J. Transp. Geogr. 2016, 51, 147–157. [Google Scholar] [CrossRef]
- Baghoussi, Y. Mobility and Travel Behaviour Data Collection; FEP: Porto, Portugal, 2016. [Google Scholar]
- Gunathilake, R. Rail Rapid Transit Operational Assessment: A Case Study of the Airport Rail Link, Bangkok, Thailand. Master’s Thesis, Institution is Asian Institute of Technology, Khlong Nueng, Thailand, 2016. [Google Scholar]
- Ma, X.; Liu, C.; Wen, H.; Wang, Y.; Wu, Y.J. Understanding commuting patterns using transit smart card data. J. Transp. Geogr. 2017, 58, 135–145. [Google Scholar] [CrossRef]
- Fadeev, A.; Alhusseini, S. Using Automated Fare Collection System Data to Determine Transport Demand. In Proceedings of the International Conference on Aviamechanical Engineering and Transport (AviaENT 2019), Irkutsk, Russia, 27 May–1 June 2019. [Google Scholar]
- Xia, F.; Wang, J.; Kong, X.; Wang, Z.; Li, J.; Liu, C. Exploring Human Mobility Patterns in Urban Scenarios: A Trajectory Data Perspective. IEEE Commun. Mag. 2018, 56, 142–149. [Google Scholar] [CrossRef]
- Zhang, D.; Huang, J.; Li, Y.; Zhang, F.; Xu, C.; He, T. Exploring human mobility with multi-source data at extremely large metropolitan scales. In Proceedings of the Annual International Conference on Mobile Computing and Networking, MOBICOM, Maui, HI, USA, 7–11 September 2014; pp. 201–212. [Google Scholar] [CrossRef]
- Zhou, J.; Murphy, E.; Long, Y. Commuting efficiency in the Beijing metropolitan area: An exploration combining smartcard and travel survey data. J. Transp. Geogr. 2014, 41, 175–183. [Google Scholar] [CrossRef]
- Jiang, S.; Guan, W.; Zhang, W.; Chen, X.; Yang, L. Human mobility in space from three modes of public transportation. Phys. A Stat. Mech. Appl. 2017, 483, 227–238. [Google Scholar] [CrossRef]
- Long, Y.; Han, H.; Tu, Y.; Shu, X. Evaluating the effectiveness of urban growth boundaries using human mobility and activity records. Cities 2015, 46, 76–84. [Google Scholar] [CrossRef]
- Administrative Strategy Division, Bangkok Metropolitan Administration. Bangkok Statistics 2018: Population Growth Rate in Bangkok, Metropolitan Region, and Thailand from 2008 to 2018. 2018. Available online: http://bangkok.go.th/upload/user/00000130/BMA_STATISTICS%202561/2.Stat_Soc/1.Soc_Pop/Soc_Pop_08.xlsx (accessed on 19 November 2020).
- Office of Transport and Traffic Polity and Planning. Travel Demand of Bangkok Metropolitan Region in 2017. 2018. Available online: http://www.otp.go.th/uploads/tiny_uploads/DataStatistics/2562/25611012-SumData01.pdf (accessed on 13 January 2021).


Publisher’s Note: MDPI stays neutral with regard to jurisdictional claims in published maps and institutional affiliations. |
© 2021 by the authors. Licensee MDPI, Basel, Switzerland. This article is an open access article distributed under the terms and conditions of the Creative Commons Attribution (CC BY) license (http://creativecommons.org/licenses/by/4.0/).