1. Introduction
Globally, increased congestion and urban space required by car traffic, together with transport emissions have resulted in the need and objective to reduce the number of vehicles on the road, i.e., reduce vehicle mileage and the modal share of passenger cars. Research on transitions in energy and mobility sectors have found that the dominance of unsustainable technologies has been very stable despite a lot of innovation activities [
1]. Banister [
2] questioned the underlying principles of conventional transport planning and highlighted the need for a new sustainable mobility paradigm. More than a decade later, Bertolini [
3] and Khalaj et al. [
4] found that a paradigm shift has not yet taken place, but a radical approach may be needed soon due to climate change. Both Banister [
2] and Khalaj et al. [
4] raise the issue of public acceptability as a necessary condition for change. Efforts to promote sustainable mobility must be tailored to individuals’ values to increase acceptance and be effective [
5]. As car ownership has a great influence on car use and mobility patterns [
6], people’s car ownership and preparedness to use alternative modes of transport are essential factors in terms of the sustainability objectives. Generally speaking, car ownership and car use per capita have increased steadily, but many Western countries have also exhibited signs of a decreasing trend in the 2000s, leading to the so-called Peak car theory [
7].
In the future digitalisation and automation can for their part impact the need to own a car significantly. Digitalisation has ushered in the creation of new transport services and even an entirely new way of thinking about mobility. Digitalisation enables the offering of comprehensive mobility services, e.g., as in the concept of Mobility as a Service, MaaS. The driving force behind MaaS is the seamless combination of modes of transport to offer customers a comprehensive service. MaaS has potential to become a significant part of the transport system of the future [
8].
Automation, in turn, will enable the development of driverless cars. Automated cars may influence people’s travel behaviour and need to own a car significantly [
9]. This study focuses on vehicles of high-level automation, or automation levels 4 and 5 (SAE [
10] standard J3016), that are able to move without a driver, at least in some environments. On a general level, cars of a high automation level can be divided into private automated vehicles (PAV) and shared automated vehicles (SAV).
The purpose of this study is to examine how car ownership has changed and how it may change in the future. This study focuses on three factors in particular: the effects of public transport, MaaS and automated vehicles provision on people’s willingness and need to own a car. As shown in the literature review below, there is a clear research gap in this area, especially related to the user perspective. For the time being, there is a limited amount of research on the effects of public transport, MaaS, and AV provision on the future of car ownership, especially from the user perspective. Going forward, transport automation and developed mobility services may, however, have a significant impact on car ownership. Previous studies have approached the subject from various angles, but a comprehensive survey representative of the whole population has not been conducted, and we do not know how ready people are to forgo car ownership. The purpose of this study is to fill the research gap on future car ownership as different mobility services, e.g., in the form of MaaS, and high-level automated vehicles are expected to become more commonplace. The study is implemented as two surveys with representative samples of the population, which has not been done previously in this context.
The primary goal of the study is to determine whether people are ready to forgo car ownership in the future. The following secondary research questions also address the goal of the study:
What kind of changes have occurred in car ownership?
How does the service level of public transport affect car ownership?
How can MaaS affect car ownership in the future?
How can automated vehicles affect car ownership in the future?
What are the differences between population groups in terms of willingness to own a car in the future?
Next, the findings from previous studies regarding car ownership and especially the effects of public transport, MaaS and automated vehicles on car ownership will be discussed. Thereafter,
Section 3 describes the methods and data of this study, and
Section 4 presents the results.
Section 5 and
Section 6 present the discussion and conclusions, respectively.
2. Literature Review
In order to highlight the research gap mentioned above, we first analyse the current situation of car ownership in various countries based on literature and in Finland based on statistics. Then we look into the existing literature on the effects of public transport and MaaS as well as automated vehicles on car ownership.
2.1. Current Situation Analysis
Previous research has highlighted several factors that decrease people’s willingness to own a car. Zong et al. [
11] give urbanisation, the increased prevalence of available competing modes of transport, the general increased unpopularity of cars among young people and concerns about climate change as examples of these factors. Factors related to life situation, such as living alone and childlessness, have a reducing impact on car ownership and on having a driving licence [
11].
Some Western European countries, like the UK, the Netherlands, Sweden and Italy, have already seen the peak car use during the first five years of the millennium, resulting to a decline of car use after that point [
12] and in the United States the growth halted in 2000 [
13]. However, there is evidence of a continuing increase of total vehicle kilometres again after 2009 is the USA [
14]. In addition to this, many other developed countries, such as Germany, France, Norway, the UK and Japan show a clear stabilisation in annual kilometres driven, and the change in car use has been particularly apparent in the 20–29 age group [
13].
Getting a driving licence as a young person has also become less common, especially in larger cities in Finland [
15] and Sweden [
16], for example. Brandt & Lindeqvist [
10] proposed that the reasons mentioned earlier would also apply to not having a driving licence, while observing that going to work and having a family were factors that contributed to the acquisition of a driving licence. Similar trends in terms of car ownership can also be observed in the UK, where the increase in the number of cars in proportion to the population has slowed down and started to decline in London, for example [
17].
In Finland, the number of passenger cars in proportion to the population has increased continuously for the last few decades, albeit the growth has slowed down and stabilised in recent years. Finland is one of the most motorized countries in Europe in terms of registered cars per population [
18], which relates e.g., to the low population density and long distances in Finland. In Helsinki, the capital of Finland, the number of cars per capita has, however, started to decline in the past few years. The development of the passenger car stock in relation to population in Helsinki and elsewhere in Finland is illustrated in
Figure 1. In the figure, the decline in the early 1990s is due to the economic recession, and the clear decrease in 2007 can be accounted for by the change in the manner of compiling statistics. After 2008, the global financial crisis led to an economic downturn in Finland, too, and is reflected in the development of the car stock. In 2018, there were 629 passenger cars registered per 1000 inhabitants in 2018 Finland, which can be compared to e.g., 567 and 516 in Germany and Norway, respectively [
18]. However, there were only 493 cars in traffic use per 1000 people in the end of 2018 in Finland [
19,
20]. The difference to the registered cars is due to cars, which have been decommissioned, but not officially deregistered from the car stock data.
As shown in
Figure 1, motorization is clearly at a lower level in Helsinki when compared to the rest of Finland. The same is visible e.g., in Stockholm, Sweden, where there were 366 cars per 1000 inhabitants in 2019, and in London, UK, where were 302 cars per 1000 inhabitants in 2017, compared to 473 and 471 cars per 1000 inhabitants for whole Sweden and the UK, respectively [
22,
23,
24,
25].
In Finland, car ownership varies greatly depending on gender, age and residential location.
Table 1 illustrates the number of cars in traffic per 1000 people in different age groups and areas classified by urban-rural classification in Finland. Urban-rural classification is a seven-level classification created by Finnish Environment Institute [
26]. For study purposes, the original seven-level classification was regrouped into three categories, namely (I) densely populated urban area (inner city and outer city areas in the original classification), (II) sparsely populated urban area (exurbs, local rural centres areas, and countryside near cities), and (III) sparsely populated rural area (rural heartland and sparsely populated countryside). It should be noted, however, that there are some uncertainties in this data in terms of age and gender. An important bias caused by the data is that the car is registered to one person in the family, but it may be also and even mostly used by other persons.
According to
Table 1, car ownership is most prevalent among the 35–64-year-olds and especially in sparsely populated areas. In terms of location, the differences are significant between densely populated urban areas and other areas, but the differences between sparsely populated urban areas and sparsely populated rural areas are small. Car ownership in proportion to the population is most prevalent in rural areas and at the fringes of urban areas. Car usage (passenger mileage) in these areas is also greater compared to urban areas [
28].
When examining car ownership, it is essential to notice the difference between households with no cars and households having fewer cars than adults. In the first group, car access cannot be assumed, but in the latter group, it is likely that all household adults have the possibility of using a car as about 82% of Finns aged 18 or older had a driving licence for passenger cars in the beginning of year 2020 [
29,
30]. According to Statistics Finland [
31], 73% of Finnish households owned a car in 2016. In the Helsinki metropolitan area, approximately 64% of households own at least one car, whereas up to 83% of households own a car in the rest of Finland. It should also be noted that the average size of households in Finland is on the decline [
32], and the number of households increases each year as there are more and more single-person households.
2.2. Effects of Public Transport and MaaS on Car Ownership
In addition to different behaviour of different age groups, the residential district and availability of public transport have been shown to have a significant impact on car ownership and use. Indeed, car usage is less prevalent in urban areas compared to rural areas [
7,
33]. Various studies have seen the level of service of public transport as a factor in reducing car ownership, but the estimates given for the scale of the impact vary. Studies show, for example, that the accessibility of the workplace by public transport [
34] and the general level of service of public transport [
35] reduce car ownership. According to Klein & Smart [
36], geographical location and the accessibility of public transport only play a small role in terms of car ownership among young people. Yagi & Managi [
37] also found that public transport only has a minor impact on car ownership. According to Lee & Senior [
38], public transport availability does not necessarily reduce the share of households owning a car, but it may eliminate the need to acquire multiple cars. It should also be noted that car ownership does not necessarily correlate directly with car usage [
37]. It may be that the availability of public transport makes these residential areas more tempting for people without cars to move in, thus creating areas with less car ownership [
39].
Mobility as a Service (MaaS) can be defined as a concept by which individual’s mobility needs can be fulfilled effectively by integrating different mobility services to seamless trips [
40]. With MaaS, fulfilling daily mobility needs does not require owning a car or a bike. Kamargianni et al. [
41] studied the potential of MaaS in London and found that MaaS can impact the behaviour of both car-owners and non-car-owners. On one hand, 33% of car-owners in London agreed that MaaS would help them depend less on their cars and a quarter of car-owners would even be willing to give up their cars for unlimited access to car sharing for the next couple of years. On the other hand, 36% of non-car-owning participants stated that their car purchasing would be delayed and 40% stated that they would not purchase a car at all if there would be a MaaS offering available. Based on research by Kamargianni et al., there clearly is demand for MaaS in London, and MaaS also shows potential in reducing the need to own a car. [
41] Evidently, MaaS may impact both car ownership behaviour and car owners’ car usage.
Storme et al. [
42] studied if people could replace or significantly reduce their car use in return for a monthly mobility budget which they could spend on MaaS. Even though the participants, a hundred car-owning Ghent University employees, were highly motivated to reduce car use, they faced considerable difficulties in bypassing their personal car, especially for leisure trips. Based on the findings, MaaS mainly complements car ownership and car use [
42].
Currently, there is very little scientific research on the effects of MaaS on car ownership. When developing the MaaS model, the subject of reducing car ownership and the potential which MaaS has in reducing car traffic are often brought up. Indeed, many companies operating in the field of MaaS have said that their objective is to develop the services so that private car ownership and usage can be reduced (see e.g., [
43]). Based on a MaaS conference held in Finland in 2019, many researchers also expect MaaS to have a decreasing effect on car ownership (e.g., [
44,
45,
46,
47]).
2.3. Effects of AVs on Car Ownership
According to Litman [
48], the costs per kilometre of shared AVs will be significantly less than regular human-operated taxis or ride-hailing services (e.g., Lyft and Uber). Therefore, SAVs will probably decrease households’ need to own cars. Sessa et al. [
49], in turn, reported results from a workshop in which most of the experts estimated that car ownership will decrease somewhat (10–30%) as a result of automated vehicles. However, the same experts also noted that if the shared use of automated vehicles becomes commonplace, car ownership may reduce significantly more.
Simulations done in several studies (e.g., [
50,
51,
52]) show that current transport performance (passenger kilometres) could be attained with as much as 90% less cars in larger cities, if all vehicles were SAVs. A roughly similar estimate has also been obtained in a simulation done in the Helsinki metropolitan area in Finland [
53]. This would unlock a significant business potential around shared automated vehicles, which in turn would enable households to forgo car ownership, as the costs could be lower in comparison to private car ownership. According to Zhang et al. [
54], approximately 18% of the households in the greater Atlanta area in the United States could reduce the number of cars owned by households as a result of privately-owned automated cars, without changing any of the mobility habits of the households. This would translate to a 9.5% reduction in the car stock in the area in question.
Pofuk [
55] found that 84% of a sample of one hundred people could start using an automated vehicle. Of these people, 71% would rather use a SAV than own one themselves. On the other hand, according to a study by Bansal et al. [
56], only 13% of respondents (N = 347) in Austin, US, would forgo car ownership, if the costs of shared automated vehicles were
$1/mile. According to Zhang et al. [
54], there is still significant opposition to SAVs and a large proportion of people may, at least in the coming years, prefer PAVs.
Menon’s [
57] research (N = 1214) determined how likely it was for respondents to forgo one of the cars of the household, if a SAV were available (in other words reducing their household vehicle ownership level by one). More than half of the respondents found it very unlikely or unlikely. Roughly a fifth of the respondents were unable to say, roughly a fifth of the respondents thought that forgoing a vehicle was likely and only approximately 7% of the respondents thought it very likely that they might forgo a car in this scenario.
A study by Lavieri et al. [
58] focused on the differences between different population groups in terms of SAVs and PAVs. Respondents aged 18–24 were less interested in owning an automated vehicle than older respondents. Men were more interested in both SAVs and PAVs than women, but educational background, for example, was not a statistically significant factor in terms of the responses. As expected, those living in densely populated areas, owning fewer cars or with previous experience of shared vehicle services were more interested than others in using SAVs.
3. Methods and Data
The study utilises data from two comprehensive questionnaire surveys in Finland. The first survey in 2017 charted the opinions of Finns aged 18–64 on road traffic automation. The sample of the study was 10,000 Finns. A total of 2036 respondents participated in the survey, resulting to a total response rate of 20.4%. The second survey in 2018 charted the opinions of Finns aged 18–64 on mobility services and MaaS. The sample of this study was 6000 Finns. A total of 1176 respondents responded to the survey, making the response rate 19.6%. The sample was limited to people aged 18 or older as the standard age of acquiring a driving license in Finland is 18. The people aged 65 or older were excluded from the survey sample as this is a typical age for retiring and thus the mobility patterns within the population aged 18–64 are more alike. In both surveys the sample group for the survey was randomly selected from the population register by age and gender group in proportion to the population’s age and gender distribution. The sample was provided by Population Register Centre of Finland per procuration. In the study, Finnish legislation, good academic practices and the terms and conditions of the Centre regarding the sample were followed. In both surveys all people, who were selected for the sample, were sent a postal questionnaire with a cover letter. Responding was possible either on the internet with an identification code or by sending the filled questionnaire back by mail (postage paid).
The questionnaire forms used in the survey and the instructions, background information and definitions given to the respondents in the accompanying letter can be found in
Appendix A and
Appendix B, translated from the original survey language of Finnish into English. Both questionnaires were piloted with a small number of respondents representing different socio-economic groups. In the pilot survey, the survey questions were found to be understandable and thus the actual questionnaires had the same format and questions as in the pilot study.
This study utilises three of the questions and the respondents’ background information from the two surveys. We look at questions 11a and 11c from the MaaS questionnaire and at question 10 from the AV questionnaire. The questions were answered with either yes or no and posed as follows:
(MaaS questionnaire, question 11a) Would you want or need to own a private car, if public transport connections were good enough to fulfil your daily mobility needs?
(MaaS questionnaire, question 11c) Would you want or need to own a private car, if the annual cost of the mobility service (incl. e.g., public transport, shared taxis and shared cars) was significantly lower than your own car and you could fulfil all your mobility needs with it?
(AV questionnaire, question 10) Assume that all vehicles on the road are automated vehicles. Would you want/need to own a private automated vehicle, if an automated taxi (SAV) would always be available within 5 min and the annual costs of automated taxis would be about 20% lower than the costs of private automated vehicle?
In the AV question, the 20% cost reduction is similar to the cost comparison of AV taxis and AVs presented by Litman [
48]. It should be noted, however, that there are still great variation and large range on the cost level assumptions of AVs and therefore, this is only an estimate implemented for study purposes.
In the results section, we refer to these three above mentioned questions with the titles public transport, MaaS, and automated vehicles, respectively. It is worth to note that even if we refer to MaaS here in this study, the term MaaS was not used in the survey question as it is not generally familiar to an average person in Finland as only 21% of the respondents had heard or read about the concept of MaaS. Other questions of the surveys have been reported in previously published articles [
59,
60,
61].
The survey results are analysed using IBM SPSS software. This study utilises a logistic regression analysis and cross-tabulations that are used to examine which variables impact the distribution of the responses and how. In order to analyse, how respondents’ different background information affects the response distribution and what types of differences the various population groups have in terms of willingness to own a car in the hypothetical scenarios, logistic regression model was created using the Stepwise Forward LR method. Logistic regression analysis can be used to analyze how different variables affect to the binary choice (in this study whether the respondent want to own a car or not). Logistic regression model takes into account dependencies between explanatory variables and therefore, the model gives a more accurate perspective of the phenomenon than cross-tabulation. In this study, logistic regression model was used to better understand which variables affected the responses and how strongly. In Stepwise Forward LR method, the variables are accepted to the model based on the significance of the score statistics. Variables are added to the model one at a time and the variable to be added is the one that increases the explanatory power of the model the most. New variables are added to the model as long as the new variables statistically significantly improves the explanatory power of the model.
The variables tested for the logistic regression model were:
age (continuous),
gender (dummy),
location of residence (dummy, see explanatory text below),
number of cars in the household (0, 1, 2, 3 and 4 or more),
respondent’s use of a car in kilometres driven (see explanatory text on scales below),
education level (primary school, high school, bachelor’s degree, master’s degree),
use of public transport (dummy, see explanatory text below),
driving licence (dummy) and
gross income of the household (available only in the MaaS survey on a scale of less than €2000/mo.; €2000–4000/mo.; €4000–6000/mo.; and over €6000/mo.).
The location of residence has been processed as a dummy variable in logistic regression models: densely populated urban area versus other areas. The urban-rural classification was described in
Section 2.1. The research data originate from two separate questionnaires, which is why the following determining variables in logistic regression models have some differences. In the AV survey,
kilometres driven have been determined based on how many kilometres the respondent estimated they drive in their car per year on the following scale: 0 km; less than 5000 km; 5000–10,000 km; 10,001–20,000 km; 20,001–30,000 km; and more than 30,000 km. In the MaaS survey, the respondent estimated their performance either as a passenger or driver on a scale of 0 km; less than 10,000 km; 10,000–25,000 km; and more than 25,000 km. In the AV survey, the
use of public transport has been determined based on whether the respondent uses public transport at least once a month. In the MaaS survey, the definition relies on the use of local public transport (on a scale of no use, minor use, weekly use, nearly daily use), which is then coded to make a dummy variable (no use—at least minor use) in logistic regression models.
4. Results
The sample size, number of respondents and response rate by age group and gender for both surveys are presented in
Table 2 and
Table 3.
The results of the surveys can be expanded to apply to all Finns aged 18–64 with the help of expansion factors. In order to expand the results to cover each age and gender group, expansion factors are created to calculate how many of the respondents’ peers in the age and gender group a single respondent corresponds to. This allows for the results to be viewed as representing the entire population.
Table 4 presents the results of the three key questions on car ownership from the two surveys (MaaS and AV) described in previous section. The table presents the results (share of no-responses, i.e., indicating no will or need for car ownership) expanded to the whole Finnish population aged 18–64 as well as the results in the sample without considering the expansion factors.
As can be seen from
Table 4, expanding the sample to represent the entire population only has a minor effect on the response distribution. The values calculated using the expanded sample can be considered to represent the entire population (Finns aged 18–64), meaning that the results can be generalised to be representative of Finns. As
Table 4 shows, 39% of the Finns aged 18–64 would not want or need to own a car if public transport connections were good enough. Correspondingly 58% of the Finns would not feel the need to own a car if the described mobility service was available and 65% of the Finns would not feel the need to own a PAV in the future, when all vehicles in traffic are automated.
Next, it is examined how respondents’ different background information affects the response distribution and what types of differences the various population groups have in terms of willingness to own a car in the hypothetical scenarios. During the examination, each question receives an individual logistic regression model that can be used to determine which different background data affect the responses and how.
Table 5,
Table 6 and
Table 7 illustrate the logistic regression models for each of the variables affecting the three discussed questions.
Table 5 illustrates the logistic regression model related to the effects of good enough public transport connections to fulfil daily mobility needs on willingness or need for car ownership. According to the table, gender, number of cars in the household, annual kilometres driven, education level and having a driving licence impacted the willingness or need to own a car if public transport connections were sufficient to meet the respondent’s mobility needs. According to the model, women, people with fewer private cars, people who use cars less, highly educated people and those without a driving licence are less willing to own a car than others in this hypothetical scenario. The model’s coefficient of determination (R
2 = 0.28) is relatively small, which is why the model does not work very well, i.e., the selected variables only account for some of the differences in the responses.
A logistic regression model related to the effects of a high quality and low-cost MaaS offering on the willingness or need for car ownership is presented in
Table 6. According to the table, age, gender, number of cars in the household, annual kilometres driven, level of education and household income affect the willingness to own a car, if mobility services could fulfil all mobility needs and the annual costs of the service were significantly lower than those of owning and using a private car. According to the model, younger people, women, people with fewer private cars, people who drive less, highly educated people and those with a higher income have less of a need to own a car than others in a situation where they could fulfil all their mobility needs with a MaaS solution. The model’s coefficient of determination (R
2 = 0.15) is small, meaning that the variables selected only account for some of the differences in the responses.
The logistic regression model related to the effects of automated vehicles availability on the willingness or need for car ownership is given in
Table 7. According to the table, age, gender, number of cars in the household, annual kilometres driven, level of education and use of public transport will affect willingness to own a car in the future, when all cars are automated. According to the model, older people, women, people with fewer private cars, people who drive less per year, highly educated people and those who currently use public transport have less of a need to own a car than others in a hypothetical scenario where SAVs would offer high level of service. The coefficient of determination of the model is very small (R
2 = 0.09), which is why the model cannot be considered good. The selected variables only account for some of the differences in the response distribution.
Next, cross-tabulation of all variables affecting the willingness to own a car in the three discussed questions are presented in order to illustrate the results and the differences. Based on the logistic regression models, the following variables seemed statistically significant in terms of the response distribution in at least one question: use of public transport, having a driving licence, age, gender, number of cars in the household, use of cars, level of education and household income. The only variable to not have a statistically significant effect on the responses in the logistic regression models was the location dummy variable. There are, however, minor differences in the results based on location of residence, which is why these values are also given in the cross-tabulations. The cross-tabulations are presented in
Table 8. For example, 49.7% of women and 27.6% of men would not want or need to own a car if public transport connections were good enough. The table also illustrates the response alternatives and the differences between the questionnaires utilised in some of the questions. In the cross-tabulations, some of the variables coded into dummy variables for the logistic regression model have been presented in accordance with the original scale.
As illustrated in
Table 8, there were differences in the response options related to the use of private cars and use of public transport between the two surveys and household income was gathered only in the MaaS survey. All of the cross-tabulations in the table are statistically significant based on the Chi square test, even though according to the logistic regression model, some of the variables (marked with
1 in
Table 8) do not affect the response distribution in a statistically significant way.
5. Discussion
Transport automation and developed mobility services may have a significant impact on car ownership. Previous studies have approached the subject from various angles, but a comprehensive survey representative of the whole population has not been conducted, and we do not know how ready people are to forgo car ownership. The purpose of this study was to fill this research gap.
5.1. Public Transport, MaaS and Car Ownership
Based on the results, approximately 39% of Finns would not feel the need or desire to own a car in the future, if public transport connections were sufficient to meet all their mobility needs. However, if people would be able to use a high quality and low-cost MaaS offering, approximately 58% of Finns would not feel the need or want to own a car. It can be concluded that public transport alone will not be enough for many, but combined with other mobility services, the service becomes more attractive and, respectively, people’s willingness and need to own a car is reduced slightly.
In terms of public transport, the results of this survey are fairly well in line with actual choices people make. According to the literature review, we found that 73% of Finnish households own at least one car [
31]. Nonetheless, in the metropolitan area only approximately 64% of households own a car. Given that location does not have a great impact on the professed willingness or need to own a car, it can be stated that the results of this study are in keeping with actual choices in terms of scale.
The literature did not provide comparable data on MaaS concerning car ownership. Based on the literature, MaaS is considered to have significant potential in reducing car ownership (see
Section 2.2). The results of this study also support this assumption, because when MaaS serving all mobility needs would be available, people would feel significantly less of a will or need to own a car compared to only having sufficient public transport connections. The interpretation of the results is, however, hindered by the fact that the content of the mobility service was not specified in more detail in this study, meaning that we cannot know what type of MaaS offering people were thinking of when they responded to this survey. Even though public transport is generally thought to be at the core of MaaS, the respondents may have envisioned themselves primarily using other mobility services than public transport as part of the MaaS offering.
Furthermore, it was not defined, how much lower the annual cost of the mobility service was, because people’s willingness to pay for MaaS was studied with other questions of the survey. Currently, people’s awareness of MaaS as a concept is still low and people are not willing to pay very much for MaaS on average (e.g., only 64% of the respondents’ current mobility costs [
59,
62]), which means that MaaS should generate significant economic benefits for people to want to adopt it.
5.2. Automated Vehicles and Car Ownership
When it comes to automated vehicles, 65% of Finns would not feel the need to own a car in the future, if all cars were automated, as long as the level of service were high in shared vehicles (available within 5 min as presented in this survey) and using them generated significant financial savings (annual costs 20% less in this survey) compared to owning a car. It should be noted, however, that in case of automated vehicles, the lower car ownership does not necessarily mean lower use of passenger cars, if the shared automated vehicles will be used as the private cars are used nowadays or the higher comfort and improved quality lead to higher use of passenger cars as Pakusch et al. and Palevicius et al. [
63,
64] suggest.
Some research on the impact of automated vehicles on car ownership exists in the literature. However, the research frames of the studies differ from each other slightly, making them difficult to compare. This study came to examine a situation where all cars are automated, i.e., the choice is made between SAV and PAV. This was done because people have very different attitudes towards automated vehicles and many people have prejudices against automated vehicles [
60]. This allows for more precise information to be gained on people’s willingness to own a car, when the choice is made purely based on willingness to own a car and not based on a willingness to adopt new technology. A somewhat similar research frame comparing the attraction of PAV and SAV can be found in Pofuk’s [
55] study, in which 84% of a sample of one hundred people could start using an automated vehicle, and of those, 71% would rather start using a SAV than an automated vehicle of their own. Even though the sample in Pofuk’s study is rather small, the results are similar with this study. Other studies tended to compare the use of automated vehicles to the use of the respondent’s own current car, making the interest in shared use significantly lower. These studies do not, however, observe the fact that people have no real way of comparing these alternatives, as automated cars have not entered the market. This allows prejudices and attitudes to impact responses to a great degree.
5.3. Effects of Individual, Household and Area Characteristics on Car Ownership
The background information of the respondents had a minor impact on the attitudes towards owning a car. The most pronounced differences in the response distribution in terms of percentages were caused by current mobility preferences and related features, i.e., the number of cars in the household, having a driving licence, private car travel performance and use of public transport. There were also clear distinctions between genders as women felt significantly less of a will or need to own a car than men in all questions analysed. In terms of age groups, the differences were less pronounced, but we can observe that younger people felt less of a will or need to own a car than older respondents. The results are similar to the literature review, which found that today, generally speaking, younger people and women own fewer cars and use private cars less than men [
6,
15,
16]. Interestingly, we also noted that 15–23% of respondents without a car in a household nowadays would want or need to own a car in future in the three hypothetical scenarios. Most of these respondents are young, indicating that they might have a desire to own a car, even though they have not yet acquired one.
When it comes to education level, highly educated people felt slightly less of a will or need to own a car, whereas those who earned more money were more eager to own a car. The former relates to higher awareness and interest towards MaaS and AVs among the ones with a higher education [
59,
60], whereas the latter is partly explained by people with higher income also having higher travel performance and owning cars more frequently [
6].
Even though location of residence has a significant impact on car ownership today (e.g., [
28]), current residential location did not play a major role in people’s attitudes towards future car ownership. According to the logistic regression models, location of residence had no effect on the responses, but based on the cross-tabulations, respondents in more densely populated areas felt slightly less of a need to own a car. It is worth noting, however, that in general, the differences between the different variables were quite small and the coefficients of determination of the logistic regression models were low (public transport R
2 = 0.28, MaaS R
2 = 0.15 and AV R
2 = 0.09).
Low coefficiency of determination of the regression models related to car ownership are not unique to this study. Clark [
65] noted that global estimates on income and spatial context are unlikely to predict local changes in car ownership well. Klein & Smart [
36] found that the geographical location and the accessibility of public transport only play a small role in terms of car ownership of young people. Oakil et al. [
66] had low model fits (R
2 between 0.09 and 0.37) and note that research should focus on the interplay between demographic transitions, residential choices and mobility patterns. Furthermore, Clark et al. [
67] note that the variation in car ownership is partly explained by household income and spatial context but the low model fit (R
2 = 0.34) imply that other factors, such as life-style preferences or attitudes have an important role. We have already identified many trends that decrease car ownership, such as increasingly eco-friendly thought, less interest in car ownership among younger generations, population aging and the smaller size of future households. (e.g., [
11,
13,
15,
16]). Hence, it is not surprising that the models concerning hypothetical future mobility services (MaaS and AVs) as alternatives to car ownership resulted in low coefficiencies of determination as respondents’ individual attitudes towards new technology have an important role in their answers.
6. Conclusions
This study examined people’s willingness to own a car in terms of three different phenomena possibly affecting future car ownership. The survey questionnaires were implemented on a comprehensive sample representative of the population, which had not been done in previous research. According to the study, new mobility services can decrease people’s willingness to own a car significantly, given that the services cover people’s mobility needs and provide economic benefits. In terms of public transport, the results seem to be in line with people’s actual choices, meaning that in areas with comprehensive public transport connections, households’ car ownership corresponds to the survey responses at present. Respondents who do not currently own or use a car, feel less of a need to acquire or will to use cars in future than others. However, 15–23% of these respondents would want to own a car in future in all scenarios. Correspondingly, respondents who use public transport frequently feel less of a will or need to own a car than others. Generally, women and younger people feel less of a will or need to own a car, but factors such as educational level and residential location seem to have a relatively low effect on the willingness to own a car.
As implications for transport policy, mobility services open new possibilities for urban development and enable decreasing the amount of parking space, if the availability and sufficient coverage of mobility services meeting the user needs can be guaranteed. If affecting car ownership is seen as a tool to influence car use and strive for more sustainable mobility, policies should acknowledge the potential which is embedded with high level of service in public transport, competitive MaaS solutions and shared autonomous vehicles, while also considering the social, economic, technical and regulatory aspects (see e.g., [
68,
69,
70]). The visions of MaaS focus on the possibility to offer seamless and effortless, instant accessibility that is smarter, faster and greener than using a private car [
71]. The possibility to offer better freedom of mobility through MaaS is largely dependent on the cities offering high quality public transport services that are the backbone of MaaS [
72]. By promoting public transport use, sustainability gains are likely, but sustainability of public transport is also somewhat questionable in areas where and when demand is low. Transport planning policies must still promote complementary modes such as walking, cycling and public transport so that the sustainable outcome can be achieved [
71]. The alternatives for car ownership and use should also be priced attractively and offer a service level competitive with car use. This could be achieved e.g., with different types of incentives for the new services as well as taxing and collecting fees for car ownership and use.
The study also highlighted several themes for further research. In the future, we should determine the opportunities different areas have of offering various and comprehensive mobility services in more detail, allowing us to assess the need to own a car and potential for reducing the number of cars by area. On the other hand, people over the age of 65 were excluded from this study, and their will and need to own a car should be gauged. Future car ownership should also be examined from the point of view of households, as this study focused on individuals. Besides giving up vehicle ownership entirely, the potential of reducing the number of households’ vehicles should be studied. Additionally, as this study approached both the willingness and need for car ownership simultaneously in the questionnaires, future studies should seek on further understanding on both of these issues separately as these might differ among population, and this could be one important aspect in seeking to affect car ownership e.g., with sustainability-driven transport policies.
Concerning the reliability of the results, the extensive samples used in the study to represent the population increase the reliability of the results. The response rate for both studies was approximately 20%, which is rather low, making the results somewhat less reliable in terms of generalisation, although the response rates are similar to other surveys conducted in Finland [
73]. However, a significant source of uncertainty is found in the definitions of mobility services and automated vehicles within the study. In the questions, it was assumed that alternative means of mobility could meet all of the respondent’s mobility needs and do so with lower costs than car ownership, which is not plausible for many respondents, because the services cannot be offered cost-efficiently in areas with a low population density. Indeed, this study focuses more on the respondents’ attitudes towards future car ownership and not on how car ownership is actually going to change. The survey utilised imaginary choices (stated preferences), that do not always reflect respondents’ actual choices [
74], which also contributes to the uncertainties of the study. If the intention would be to forecast actual changes in car ownership, the operating prerequisites of the services must be assessed separately in different areas. Finally, even though Finland is culturally much like other European countries, costs related to owning and using a passenger car are relatively high in Finland compared to many other Western countries [
75]. This may affect people’s willingness to own a car to some extent, but the findings of this results can be considered relatively applicable to other developed countries and to Europe in particular.
Author Contributions
Conceptualization, T.L. and H.L.; methodology, T.L.; software, T.L.; validation, T.L., H.L., M.P. and R.V.; formal analysis, T.L.; investigation, T.L.; resources, H.L.; data curation, T.L.; writing—original draft preparation, T.L.; writing—review and editing, T.L., H.L., M.P. and R.V.; visualization, T.L.; supervision, H.L.; project administration, T.L.; funding acquisition, H.L. All authors have read and agreed to the published version of the manuscript.
Funding
This work was supported by the Kone Foundation (grant number b4b919).
Institutional Review Board Statement
Not applicable.
Informed Consent Statement
Informed consent was obtained from all subjects involved in the study.
Data Availability Statement
Data available upon request.
Conflicts of Interest
The authors declare no conflict of interest. The funders had no role in the design of the study; in the collection, analyses, or interpretation of data; in the writing of the manuscript, or in the decision to publish the results.
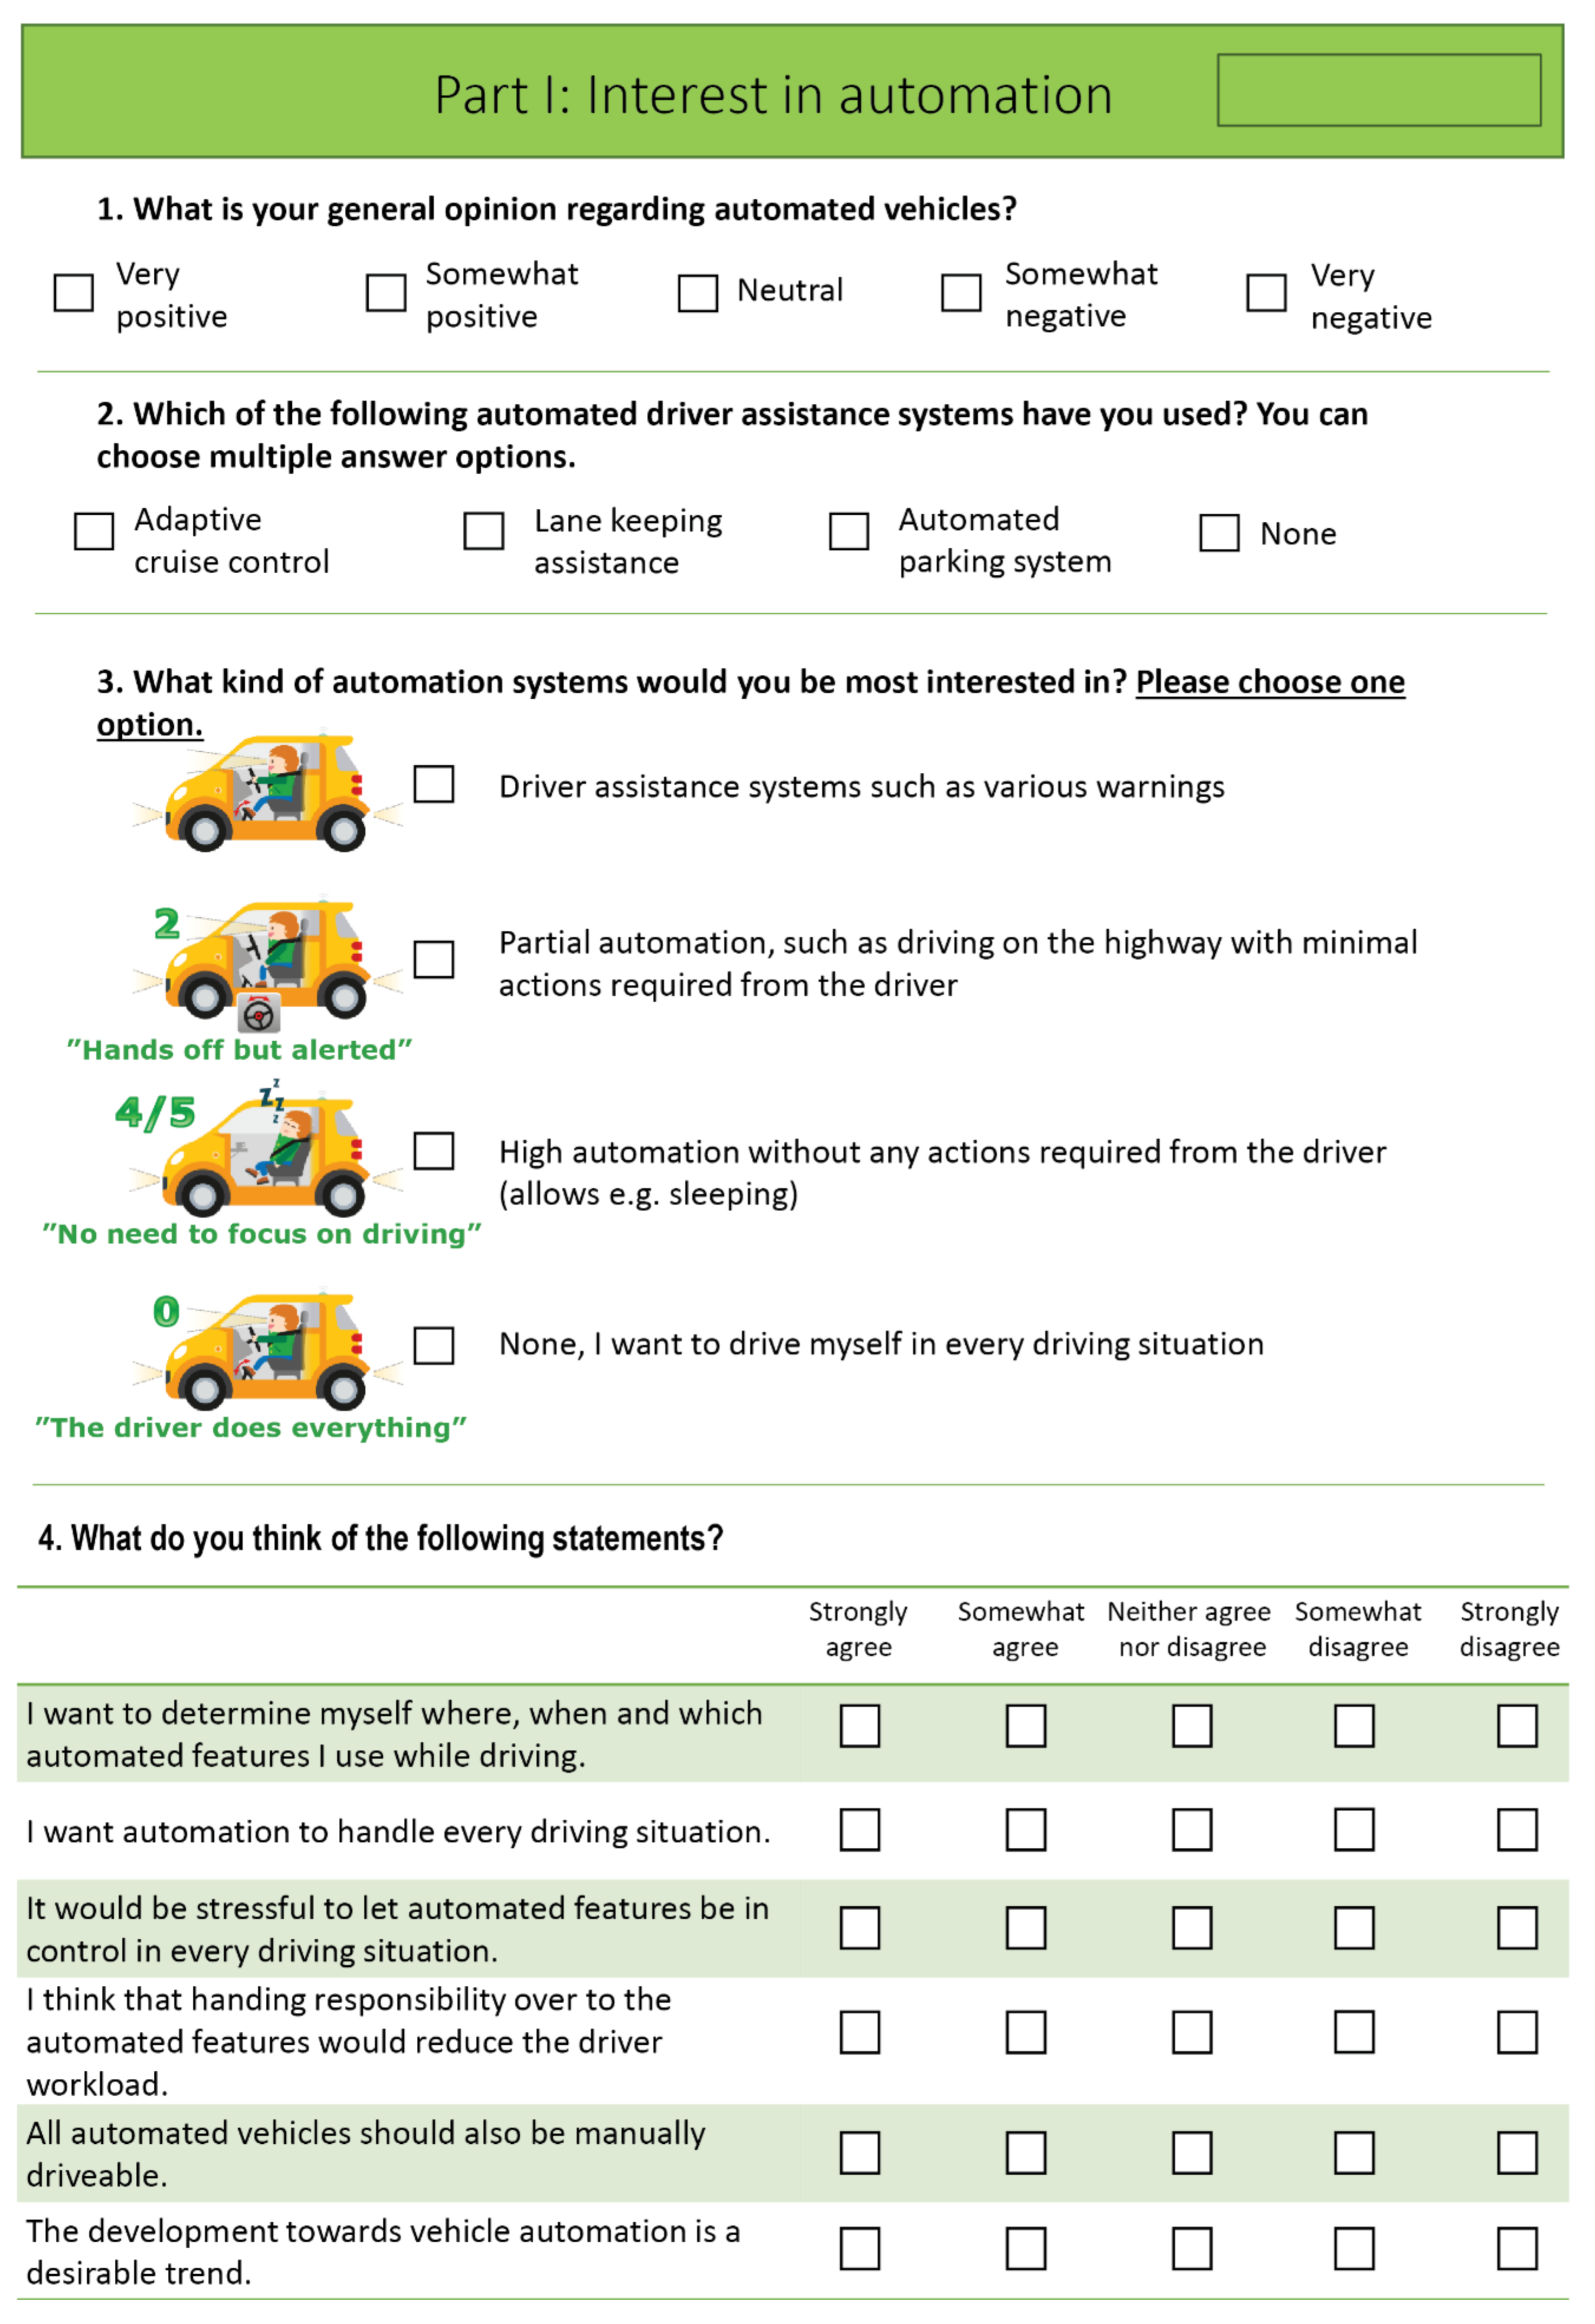
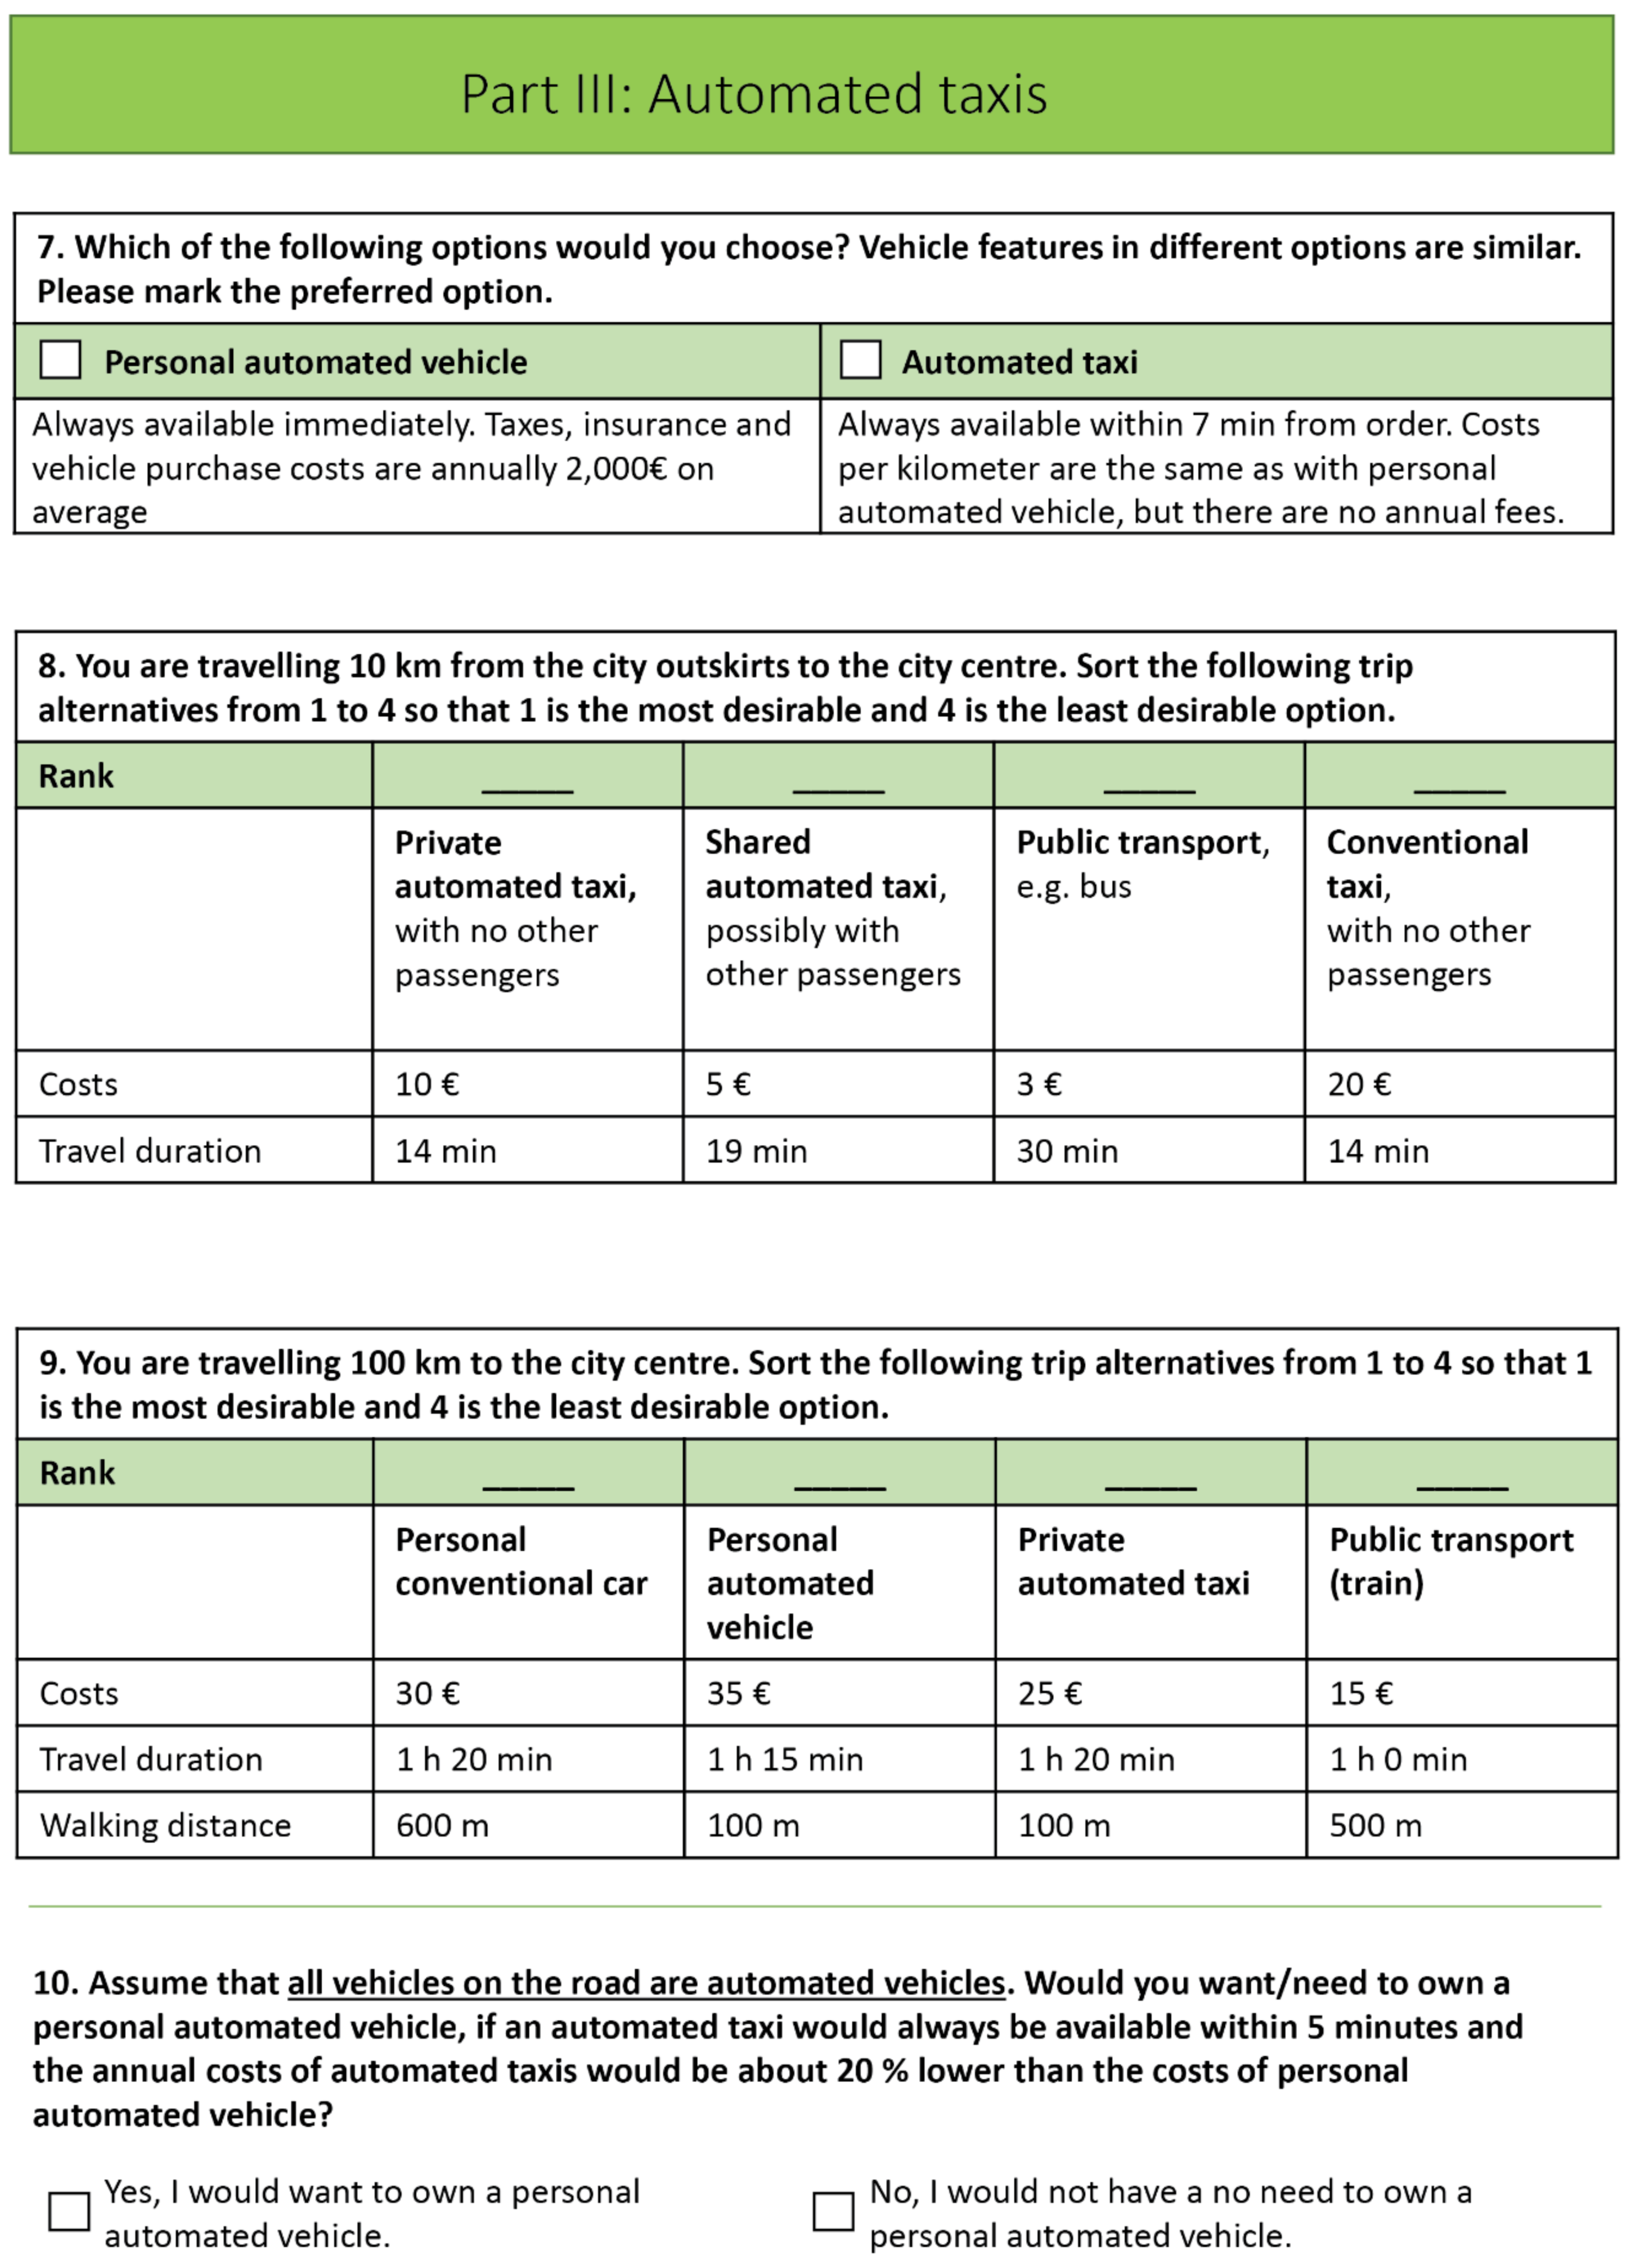
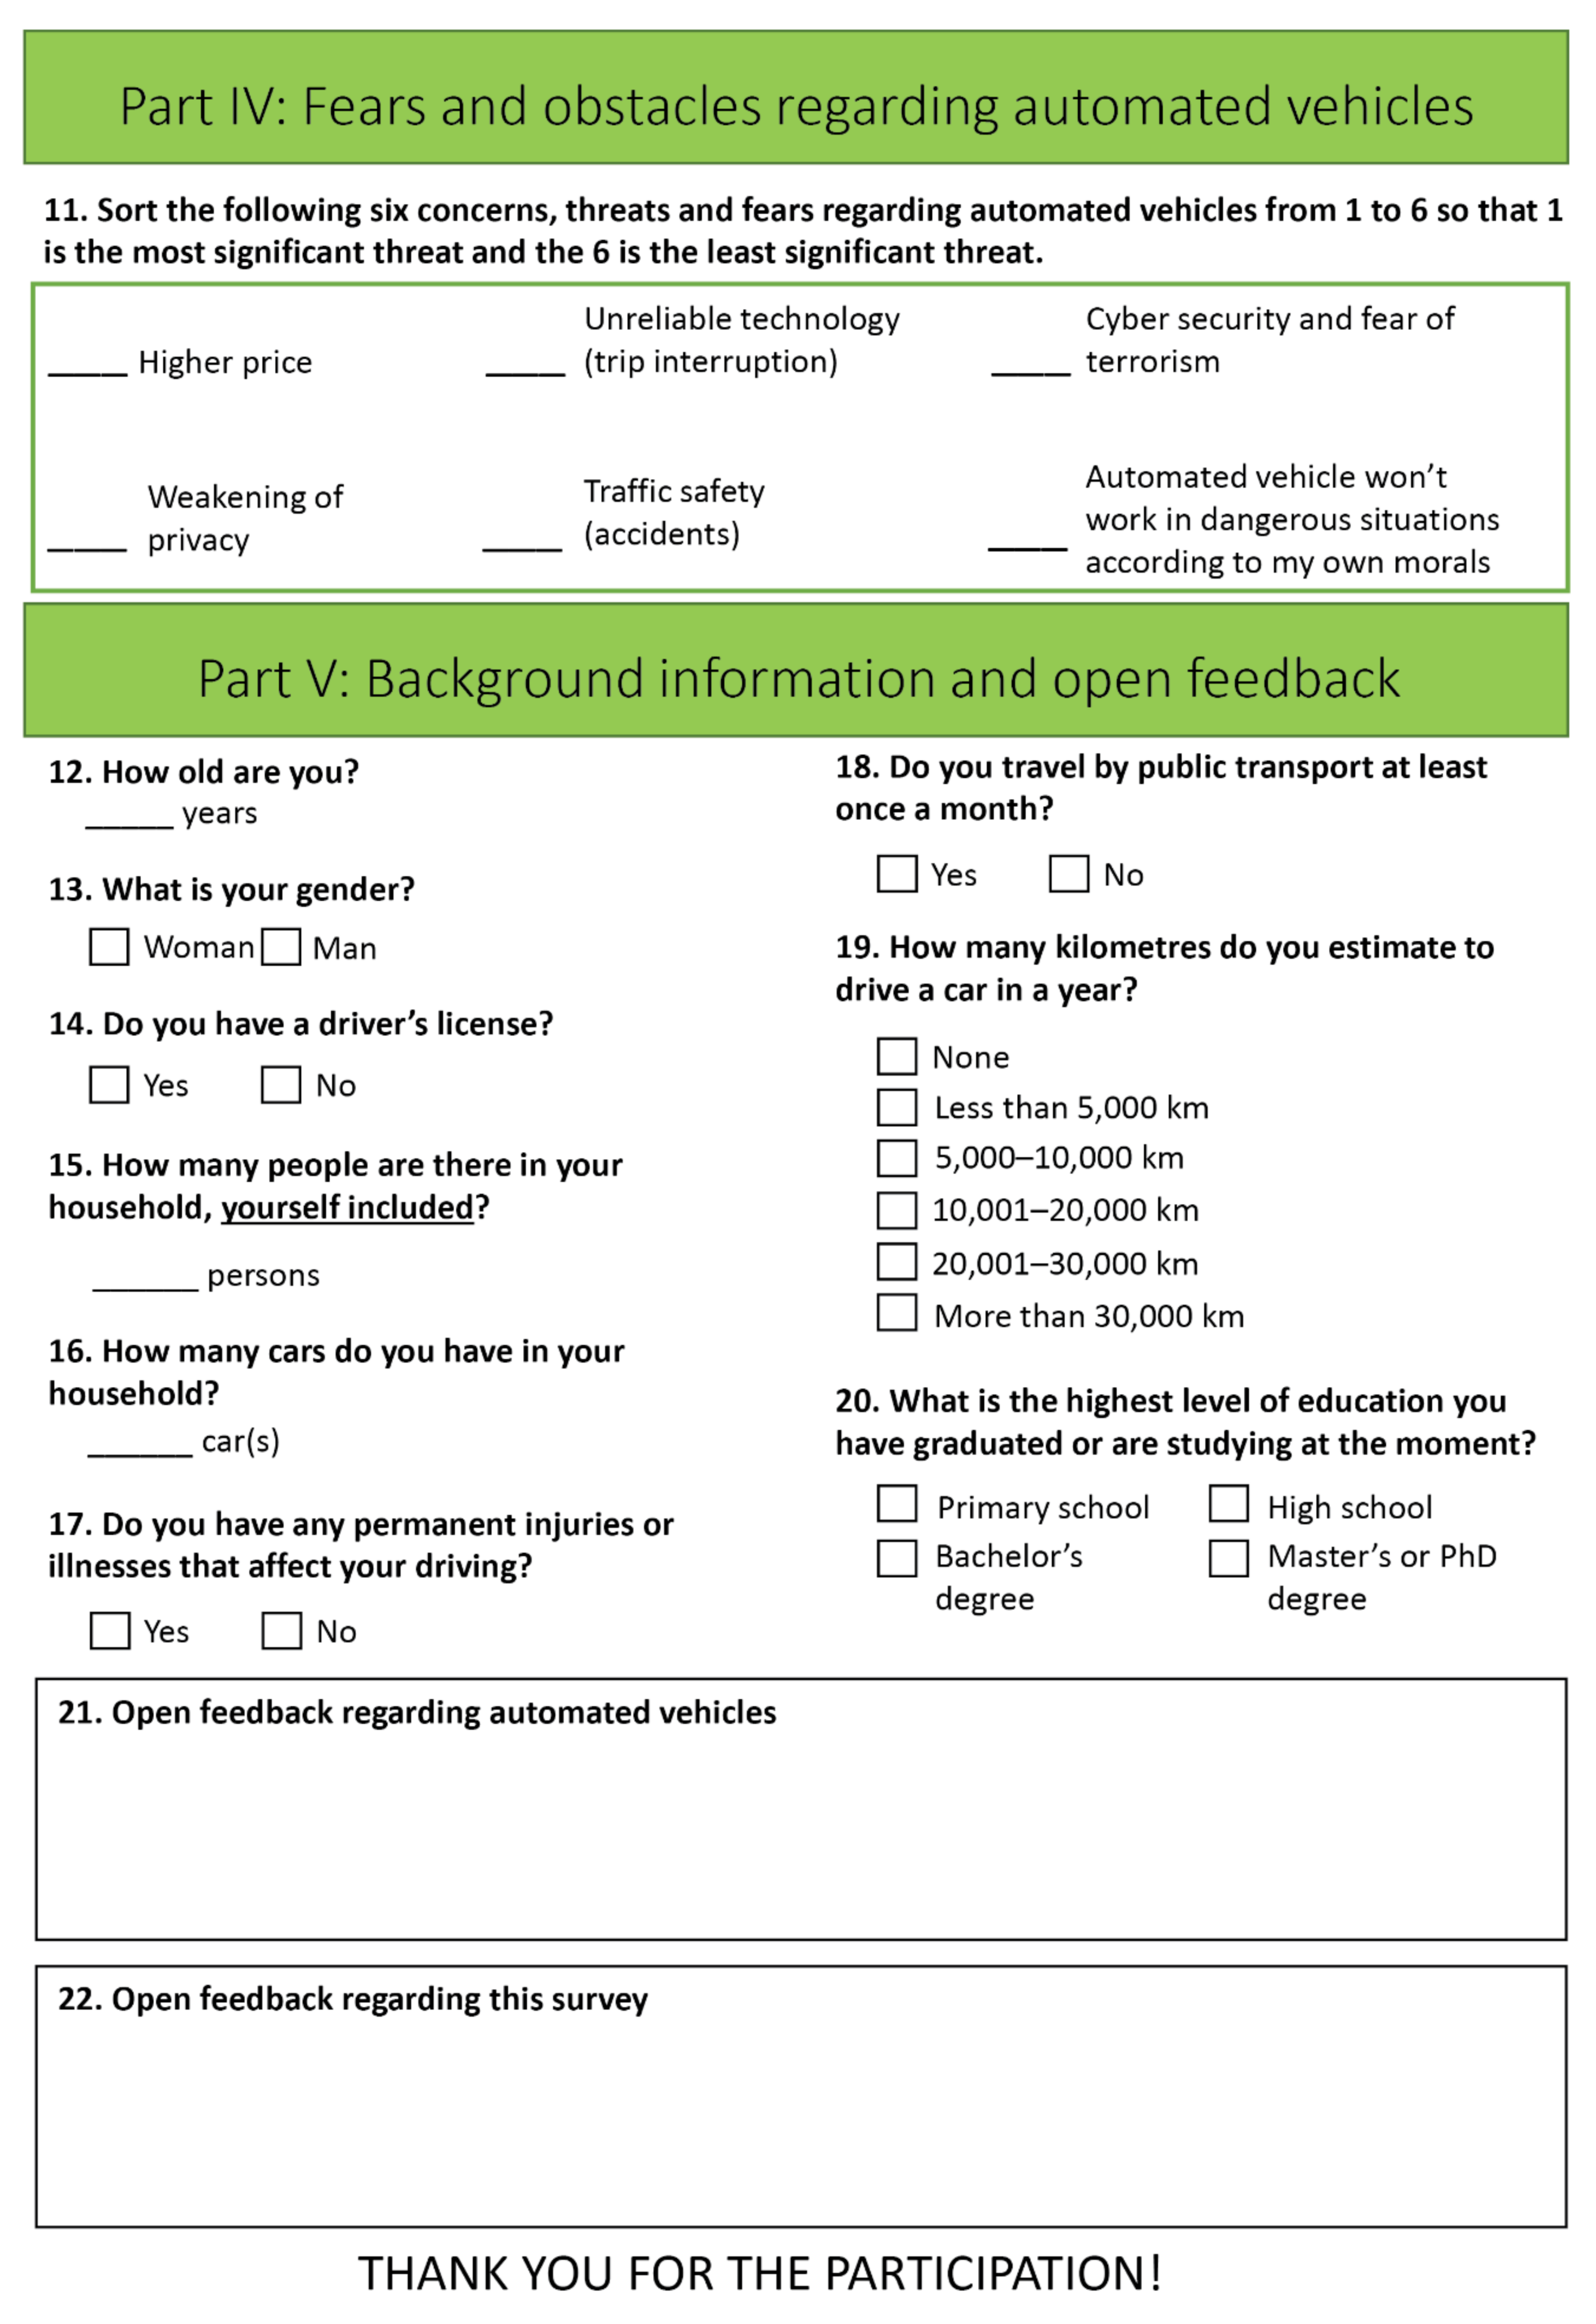
Appendix A. Automated Vehicle Survey Questionnaire
Instructions given in cover letter (in addition to the general introduction of the topic and the survey)
Terminology and instructions on how to complete the survey:
For the sake of clarity, it is assumed that all of the trips connected to the survey are taken alone, i.e., not with family members or friends.
The ordering tasks in the survey assume that autonomous cars and automated systems have been found to be safe, reliable and functional.
Automated vehicles always refer to vehicles of automation level 4 (automation levels were also explained to the respondents in plain language), in which the driver does not steer the car themselves, but the driving is completely automated. This allows the driver to sleep during the drive, for example. Autonomous cars shorten travel time, when there is no need to park the car and less time is spent walking.
Automated taxis refer to vehicles of automation level 4 that operate much like any current ordinary taxis, but are completely automated and do not have drivers.
Shared automated taxis refer to taxis that combine rides, so that people who do not know each other ride in the same taxi. Because there are several passengers, the price of the trip per customer is less than in a conventional autonomous taxi (question 8).
In this survey, costs include all costs, such as fuel, parking and car maintenance (e.g., servicing, taxes and insurance).
Travel time refers to the time it takes to travel from “door to door”, meaning that it includes walking, driving, looking for a parking space, waiting for the transport, etc.
Walking includes all walking “door to door”.
Figure A1.
AV Survey Questionnaire.
Figure A1.
AV Survey Questionnaire.
Appendix B. MaaS Survey Questionnaire
Instructions given in cover letter (in addition to the general introduction of the topic and the survey).
Instructions for filling the questionnaire.
Current transport system is approaching a point, when mobility turns more into a service. Transport is developed to be more seamless and an easier wholeness by the means of developing services. This can mean simplicity, e.g., a passenger can purchase the trip from door to door with one payment and one ticket. The compilation on mobility services are often referred to with the term MaaS, which comes from English words Mobility as a Service.
Terms related to filling the questionnaire (you may take this page close to you when filling the questionnaire):
A mobility service refers to a service, by which one can travel with many transport modes by using one service or one application.
A mobility package refers to a mobility service, in which one pays a fixed monthly payment for a mobility package, which includes a certain number of trips with different transport modes.
A shared car refers to a car, which is owned by a company or community and which can be used by the customers of the company or the members of the community. A shared car differs from traditional car rental in that it can be booked also for a short period of time and the booking is done with a mobile device or other smart device.
Long-haul public transport refers to trips over 30km in this survey. Trips shorter than this are referred to as local public transport.
Instructions for different questions:
In question 5 the right alternative is selected according to the current use. If you own more than one car, answer to the question related to car ownership on the grounds of the car, which you use the most.
The figure in the brackets describes how much each option causes costs on average in a month. For example, if your car is currently worth 10,000–25,000 euros, it causes about 300 euros of costs a month, when taxes, insurances, depreciation, parking, etc. are considered.
We wish to have answers from all, regardless of owning a driving licence or an own car. If you find that none of the alternatives offered in a question is not appropriate, you may choose the alternative which is the least bad. When needed, you may elaborate on the answers in the open comment fields in the end of the questionnaire.
Figure A2.
MaaS Survey Questionnaire.
Figure A2.
MaaS Survey Questionnaire.
References
- Geels, F.W. Low-carbon transition via system reconfiguration? A socio-technical whole system analysis of passenger mobility in Great Britain (1990–2016). Energy Res. Soc. Sci. 2018, 46, 86–102. [Google Scholar]
- Banister, D. The Sustainable Mobility Paradigm. Transp. Policy 2008, 15, 73–80. [Google Scholar]
- Bertolini, L. From “streets for traffic” to “streets for people”: Can street experiments transform urban mobility? Transp. Rev. 2020, 40, 734–753. [Google Scholar] [CrossRef]
- Khalaj, F.; Pojani, D.; Sipe, N.; Corcoran, J. Why are cities removing their freeways? A systematic review of the literature. Transp. Rev. 2020, 40, 557–580. [Google Scholar] [CrossRef]
- Nilsson, A.; Hansla, A.; Malmborg Heiling, J.; Jakobsson Bergstad, S.; Martinsson, J. Public acceptability towards environmental policy measures: Value-matching appeals. Environ. Sci. Policy 2016, 61, 176–184. [Google Scholar] [CrossRef]
- NTS. Finnish National Travel Survey, Finnish Transport Infrastructure Agency, Dataset. 2016. Available online: https://www.traficom.fi/en/news/publications/finnish-national-travel-survey (accessed on 20 May 2020).
- Bastian, A.; Börjesson, M.; Eliasson, J. Explaining “peak car” with economic variables. Transp. Res. Part A 2016, 88, 236–250. [Google Scholar] [CrossRef]
- Wong, Y.Z.; Hensher, D.A.; Mulley, C. Mobility as a service (MaaS): Charting a future context. Transp. Res. Part A 2020, 131, 5–19. [Google Scholar] [CrossRef]
- Zmud, J.P.; Sener, I.N. Towards an Understanding of the Travel Behavior Impact of Autonomous Vehicles. Transp. Res. Procedia 2017, 25, 2500–2519. [Google Scholar] [CrossRef]
- SAE. Taxonomy and Definitions for Terms Related to Driving Automation Systems for On-Road Motor Vehicles; Standard J3016; SAE International: Warrendale, PA, USA, 2018. [Google Scholar]
- Zong, W.; Zhang, J.; Jiang, Y. Long-term changes in Japanese young people’s car ownership and usage from an expenditure perspective. Transp. Res. Part D 2019, 75, 23–41. [Google Scholar] [CrossRef]
- Focas, C.; Christidis, P. Peak Car in Europe? In Proceedings of the World Conference of Transport Research—WCTR 2016, Shanghai, China, 10–15 July 2016; Volume 25, pp. 531–550. [Google Scholar]
- Bussière, Y.D.; Madre, J.; Tapia-Villarreal, I. Will peak car observed in the North occur in the South? A demographic approach with case studies of Montreal, Lille, Juarez & Puebla. Econ. Anal. Policy 2019, 61, 39–54. [Google Scholar]
- BTS. Bureau of Transportation Statistics, U.S. Department of Transportation. U.S. Vehicle-Miles. 2020. Available online: https://www.bts.gov/content/us-vehicle-miles (accessed on 8 December 2020).
- Brandt, E.; Lindeqvist, M. Auton omistus Helsingin seudulla—Katsaus menneeseen kehitykseen ja pohdintoja tulevasta. HSL Hels. Reg. Transp. 2016, 19, 90. [Google Scholar]
- Kågeson, P. The causes and effects of declining driver license holdings in Sweden. Transp. Econ. 2014, 13, 18. [Google Scholar]
- DFT. Vehicle Licensing Statistics, UK Government, Department of Transport. 2016. Available online: https://www.gov.uk/government/statistics/vehicle-licensing-statistics-2016 (accessed on 20 May 2020).
- Eurostat. Passenger Cars per 1000 Inhabitants. 2020. Available online: https://appsso.eurostat.ec.europa.eu/nui/show.do?dataset=road_eqs_carhab&lang=en (accessed on 20 May 2020).
- Statistics Finland. Population, Population structure statistics. Statistics Finland’s PxWeb databases. 2019. Available online: http://pxnet2.stat.fi/PXWeb/pxweb/en/StatFin/StatFin__vrm__vaerak/ (accessed on 20 May 2020).
- Autoalan Tiedostuskeskus. Vehicles in Traffic Use. Available online: http://www.aut.fi/en/statistics/long-term_statistics/development_of_vehicle_fleet (accessed on 20 May 2020).
- Helsingin ympäristötilasto. Henkilöautot Helsingissä, Espoossa ja Vantaalla 1980–2016. Helsinki Environmental Statistics. 2018. Available online: https://www.helsinginymparistotilasto.fi/GRAPH/STATPAGE.ASPX?ma=L10_Autotiheys&path=../DATABASE/05_LIIKENNE/3_AUTOKANTA/&ssid=2102051424281&Gedit=False&case=db (accessed on 20 May 2020).
- Trafikanalys. Fordon i Län och Kommuner 2019; Statistical data set; Trafikanalys Statistiken: Warrendale, PA, USA, 2020. [Google Scholar]
- SCB. Folkmängd Efter Region, Ålder oc år; Statistical data set; Statistikmyndigheten SCB: Stockholm, Sweden, 2020. [Google Scholar]
- DFT. VEH0204: Licensed Cars, by Region.: Great Britain and United Kingdom; Statistical data set; Department for Transport, UK Government: London, UK, 2020.
- ONS. Population Estimates for UK, England and Wales, Scotland and Northern Ireland; Office for National Statistics: London, UK, 2020.
- SYKE. YKR Urban-Rural Classification 2010; Spatial dataset; Finnish Environment Institute: Helsinki, Finland, 2013. [Google Scholar]
- Trafi. Car Fleet Data; Dataset for research use; Finnish Transport Safety Agency Trafi: Helsinki, Finland, 2018.
- Viri, R. Different Characteristics of Finnish Car Fleet and its Development. In Proceedings of the European Transport Conference 2019 Papers, Dublin, Ireland, 9–11 October 2019; p. 12. [Google Scholar]
- Statistics Finland. Population according to Age (1-Year) and Sex. by Area, 1972–2019; Statistics Finland’s PxWeb Databases: Helsinki, Finland, 2020. [Google Scholar]
- Traficom. Valid Driving Licences by Driver’s Licence Class in 2014–2020. 2020. Available online: http://trafi2.stat.fi/PXWeb/pxweb/en/TraFi/TraFi__Ajokortit/010_ajok_tau_101.px/ (accessed on 25 May 2020).
- Statistics Finland. Income and Consumption, Households’ Consumption Statistics; Statistics Finland’s PxWeb databases: Helsinki, Finland, 2018. [Google Scholar]
- Statistics Finland. Appendix table 2. Family Population and Average Size of Family in 1950–2018. Available online: http://stat.fi/til/perh/2018/perh_2018_2019-05-22_tau_002_en.html (accessed on 19 May 2020).
- Bartosiewicz, B.; Pielesiak, I. Spatial patterns of travel behaviour in Poland. Travel Behav. Soc. 2019, 15, 113–122. [Google Scholar] [CrossRef]
- Matas, A.; Raymond, J.; Roig, J. Car ownership and access to jobs in Spain. Transp. Res. Part A 2009, 43, 607–617. [Google Scholar] [CrossRef]
- Matas, A.; Raymond, J. Changes in the structure of car ownership in Spain. Transp. Res. Part A 2008, 42, 187–202. [Google Scholar]
- Klein, N.J.; Smart, M.J. Millennials and car ownership: Less money, fewer cars. Transp. Policy 2017, 53, 20–29. [Google Scholar] [CrossRef]
- Yagi, M.; Managi, S. Demographic determinants of car ownership in Japan. Transp. Policy 2016, 50, 37–53. [Google Scholar] [CrossRef]
- Lee, S.S.; Senior, M.L. Do light rail services discourage car ownership and use? Evidence from Census data for four English cities. J. Transp. Geogr. 2013, 29, 11–23. [Google Scholar]
- Glaeser, E.L.; Kahn, M.E.; Rappaport, J. Why do the poor live in cities? The role of public transportation. J. Urban. Econ. 2018, 63, 1–24. [Google Scholar] [CrossRef]
- Utriainen, R.; Pöllänen, M. Review on mobility as a service in scientific publications. Res. Transp. Bus. Manag. 2018, 27, 15–23. [Google Scholar] [CrossRef]
- Kamargianni, M.; Matyas, M.; Li, W.; Muscat, J. Londoners’ Attitudes towards Car-Ownership and Mobility-as-a-Service: Impact Assessment and Opportunities that Lie Ahead; MaaSLab—UCL Energy Institute Report; Transport for London: London, UK, 2018; p. 51.
- Storme, T.; De Vos, J.; De Paepe, L.; Witlox, F. Limitations to the car-substitution effect of MaaS. Findings from a Belgian pilot study. Transp. Res. Part A: Policy Pract. 2020, 131, 196–205. [Google Scholar] [CrossRef]
- MaaS Global. The World’s First MaaS Operator Commits to Replace One Million Cars by 2030. 2020. Available online: https://whimapp.com/the-worlds-first-maas-operator-commits-to-replace-one-million-cars-by-2030/ (accessed on 18 May 2020).
- Hauptmann, S. MaaS: Searching for User Demand. In Proceedings of the International Conference on Mobility as a Service, Tampere University, Tampere, Finland, 3–4 December 2019; pp. 52–60. [Google Scholar]
- Hensher, D.; Mulley, C.; Ho, C.; Nelson, J.; Wong, Y. Understanding MaaS: Past, Present and Future. In Proceedings of the International Conference on Mobility as a Service, Tampere University, Tampere, Finland, 3–4 December 2019; pp. 335–346. [Google Scholar]
- Salamanis, A.I.; Ioakeimidis, T.; Gkemou, M.; Kehagias, D.; Tzovaras, D. Mobility Services Data Models for Open and Inclusive Maas Infrastructures. In Proceedings of the International Conference on Mobility as a Service, Tampere University, Tampere, Finland, 3–4 December 2019; pp. 271–287. [Google Scholar]
- Sochor, J. LIMA—MaaS for Employers and Employees. In Proceedings of the International Conference on Mobility as a Service, Tampere University, Tampere, Finland, 3–4 December 2019; pp. 98–101. [Google Scholar]
- Litman, T. Autonomous Vehicle Implementation Predictions; Victoria Transport Policy Institute: Victoria, BC, Canada, 2020; p. 45. [Google Scholar]
- Sessa, C.; Alessandrini, A.; Flament, M.; Hoadley, S.; Pietroni, F.; Stam, D. The socio-Economic Impact of Urban Road Automation Scenarios: CityMobil2 Participatory Appraisal Exercise. In Road Vehicle Automation 3; Meyer, G., Beiker, S., Eds.; Springer: Berlin, Germany, 2016; pp. 163–186. [Google Scholar]
- OECD. Urban. Mobility System Upgrade—How Shared Self-Driving Cars Could Change City Traffic; International Transport Forum: Paris, France, 2015; p. 34. [Google Scholar]
- Bischoff, J.; Maciejewski, M. Simulation of city-wide replacement of private cars with autonomous taxis in Berlin. Procedia Comput. Sci. 2016, 83, 237–244. [Google Scholar] [CrossRef]
- Fagnant, D.; Kockelman, K.; Bansal, P. Operations of a Shared Autonomous Vehicle Fleet for the Austin, Texas Market; The University of Texas: Austin, TX, USA, 2015; p. 17. [Google Scholar]
- OECD. Shared Mobility Simulations for Helsinki; International Transport Forum: Paris, France, 2017; p. 95. [Google Scholar]
- Zhang, W.; Guhathakurta, S.; Khalil, E.B. The impact of private autonomous vehicles on vehicle ownership and unoccupied VMT generation. Transp. Res. Part C 2018, 90, 156–165. [Google Scholar] [CrossRef]
- Pofuk, T. Autonomous Vehicles and the Future of Private Vehicle Ownership. In Proceedings of the Management International Conference, Monastler di Treviso, Venice, Italy, 24–27 May 2017; pp. 555–567. [Google Scholar]
- Bansal, P.; Kockelman, K.M.; Singh, A. Assessing public opinions of and interest in new vehicle technologies: An Austin perspective. Transp. Res. Part C: Emerg. Technol. 2016, 67, 1–14. [Google Scholar] [CrossRef]
- Menon, N. Shared autonomous vehicles and their potential impacts on household vehicle ownership: An exploratory empirical assessment. Int. J. Sustain. Transp. 2019, 13, 111–122. [Google Scholar] [CrossRef]
- Lavieri, P.S.; Garikapati, V.M.; Bhat, C.R.; Pendyala, R.M.; Astroza, S.; Dias, F.F. Modeling individual preferences for ownership and sharing of autonomous vehicle technologies. Transp. Res. Rec. J. Transp. Res. Board 2017, 16. [Google Scholar] [CrossRef]
- Liljamo, T.; Liimatainen, H.; Pöllänen, M.; Utriainen, R. People’s current mobility costs and willingness to pay for Mobility as a Service offerings. Transp. Res. Part A 2020, 136, 99–119. [Google Scholar] [CrossRef]
- Liljamo, T.; Liimatainen, H.; Pöllänen, M. Attitudes and concerns on automated vehicles. Transp. Res. Part F 2018, 59, 24–44. [Google Scholar] [CrossRef]
- Liljamo, T.; Liimatainen, H.; Pöllänen, M.; Utriainen, R.; Viri, R. Potential user groups of Mobility as a Service in Finland, Implications of Mobility as a Service (MaaS) in Urban. and Rural Environments: Emerging Research and Opportunities; Amaral, A.M., Barreto, L., Baltazar, S., Silva, J.P., Goncalves, L., Eds.; IGI Global: Hershey, PA, USA, 2020; pp. 51–81. [Google Scholar]
- Ho, C.Q.; Hensher, D.A.; Mulley, C.; Zong, Y.Z. Potential uptake and willingness-to-pay for Mobility as a Service (MaaS): A stated choice study. Transp. Res. Part A: Policy Pract. 2018, 117, 302–318. [Google Scholar] [CrossRef]
- Pakusch, C.; Stevens, G.; Boden, A.; Bossauer, P. Unintended Effects of Autonomous Driving: A Study on Mobility Preferences in the Future. Sustainability 2018, 10, 2404. [Google Scholar] [CrossRef]
- Palevicius, V.; Uspalyte-Vitkuniene, R.; Damidavicius, J.; Karpavicius, T. Concepts of development of alternative travel in autonomous cars. Sustainability 2020, 12, 8841. [Google Scholar] [CrossRef]
- Clark, S. Estimating local car ownership models. J. Transp. Geogr. 2007, 15, 184–197. [Google Scholar] [CrossRef]
- Oakil, A.T.M.; Manting, D.; Nijland, H. Determinants of car ownership among young households in the Netherlands: The role of urbanisation and demographic and economic characteristics. J. Transp. Geogr. 2016, 51, 229–235. [Google Scholar] [CrossRef]
- Clark, B.; Chatterjee, K.; Melia, S. Changes in level of household car ownership: The role of life events and spatial context. Transportation 2016, 43, 565–599. [Google Scholar] [CrossRef]
- Turon, K.; Kubik, A. Economic Aspects of Driving Various Types of Vehicles in Intelligent Urban Transport Systems, Including Car-Sharing Services and Autonomous Vehicles. Appl. Sci. 2020, 10, 5580. [Google Scholar] [CrossRef]
- Turon, K.; Kubik, A.; Chen, F.; Wang, H.; Lazarz, B. A Holistic Approach to Electric Shared Mobility Systems Development—Modelling and Optimization Aspects. Energies 2020, 13, 5810. [Google Scholar] [CrossRef]
- Medina-Tapia, M.; Robusté, F. Implementation of Connected and Autonomous Vehicles in Cities Could Have Neutral Effects on the Total Travel Time Costs: Modeling and Analysis for a Circular City. Sustainability 2019, 11, 482. [Google Scholar] [CrossRef]
- Pangbourne, K.; Mladenovic, M.N.; Stead, D.; Milakis, D. Questioning mobility as a service: Unanticipated implications for society and governance. Transp. Res. Part A: Policy Pract. 2020, 131, 35–49. [Google Scholar] [CrossRef]
- Matyas, M.; Kamargianni, M. The potential of mobility as a service bundles as a mobility management tool. Transportation 2019, 46, 1951–1968. [Google Scholar]
- Kiiskilä, K.; Tuominen, J. Survey on Citizen Satisfaction with the Transport. System and Travel Chains; Research reports of the Finnish Transport Agency; Finnish Transport Agency: Helsinki, Finland, 2017; Volume 45, p. 81.
- Wardman, M. A Comparison of Revealed Preference and Stated Preference Models of Travel Behaviour. J. Transp. Econ. Policy 1988, 22, 71–91. [Google Scholar]
- Eurostat. Comparative price levels of consumer goods and services. 2017. Available online: https://ec.europa.eu/eurostat/statistics-explained/index.php/Comparative_price_levels_of_consumer_goods_and_services#Price_levels_for_personal_transport_equipment.2C_transport_services.2C_communication.2C_restaurants_and_hotels (accessed on 16 May 2019).
| Publisher’s Note: MDPI stays neutral with regard to jurisdictional claims in published maps and institutional affiliations. |
© 2021 by the authors. Licensee MDPI, Basel, Switzerland. This article is an open access article distributed under the terms and conditions of the Creative Commons Attribution (CC BY) license (http://creativecommons.org/licenses/by/4.0/).


