Abstract
Increased urbanization implicated in the form of increased vehicles on roads which burdened limited resources and caused environmental deterioration. To reduce these effects, a Bus Rapid Transit (BRT) system was considered the right solution, requiring minimal infrastructure, as compared to other mass transit options, yet demanding great expertise. This research analyses BRT systems in four cities of Pakistan and the performance evaluation of BRT standards is conducted by developing a statistical model to evaluate predictive BRT standard, which results in identifying the parameters used to improve the performance of the BRT, thus resulting in improved BRT Institute for Transportation and Development Policy (ITDP) standard. As per ITDP, Peshawar BRT was ranked as Gold, whereas Lahore BRT, Rawalpindi/Islamabad BRT and Multan BRT were ranked as Silver. Research describes that ITDP rating can be significantly enhanced if worked in the right direction, taking into account the standards; Peshawar BRT is an example to follow for existing and future BRT in Pakistan. If fully integrated networks of routes and corridors for Lahore, Rawalpindi/Islamabad and Multan BRT have been developed, the model predicts the enhancement of ratings. This paper will assist transport policy makers to strategize in accordance with ITDP standard developed to evaluate and improve the quality of BRT.
1. Introduction
Health, quality of life and social inclusion boost long-term economic growth and should be central to considerations when prioritizing and planning projects that will impact generations to come. The concept of the Bus Rapid Transit system (BRT) was developed and implemented successfully, as derived from Rail Transit with its replacement by buses. BRT is a preferred mode of public transport due to its flexibility in design, cost and convenience when compared with Rail Transit. The best BRT examples are found in Brazil and Columbia, where its capacity is compared equal to the Metro Rail [1,2,3].
BRT was first introduced in Lahore, Pakistan as an inspiration from Istanbul BRT, Turkey, which was greatly valued and adopted by the local passengers [4,5,6,7]. Construction on the unique design was completed in 11 months and the BRT concept was fully functional in 2014.
BRT is one of the most suitable and reliable mass transit systems, which can be implemented in urban areas due to lower construction time and cost. In Pakistan, a total of four BRT operational projects are located in Lahore [5,8], Rawalpindi/Islamabad [9,10,11] and Multan [2,3,12] (operated and maintained by Punjab MassTransit Authority-PMA, Government of the Punjab) [13] and one in Peshawar (operated and maintained by TransPeshawar, Government of Khyber Pakhtunkhwa) [14].
BRT and LRT provide high speed, reliable and passengers satisfaction service [15,16]. Flexibility in BRT design and operations involves the integration of a BRT system and other public transport systems [17]. These systems involve dedicated right of way for busses, secured stations, communication for passenger information to develop exclusive character of BRT [1]. Integration between public transport and land-use facilities leads to the provision of successful BRT corridors. Maintaining steady headway, sustainable travel time reliability and schedule adherence quantifies BRT higher than conventional public buses [18]. More than 4200 km of BRT has been developed in more than 160 countries that has enabled more than 30 million of daily passenger trips. Due to enhanced congestion on roads, BRT has transformed more cities in last decade and has been incorporated as the preferred mode of public transport (brtdata.org (accessed on 1 February 2021)).
Moreover, aspects related to Integrated Transportation Policy incorporates passengers that are willing to use integrated transport if it is cost effective and time efficient [19]; introduction of hierarchical transport systems [20]; BRT cannot bring success as a stand-alone policy [21]; bring all agencies to work for a common goal to achieve BRT integration [22]; commute to a BRT station should be safe during the evening to encourage riders [21,23]; direct access to several employment centres [24]; long walking distances to BRT stations reduces access [25]; defined distance between the bus stops [20,24].
The planning, design and operations standards of BRT in four cities of Pakistan essentially requires an assessment for improvement in existing cities and to fill the gaps in future BRT services in Pakistan. Cost and time factors have negative impact on passengers preference and their satisfaction [26]. This requires collecting data for existing BRT system in Pakistan and understanding and evaluating the results of the best BRT system in the world. Currently, only the ITDP BRT standard of 2016 is the most recognizable rating medium, which may result in identifying parameters to improve the performance of the BRT system in Pakistan, thus resulting in improved BRT ITDP standards [27,28,29,30].
2. Objectives of this Research
The research aims to identify the obvious areas where the Pakistani BRT system are lacking; moreover, the intensity of the lag could also be quantified through this scoring. The main objectives of this research are as follows:
- To evaluate and rate the existing BRT systems at Lahore, Rawalpindi/Islamabad, Multan and Peshawar, as per the ITDP rating guidelines.
- To identify the deficiencies in the current operational BRT systems of four cities.
- To develop a statistical model to evaluate predictive BRT standards.
- To analyse the BRT system based on compiled operational key performance indicators (KPI).
- To recommend the improvements in current operational BRT operations in four cities for enhancing ratings.
3. Materials and Methods
3.1. ITDP BRT Approach
Four BRT systems in Pakistan were assessed based on the BRT standard (ITDP 2016) [9]. The ITDP evaluation process comprises 30 categories in 6 sections: Gold, Silver, Bronze and Basic BRT standards are achieved, as mentioned in Table 1.

Table 1.
Summary of the BRT Standard by ITDP-BRT Standard Scoring Criteria.
Data incorporated for this research have been collected from Punjab MassTransit Authority (PMA) and Trans-Peshawar. These data were used to score each category and the total scores were evaluated.
All the corridors claimed to be BRT are analysed in two scores; Design and Operations which are also known as design score and full score. The design score consists only in the design and services which are implemented for the particular BRT system. It delineates the potential for performance the system holds. All the indicators are elements of corridor design, accentuating quality of service, BRT speed, capacity and reliability. The full score not only contains the design score but also the deductions to be done due to the operational lags, which lower the quality performance, hence making BRT scoring more reliable and robust.
Figure 1 shows the evaluation of performance variables of 39 BRT around the world as per “The BRT Standard by ITDP”. These variables were (1) number of stations with passing lanes (percentage), (2) longest BRT station (m), (3) average distance between BRT stations (m), (4) total length of dedicated right of way (km), (5) number of vehicles/h/one-way during peak hours in the city centre, (6) average operating speed during peak hours (km/h). (Source; ITDP BRT Standard, 2016) [27].
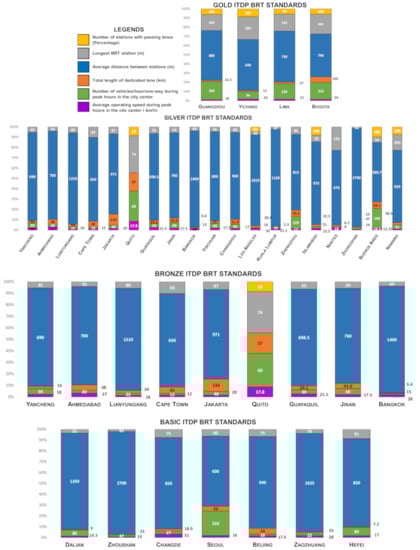
Figure 1.
Performance Evaluation of 39 BRT around the world as per “The BRT Standard by ITDP” by using (1) number of BRT stations with passing lanes (percentage), (2) longest BRT station (m), (3) average distance between BRT stations (m), (4) total length of dedicated right of way (km), (5) number of vehicles/hour/one-way during peak hours in the city centre, (6) average operating speed during peak hours (km/h) (source: data coded from ITDP) [27].
3.2. Statistical Model to Develop Predictive BRT Standard (Earlier Research)
Research by Zheng Li and David A. Hensher (2020) evaluates and identifies whether an expert’s assessment can be replaced by a statistical approach. Ordered choice model that was adopted discusses the mechanism to find out ranges of categories based on the defined thresholds. This model has been successfully used for conducting analysis for bank rating, investor belief, interest rate decision and injury severity, shown as below:
where is continuous, is shown:
describes the explanatory variable ; is the threshold value based on and are disturbance terms.
Zheng Li and David A. Hensher [30], investigated the Ordered choice model that reveals sixteen (16) variables which have statistical impact on the BRT standard. (Figure 1, was developed for 39 different BRT’s currently operational around the world. Gold Category = 4, Silver Category = 18, Bronze Category = 9 and Basic BRT = 7.)
Details of Quantitative and Qualitative variables used to develop BRT standards through statistical modelling are shown in Table 2. These variables are as follows:
Table 2.
Six quantitative variables and ten qualitative variables were used to develop BRT Standards through statistical modelling. (Source: Zheng Li, David A. Hensher (2020)).
Six Quantitative Variables:
- Average operating speed during peak hours in the city center (km/h);
- Number of vehicles/hour/one-way during peak hours in the city centre;
- Dedicated right of way (km);
- Distance between two stations (m);
- Longest BRT station (m);
- Number of stations with passing lanes (percentage).
Ten Qualitative Variables:
- Integrated network of bus lines and corridors;
- Off-car fare collection system;
- Higher operating speed during peak hours (greater than 20 km/h);
- Covered station entrance;
- Improved station waiting environment (not just shelter from wind and rain);
- More than 75% of stations have overtaking lanes;
- Automatic fare collection system;
- High-quality passenger information instructions in the station;
- Wheelchair accessible platforms;
- Public bicycles are near the BRT station.
4. Study Area Characteristics
4.1. Lahore BRT System (Shahdara to Gajjumata)
Lahore BRT system between Shahdara chowk to Gajjumata provides an alternate and convenient mode of transport to the public, (Japan International Cooperation Agency-JICA 2012). The Punjab MassTransit Authority (PMA) Lahore was established to manage operations and the maintenance of Lahore BRT. Lahore BRT was inaugurated on 11 February 2013.
Lahore BRT encompasses a 27 km long corridor starting from Gajjumatta to Shahdara, with a commercial speed of 26 km/h and the peak frequency is 23 bus/h/direction. It is 18 km at-grade and has 9 km of elevated structures, as shown in Figure 2. In total, 64 buses operate on the corridor to cater for over 150,000 passengers per day with a headway of 3 min.
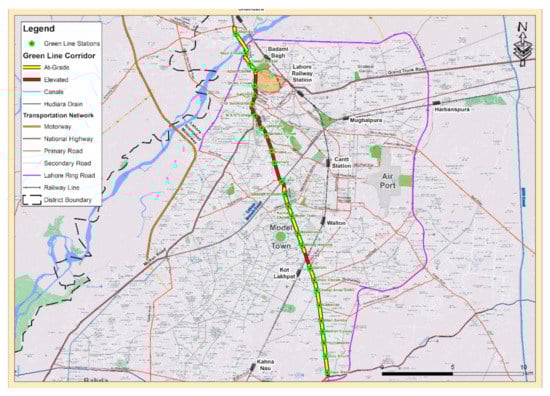
Figure 2.
Route Map of Lahore BRT System.
4.2. Rawalpindi/Islamabad BRT System (Saddar to Pak Secretariat)
To provide convenient, affordable and secure transport service to the people of Rawalpindi and Islamabad, the Rawalpindi/Islamabad BRT system was executed. The operations and maintenance of the Rawalpindi/Islamabad BRT system is also managed by the Punjab MassTransit Authority (PMA). The BRT system in Rawalpindi/Islamabad was inaugurated on 4 June 2015.
The Rawalpindi/Islamabad BRT system encompasses the 23.2 km long corridor starting from Saddar (Rawalpindi) to Pak Secretariat (Islamabad), with a commercial speed of 25 km/h and the peak frequency is 23.5 bus/h/direction. It is 14.9 km at-grade and has 8.3 km of elevated structures, as shown in Figure 3. In total, 68 buses operate on the corridor to cater for over 100,000 passengers per day with a headway of 3 min.
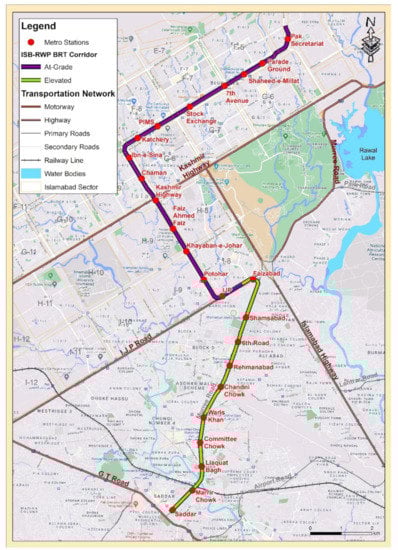
Figure 3.
Route Map of Rawalpindi/Islamabad BRT System.
4.3. Multan BRT System (Bahauddin Zakria University to Chowk Kumharanwala)
The Multan BRT system is the third BRT in the Punjab Province. The operations and maintenance of the Multan BRT system is also managed by the Punjab MassTransit Authority (PMA) Lahore. The Multan BRT system was inaugurated on 24 January 2017.
The Multan BRT system encompasses an 18.5 km long corridor starting from Bahauddin Zakria University to Chowk Kumharanwala with a commercial speed of 25 km/h and the peak frequency is 18 bus/h/direction. It is 6 km at-grade and has 12.5 km of elevated structures, as shown in Figure 4. In total, 35 buses operate on the corridor to cater for over 45,000 passengers per day with a headway of 3 min.
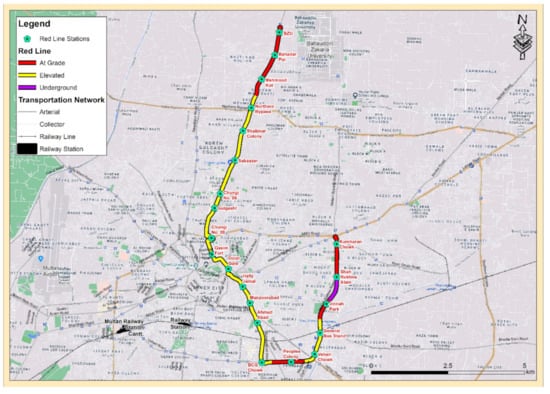
Figure 4.
Route Map of Multan BRT System.
4.4. Peshawar BRT System (Chamkani Chowk to Karkhana Morr)
After the lessons learned from the operations and maintenance of three BRT systems in Pakistan, the first fully integrated BRT system of Pakistan was developed at Peshawar. Fare and physical integration are provided to facilitate the movement from the feeder route to the main corridor in the Peshawar BRT system. Hybrid buses were introduced at Peshawar BRT, providing a healthy environmental impact. The BRT system in Peshawar has three Bus Depots at Chamkani, Hayatabad, and Dabgari along with three Park and Ride Facilities. A bicycle lane is provided along the corridor to facilitate the integration with BRT for the first time in Pakistan. Three feeder routes are operational to facilitate the commuters’ travel. Pedestrian mobility is managed by providing escalators, elevators, stairs and pedestrian bridges. The operations and maintenance of the Peshawar BRT system are managed by TransPeshawar. The Peshawar BRT system was inaugurated on 13 August 2020.
Peshawar BRT encompasses a 26 km long corridor, starting from Chamkani Chowk to Karkhana Morr, with a commercial speed of 27 km/h and the peak frequency is 38 bus/h/direction. It has a 15 km at-grade and 8 km of elevated buildings and 3 km of underpasses, as shown in Figure 5. In total, 115 buses (79 main corridor and 36 off corridor) operate on the corridor to cater for over 100,000 passengers per day with an average headway of 2.5 min.
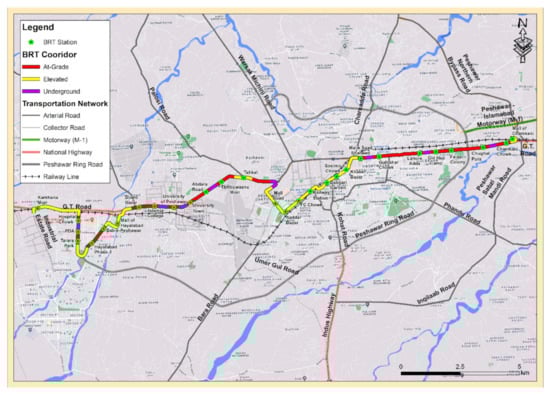
Figure 5.
Route Map of Peshawar BRT System.
5. Results and Discussion.
5.1. Ratings of BRT System in Pakistan as Per the BRT Standard by ITDP
As mentioned in previous sections, Pakistan has four BRT systems, i.e., Lahore, Rawalpindi/Islamabad, Multan and Peshawar. As per the mentioned criteria of scoring BRTs as per ITDP standards, the BRT systems of Pakistan were rated and the results are shown in Table 3.
Table 3.
Ratings of BRT systems in Pakistan as per the BRT standards by ITDP.
5.1.1. Discussion on Lahore BRT
The Lahore BRT system, being the first ever BRT system in Pakistan, provided valuable experiences that could be drawn from it. The Lahore BRT system was ranked as “Basic BRT” by ITDP in 2014, with an overall score of 52. According to Table 3, the rating of the Lahore BRT system has since improved to enter the “Silver” Category of ITDP (2016) [9], with an overall score of 76.85. This increase is a result of improvements in the available facilities, such as removing at-grade signalised intersections along the BRT corridor and improvement in the maintenance operations of the buses. The current ranking can be further improved by providing better access to passengers, enhancing the level of branding, minimizing crowding by adding more buses in the fleet, improving access to physically impaired people, etc.
Frameworks for Key Performance Indicators (KPIs) for the Lahore BRT system evaluates average monthly trip realization as 98.66%, trip punctuality as 99.95%, travel time reliability as 96.81% and schedule adherence as 97.04%, as shown in Table 4. Percentages above the desired benchmarks determine a higher performance quality for the Lahore BRT system.
Table 4.
Key Performance Indicators for Lahore BRT system (Source: PMA).
5.1.2. Discussion on Rawalpindi/Islamabad BRT
The Rawalpindi/Islamabad BRT system was inaugurated in 2015 and was rated as “Silver” in this study when analysed in line with ITDP-2016. For the improvement of scores, integration and access hold huge potential, since universal access for pedestrians, bicycles and those with disabilities is something that is still lacking. Frameworks for Key Performance Indicators (KPIs) for the Rawalpindi/Islamabad BRT system evaluates average monthly trip realization as 99.86%, trip punctuality as 99.45%, travel time reliability as 90.19% and schedule adherence as 70.01%, as shown in Table 5. The decline in the performance for travel time reliability and schedule adherence for the Rawalpindi/Islamabad BRT system from September 2019 until February 2020 was due to maintenance at the Rawalpindi Package II and the Islamabad Packages I and II, which involved working at eight stations of the Rawalpindi/Islamabad BRT system. For these performance indicators, the reduction was to 99.95%, for travel time reliability it was to 96.81%, and for schedule adherence, it was 97.04%, as shown in Table 4. Percentages above the desired benchmarks determine higher performance quality for Lahore BRT.
Table 5.
Key Performance Indicators for Rawalpindi/Islamabad BRT (Source: PMA).
5.1.3. Discussion on Multan BRT
The Multan BRT system runs between Bahauddin Zakariya University and Chowk Kumharanwala, and it is the third BRT system in Pakistan, anticipated to cater to the daily commuting needs of the residents of the city. ITDP has not yet rated the Multan BRT system. According to the results from this study, the Multan BRT system falls into the “Silver” category of the ITDP BRT rating scale. This rating may also further increase by providing better access to the physically impaired and improved maintenance facilities.
The framework for Key Performance Indicators (KPI) for the Multan BRT system evaluates average monthly trip realization as 99.99%, trip punctuality as 99.61%, travel time reliability as 99.83% and schedule adherence as 96.40%, as shown in Table 6. Percentages above the desired benchmarks determine higher performance quality for the Multan BRT system.
Table 6.
Key Performance Indicators for Multan BRT system (Source: PMA).
5.1.4. Discussion on Peshawar BRT
The Peshawar BRT system was inaugurated in August 2020. As per this study, it is anticipated to be the highest ranked BRT service in Pakistan. As per the ITDP BRT rating scale, Peshawar BRT is rated in the Gold category.
The framework for Key Performance Indicators (KPI) for the Peshawar BRT system evaluates average monthly trip realization as 98.99%, trip punctuality as 97.85%, travel time reliability as 99.998% and schedule adherence as 98.50%. Percentages above the desired benchmarks determine higher performance quality for Peshawar BRT. Table 7 shows the details for the Peshawar BRT.
Table 7.
Key Performance Indicators for Peshawar BRT (Source: TransPeshawar).
5.2. Statistical Model to Develop Predictive BRT Standard (The Current Research)
The Peshawar, Lahore, Rawalpindi/Islamabad and Multan BRT systems were not evaluated and ranked by ITDP (2016). The ITDP (2016) procedure was used to evaluate and rank the four BRT systems in Pakistan as shown in Table 8. Table 3 explains the procedure to calculate the ratings for the BRT system, based on ITDP.
Table 8.
The BRT Standards were evaluated by adopting ITDP Standards (2016).
Predictive BRT standard are evaluated based on the information provided in Table 9. Threshold values (y* is the latent preference variable) have been defined from 0–18.3130 for predictive BRT standards from Basic to Gold standards.
Table 9.
Threshold values for the Predictive BRT Standard.
Four BRT systems in Pakistan were evaluated by as per ITDP BRT standard by using six variables. These variables are (a) number of stations with passing lanes, (b) longest BRT station, (c) average distance between BRT stations, (d) total length of dedicated right of way, (e) number of vehicles/hour/one-way during peak hours in the city centre, (f) average operating speed during peak hours in the city centre as shown in Figure 6.
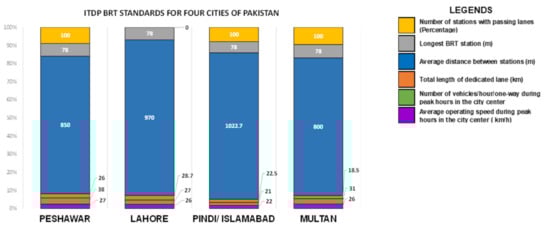
Figure 6.
Evaluation of performance variables of 4 BRT systems in Pakistan, as per “The BRT Standard by ITDP” by using number of stations with passing lanes (percentage), longest BRT station (m), average distance between BRT stations (m), total length of dedicated right of way (km), number of vehicles/hour/one-way during peak hours in the city centre, average operating speed during peak hours in the city centre (km/h) (source: data coded from ITDP) [27].
Parameters defined and evaluated by Zheng Li and David A. Hensher (2020) were utilized to develop predictive BRT standards for four BRT systems developed, operated and maintained in Pakistan, as defined in Table 10. Table 10, provides the Predicted BRT Standards projection for Lahore, Rawalpindi/Islamabad, Multan and Peshawar BRT systems, operational in Pakistan. The latent preference variable, y*, is calculated, predictive BRT standards are determined by comparing them with threshold values. The predictive BRT standards from this model define the Bronze BRT system for Lahore, Rawalpindi/Islamabad and Multan BRT and the Gold BRT system for Peshawar BRT.
Table 10.
Forecasting of four BRT systems in Pakistan, based on the predictive BRT standard.
Calculations of predictive BRT standards explains how an improvement made in the existing BRT system results in raising it to the next category of BRT standard. Figure 7 evaluated the (a) Peshawar BRT, (b) Lahore BRT, (c) Rawalpindi/Islamabad BRT and (d) Multan BRT by using the forecasted values and the results are tabulated in Table 10. We have provided a waterfall graphic representation of the four BRT systems in Pakistan.
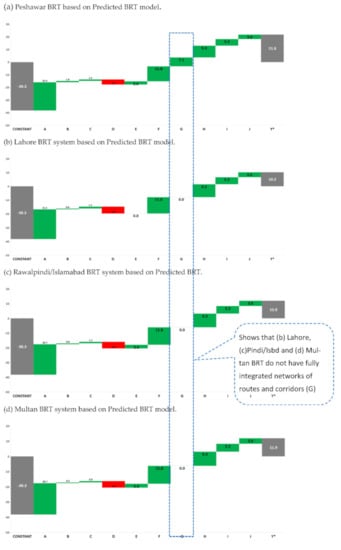
Figure 7.
Evaluation of (a) Peshawar BRT, (b) Lahore BRT, (c) Rawalpindi/Islamabad BRT and (d) Multan BRT by using waterfall graphic representation and by using performance variables; A: peak hour speed (km/h), B: peak frequency (bus/hour/direction), C: the total length of dedicated right of way (km), D: average distance between BRT Station (m), E: over 50% of stations with passing lanes (1 or 0), F: pre-board fare collection and fare verification at all stations (1 or 0), G: fully integrated network of routes and corridors (1 or 0), H: all Stations being enhanced station (1 or 0), I: automated fare collection and fare verifications at all stations (1 or 0), J: all stations being covered accessible (1 or 0).
5.2.1. Discussion on Peshawar BRT Based on Predicted BRT Model
BRT Standard: The predictive BRT standard from the model (Table 10) and waterfall graphic representation (Figure 7) defines “Gold” BRT standard for Peshawar BRT.
Integration (Physical and Fare): For Peshawar BRT, a ‘Direct-service’ operational integration model is used, where Feeder BRT buses enter the BRT corridor through the dedicated entrance and travel along the BRT corridor and use the BRT stations, and then exit the BRT corridor through the exclusive exit. Passengers do not have to change the stations to shift from feeder BRT bus to BRT corridor bus when they are in the designated BRT system.
Stations: For Peshawar BRT, all the stations have bus passing lanes, this will assist the operation of express and feeder buses along the main BRT corridor. Average distance between the stations of Peshawar BRT are designed and executed as per the desired BRT standards. All the required facilities have been provided at all the stations of Peshawar BRT.
5.2.2. Discussion on Lahore BRT Based on Predicted BRT Model
BRT Standard: The predictive BRT standard from the model (Table 10) and waterfall graphic representation (Figure 7) defines Bronze BRT standard for Lahore BRT.
Integration (Physical and Fare): Lahore BRT has separate main and feeder system, this requires passengers to transfer from feeder service to BRT main service. This transfer might be economical in fare, but loss in time and walking distance required to change buses and wait for the connecting service will discourage passengers to use BRT, resulting in poor integration.
Table 10 shows that there is no integration between routes and corridors (Table 10—Column G shows “0 = No”) for Lahore BRT. If integration exists (Table 11—Column G shows “1 = Yes”) between the routes and corridors, Predictive BRT standard model determine improvement in the BRT standard to “Silver” for Lahore BRT.
Table 11.
Improvement in Predictive BRT Standard of Lahore, if integration exists.
Stations: For Lahore BRT, no bus passing lanes exist at the stations (Table 11—Column E shows “0 = No”), this will avoid the operation of express and feeder buses along the main BRT corridor. Average distance between the stations of Lahore BRT is more than the desired BRT standards (Table 11—Column D).
5.2.3. Discussion on Rawalpindi/Islamabad BRT Based on Predicted BRT Model
BRT Standard: The predictive BRT standard from the model (Table 10) and waterfall graphic representation (Figure 7) defines Bronze BRT standard for Rawalpindi/Islamabad BRT.
Integration (Physical and Fare): Rawalpindi/Islamabad BRT has no feeder bus service. Travel of people from home or work without a feeder route would require more time and walking distance to get on the BRT and wait for the existing connecting service will discourage people to use the BRT.
Table 10 shows that there is no integration between routes and corridors (Table 10—Column G shows “0 = No”) for Rawalpindi/Islamabad BRT. If feeder routes are introduced and integration exists (Table 12—Column G shows “1 = Yes”) between the routes and corridors, Predictive BRT standard model determine improvement in the BRT standard to “Gold” for Rawalpindi/Islamabad BRT.
Table 12.
Improvement in Predictive BRT Standard of Rawalpindi/Islamabad, if integration exists.
Stations: For Rawalpindi/Islamabad BRT, all the stations have bus passing lanes (Table 10—Column E shows “1 = Yes”), but due to the non-existence of operations of express and feeder buses and their integration, predictive BRT standards reveal the chance of improvement. It is important that integrated (physical and fare) feeder routes to be introduced for Rawalpindi/Islamabad BRT. The average distance between the stations of Rawalpindi/Islamabad BRT are designed and executed as per the desired BRT standards. All the required facilities have been provided at all the stations of Rawalpindi/Islamabad BRT. The Provision of overtaking lanes influences the increase in BRT system ridership, peak-hour speed and frequency [25].
5.2.4. Discussion on Multan BRT System Based on Predicted BRT Model
BRT Standard: The predictive BRT standard from the model (Table 10) and waterfall graphic representation (Figure 7) suggests awarding the Bronze BRT standard to the Multan BRT system.
Integration (Physical and Fare): The Multan BRT has separate main and feeder system, this requires passengers to transfer from feeder service to BRT main service. This transfer might be economical in fare, but in time and the walking distance required to change buses and wait for the connecting service will discourage passengers to use BRT, resulting in poor integration.
Table 10 shows that there is no integration between routes and corridors (Table 10—Column G shows “0 = No”) for Multan BRT. If integration exists (Table 13—Column G shows “1 = Yes”) between the routes and corridors, predictive BRT standard model determine improvement in the BRT standard to “Gold” for Multan BRT.
Table 13.
Improvement in Predictive BRT Standard of Multan, if integration exists.
Stations: For the Multan BRT system, all the stations have bus passing lanes (Table 10—Column E), but the operations of express and feeder buses within the trunk corridor are missing. So, this facility exists but it has not been utilised yet. The average distances between the stations of the Multan BRT system are designed and executed as per the desired BRT standards. All the required facilities have been provided at all the stations of the Multan BRT system.
6. Conclusions and Policy Implications
Health, quality of life, and social inclusion boost long-term economic growth and should be central considerations when prioritizing and planning projects that will impact generations to come. To create infrastructure that is not only the best in the world, but the best for the world, social impact should be a key driver when deciding how we build back better. ITDP BRT standards guide in upgrading the operational BRT systems and suggest the possible improvements that could enhance the ratings. Using information available from the BRT systems developed around the world, this paper compares the ITDP BRT system ratings with the statistically developed Predictive BRT standards. Four BRT systems of Pakistan were analysed using the key contributors used for effective BRT operations. In this study we used sample of BRT systems and predicted the scored and unscored BRT systems to evaluate requirements for moving from the existing BRT rating to the higher BRT rating.
The research suggests that ITDP rating can be significantly enhanced if worked in the right direction, taking into account the standards. The Peshawar BRT system is an example to follow for existing and future BRT systems in Pakistan. If the fully integrated network of routes and corridors for the Lahore, Rawalpindi/Islamabad and Multan BRT systems are developed, the model predicts that the Lahore BRT system will upgrade to Silver BRT standard, whereas the Rawalpindi/Islamabad and Multan will be upgraded to Gold BRT standard. Key Performance Indicators (KPI) discussed in the study show that the operation and maintenance of all four BRT’s in Pakistan are operating within the desired range of performance, required as per the International Standards.
The Ratings of BRT corridors could be improved if efforts are made to improve scores under identified sections, such as service planning, universal access and integration. If the fully integrated network of routes and corridors for the Lahore, Rawalpindi/Islamabad and Multan BRT systems are developed, the model predicts that the Lahore and Rawalpindi/Islamabad BRT systems will upgrade to Silver BRT standard and the Multan BRT system to Gold BRT standard. The rankings pave the way for better quality BRT systems, encompassing service, cost effectiveness and efficiency.
This research recommends the following key policy implications for future BRT systems in Pakistan:
- ITDP BRT standards should be followed strictly for future BRT lines to be constructed in Pakistan.
- Improvements in several sectors of the available BRT lines of Pakistan should be made under the umbrella of ITDP Rating Guidelines, so that the BRT system rating is improved.
- A Mass Transit Authority should be established at federal level to make sure that the standardization of BRT lines may be done country wide.
- Policies should be made to ensure that people maximize the use of public transport as their daily mode of travel.
Author Contributions
F.H.: conceptualization; data curation; formal analysis; methodology; writing—original draft. Z.u.R.: supervision; resources; writing—review and editing. A.H.K.: resources; writing—review and editing. M.I.: Software, writing—review and editing. I.K.: writing—review and editing. All authors have read and agreed to the published version of the manuscript.
Funding
This research did not receive any specific grant from funding agencies in the public, commercial, or not-for-profit sectors.
Data Availability Statement
The data presented in this study are available on request from the corresponding author.
Acknowledgments
The authors would like to acknowledge Punjab MassTransit Authority (PMA) and TransPeshawar for sharing the data which became the foundation of all the analysis work.
Conflicts of Interest
The authors declare that they have no competing financial interests or personal relationships that could have appeared to influence the work reported in this paper.
References
- Hidalgo, D. Status of the BRT Industry. In Proceedings of the Presentation at BRT-ALC Centre of Excellence Meeting, Washington, DC, USA, 25 January 2010. [Google Scholar]
- Kepaptsoglou, K.; Milioti, C.; Spyropoulou, D.; Haider, F.; Karlaftis, A.G. Comparing traveler preferences for BRT and LRT systems in developing countries: Evidence from Multan, Pakistan. J. Traffic Transp. Eng. 2018. [Google Scholar] [CrossRef]
- Kepaptsoglou, K.; Milioti, C.; Spyropoulou, D.; Haider, F.; Karlaftis, A.G. Modeling LRT versus BRT preferences in developing countries: The case of Multan, Pakistan. In Proceedings of the Transportation Research Board TRB 95th Annual Meeting, Washington, DC, USA, 10–14 January 2016. [Google Scholar]
- JICA. Transport Department, Government of the Punjab (March, 2012 Volume I). The Project for Lahore Urban Transport Master Plan in the Islamic Republic of Pakistan. Available online: http://uu.urbanunit.gov.pk/Documents/Publications/0/102.pdf (accessed on 2 March 2020).
- National Engineering Services Pakistan (NESPAK). Lahore Metrobus Final Report; Punjab MassTransit Authority (PMA) Government of the Punjab: Lahore, Pakistan, 2014.
- Ulengin, F. An Integrated Transportation Decision Support System for Transportation Policy Decisions: The Case of Turkey. Transp. Res. Part A Policy Pract. 2007, 41, 80–97. [Google Scholar] [CrossRef]
- MVA Asia. Transport Department Government of Punjab. In Lahore Rapid Mass Transit System—Green Line Feasibility Study; Main Report; Government of the Punjab: Lahore, Pakistan, 2007. [Google Scholar]
- National Engineering Services Pakistan (NESPAK). Environmental Impact Assessment of Elevated Section of MBS from Qaddafi Stadium to Bhatti Chowk, Lahore, Final Report; Government of the Punjab: Lahore, Pakistan, 2012.
- Khan, A.B.R.; Shiki, K. Integration of Paratransit into Feeder Bus Services for the Rawalpindi-Islamabad Metro Bus Rapid Transit System in Pakistan. Available online: http://www.ritsumei.ac.jp/research/rdiri/file/kiyou/7-8.pdf (accessed on 8 December 2020).
- National Engineering Services Pakistan (NESPAK). Transporting Modeling for Mass Transit System in Rawalpindi & Islamabad; Study Report; Punjab MassTransit Authority (PMA) Government of the Punjab: Lahore, Pakistan, 2015.
- NTRC. Pre-Requisites for a Dedicated Mass Transit System in Islamabad/Rawalpindi; National Transport Research Centre (NTRC): Islamabad, Pakistan, 2006.
- National Engineering Services Pakistan (NESPAK). “Multan Master Plan” by NESPAK 2014; Technical Report; Multan Development Authority (MDA): Multan, Pakistan, 2014.
- Punjab MassTransit Authority (PMA). Contract for Procurement, Operations and Maintenance of Lahore Metrobuses; Study Report; Government of the Punjab: Lahore, Pakistan, 2013.
- ADB (Asian Development Bank). 48289-002: Peshawar Sustainable Bus Rapid Transit Corridor Project. 25 January 2018. Available online: www.adb.org/projects/48289-002/main#project-pds (accessed on 16 November 2020).
- Irfan, M.; Khurshid, A.N.; Khurshid, M.B.; Ali, Y.; Khattak, A.J. Policy Implications of Work-Trip Mode Choice Using Econometric Modeling. J. Transp. Eng. Part A Syst. 2018, 144, 04018035. [Google Scholar] [CrossRef]
- Deng, T.; Ma, M.; Wang, J. Evaluation of Bus Rapid Transit Implementation in China: Current Performance and Progress. J. Urban Plan. Dev. 2013, 139, 226–234. [Google Scholar] [CrossRef]
- Haider, F.; Rehman, Z.; Zia, B.; Sheikh, U. Alleviating Transportation System Problems by Providing Public Transit Integration in High-Density Metropolitan Cities. Pak. J. Eng. Appl. Sci. 2018, 22, 43–55. [Google Scholar]
- Aziz, R.; Rehman, Z.; Haider, F.; Malik, B. Evaluation of Lahore Bus Rapid Transit Based on Key Performance Indicators. Pak. J. Sci. 2015, 67, 85–93. [Google Scholar]
- Chowdhury, S.; Ceder, A.A.; Schwalger, B. The effects of travel time and cost savings on commuters’ decision to travel on public transport routes involving transfers. J. Transp. Geogr. 2015, 43, 151–159. [Google Scholar] [CrossRef]
- Aziz, A.M.S.; Nawaz, M.; Nadeem, L.A. Examining suitability of the integrated public transport system: A case study of Lahore. Transp. Res. Part A 2018, 117, 13–25. [Google Scholar] [CrossRef]
- Rahman, M.S.-U.; Timms, P.; Montgomery, F. Integrating BRT Systems with Rickshaws in Developing Cities to Promote Energy Efficient Travel. Procedia Soc. Behav. Sci. 2012, 54, 261–274. [Google Scholar] [CrossRef]
- Federal Transit Administration. Improving Transit Integration among Multiple Providers, Volume I: Transit Integration Manual; TCRP Report 173; TRB: Washington, DC, USA, 2014.
- Malik, B.Z.; Rehman, Z.U.; Khan, A.H.; Akram, W. Women’s mobility via bus rapid transit: Experiential patterns and challenges in Lahore. J. Transp. Health 2020, 17, 100834. [Google Scholar] [CrossRef]
- Tabassum, S.; Tanaka, S.; Nakamura, F.; Ryo, A. Feeder Network Design for Mass Transit System in Developing Countries (Case study of Lahore, Pakistan). Transp. Res. Procedia 2017, 25, 3129–3146. [Google Scholar] [CrossRef]
- Adeel, M.; Yeh, A.G.-O.; Zhang, F. Transportation disadvantage and activity participation in the cities of Rawalpindi and Islamabad, Pakistan. Transp. Policy 2016, 47, 1–12. [Google Scholar] [CrossRef]
- Javid, M.A.; Okamura, T.; Nakamura, F.; Wang, R. Comparison of Commuters’ Satisfaction and Preferences with Public Transport: A Case of Wagon Service in Lahore. Jordan J. Civ. Eng. 2013, 7, 1–12. [Google Scholar]
- ITDP (Institute for Transportation and Development Policy). BRT International Standard 2016. Available online: https://www.itdp.org/publication/the-brt-standard/ (accessed on 13 October 2020).
- The TOD Standard. Institute for Transportation and Development Policy TOD Standard, 3rd ed.; ITDP: New York, NY, USA, 2017; Available online: https://www.itdp.org/2017/06/23/tod-standard/ (accessed on 22 October 2020).
- Wright, L.; Hook, W. Bus Rapid Transit Planning Guide, 3rd ed.; ITDP: New York, NY, USA, 2007; Available online: http://www.cityenergy.org.za/uploads/resource_218.pdf (accessed on 15 September 2020).
- Li, Z.; Hensher, D.A. Performance contributors of bus rapid transit systems: An ordered choice approach. Econ. Anal. Policy 2020, 67, 154–161. [Google Scholar] [CrossRef]


Publisher’s Note: MDPI stays neutral with regard to jurisdictional claims in published maps and institutional affiliations. |
© 2021 by the authors. Licensee MDPI, Basel, Switzerland. This article is an open access article distributed under the terms and conditions of the Creative Commons Attribution (CC BY) license (http://creativecommons.org/licenses/by/4.0/).