Abstract
Inflation and CO2 emission are the two most deleterious elements in the construction industry. However, so far no linkage between the two has been estimated. Therefore, this study examines the relationship between carbon dioxide (CO2) emission and the inflation rate in the construction industry of Malaysia and proposes a CO2 emission calculator framework. As it is not possible to calculate the effect directly, therefore, an indirect assessment of the correlation coefficient was performed between the inflation rate (independent variable) and construction rates, i.e., building material prices and value of construction work (dependent variables) along with percentage deviation of each variable. The results show that with a decrease in the inflation rate, the prices of the building materials also decrease, whereas the value of the construction work increases. The relationship looks attractive from an end-user perspective, but it creates a major problem of CO2 emission. The effect impacts directly on environmental sustainability as it is not suitable for the greenhouse effect because it triggers CO2 emission. While estimating how much CO2 emission occurs from the value of construction work of Malaysia, it was revealed that there is no such calculator available to perform the estimation. Therefore, a CO2 emission calculator framework is proposed, which will be beneficial after its practical implementation for the construction industry stakeholders and government/policy makers to monitor the emissions and control the adverse effects of massive construction work.
1. Introduction
The inflation rate is inescapable in the economic world and influences developed and developing country in a negative or positive way [1]. The inflation rate is a critical factor that leads toward economic and social disorder, and it is being widely tested empirically and theoretically. The impact of the inflation rate is also seen on other economic variables, including the prices of materials [2,3,4]. Changes in the inflation rate are challenging to quantify, whereas a reliable forecast is essential for monetary policy [5,6]. In the economic world, money power never remains stagnant, which shows the importance of the inflation rate [7]. One-third of nations depend on the foremost resources as a major source of economic development and income [8,9,10,11]. However, when aiming to achieve a sustainable economic growth faster, neither the bequeathed material resources nor the immense human resources matter besides the industrial capacity, enterprise development, and technological innovation [12]. That is why the manufacturing sector has a starring role in establishing a nation’s economic competence [13]. Within the manufacturing sector, the role of the construction industry cannot be snubbed as it is one of the top consumers of goods and services [14]. The construction industry is also important from an economic perspective, as it contributes extensively to national socioeconomic development. Construction activities are linked with every economic aspect and are fundamentally consistent with economic growth [15]. Construction industry spending worldwide is shown in Figure 1.
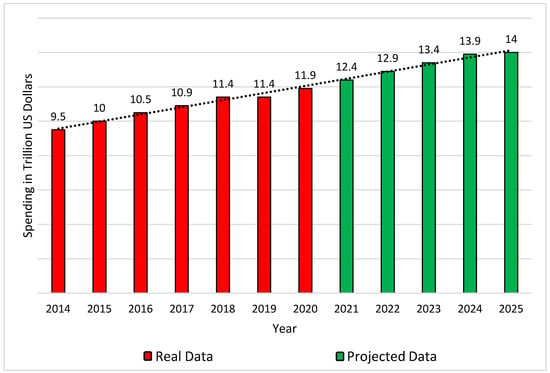
Figure 1.
Construction industry spending worldwide [16].
Figure 1 illustrates that the worldwide spending in the construction industry has increased significantly from 2014 to 2020, and it is projected to continue rising more until 2025 [16]. There are three levels of construction: an economic activity that entails the extensive construction process starting from producing raw building materials to refined construction elements and offering services to execute the construction project [17]. Keeping this view in consideration, construction is deemed to be an economic activity that traverses all three economic sectors. Natural resources extraction is the primary sector; the manufacturing of building materials and refined components is the second sector; and the application of these building materials through consultancy services and design and structural engineering is the third sector [18]. However, the inflation rate becomes a major distress as it impacts negatively on the construction industry [19]. Therefore, the influence of the inflation rate on the construction industry cannot be overlooked [20]. In a construction project budget, 35% to 60% of the cost belongs to building materials [21,22], which is being affected by the inflation rate annually [23,24]. The inflation rate keeps influencing the construction sector and is ignored initially, where clients keep paying an excessive project cost that rises due to the inflation rate effect [25].
In a time where major advancements have been brought to each sector to get the foremost benefits, major adverse effects have also shown up in the form of extended-release of harmful gases into the atmosphere [26]. In developing countries, the increased population and economic growth have caused greenhouse gases emissions [27]. With rising construction activities, the carbon dioxide (CO2) emission rate has increased extensively, causing global warming [28]. The construction industry contributes heavily to CO2 emission, either by combustion of cement [29], manufacturing of steel and other building components [30], and even by construction machinery operation [28]. There are numerous materials linked to the construction industry and every material production represents a separate industry. For instance, after water, concrete is the most consumed man-made product worldwide. Where cement is the key ingredient of concrete, it produces 8% of the CO2 emission worldwide [31]. Moreover, 30% of the lifespan of construction equipment and machinery is spent in idling, which is harmful as it releases toxic gases from the burning of diesel fuel [28].
Hence, this study intends to investigate the effect of the inflation rate on CO2 emission in the construction industry of Malaysia. The impression cannot be quantified directly, which is why a strategy is drawn where, first, the role of the inflation rate in deviating the construction rates, i.e., building material prices, is examined. In the same manner, the role of the inflation rate with regard to the value of the construction work is established. Also, the percentage deviation of every component is determined, and a link with CO2 emission is established. Moreover, a framework is presented that portrays the impact of the inflation rate on the construction industry and sustainability. Besides that, how CO2 emission can be calculated in the construction industry is determined. This study is novel in such a way that the relationship of the inflation rate to CO2 emission is developed that can bring reforms to the construction industry. Also, there is the lack of a CO2 emission calculator and, based on this study, a future direction is provided as to how an accurate calculation can be performed. This study sets a benchmark for the policy makers to incorporate the inflation rate and come up with a solution to control CO2 emission from the construction projects.
2. Methodology
To evaluate the relationship of the inflation rate to CO2 emission, the methodology was divided into the following phases. In the first phase, data were collected from the Government Department of Malaysia. In the second phase, the correlation coefficient was performed through the Statistical Package for Social Sciences (SPSS) to examine the impact of the inflation rate on the construction rates, i.e., building material prices, and on the value of construction work within Malaysia, along with calculating the percentage deviation of each. In the third phase, a connection of the inflation rate with the CO2 emission was drawn based on the findings. In the final phase, a CO2 emission calculator framework was provided. The detailed methodology is presented in Figure 2.
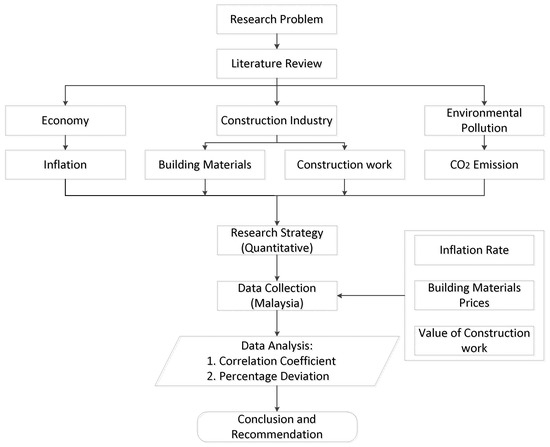
Figure 2.
Research flowchart.
2.1. Data Collection
Three main variables were examined within this study, i.e., inflation rate, building material prices, and the value of construction work. The inflation rate, as shown in Figure 3, and value of construction work data, as shown in Figure 4, were collected from the Department of Statistics Malaysia [32] for the years 2013 to 2019, whereas, construction rates data, consisting of 17 major categories and 70 subcategories, were collected from the National Construction Cost Centre [23,33] for the same years. The main categories comprised: (1) Sand, (2) Cement, (3) Steel Reinforcement, (4) Bricks, (5) Aggregate, (6) Roofing, (7) Ceiling Board, (8) Walls and Floor Tiles, (9) Ironmongery, (10) Plumbing Works, (11) Timber, (12) Sanitary Fitting, (13) Ready Concrete Mix, (14) Paints, (15) Plywood, (16) Glass, and (17) Steel and Metal Sections.
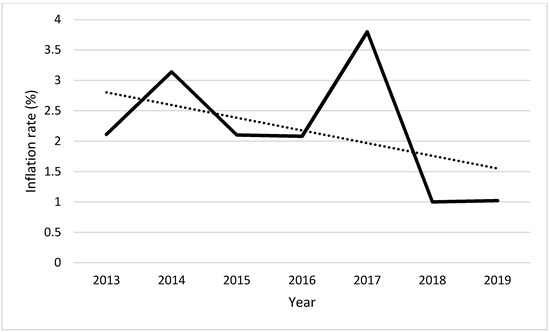
Figure 3.
Inflation rate and its trend.
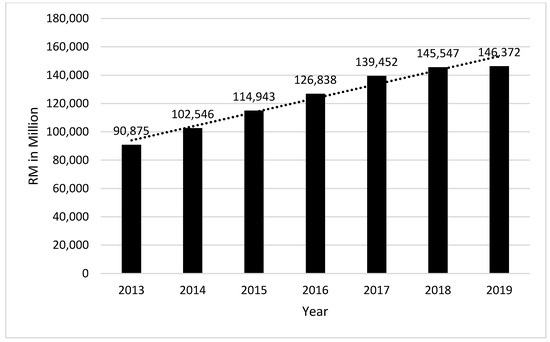
Figure 4.
Value of construction work in Malaysia.
It can be observed from Figure 3 that there was a fluctuation within the inflation rate from the year 2013 to 2019. The highest inflation rate was recorded in 2017, whereas the lowest was in 2018. A downward trend over time, highlighted by the dotted line, can also be observed, indicating the overall decrease in the inflation rate. Whereas, from Figure 4, it can be observed that the value of construction work increased every year, and the dotted line shows a clear upward trend over the years, indicating an increase in the value of the construction work within the study period.
2.2. Data Analysis
2.2.1. Data Linearity
Before conducting the analysis, mainly the correlation test, it was important to observe the behavior of the data, whether there was a linear or nonlinear relationship. The purpose of observing the relationship was due to the dependency on the test of whether to perform the Pearson correlation or the Spearman correlation. If the data exhibited a linear relationship, a Pearson correlation needed to be performed; however, in the case of a nonlinear relationship, the Spearman correlation was preferable [34,35]. To observe the phenomena, a graph was constructed where the inflation rate was plotted on the X-axis and materials prices on the Y-axis, as shown in Figure 5. In the same manner, another graph was constructed showing the relationship between the inflation rate and the value in construction, as shown in Figure 6.
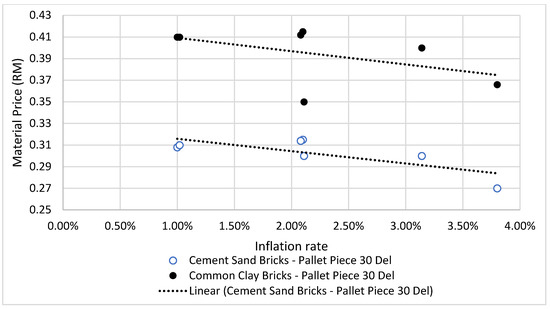
Figure 5.
Nonlinear relationship of inflation with material prices.
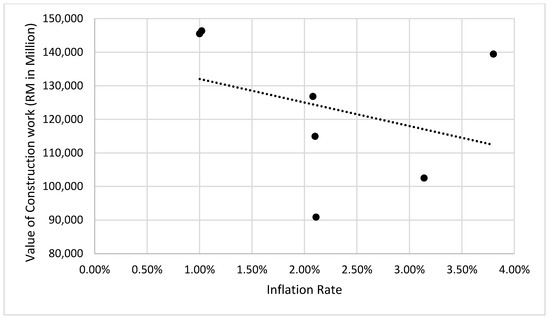
Figure 6.
Nonlinear relationship of inflation with value of construction.
As the categories of material prices were very high and it was not possible to show the relationship of every individual material type, therefore, only two material (cement sand bricks and common clay bricks) relationships were plotted. It can be observed from Figure 5 that the prices were very far away from the imaginary linear trendline, which indicates that the data hold a nonlinear behavior. The same case is observed in Figure 6 in the middle of the inflation rate and the value of construction work. Therefore, the Spearman correlation test was performed for further analysis.
2.2.2. Spearman Correlation Test
The Spearman correlation, also known as the Spearman rank-order correlation coefficient, measures the strength of nonparametric data and indicates the path of the alliance among two variables. It is denoted by Rs and can be calculated by using Equation (1):
where “d” is the difference and “n” represent the total number of variables.
The coefficient value should be from −1 to +1, which indicates whether the association is negatively or positively correlated. The relationship scale varies, where the value in between 0.00 and 0.19 is a very weak relationship, between 0.20 and 0.39 is a weak relationship, 0.40 and 0.59 is a moderate relationship, 0.60 and0.79 is a strong relationship and 0.80 and 1.00 is a very strong relationship [36]. Whereas the coefficient value ± ≥0.5 is considered as an acceptable relationship [37].
2.2.3. Percentage Deviation
The percentage deviation of the inflation rate, construction rates, and value of construction work was calculated using Equation (2), where the average percentage deviation of materials prices during each year was estimated:
3. Results and Discussion
3.1. Inflation and Construction Rates Relationship
The Spearman correlation test was conducted where the independent variable was the inflation rate and the dependent variable was the construction rates (building material prices). The summary of the correlation coefficient is discussed in Table 1. It can be observed that most of the construction rates showed a very strong relationship with the inflation rate, implying that the variation in the inflation rate of Malaysia also influences the building material prices. The individual correlation coefficient of each material subcategory is presented in Appendix A.

Table 1.
Summary of correlation coefficient of inflation with building materials prices.
Most of the material subcategories showed an acceptable relationship, proving that the inflation rate directly influences the construction rates. Looking at the trend line of the inflation rate in Figure 3 and building material prices in Figure 4, it can be observed that with time the inflation rate in Malaysia decreased, which reduced the prices of the materials. However, the decline in the inflation rate is a matter of concern because, with the reduction in prices, their demand increased, and with increasing demand, the value of construction work increased extensively, as indicated in Figure 3. To strengthen the scenario further, the correlation coefficient was also determined between the inflation rate and the value of construction work in Malaysia.
3.2. Inflation and Value of Construction Work Relationship
As with the inflation rate and construction rates, the Spearman correlation was conducted between the inflation rate (independent variable) and the value of construction work (dependent variable), as shown in Table 2.

Table 2.
Correlation coefficient of inflation with value of construction work.
Table 2 shows that the inflation rate possesses an acceptable relationship with the value of construction work in Malaysia. Therefore, further assessment can be made based on these relationships.
3.3. Percentage Deviation Calculations
The percentage deviation of inflation rate was calculated using Equation (2) and is presented in Figure 7.
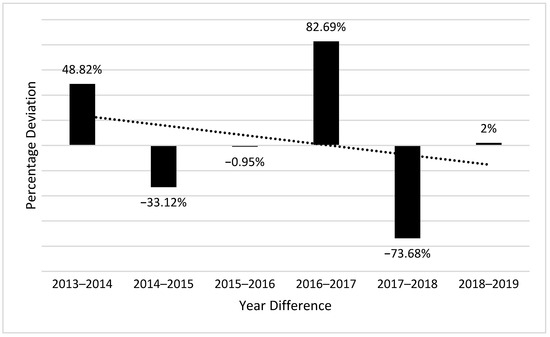
Figure 7.
Inflation percentage deviation.
In 2016–2017, the maximum percentage deviation occurred, whereas an abrupt drop was observed in 2017–2018. In the same manner, the percentage deviation of construction rates was calculated, as shown in Figure 8.
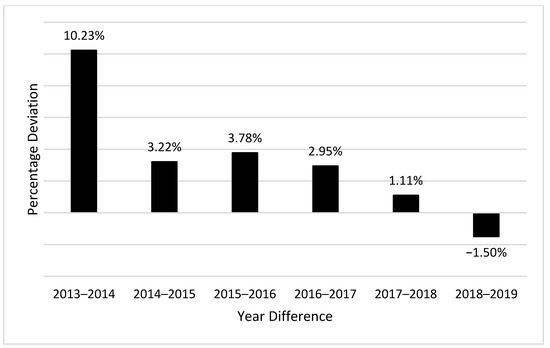
Figure 8.
Construction rates percentage deviation.
From Figure 8, a clear understanding can be drawn that over time a reduction was seen in construction rates, where the maximum percentage deviation was recorded in 2013–2014 and minimum in 2018–2019. The percentage deviation was also computed for the value of construction work in Malaysia, as shown in Figure 9.
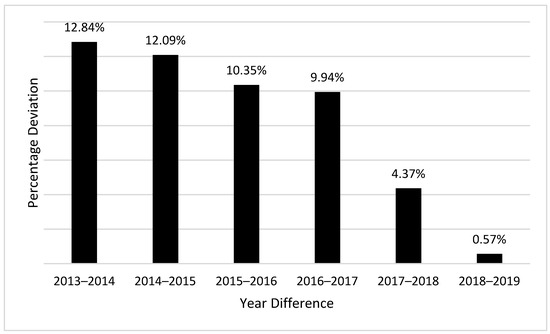
Figure 9.
Value of construction work percentage deviation.
It can be observed from Figure 9 that over time a positive deviation occurred, showing the increasing amount of construction work in Malaysia. Looking at the percentage deviation of the inflation rate, construction rates, and the value of construction work, it can be observed by taking the average deviation of each that if the inflation rate deviates up to 4.29%, it will drive the building material prices up to 3.30%, where an increase in the value of construction work will occur up to 8.36%. Till now, it has been evident that the inflation rate in Malaysia decreases with decreased building material prices. With the decreasing prices, the construction demand increases. Although it seems acceptable, it is creating a huge problem for the environment. The increase in the construction work is related to the increase in the production of the materials, which is causing the emission of CO2. Regrettably, this has been ignored and the lower inflation rate is considered as an achievement in the economic world. However, the relationship of construction to the inflation rate is badly affecting the environment with more CO2 emission.
3.4. Conceptual Framework
Based on the statistical analysis, a conceptual framework was drawn, showing the connectivity of the inflation rate with CO2 emission. The framework is presented in Figure 10.
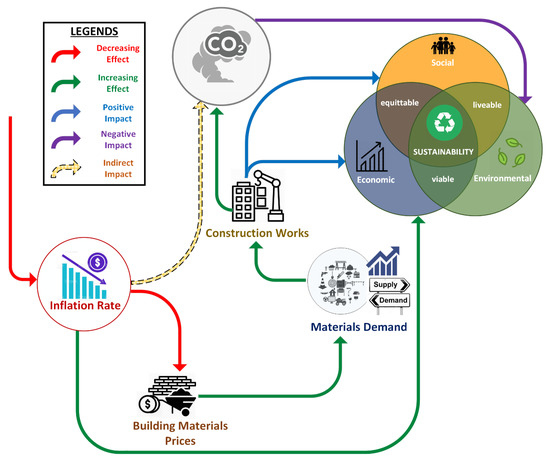
Figure 10.
Conceptual framework.
Figure 10 illustrates that when the inflation rate decreases, it also decreases the building material prices, which increases the demand for the materials in the industry. The increasing demand with low material prices pushes the end-users to grab the opportunity and perform more construction work before the prices rise again. With the increasing demand, the manufacturing industry produces more materials so the construction work can be performed on time. Although the increase in the construction work is beneficial from an economic and social sustainability perspective, it is rapidly increasing the CO2 emission, which is affecting environmental sustainability. This slowly becomes an intolerable case because with increasing construction work and manufacturing processes, more CO2 emission occurs. The low inflation rate is favorable for economic and social sustainability but not suitable for environmental sustainability. The whole scenario proves an inverse relationship of the inflation rate with CO2 emission. Therefore, much attention is required to control the decreasing effect of the inflation rate for the betterment of the environment as environmental sustainability is also linked with economic and social sustainability, and if that is affected, it impacts the whole sustainability cycle.
3.5. Precautionary Measurements
Over time CO2 emission drastically increases, showing an adverse effect on the environment. To deal with this issue various researchers have suggested implementing sustainable construction and adopting zero energy building, however, they neglect the fact that even the materials utilized in the process produced through the same manufacturing industry also contribute to CO2 emission. The best way is to control the inflation rate and keep it steady at some mid-point. The economist needs to investigate this matter while setting the interest rate and other parameters that result in the setting of the inflation rate.
3.6. CO2 Emission Calculator Framework
Although there are various CO2 emission calculators available, none of them can calculate the CO2 emission from the value of construction work. In the beginning, this study also aimed to calculate the CO2 emission based on the value of construction work. However, after reviewing the literature it was revealed that there is no such calculator available that can estimate the CO2 emission based on the value of construction work. Therefore, a future direction framework is presented in Figure 11, which will be beneficial to estimate CO2 emission based on the value of construction work.
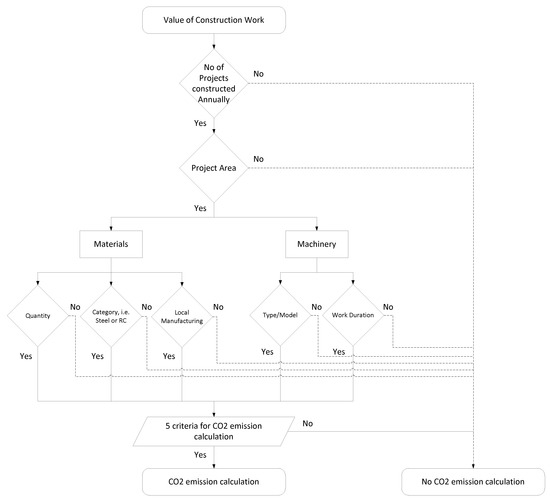
Figure 11.
Future direction framework.
To calculate the CO2 emission from the value of construction work, the most essential data required are the number of projects constructed each year. Subsequently, for each construction project, the area is required in which the project was executed. Once this information is collected, then the details of materials and machinery are required. In terms of materials, the material quantity, category of material used, i.e., steel or reinforced concrete (RC), along with the description of each material and whether it was produced within the country is required. This is due to the fact that if the materials are imported, the CO2 emission during the manufacturing process will be counted toward that manufacturing country. The role of machinery is also important during the project life cycle as it emits an extensive amount of CO2. Therefore, to monitor the CO2 emission, machinery type and machinery working duration data are required. In a nutshell, this phenomenon sets five criteria to calculate the amount CO2 emission, i.e., material quantity, material category, material manufacturing location, machinery type and machinery working duration. Here, reverse engineering is required to calculate the CO2 emission from the executed projects in the past, based on the future CO2 emission from the value of construction work that can be forecasted. This framework is applicable for all the countries as the parameters are constant.
4. Conclusions
Reduction in the inflation rate is causing an increase in CO2 emission, and to prove this scenario, this study was performed. As it was not possible to examine a direct relationship, it was evaluated indirectly. First, a correlation coefficient was performed between the inflation rate and construction rates and then between the inflation rate and the value of construction work; later a percentage deviation was determined. It was observed that the variables possessed an acceptable relationship, proving that, with a decrease in the inflation rate, material prices decrease, which increases the construction work. Also, the deviation in the inflation rate up to 4.29% drives the building material prices up to 3.30%, boosting the value of construction work up to 8.36%. The increase in construction work requires more materials, and when the manufacturing industry starts production, a significant amount of additional CO2 is emitted, causing environmental pollution, affecting the whole sustainability cycle. Moreover, to estimate the CO2 emission from the value of construction work, it was revealed that there is no such calculator available that can estimate CO2 emission. That is why a future framework for CO2 emission is proposed in this study to have its practical implementation in the construction industry.
5. Future Direction
This study can further be extended by performing the same correlation test on the building material prices of various countries to estimate the relationship with the inflation rate. By doing this, a uniform policy can be adopted to avoid the adverse effects of the inflation rate on the construction industry. Moreover, a CO2 emission calculator framework requires practical implementation so that a new calculator can be made available for the construction industry stakeholders to monitor the CO2 emission in ongoing and off-going construction projects. The calculator will also be beneficial for government authorities to monitor the CO2 emission in their country.
Author Contributions
All authors (M.A.M., W.S.A., M.S.L., A.M. and A.H.Q.) contributed equally to this research. All authors have read and agreed to the published version of the manuscript.
Funding
This research received no external funding.
Institutional Review Board Statement
Not applicable.
Informed Consent Statement
Not applicable.
Data Availability Statement
All the data is available within this manuscript.
Acknowledgments
The authors would like to appreciate YUTP grant with Cost Centre (015LC0-088) of Universiti Teknologi PETRONAS for the support.
Conflicts of Interest
The authors declare no conflict of interest.
Appendix A

Table A1.
Individual correlation coefficient of inflation with building materials prices.
Table A1.
Individual correlation coefficient of inflation with building materials prices.
| S. No. | Category of Building Material Prices | Spearman Correlation |
|---|---|---|
| 1 | Sand | |
| 1.1 | Normal River Sand- Ex | −0.250 |
| 1.2 | Fine River Sand for Plastering -Ex | −0.179 |
| 1.3 | Normal Mining Sand | −0.143 |
| 1.4 | Fine Mining Sand for Plastering | −0.393 |
| 2 | Cement | |
| 2.1 | Ordinary Portland Cement, 50 kg bag | 0.786 * |
| 2.2 | Ordinary Portland Cement in Bulk | 0.893 * |
| 3 | Steel Reinforcement | |
| 3.1 | Mild Steel Round Bar R10, MS146 | 0.107 |
| 3.2 | Mild Steel Round Bar R12, MS146 | 0.107 |
| 3.3 | Mild Steel Round Bar R16, MS146 | −0.214 |
| 3.4 | High Tensile Deformed Bar-Y10, MS146 | 0.036 |
| 3.5 | High Tensile Deformed Bar-Y12, MS146 | 0.036 |
| 3.6 | High Tensile Deformed Bar-Y16, MS146 | 0.179 |
| 3.7 | High Tensile Deformed Bar-Y20, MS146 | 0.179 |
| 3.8 | High Tensile Deformed Bar-Y25, MS146 | 0.179 |
| 3.9 | High Tensile Deformed Bar-Y32, MS146 | 0.179 |
| 3.10 | BRC A6, MS145 | −0.750 * |
| 3.11 | BRC A7, MS145 | −0.429 |
| 3.12 | BRC A8, MS145 | −0.536 * |
| 3.13 | BRC A9, MS145 | −0.571 * |
| 3.14 | BRC A10, MS145 | −0.571 * |
| 4 | Bricks | |
| 4.1 | Common Clay Bricks-Pallet | −0.630 * |
| 4.2 | Cement Sand Bricks-Pallet | −0.730 * |
| 5 | Aggregate | |
| 5.1 | Granite Aggregate 3/4” | 0.036 |
| 6 | Roofing | |
| 6.1 | Interlocking Concrete Tiles-Standard Duotone Color 420 mm × 330 mm | −0.250 |
| 6.2 | MS Decking-Ajiya AP Rib Hi-Tensile G26, 0.47 mm TCT, Clean Colorbond (Commercial) | −0.821 * |
| 6.3 | MS Decking-Ajiya AP Rib Hi- Tensile G24, 0.53 mm TCT, Clean Colorbond (Commercial) | −0.786 * |
| 6.4 | MS Decking-Ajiya Euro Step Roofing M350 G28, 0.40 mm TCT, Clean Colorbond | −0.821 * |
| 6.5 | MS Decking-Ajiya Euro Step Roofing M350 G26, 0.47 mm TCT, Clean Colorbond | −0.714 * |
| 6.6 | Corrugated Roofing Sheet-76 mm Double Width, 1065 mm × 2440 mm × 4 mm (Hume/Malex/UAC) | −0.821 * |
| 7 | Ceiling Board | |
| 7.1 | Plain Cellulose Fiber Ceiling Sheet,610 mm × 1220 mm × 3.2 mm (UAC/MALEX/HUME) | −0.286 |
| 7.2 | Plain Cellulose Fiber Ceiling Sheet,610 mm × 1220 mm × 4.5 mm (UAC/MALEX/HUME) | −0.714 * |
| 7.3 | Plain Gypsum Board, 610 mm × 1220 mm × 9.5 mm, (Boral/Armstrong) | −0.714 * |
| 8 | Walls and Floor Tiles | |
| 8.1 | Plain Homogeneous Floor Tiles, Standard light Color, 300 mm × 300 mm × 8 mm-Grade 1 | −0.357 |
| 8.2 | Glazed Ceramic Wall Tiles, Standard light Color, 200 mm × 250 mm × 6 mm-Grade 1 | −0.536 * |
| 9 | Ironmongery | |
| 9.1 | CL03-Duraset brand residential grade 3 cylindral knobsets-PRIVACY-CL0363010 | 0.357 |
| 9.2 | CL03-Duraset brand residential grade 3 cylindral knobsets-PATIO-CL0363020 | 0.500 * |
| 9.3 | CL03-Duraset brand residential grade 3 cylindral knobsets-PASSAGE-CL0363030 | −0.306 |
| 9.4 | Concorde 102 mm × 76 mm × 2.0 mm SS hinge SUS 304 | −0.360 |
| 9.5 | CL03- Duraset Brand Residential Grade 3 Cylindrical Knobsets-ENTRANCE-CL0363000 | 0.571 * |
| 10 | Plumbing Works | |
| 10.1 | PVC Pressure Pipes Class D Gray Color-50 mm Diameter (paling), MS628 | −0.214 |
| 10.2 | PVC Pressure Pipes Class E Gray Color-25 mm Diameter (paling), MS628 | −0.214 |
| 10.3 | HDPE Pipe PN 16–25 mm Diameter, MS 1058 | −0.607 * |
| 10.4 | HDPE Pipe PN 16–50 mm Diameter, MS 1058 | −0.429 |
| 11 | Timber | |
| 11.1 | GMS Heavy Hardwood, Balau 1 | −0.126 |
| 11.2 | GMS light Hardword, Dark Red Meranti | −0.054 |
| 11.3 | GMS Medium Hardword, Kapur | −0.090 |
| 11.4 | Scantling Medium Hardword, Kapur | −0.090 |
| 12 | Sanitary Fitting | |
| 12.1 | Polyethylene water tank (Polytank), Circular- 200 gallons, MS 1225-weida equivalent | −0.607 * |
| 12.2 | Water Closet Western Type- WC 644, white color without cistern, claytan | −0.357 |
| 12.3 | Urinal Bowl, santana 320 c/w hanger, flange, ceramic waste & cleaning set, johnson-suisse | −0.571 * |
| 12.4 | Stainless Steel Sinks-Single Bowl Single Drainer- Lay on Type, 42”x18” | −0.714 * |
| 13 | Ready Concrete Mix | |
| 13.1 | Ready Mix Concrete-Normal Mix-Grade15, Granite | 0.643 * |
| 13.2 | Ready Mix Concrete-Normal Mix-Grade 20, Granite | 0.679 * |
| 13.3 | Ready Mix Concrete-Normal Mix-Grade 25, Granite | 0.643 * |
| 13.4 | Ready Mix Concrete-Normal Mix-Grade 30, Granite | 0.643 * |
| 13.5 | Ready Mix Concrete-Normal Mix-Grade 35, Granite | 0.643 * |
| 14 | Paints | |
| 14.1 | Paint-ICI dulux standard color-Undercoat speed | 0.679 * |
| 14.2 | Paint-ICI dulux standard color-external acrylic emulsion, weathershield | −0.786 * |
| 14.3 | Paint-Nippon standard color-timber/wood, timber finish | −0.571 * |
| 14.4 | Paint-ICI Dulux Standard Color Gloss Oilbased, Gloss Finish (5 L) | −0.893 * |
| 15 | Plywood | |
| 15.1 | Plywood-shuttering board, 4 × 8 × 12 mm | −0.643 * |
| 16 | Glass | |
| 16.1 | Clear Float Glass 5 mm Thk, Local/Imported | −0.714 * |
| 16.2 | Tinted Float Glass 6 mm Thk, Local / Imported, Inclusive of Cutting | −0.714 * |
| 17 | Steel & Metal Sections | |
| 17.1 | Square hollow sections-12 mm × 12 mm × 1.0 mm (0.357 kg/m) | −0.607 * |
| 17.2 | Square Hollow Sections-50 mm × 50 mm × 3.0 mm (4.38 kg/m) | −0.179 |
| 17.3 | Square Hollow Sections-150 mm × 150 mm × 4.0 mm (20.20 kg/m) | 0.286 |
| 17.4 | Universal beams-102 mm × 102 mm × 8.76 mm (19.35 kg/m) | 0.500 * |
| 17.5 | Universal beams-400 mm × 400 mm (2.17 kg/m) | 0.429 |
| 17.6 | Equal angles-38 mm × 38 mm × 3.8 mm (2.17 kg/m) | 0.429 |
| 17.7 | Equal angles-50 mm × 50 mm × 4 mm (3.06 kg/m) | 0.429 |
* Acceptable relationship = ± ≥ 0.5.
References
- Writer, H.A. Impact of Inflation on Government Spending in Nigerian Economy (1981–2013). Available online: https://nairaproject.com/projects/886.html (accessed on 10 December 2020).
- Anyanwu, J.C. International remittances and income inequality in Africa. Rev. Econ. Bus. Stud. 2011, 4, 117–148. [Google Scholar]
- Feldkircher, M.; Siklos, P.L. Global inflation dynamics and inflation expectations. Int. Rev. Econ. Financ. 2019, 64, 217–241. [Google Scholar] [CrossRef]
- Oikawa, K.; Ueda, K. The optimal inflation rate under Schumpeterian growth. J. Monet. Econ. 2018, 100, 114–125. [Google Scholar] [CrossRef]
- Gülşen, E.; Kara, H. Measuring inflation uncertainty in Turkey. Cent. Bank Rev. 2019, 19, 33–43. [Google Scholar] [CrossRef]
- Szafranek, K. Bagged neural networks for forecasting Polish (low) Inflat. Int. J. Forecast. 2019, 35, 1042–1059. [Google Scholar] [CrossRef]
- Osabuohien, E.S.; Obiekwe, E.; Urhie, E.S.; Osabohien, R. Inflation rate, exchange rate volatility and exchange rate pass-through Nexus: The Nigerian experience. J. Appl. Econ. Sci. 2018, 2, 574–585. [Google Scholar]
- Amano, R.A.; Van Norden, S. Terms of trade and real exchange rates: The Canadian evidence. J. Int. Money Financ. 1995, 14, 83–104. [Google Scholar] [CrossRef]
- Cashin, P.; Céspedes, L.F.; Sahay, R. Commodity currencies and the real exchange rate. J. Dev. Econ. 2004, 75, 239–268. [Google Scholar] [CrossRef]
- Chen, Y.-C.; Rogoff, K. Commodity currencies. J. Int. Econ. 2003, 60, 133–160. [Google Scholar] [CrossRef]
- Yu-Chin, C.; Kenneth, R. Are the commodity currencies an exception to the rule? Glob. J. Econ. 2012, 1, 1250004. [Google Scholar] [CrossRef]
- Olamade, O.O.; Oyebisi, T.O.; Olabode, S.O. Strategic ICT-use intensity of manufacturing companies in Nigeria. J. Asian Bus. Strategy 2014, 4, 1. [Google Scholar]
- Amakom, U. Manufactured exports in Sub-Saharan African economies: Econometric tests for the learning by exporting hypothesis. Am. Int. J. Contemp. Res. 2012, 24, 195–206. [Google Scholar]
- Hillebrandt, P.M. Analysis of the British Construction Industry; Springer: Berlin/Heidelberg, Germany, 1984. [Google Scholar]
- Oladinrin, T.; Ogunsemi, D.; Aje, I. Role of construction sector in economic growth: Empirical evidence from Nigeria. Futy J. Environ. 2012, 7, 50–60. [Google Scholar] [CrossRef]
- Statista. Construction Industry Spending Worldwide from 2014 to 2025. 2020. Available online: https://www.statista.com/statistics/788128/construction-spending-worldwide/#:~:text=In%202018%2C%20the%20construction%20industry,trillion%20U.S.%20dollars%20in%202025.&text=Construction%20spending%20is%20an%20economic,is%20spent%20on%20new%20construction (accessed on 10 December 2020).
- Dang, G.; Pheng, L.S. Infrastructure Investments in Developing Economies; Springer Science Business Media: Singapore, 2015; Volume 10, pp. 978–981. [Google Scholar]
- Gruneberg, S.L. Construction Economics: An Introduction; Macmillan International Higher Education: London, UK, 1997. [Google Scholar]
- Alinaitwe, H.; Apolot, R.; Tindiwensi, D. Investigation into the causes of delays and cost overruns in Uganda’s public sector construction projects. J. Constr. Dev. Ctries. 2013, 18, 33. [Google Scholar]
- Khan, R.A.; Liew, M.S.; Ghazali, Z.B. Malaysian construction sector and Malaysia vision 2020: Developed nation status. Procedia-Soc. Behav. Sci. 2014, 109, 507–513. [Google Scholar] [CrossRef]
- Bourne, L.S. The Geography of Housing. Real Estate Econ. 1986, 14, 173–174. [Google Scholar] [CrossRef]
- Windapo, A.; Cattell, K. Perceptions of key construction and development challenges facing the construction industry in South Africa. 2010. Available online: https://www.irbnet.de/daten/iconda/CIB_DC22754.pdf (accessed on 10 December 2020).
- Musarat, M.A.; Alaloul, W.S.; Liew, M.; Maqsoom, A.; Qureshi, A.H. Investigating the impact of inflation on building materials prices in construction industry. J. Build. Eng. 2020, 32, 101485. [Google Scholar] [CrossRef]
- Musarat, M.A.; Alaloul, W.S.; Liew, M. Impact of inflation rate on construction projects budget: A review. Ain Shams Eng. J. 2020. [Google Scholar] [CrossRef]
- Shah, R.K. An Exploration of Causes for Delay and Cost Overruns in Construction Projects: Case Study of Australia, Malaysia & Ghana. J. Adv. Coll. Eng. Manag. 2016, 2, 41–55. [Google Scholar] [CrossRef][Green Version]
- Alaloul, W.S.; Musarat, M.A. Impact of Zero Energy Building: Sustainability Perspective, in Sustainable Sewage Sludge Management and Resource Efficiency; IntechOpen: London, UK, 2020. [Google Scholar]
- Zhang, X.; Chen, Y.; Jiang, P.; Liu, L.; Xu, X.; Xu, Y. Sectoral peak CO2 emission measurements and a long-term alternative CO2 mitigation roadmap: A case study of Yunnan, China. J. Clean. Prod. 2020, 247, 119171. [Google Scholar] [CrossRef]
- Hassani, M. Construction Equipment Fuel Consumption during Idling: Characterization using multivariate data analysis at Volvo CE. 2020. Available online: https://www.diva-portal.org/smash/get/diva2:1444797/FULLTEXT01.pdf (accessed on 10 December 2020).
- Liu, Z.; Ciais, Z.; Deng, Z.; Davis, S.J.; Zheng, B.; Wang, Y.; Cui, D.; Zhu, B.; Dou, X.; Ke, P.; et al. Carbon Monitor: A near-real-time daily dataset of global CO2 emission from fossil fuel and cement production. arXiv 2020, arXiv:2006.07690. [Google Scholar] [CrossRef] [PubMed]
- Wang, Y.; Wen, Z.; Yao, J.; Dinga, C.D. Multi-objective optimization of synergic energy conservation and CO2 emission reduction in China’s iron and steel industry under uncertainty. Renew. Sustain. Energy Rev. 2020, 134, 110128. [Google Scholar] [CrossRef]
- Rodgers, L. Climate Change: The Massive CO2 Emitter You May Not Know about. 2018. Available online: https://www.bbc.com/news/science-environment-46455844 (accessed on 10 December 2020).
- DOSM. Available online: https://www.dosm.gov.my/v1/ (accessed on 10 December 2020).
- National Construction Cost Centre. New Rates & Fees for Construction Materials Quality Control Program. Available online: https://www.cidb.gov.my/index.php/en/construction-info/quality/construction-material/new-rates-fees-construction-materials-quality (accessed on 10 December 2020).
- Kornbrot, D. Spearman’s Rho. In Encyclopedia of Statistics in Behavioral Science; Wiley: Hoboken, NJ, USA, 2005. [Google Scholar]
- Minitab. A Comparison of the Pearson and Spearman Correlation Methods. Available online: https://support.minitab.com/en-us/minitab-express/1/help-and-how-to/modeling-statistics/regression/supporting-topics/basics/a-comparison-of-the-pearson-and-spearman-correlation-methods/ (accessed on 10 December 2020).
- Fulton, B. Interpreting Correlations. 2019. Available online: https://www.staymetrics.com/2019/09/interpreting-correlations/ (accessed on 10 December 2020).
- Solutions, S. Pearson’s Correlation Coefficient. 2020. Available online: https://www.statisticssolutions.com/pearsons-correlation-coefficient/ (accessed on 10 December 2020).
Publisher’s Note: MDPI stays neutral with regard to jurisdictional claims in published maps and institutional affiliations. |
© 2021 by the authors. Licensee MDPI, Basel, Switzerland. This article is an open access article distributed under the terms and conditions of the Creative Commons Attribution (CC BY) license (http://creativecommons.org/licenses/by/4.0/).