Abstract
Green areas are necessary components of contemporary cities. They have a positive impact on the climate, ecological balance and resilience of the city structure, and provide numerous benefits to inhabitants. However, progressing urbanisation and a rise in urban population leads to increasing pressure on existing green spaces. Since the beginning of the twenty-first century, but especially over the past decade, the number of new developments in Krakow has been successively increasing. New multi- and single-family housing complexes are built not only in peripheral areas, but also as infilling and development of areas closer to the historical city centre. Simultaneously, the number of urban green spaces has increased only insignificantly. This paper analyses the example of Młynówka Królewska Park, located in the western part of Krakow, Poland. It focuses on city expansion processes and their relationship with public greenery. Furthermore, his study examines spatial and demographic issues that may have an impact on accessibility of the park area. The study was based on statistical data, analyses of recent planning documents, procedures and practices, as well as research performed in situ. The results indicate that the population pressure in the area under analysis changed significantly. According to the results, a correlation can be found between the latest urban development and population dynamics.
1. Introduction
Since the mid-twentieth century, urbanisation processes have shown an unprecedented dynamic. International reports indicate a global shift between urban and rural areas, which, combined with demographic growth, can increase the share of urban communities in the global populations up to 68% in 2050. In Europe, 75% of the population is urban and it is estimated that this value is to increase [1]. Relatively speaking, the least urbanised of the world’s regions is Africa, yet its urban population makes up over 40% of the total [2]. The global rise in the significance of cities implicates economic, social and spatial shift, while also contributing to climate change, natural resource consumption and the possibility of implementing sustainable development, which is the main concern of global development policy [3,4].
Living in the city can lead to increased exposure to adverse factors such as air, water and noise pollution, as well as extensive traffic. They all decrease quality of life and negatively impact human health. It is possible to address these tendencies, for instance by enabling contact with natural elements of the environment. The link between physical and psychological health and the use of green areas has been studied at length [5,6,7,8]. Attractive green areas were found to encourage physical activity [9,10,11,12], contribute to lowering stress levels [13] and also lead to an evening out of social inequities by creating places for meetings and social interactions [14]. Green areas were also found to contribute to general wellbeing in society by providing a reconnection to nature [7,13,14] and aesthetic satisfaction [15].
Urban green and blue spaces are currently a major element that conditions sustainable urban development. They were stated to be necessary to restoring and maintaining ecological balance [16], improve air quality [17] or improve city resilience to climate change [18,19]. Parks, gardens, greens and green corridors, as well as other forms of greenery like household gardens, green roofs or sports areas are a part of larger greenery systems described as green infrastructure. Green infrastructure is perceived to be equal to grey infrastructure in terms of acting as strategic components of the structure of cities and regions [20].
Progressive urbanisation is a challenge to green area management. In developing countries, open areas are being developed and cities continue to expand. Population growth is often highly dynamic. Processes that take place in urbanised areas, based on the densification of existing urban structures, also contribute to an increase in the urban population that makes use of green areas [21,22]. Many cities are under pressure to balance the potential conflicts of land use between green development and the growing housing demands. As a result, access to green areas is not equal and equitable to all city residents [8,23,24]. It can also be hindered or limited due to an insufficient amount of such areas, their low quality or uneven distribution within the city structure [25].
1.1. Related Works
Some scholars indicate that the number and size of urban green areas is a product of their geographical location [26,27]. In the conducted research, the cities of the European continent were taken into account. General conclusions point that cities located in the north and centre of the continent typically have more green areas than southern cities. European Union statistics that display the percentage share of green areas in the areas of cities in Member States confirm this conclusion only to a certain degree. Tallin in Estonia has a share of green urban areas of 36.7%, while Ljubljana in Slovenia, which is much further south, has a share of 72.5% of such areas. EEA data state that most Polish cities have a share of green spaces 50–65% [21].
A study conducted by Fuller and Gaston indicated that the amount of greenery is also affected by urban form, and cities with compact, dense fabric have a lower amount of green area per capita [28]. After studying 386 European cities, they demonstrated that this indicator ranges from ca. 3 to 4 m2 per capita in cities in countries such as Spain or Italy, while it reached much higher values—i.e., 300 m2 per capita—in certain cities in Belgium and Finland. Kabisch et al. showed that the share of the European urban population that lives within 500 m and 300 m of a green area of a size at least 2 ha is varied and ranges between 11% and 98% [29].
In recent years, the problem of green urban space accessibility has been discussed in a considerable amount of global, European and Polish academic publications. The literature review performed by Rigolon shows that three basic types of variables to evaluate access to urban parks are most commonly used:
- Proximity refers to physical geographical distance in metres or minutes of walk;
- Quantity tells how many parks, or hectares of parks, are within reach; and it can be measured in park area per capita or total park area ratio;
- Quality refers to design issues, such as composition, furniture, facilities, as well as maintenance level [27].
Describing accessibility issues can be approached through network analyses such as Space-Syntax, where accessibility is associated with connections of lines or streets and is highly dependent on city layout [30,31]. Other related network-based approaches include centrality, which explains, among others, that ‘some places are more important than others because they are more central’ [32] (p.3). Centrality measures are applied mostly in the urban context. However, interesting findings concerning a mixed urban–rural environment were provided by a study conducted by Pérez-Campaña et al. [33], where several abandoned and unused sites were identified as those of high centrality values.
A study of green area accessibility was performed for voivodeship capital cities in Poland, and revealed that most residents do not have access to a minimum 2 ha green spaces within 300 m walking distance from their homes. The same study discusses the matter of spatial barriers such as rivers or railway lines that require additional effort and distance to cross [34]. Detailed studies of park accessibility in Gdańsk, Poland, conducted by Korwel-Lejkowska and Topa indicate that almost 78% of the city’s area is outside of the accessibility zone of city parks as outlined by a travel distance lower than 20 min [35].
The abovementioned observations contribute to the development of spatial policy goals associated with the amount and accessibility of green areas in cities. In Europe, ensuring the proper amount and quality of urban green space has become a major development policy goal [2,36]. For instance, the European Environment Agency recommends a distance from green areas that is no greater than a fifteen minutes’ walk [37,38]. The EEA’s recommendations are nevertheless not obligatory, which results in adopting different indicators and values depending on local conditions and applicable strategies.
Insofar as all components that form green infrastructure are essential to sustainable development of cities and societies, urban parks are one of the most valuable and attractive [39]. Parks fulfil a broad range of roles: those of urban recreational areas serve as places of physical activity of varying degrees of intensity, such as walking, dog walking, jogging, cycling, hiking or even outdoor fitness [40], as well as allow people to come into direct contact with natural elements of the environment [41]. They occupy an important place in the network of public spaces and induce social contact among visitors. Previous studies have suggested that the features, attractiveness and composition of park space encourage its use and increase visitor count [12,42,43,44].
1.2. Research Question
Numerous studies have explored the problems of the quantity and accessibility of urban green areas from a territorial perspective. They largely focus on the distribution of such areas in a specific spatial and physical structure and focus on large scales: those of the city, region or country [27,28,34,43,45]. In reference to the local scale, studies from a human-based perspective predominate and refer to age or social groups [46], as well as the subjective perception of green spaces [7,47,48]. The vast majority of studies on urban green space accessibility and forms of use primarily focus on the problem of their insufficient quantity or difficulties in access to them, which can limit the number of persons willing to visit them. However, there is also an opposite problem—that of an excessive number of users which leads to the overcrowding of the most popular recreational spaces. As argued by A. Arnberger, in case of more sensitive persons, this can lead to discomfort and, as consequence, to less frequent visits [49,50].
Against this background, insufficient knowledge can be identified concerning local spatial and societal determinants that can affect accessibility and use of specific urban green areas. There is also a lack of such reports on Polish conditions. This study addresses the existing gap by studying the case of the Młynówka Królewska linear park in Krakow, Poland in terms of transformation its surrounding urban space over the past ten years. The aim of the study is to answer the question of whether there exists a link between tendencies in urban development, population dynamics, and the use of urban parks. The background for this study is provided by a review of municipal policy and planning frameworks towards urban greenery.
The research objectives are as follows:
- Determine whether the built-up area in the proximity of the park has changed since 2009;
- Examine whether a correlation exists between those changes and the general accessibility of the park;
- Estimate the population pressure on the park area and its dynamics in the last decade.
2. Materials and Methods
2.1. Study Area Selection
2.1.1. Krakow, Poland
The study was conducted in Krakow, which is the second-largest Polish city, capital of the Lesser Poland Voivodeship and an important cultural centre. It is located in the southern part of the country, in the Vistula River valley (Figure 1). The city’s area within its administrative limits is 337 km2 and its population is close to 800 thousand. Its urban core was established in the High Middle Ages, and is currently one of the most valuable historical urban and architectural complexes, inscribed on the World Heritage List. Many of the more distant districts of the city developed around previously existing settlements that were incorporated into the city. As a result, since the beginning of the twentieth century, Krakow’s area has increased by 320 km2 [51]. Processes of Krakow’s urbanisation were associated with shifts in geopolitical and economic situation, which resulted in complex and non-uniform city structure [52]. In order to get a broader perspective of the spatial context of the area in question, a brief overview of the development of Krakow will be presented in the following section.
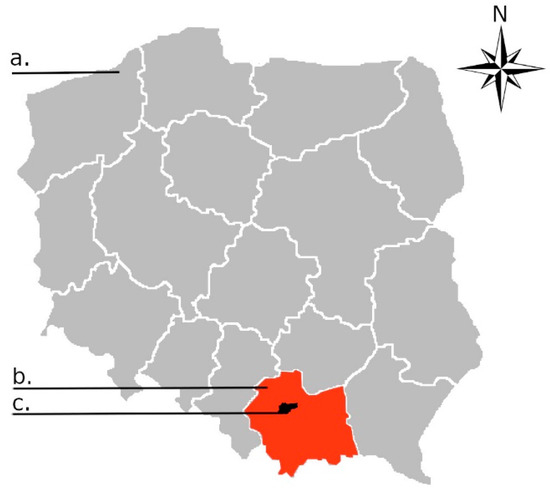
Figure 1.
Map showing location of Krakow. (a) map of Poland with major administrative borders; (b) Lesser Poland Voivodeship; (c) Location of Krakow.
2.1.2. Development of the City Structure
Documented urban development of Krakow dates back to the tenth century, although archaeological excavations indicate that some forms of settlement were present in the river bend of the River Vistula centuries prior [51,53]. In the year 1257, the urban layout of the city was defined as a consequence of a town charter. Its centrally located market square and a regular grid of diverging streets are still present and visible in the city’s structure. In the thirteenth century, a new system of fortifications was erected, with defensive walls, towers and fortified entrance gates gradually developed and modified in the following centuries. The first ring of fortifications determined and restricted the spatial development in subsequent centuries. The administrative borders of the city had not changed substantially up to the eighteenth century, which can also be associated with the geopolitical situation and partition of Poland between neighbouring countries.
The extension of the city limits in 1910 was an important step towards Krakow becoming a modern city. The so-called Greater Krakow was created by incorporating the surrounding villages and outskirts. The area of the city in the beginning of the twentieth century was near 50,165.3 km2. However, the inhabitants were concentrated mostly in the historical centre. Krakow existed in this form until the Second World War, when it became the capital of the administrative-territorial unit called the General Governorate under Nazi German occupation. This ‘capital city’ on the one hand and as the perception of Krakow as ‘an ancient, Germanic city’ by the occupying forces on the other led to a strategy oriented towards development rather than exploitation [53]. In 1941, a decision was made to significantly extend the area of the city. The borders were expanded the and the city area increased more than threefold reaching 165.3 km2, yet the population did not exceed 285 thousand [51,54].
The incorporation of the surrounding villages in 1951 had a substantial influence on the post-war development of Krakow. In their place, an industrial district was created with a metalworking complex and the housing estate. Nowa Huta, built in the Socialist Realist style, was a separate city for some time and has since become a district of Krakow [51]. During the last decades of the twentieth century, the area of the city was slowly reaching its contemporary size. However, the amount of built-up area was substantially smaller (Figure 2). Breakthrough moments in the modern city’s development can be associated with the processes of extending its administrative borders by incorporating and urbanising surrounding territorial units. Consequently, the population increased, although the demographic changes were also driven by several other factors such as: fertility and mortality, migration patterns and economy (Table 1) [55].
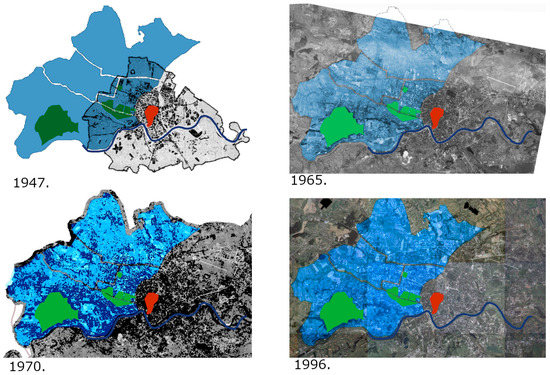
Figure 2.
Map showing the western districts of the city in several stages of urbanization in the twentieth century. Figure based on cartographic materials available at the Office of the City of Krakow (UMK) webpage.

Table 1.
Table illustrating the main steps of changes in the area and population of Krakow 1915–2013. Table modified from UMK [54].
The end of the turn of the twenty-first century has been a period of dynamic urbanisation both of the city and its vicinity. Suburbanisation processes and urban sprawl are particularly visible, yet the city itself is also a subject to major development growth [56,57]. According to data published yearly by the Office of the City of Krakow (UMK) [58], the built-up area of the city increased significantly during the last decade, reaching the value of 9767 ha (Table 2).
Table 2.
Data on built-up area of Krakow 2009–2018 as presented in annual publications of UMK [58].
Krakow possesses several dozen public parks. They are located on municipal grounds and administered by the city. Apart from inner-city greenery, the presence of natural reserves and landscape parks in the surroundings of the city must be noted. The western part of the city of Krakow lies within a wedge of the Bielańsko-Tyniecki Landscape Park, which stretches almost to the city centre and covers several natural areas and forest parks. To the north is Tyniecki Landscape Park (Figure 3). The landscape parks are managed by the Complex of Landscape Parks at Voivodship level (ZPKWM) [59].
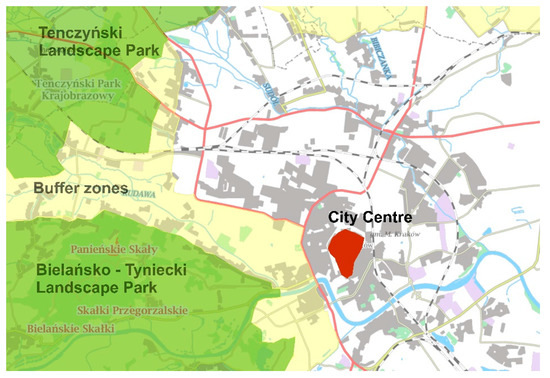
Figure 3.
Map showing the landscape parks within the borders of the city in its western districts. Based on cartographic materials available at the Complex of Landscape Parks at Voivodship (ZPKWM) webpage [59].
2.1.3. Młynówka Królewska Park
The Młynówka Królewska Park is a unique example of a linear park, built along a canalized waterway of the same name. It runs through Krakow’s western districts: Krowodrza and Bronowice, along a distance of over 8 km—stretching from the city centre to its western border. The transverse dimension of the park varies depending on the section and often is constrained by surrounding urban tissue. The Młynówka River was created in the thirteenth century as a canal that transported water from the distant Rudawa River to Krakow. The canal and the engineering structures, was of strategic significance, as it was the main source of utility water that filled moats and fish ponds, flowed in municipal fountains, powered water mills and was used in leatherworking shops, malt houses and slaughterhouses. The medieval water supply system operated up to the nineteenth century, yet it lost its significance along with the development of industry. In the following years, its successive sections were gradually filled in. Fragments of the riverbed were present in the landscape of the western part of the city up to as late as the middle of the twentieth century [51].
In 1995, a decision was made to establish a city park along the site of the Młynówka, which was to act a protective measure for an area of high cultural and landscape value. At present, Młynówka Królewska Park is an attractive pedestrian and cyclist destination equipped with recreational infrastructure, including seating, deck chairs, playgrounds, gyms and dog parks. It is a popular place for walking, cycling, jogging and social interactions. Młynówka Królewska Park is an attractive place of recreation and a component of the urban heritage of the city (Figure 4).
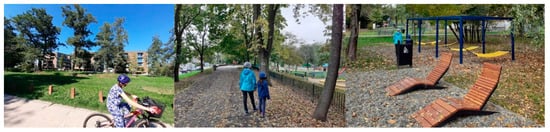
Figure 4.
The park is attractive, well maintained and provides a range of recreational services.
It is also a part of the existing and planned system of green areas. Urban river parks are receiving more attention worldwide, as they reduce the heat island effect and flood risk, support biodiversity and provide city dwellers with places for recreation [60]. Młynówka Królewska, although partially covered and paved, is classified as a river park, of which there are several in Krakow. The most prominent is organised along the main river of the city—the Vistula. According to municipal policy, they are meant to act as the structural axes of the greenery system and form natural ecological corridors that connect smaller green areas or lead to green complexes of regional significance [61].
Along its length of 8 km, the park’s character gradually changes, as does its surrounding development. The following urban patterns can be identified: compact nineteenth- and twentieth-century urban blocks, urban villas, mass housing from the 1970s and 80s, new dense multi-family housing, detached and single-family houses, as well as office buildings and complexes (Figure 5).
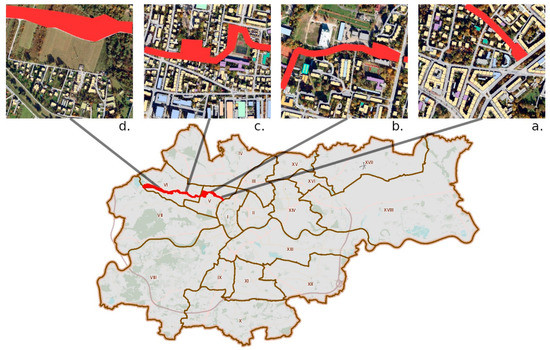
Figure 5.
The location of Młynówka Królewska Park in Krakow and spatial patterns of the neighbourhood: (a) historical city blocks and urban villas; (b) mass housing estates; (c) low density multi-family housing, office complexes; (d) single-family housing. The location of the park has been marked in red.
2.2. Revision of City of Krakow Policy towards Urban Green Space
In light of currently applicable regulations, Poland does not have cohesive legislation concerning public green space area per capita or per territorial unit. There is also a lack of codified and widely applicable urban planning standards that would define such matters [62]. The only binding regulations concerning green space area are listed in the Ordinance of the Minister of Infrastructure of 12 April 2002 on the technical conditions to be met by buildings and their placement [63]. However, the ordinance only refers to buildable plots and determines the minimum amount of biologically active surface area that must be provided when carrying out real estate development projects, and as such does not apply to urban public green spaces [61,64].
The last document to be binding in this respect was the standard passed in 1974 which, among other things, regulated the amount of green areas per urban unit, type of development and population count. The minimum values for green and recreational spaces were at 25–30 m2 per capita, at a distance no greater than 800 m from a place of residence [64]. After political transformation towards democracy and the adoption of a market-based economy that Poland underwent in 1989, most ordinances were repealed. The previous centralised planning structure was dismantled and currently most competencies concerning planning are in the hands of municipal governments that make decisions concerning land use and development. While doing so, municipal authorities determine dependencies between the number of developed areas and urban public green spaces. At the same time, the restoration of private property has drastically altered the conditions of carrying out real estate development projects, and the necessity of intensive land use to ensure economic profitability of a project has led to the phenomenon of development pressure on, among others, urban green spaces [65,66].
In the present planning model, the main document that a municipality is obligated to draft is the Study of Conditions and Directions of Spatial Development (SUiKZP), which includes provisions concerning land use [67]. The SUiKZP, which is drafted for the entirety of a municipality’s territory, assigns areas for housing and other uses, green space systems, the course of transport routes and strategic infrastructural paths. The study is not an act of local law and is merely an instrument of spatial policy implemented at the municipal level [68,69]. The document that directly affects land use and development is the local spatial development plan (MPZP), which is drafted for selected fragments of municipalities. Local plans cannot infringe on the provisions of the SUiKZP. However, the preparing of local plans is not obligatory and municipal governments are given significant freedom in the choice of areas plans are to be drafted for. In Krakow, in the second half of 2020, there were 384 valid local plans, and another 97 plans were being prepared. This situation is not stable as plans are often repealed in part or in whole, and new ones are prepared in their place.
In a situation when a given area does not have a local plan in place, the carrying out of any project can be based on an administrative decision that enacts development conditions (WZ). Such a decision is issued at the request of an interested party. It is a parallel path, but suffers from serious faults, such as its fragmentality (it applies only to a specific building plot), susceptibility to influence by the particular interests of parties or its inability to shape spatial order [70]. The legal basis for issuing WZ decisions does not obligate institutions to make them compliant with the SUiKZP, which leads to the development of areas that are not assigned for development and the uncontrolled spread and dispersion of urban structures. This procedure was intended to apply to the short period prior to the enactment of a local plan. However, it has grown to become a fully fledged tool for shaping new development. In 2019, 1097 WZ decisions were issued in Krakow, of which 350 pertained to the construction of multi-family residential buildings or complexes.
Under these conditions, the only effective means of protecting green spaces from development is by appropriate local plan provisions. In this procedure, the maintenance and protection of existing parks can be ensured, as well as the establishment of new urban public green areas. In 2016, the drafting of MPZPs for 215 of Krakow’s wildlife areas began (over 10% of the city’s territory). Green areas indicated in the SUiKZP and previously not covered by local plans have had such plans enacted. The objective of this endeavour was to protect green spaces and put a stop to growing development pressure that had been identified as a major threat to sustainable greenery management in the city. Other stages of the plan are being gradually prepared and implemented.
Another, indirect form of controlling development processes should be mentioned here. Areas within the borders of a landscape park are under legal protection due to their natural, historical and cultural value, although the level of protection is significantly lower than in the case of national parks or national preserves [71]. Some forms of protection also apply to buffer zones delimited in protection plans. Such plans are drafted for each park individually and are oriented towards the sustainable use of the area in terms of protecting rare species and conservation the natural elements of the environment. Thus, the placement and form of new development are regulated to a certain degree, as the protection plan provisions are included in the MPZP, or serve as an act of local law [71].
A vision of further development of green spaces is presented in the Directions of development and management of green areas in Krakow 2019–2030 (KRiZTZ). It is a proposal intended to determine the city’s long-term policy towards maintaining existing public green spaces with the use of their ecological, societal and cultural potential. It also constitutes a basis for creating new areas that supplement the system of green infrastructure. The overall concept for further development of green areas is based on the mixed network model with interconnecting wedges formed by river parks and larger forested areas. The document’s provisions emphasise the continuity of ecological and recreational corridors and connections between the city and the region [61].
In the document, it was assumed that by 2030, at least 86% of residents will have access to green areas within walking distance from their homes (300 m). A target value of 10 m2 of recreational green area per capita was adopted based on a review of similar European documents and strategies [61,72]. In addition, the KRiZTZ provides several analyses of the actual state of green areas in each district. It reveals that most of them are currently below average in terms of the amount of public green areas, which can be explained by their uneven distribution in the city structure.
Analysis of the documents confirmed that there is no design standard that defines the distance to green space or its population capacity. Consistent guidelines were found in the Directions of development and management of green areas in Krakow 2019–2030 (KZiRTZ). As mentioned, this document is not legally binding, and it serves as a base for preparing local plans. A review of the document found that, despite progress in planning during the last ten years, a sizable portion of the city’s area does not have a local plan in force (MPZP), which leads to an overuse of the procedure of administrative decisions on development conditions (WZ). However, this procedure does not provide tools to manage overall land use patterns.
2.3. Data Sources
The primary sources of reliable data about the city used in the study were publications and websites by the General Statistics Office (GUS), the different branches of the Office of the City of Krakow (UMK) and the Municipal Greenery Authority (ZZM). The most up-to-date population data on the City of Krakow were found in GUS publications, while the more detailed demographic maps were available through the UMK cartographic services. The demographic information and maps available at UMK, as well as GUS publications are based on permanent and temporary residency declarations, which are obligatory official forms filled by each resident of the city. In Poland, it is the primary form of managing the population register and keeping track of population count.
Since a 1991 administrative reform, Krakow has been divided into eighteen districts, whose functioning is subjected to the Office of the City of Krakow, and their competencies for local governance are highly limited [73]. However, the districts form the most important ancillary territorial units of the city. The north-western part of Krakow is within four neighbouring districts: IV Prądnik Biały, V Krowodrza, VI Bronowice and VII Zwierzyniec. Up to 1991, they formed a single administrative unit: the Krowodrza district. This historical division is still used by the General Statistics Office (GUS), which distinguishes four units for Krakow: Śródmieście, Krowodrza, Podgórze and Nowa Huta [74]. As such, the data obtained from the GUS refers either to the entirety of the city or its largest fragment (statistical unit) and they could not be used directly. Such generalised data includes, for example, the number of apartments handed over for use in each year, the average size of apartment and average number of residents or the number of building permits issued. Therefore, some data for the selected area had to be counted directly from cartographic sources (for instance: the number of housing complexes or population in the buffer zones under analyses). One valuable source of information was the Municipal Spatial Information System (MSIP), where a real-time population register is shown, which allows for extraction of data on plot sizes, building sizes and number of storeys. It was the primary source of data on newly built buildings.
To perform urban analyses concerning urban tissue, barriers and accessibility, maps and orthophotomaps supplied by the UMK were used. Available planning documents, such as local spatial development plans (MPZP) were helpful mostly in delimiting the border and the area of the park, as well as in determine the state of the art in spatial planning. The study of the city’s development utilises information as well as historical plans and maps in possession of the UMK. All the above-mentioned maps were obtained in the form of graphic raster images (jpg, pdf, png).
The study is focused on the period of the last ten years. It has been a period of particularly intense new real estate development and an increase in development pressure in Krakow. This period also saw the start of many municipal projects focused on structuring and revitalising existing green areas. The possibility of obtaining data and maps necessary for the study was another criterion. Prior to 2009, the amount and quality of statistical and cartographic reports available in digital form was significantly lower.
2.4. Methods
At present, data that would directly illustrate the growth of development for a given city fragment and within a set timeframe, is not directly available. To assess changes in spatial development of the fragment of Krakow that occurred between 2009 and 2019, a number of methods was used. First, the areas of the park’s pedestrian accessibility were outlined. To visualise the geographical accessibility of Młynówka Park, distances measured in a straight line were used. Based on the recent literature on the pedestrian mobility and accessibility, the following values were adopted: 750 m, 500 m and 300 m [23,38,75,76,77] (Figure 6). The adopted distances are in line with half-mile (ca.0.8 km) and quarter-mile distances (ca.0.4 km) found in the classic writings on urban design by C. Perry or C.S. Stein. The concept of the Radburn neighbourhood by Stein and Wright introduced the superblock of the single-family housing enclosed by arterial roads or natural features. The superblocks were arranged into neighbourhoods, where the maximum walking distance on pedestrian routes was half a mile [78]. In the neighbourhood unit by Perry, the radius of around a quarter of a mile or 5 min walking delimits the distance from residential to non-residential components of the unit [79]. These principles influenced Anglo-Saxon urbanism to a great extent and are still used, e.g., in determining the accessibility zones around public transport stations or distance to public spaces [80].
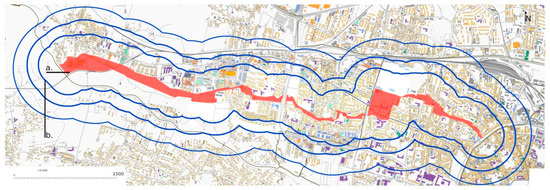
Figure 6.
Młynówka Park accessibility zones; (a) territory of the park; (b) 300 m, 500 m, 750 m buffer zone outlines.
The outlines of buffer zones were created by setting series of rings with radii of adopted length in the sections of ca.150 m along the park boundary. Additional rings were placed at vertexes. The procedure was performed for each distance separately. The buffer zone of 750 m covers an extensive territory (ca. 31.76 km2), yet this can be explained by the size and significance of the park on the scale of the city. The distances of 500 m and 300 m, especially, delimit the boundaries of the immediate neighbourhood.
Afterwards, a graphical comparative analysis of topographic maps and orthophotomaps was performed in order to identify the areas of new developments. Multi-family housing was placed at the centre of the study, as it increases the population number more than single-family development. This phenomenon can be associated with the land use intensity index. According to city planning documents, in case of high–intensity multi-family development the intensity of land use can reach the value of 2.0. This means that the total gross floor area of the building can be two times greater than its plot area. In the case of low intensity and single-family housing the value varies from 0.4 to 0.6, which is much lower [67]. Higher values of the index produce a greater amount of usable floor area, thus more inhabitants contribute to population growth. In addition, the demand for recreational greenery typically cannot be satisfied within the borders of a project’s site, due to land use intensity or the presence of underground car parks, which hinders natural vegetation.
The areas of multi-family complexes and zones as existed in 2009 were identified on an archival ortophotomap. The next step included the identification of multi-family housing zones as indicated in the general planning study and the local planning documents. Afterwards, either completed multi-family housing complexes or those that are still under construction were marked on the map.
To assess greenery saturation in the city structure and estimate the potential of its use by residents, the k/n indicator is the most commonly used: k denotes the surface area of green spaces while n is the number of residents or users in a given area. However, Wen et al. note that this container approach has several shortcomings. They found that ‘the recreational service that a green place can offer to a catchment area depends not only on its capacity but also on how many people in that catchment area must share the resources’ [81]. Furthermore, this parameter also assumes the summation of the surface area of green spaces in a given area and the distribution of the total amount between all people. Therefore, for this study it cannot be fully utilised, as the focus is given to identifying whether there existed a population pressure on the selected park area and to determining its actual demographic capacity. Other existing green areas in the Krowodrza unit and in delimited buffer zones were not taken into account, although they contribute to the total amount of greenery. In order to determine the dependency between the size of the park and the size of its potential user population, the formula f = p/k was used, where p is the population count within the buffer zone and k is the size of the selected green area.
Changes in the number of inhabitants in the buffer zones were determined based on a series of estimates. First, the data published for each district by UMK were reviewed. These data include the area of the district and its population. In this case, the number of inhabitants was calculated from official residency declarations, which show the population count for the selected year. Afterwards, the population counts in each pedestrian accessibility zones for 2009 and 2019 (p0.1, p0.2, p0.3, p1.1, p1.2, p1.3) were calculated. The calculation was performed based on the real-time population register map supplied by the UMK, which shows residency declarations in aggregated form of regular hexagons with a side of 250 m (Figure 7). The values from clusters were counted for each buffer zone separately, and permanent and temporary residency declarations were summarised. The fragments of the hexagons in the buffer zones were included proportionally.
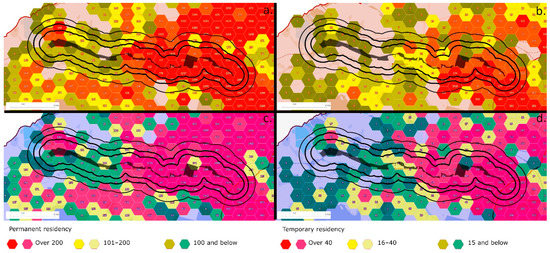
Figure 7.
Map showing the population register; (a) permanent residency in 2009; (b) temporary residency in 2009; (c) permanent residency in 2019; (d) temporary residency in 2019.
The second estimation relies on analyses of spatial development, in particular the identification of new housing developments in the park’s buffer zones (p2.1…) (Table 3). As there are no direct data on population capacity of the newly built complexes, it was counted based on the spatial data derived from cartographic materials (MSIP). These data included plot size, built-up area and number of storeys for each building. Hence, it was possible to calculate the usable floor area and number of apartments. To estimate the population of the selected building and housing complex it was necessary to adopt indices published by GUS: the average size of the apartment in multi-family building in Krakow (57 m2) and the average number of people per apartment (2.63). These values were published for the city of Krakow in 2017.
Table 3.
The matrix of population count as used in further research.
The last estimation is based on available data on the number of new apartments built and handed over for use (p3.1., p3.2., p3.3) (Table 2). These data are published annually by GUS and provide a valuable source of information concerning the development of the housing sector. However as mentioned in the previous section, they refer to the Krowodrza unit in general. Therefore, to assess the population number the same indices of average apartment size and average amount of inhabitants were utilised. In addition, a rough approximation was carried out based on proportions between the population of the Krowodrza unit and the population of the buffer zones as calculated in the first estimation.
As a result of the calculation, the factor f illustrating the amount of people on the surface unit of the park shall take different values depending on the population count.
3. Results
3.1. General Background
According to available data, the situation of Krakow and the Krowodrza unit in terms of demographics, built-up area and green spaces was found to be as follows: green areas of different types cover 62.3% of the city; urban parks, along with other wildlife areas described as valuable, comprise ca. 15% of the area, which is around 49.05 ha. In 2014, the index of recreational green public space per capita was 8.3 m2 [67], while the population density was 2359 persons per km2. The average population density in the Krowodrza unit is almost two times higher than in the whole city (Table 4). It was found that the green area per capita index takes different values depending on the administrative district. The lowest value of 4.50 m2 is represented by district IV (Prądnik Biały), while the highest amount of green area—27.54 m2 was found in district VII (Zwierzyniec), which is characterised by large share of low-density housing, as well as the presence of the biggest park in Krakow (Błonia Krakowskie).
Table 4.
Data on green area and population of the Krowodrza unit in comparison to Krakow.
Current data show that since 2009, the built-up area of the city has increased by almost 4 thousand ha, while recreational areas, which include parks, have remained almost unchanged (Table 5).
Table 5.
Data on built-up area and recreational area change in Krakow as presented in annual publications of the UMK for 2009 and 2019.
3.2. Planning and Urban Development
At present, the area of the park itself and its immediate surroundings are covered by four neighbouring MPZP plans. Land use calculations indicate that a total of 29.49 ha was assigned to public green space (parks). The area under the municipal administration, managed by the ZZM is 18.4 ha (Table 6), and this value is used in further calculations. In 2009, none of the local plans were in force, so the park area was formally not protected. Other valid MPZP cover only part of the selected area and comprise of separate, unconnected fragments (Figure 8).
Table 6.
Area and planning status of the Młynówka Królewska park.
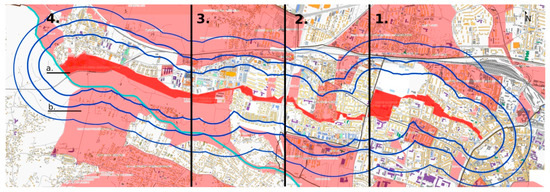
Figure 8.
Map of the existing local plans in 2019; (a) territory of the park as delimited in the local plans 1–4 (MPZP); (b) other existing, valid local plans (MPZP).
Changes in the development structure have been identified through comparison of SUiKZP maps, local plans and available ortophotomaps that covered the selected timeframe. The most of the multi-family complexes existing in 2009 was concentrated in the eastern part of the area, while the western part was characterized by low-density, single-family urban patterns. Areas that are designated for multi-family housing purposes cover more land towards the west, but still a clear division between eastern and western part is visible. It was also observed that some completed multi-family housing projects are located outside of areas assigned in the SUiKZP for this type of development, which means that they were built on the basis of WZ procedure (Figure 9d). It leads to a situation where the land use balance cannot be accurately planned and controlled, as this type of procedure is restricted to a single building plot.
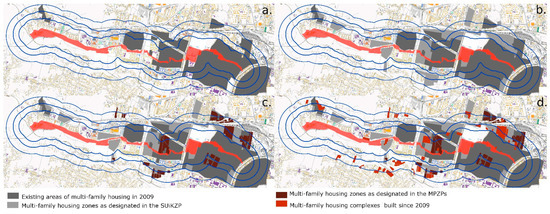
Figure 9.
Map of spatial development of the area; (a) existing areas of multi-family housing in 2009; (b) multi-family housing zones as designated in the SUiKZP; (c) multi-family housing zones as designated in the local spatial development plan (MPZP); (d) multi-family housing complexes built since 2009.
3.3. Demography
According to the UMK data on districts, within the last 10 years, the total population of the Krowodrza unit increased only by 2.08%, in addition, the district located closest to the city centre (V) recorded a clear decrease in the number of inhabitants (Table 7). This provides an overview of the demographic tendencies and population shift from central urban areas to more distant districts.
Table 7.
UMK Data on population change in administrative districts as presented in annual publications of the UMK for 2009 and 2019.
The population that declared permanent and temporary residency within the adopted buffer zones was calculated using the population register map, as described in the previous chapter. The 750 m isochrone was found to be inhabited by ca. 67,808, which was over 46% of the overall population in the Krowodrza unit in 2019. Within the 500 m isochrone the number was 50,183 (34.32%), and within 300 m—36,333 (24.86%). Only several percent increase was noted in this area as well. Table 8 illustrates the result of the performed population count.
Table 8.
Result of the population count performed for the selected buffer zones.
However, these data do not fully illustrate the actual state, and the main reason for that assumption is the dynamic development of the housing sector. In the past several years, it has been marked by continuous growth, with new buildings and complexes built. According to GUS, the pool of existing dwellings has not decreased [74]. This tendency is not reflected in residency declaration increase (Table 7). In light of these observations, the demographic capacity of the area under study can be considerably greater.
Accounting for the significant increase in built-up area of the city, it can be assumed that this process also took place within the limits of Krowodrza unit within the specified timeframe. Since 2009, the area within 750 m of the park has become the site of several dozen new multi-family housing complexes, some of which are in close proximity to the park. The estimated number of new developments is 45, based on a comparison of the current and previous state of land cover as well as in-situ observations. This group includes both singular buildings and complexes of varying size. Three of the largest housing complexes, which comprise around a dozen multi-family buildings (m1, m2 and m3) were chosen to more detailed study (Figure 10). It was assumed that, due to their built-up area, number and size, the buildings can affect an increase in the overall number of residents and thus the park’s users.
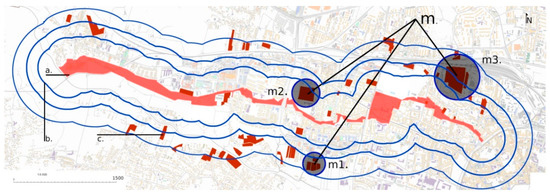
Figure 10.
Location of the selected multi-family housing complexes (m1, m2, m3); (a) territory of the park; (b) buffers of 300 m, 500 m, 750 m; (c) multi-family housing complexes built since 2009.
To assess the scale of this phenomenon, an estimation was performed for the three selected development complexes (m1, m2, m3). The number of dwellings was counted based on the total built-up area, number of storeys in each building and average apartment size for Krakow—in 2017, this was 57 m2. The average number of residents per apartment was assumed after the GUS publications to be at a level of 2.63 [74]. Therefore, the total number of residents in these complexes can be as high as 11 thousand (Table 9). As the three complexes are all within the 750 m zone, this value was used to assess population growth only in this zone.
Table 9.
Data on the size of the selected housing complexes (m1, m2, m3). The population is a result of estimation based on size of the development.
In the last step of the population estimation, the statistical data on the housing development for the Krowodrza unit were taken into account. They indicate that over the past ten years, over 20 thousand dwellings were handed over for use in newly built edifices (Table 10).
Table 10.
The number of new dwellings built in Krowodrza unit in each year according to data published by GUS.
The housing stock in the western part of the city has substantially increased in size, which is expected to have impact on the final number of park users. The number of residents of the new dwellings can contribute to the overall population of the Krowodrza unit. In this calculation, the same coefficient of 2.63 residents per apartment was used. As a result, the estimated number of people inhabiting the entire Krowodrza unit could be higher by over 53 thousand. This value can be added to the population of the unit derived from official UMK publications (Table 7). As a result, the total population of the unit can amount to 199,887 people (Table 11).
Table 11.
Result of the population estimation for Krowodrza unit.
However, this result refers to the statistical unit of Krowodrza, not to the specified buffer zones of the Młynówka Park. As mentioned, no data exclusively covering the selected part of the city were found, therefore another rough approximation was made. It was based on the supposition that the ratio between the number of persons in buffer zone and the population of the unit remains constant. This is a conceptual simplification, thus it is expected that the result of the last estimation can be the least precise. The ratio could have been changed by the new development, as it is not distributed evenly throughout the unit. Yet, it was found reasonable to perform the calculations and compare the results obtained throughout the study to gain a broader perspective on possible population change.
It was found in the previous stages of the research, that in 2019 the biggest (750 m) buffer zone is inhabited by 46.37% of the population of the unit. The buffer zones of 500 m and 300 m were inhabited by 34.32% and 24.85% respectively (Table 8). By changing the initial population number (from 146,422 to 199,887), it was possible to obtain values of the estimated population number in each of the buffer zones. Table 12 illustrates the results of the performed calculation.
Table 12.
Result of the population estimation for the selected buffer zones.
3.4. Population Pressure
The final result of the calculations performed at previous stages of the research is a set of values of parameter p, which illustrates population changes in each of the three buffer zones (Table 13), and the resultant f values, which describe the relation between the size of the green space and the size of the population (Table 14). The outcomes vary between 0.196 and 0.503 persons per m2 of the park area. The lowest expressions applied to the data from 2009 (f0.3), while the highest expression is associated with the size of the current housing stock for the Krowodrza unit (f3.1).
Table 13.
The population in the buffer zones calculated in 2009 and 2019.
Table 14.
The population pressure calculated in 2009 and 2019.
The city’s goal for the amount of urban recreational greenery is at least 10 m2 per inhabitant. Thus, the desired f value for every urban green area should be no bigger than 0.1. It is supposed to provide comfort and enough space for users. During the study, it was found that the actual values of f factor for Młynówka Królewska Park exceeds this number at least twice. The desired value was exceeded even in the case of the lowest population count in 2009 in the 300 m buffer zone.
3.5. Urban Analyse
The urban analyses of the selected area reveal that, within the walking distance, the urban tissue varies in form, density and function. Urban blocks and parts of regular grid can be visible in the eastern part, close to the city centre. Towards the west, the development structure becomes observably less dense (Figure 11), and the last section of the park is adjacent to farmland and meadows located within the borders of the landscape park buffer zone.
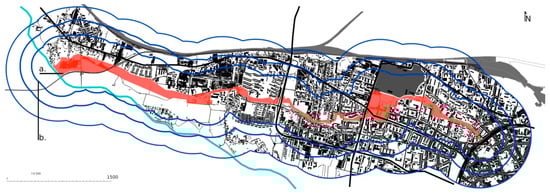
Figure 11.
Urban tissue within walking distance from the park area; (a) territory of the park; (b) buffers of 300 m, 500 m, 750 m.
The important factor that has impact on accessibility is the property of the land and plot divisions. It was found that towards the west plots became visibly bigger, as well as the share of private grounds increased (Figure 12).
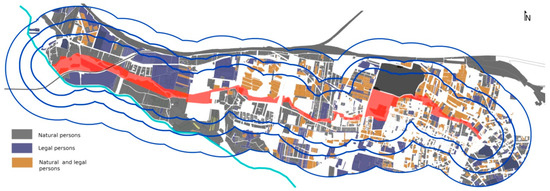
Figure 12.
Map indicating ownership of the land.
Railway tracks, river, busy roads, and large closed areas were identified as fundamental structural barriers (Figure 13). They allow traversal passage only in a limited number of places, thereby extending pedestrian routes sometimes even twofold. The best access is observed in the eastern and central section of the park, where the urban structure is regular.
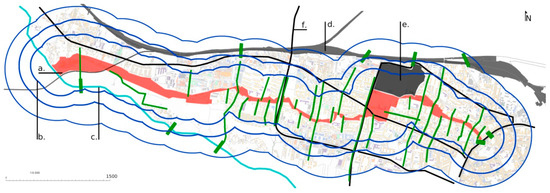
Figure 13.
Młynówka Park pedestrian access possibilities and limitations; (a) territory of the park; (b) buffers of 300 m, 500 m, 750 m; (c) river Rudawa; (d) railway; (e) military area; (f) main roads. The major pedestrian passages that allow access are marked in green.
The ability to reach the park on foot varies depending on the section of the park. Towards the west, it decreases considerably due to a looser road network, the lack of pavements or the higher share of private, fenced areas.
4. Discussion
One of the important reasons for undertaking the work was to draw attention to the problem of increasing pressure on existing, attractive urban green areas, which is the result of the city’s spatial development, particularly the increase in the amount of multi-family housing. Population pressure on Młynówka Królewska Park, as calculated in the study, is significant. It can lead to overcrowding in the space, a lack of comfort, and consequently to a lowering of its value as a recreational space. It can be discussed, to what extent the number people derived from secondary sources and approximations reflects the actual state. Certainly, the performed calculations give a general overview of the population changes, which occurred to be much bigger than initially expected. It was shown that, on the local scale, the processes of city growth are visible, and they can be associated with housing development.
In light of available data and previous research, it was not possible to determine the exact degree to which the number of residents carries over to the number of park users. In majority of the research the overall number of inhabitants was used, as the most reliable population data. In the case of Młynówka Królewska, it can be assumed that the landscape value, location and size of the park place it high in the hierarchy of attractiveness of urban green spaces in the western districts of the city. The residents could be more willing to undertake longer journeys to an attractive green area. Previous studies confirm that more attractive, easy to access and well-equipped green spaces are visited more often than others [40,42,43]. Accordingly, the analysis of cycling preferences performed by Campos-Sánchez et al. provides evidence, that green areas, together with other environmental conditions (e.g., proximity of university buildings, which occurs in this case) can play an attractive role in route choices [82].
Numerous studies point to an insufficient amount of green space in city structures or the associated problems with access to them by residents. Initial research revealed that existing empirical studies that analysed green space provision mostly conceptualised access as a geographic construct, and used GIS methods to get specific results [45,77,83]. However, this study proves that to measure accessibility, in-depth urban analyses are necessary. The problem of the urban green area accessibility is complex. Parks are situated within the urban fabric, which determines possibilities as well as limitations of the pedestrian travels. As shown in previous studies on centrality, location within the street network can play a vital role in the patterns of use of the public space. The areas of high centrality measures (e.g., reach, closeness, betweenness or straightness centrality) are better connected and experience more intense pedestrian flows [32,33].
It has been found that accessibility is related not only to geographical proximity, but also to urban form, walkability, lack of urban barriers and number of access points on the perimeter of the area [84]. Railway tracks, busy roads, large closed areas, or gated communities that make it necessary to take longer routes are fundamental structural barriers for pedestrians, making the distance travelled extend beyond the limit of subjective justification [34,85,86]. In particular, studies on pedestrian travel preferences can provide valuable information about preferences in mobility [87,88,89,90]. The general findings are also in line with Jan Gehl’s approach, that some neighbourhoods have better quality in terms of walking conditions, safety and convenience [91].
During the study, the main obstacle was a shortage of precise local data and knowledge related to spatial, statistical and demographic issues pertaining to development. The demographic forecasts featured in the SUiKZP and yearly reports on the state of the city do not reflect the actual population count in Krakow for a number of reasons. First: the obligation to file residency declarations is not obeyed, which means that only some residents declare permanent or temporary residency. Second, dwellings are purchased as a form of capital investment. Such dwellings are often rented, and in the case of Krakow a large number of persons who rent apartments are university students, of whom there are 135 thousand in the city [68]. They are not obliged to file residency declarations in Krakow, thus they are not considered as residents, although they significantly contribute to overall population count. Finally, users of urban public spaces also include residents of neighbouring municipalities who work and study in Krakow.
In light of the above, it is clear that the official demographic data published by the UMK or GUS are far from reflecting the actual state. However the more precise data or coherent datasets are not yet available. The lack of coherent statistical data was also pointed out by other green space accessibility studies of Polish cities [34,92]. These conditions can be described as difficult not only form a research point of view, but also that of city policy towards providing green spaces.
5. Conclusions
The study was aimed to answer the question whether and if so, to what degree, does the spatial development model that has been implemented in Krakow for the past ten years can affect green spaces. The focus was put on an analysis of a specific case of a city park and its surroundings located within walking distance. The study demonstrated certain characteristics of the urban tissue in the delimited buffer zones of the Młynówka Królewska in Krakow. It was found that, in the selected timeframe, urban growth increased, and urbanisation processes manifested themselves in the form of, among others, the number of new multi-family housing complexes. It was shown that this phenomenon has an impact on use of the park area. It contributes to increasing the population in the surroundings of the park, and thus the number of potential park users, which if left uncontrolled can lead to the area becoming overcrowded. Therefore, a correlation between tendencies in urban development, population and the use of urban parks can be established.
By adopting a park-based perspective, this study fills a gap in the existing research by defining the tendency to experience the increased number of visitors of the green area. The transformations that were observed include especially the growth of built-up area, specifically dense multi-family housing. The study also demonstrated that the estimated number of the park’s users could have increased by as much as 70% over the past decade. This is critical observation, which casts a new light on green spaces management on the local and city scale. The index of park users per surface area unit of the park makes it possible to determine the capacity of recreational areas and can be used to better understand the relationships between green spaces and the surrounding development.
It was found that the present legal framework and city policy show certain shortcomings. First, it utilises official statistical data, which are not sufficient, as proved during research. This may lead to an underestimation of green areas planned on the city scale. Second, the lack of local plans (MPZP) can contribute to dispersing areas of high density, as the alternative procedure (WZ) is being used. Based on that procedure, several housing complexes in the analysed area were built in the zones other than multi-family. According to this development model, it is difficult to manage and even predict the city growth processes. In consequence, the goal of 10 m2 of recreational green area per capita, as mentioned in the KZiRTZ may be difficult to achieve.
The key limitation of the study derives mainly from its preliminary character. The selected type of analysis can provide only some of the answers to the complex range of problems connected with green areas provision, transformations of urban tissue and demographic processes. The available, yet far from sufficient spatial and statistical data were used in a series of estimations, which leads to approximate and not precise results on the actual population pressure on the park area. Nonetheless, the study provided interesting insight on the issue of housing development in context of green area provision. Additionally, it should be noted that in spatial planning and urban planning tools such as indicators, indices, factors or estimates are frequently used. The selected case is also a certain limitation, as it describes a unique situation. Młynówka Królewska Park is an attractive space, located in a big city with rich urban history, and, as a linear park, it is also well connected with surrounding urban tissue. Furthermore, managing urbanisation processes, and hence the provision of green areas, is highly dependent on applicable legal regulations and existing urban standards or lack thereof. The above considered, further research of the problem of population pressure and overcrowding of urban green areas should aim at the comparison of case studies from different locations. The experiences of other countries with various spatial and legal backgrounds may allow us to generalize the research findings.
Funding
This research received no external funding.
Institutional Review Board Statement
Not applicable.
Informed Consent Statement
Not applicable.
Data Availability Statement
Data available in a publicly accessible repositories of the different branches of the Office of the City of Cracow and the General Statistics Office. They are all showed in “References” section.
Conflicts of Interest
The author declare no conflict of interest.
References
- Carneiro Freire, S.; Corban, C.; Ehrlich, D.; Florczyk, A.; Kemper, T.; Maffenini, L.; Melchiorri, M.; Pesaresi, M.; Schiavina, M.; Tommasi, P. Atlas of the Human Planet 2019; Publications Office of the European Union: Luxembourg, 2019. [Google Scholar]
- OECD/European Commission. Cities in the World: A New Perspective on Urbanisation; OECD Urban Studies; OECD Publishing: Paris, France, 2020. [Google Scholar]
- United Nations. Transforming Our World: The 2030 Agenda for Sustainable Development. A/RES/70/1. 2015, Volume 16301. Available online: https://sdgs.un.org/2030agenda (accessed on 4 October 2020).
- Klopp, J.M.; Petretta, D.L. The urban sustainable development goal: Indicators, complexity and the politics of measuring cities. Cities 2017, 63, 92–97. [Google Scholar] [CrossRef]
- Cohen, D.A.; McKenzie, T.L.; Sehgal, A.; Williamson, S.; Golinelli, D.; Lurie, N. Contribution of public parks to physical activity. Am. J. Public Health 2007, 97, 509–514. [Google Scholar] [CrossRef] [PubMed]
- Rydin, Y.; Bleahu, A.; Davies, M.; Dávila, J.D.; Friel, S.; De Grandis, G.; Groce, N.; Hallal, P.C.; Hamilton, I.; Howden-Chapman, P.; et al. Shaping cities for health: Complexity and the planning of urban environments in the 21st century. Lancet 2012, 379, 2079–2108. [Google Scholar] [CrossRef]
- Kothencz, G.; Kolcsár, R.; Cabrera-Barona, P.; Szilassi, P. Urban Green Space Perception and Its Contribution to Well-Being. Int. J. Environ. Res. Public Health 2017, 14, 766. [Google Scholar] [CrossRef]
- Wolch, J.R.; Byrne, J.; Newell, J.P. Urban green space, public health, and environmental justice: The challenge of making cities “just green enough”. Landsc. Urban Plan. 2014, 125, 234–244. [Google Scholar] [CrossRef]
- Maas, J.; Verheij, R.A.; De Vries, S.; Spreeuwenberg, P.; Schellevis, F.G.; Groenewegen, P.P. Morbidity is related to a green living environment. J. Epidemiol. Community Health 2009, 63, 967–973. [Google Scholar] [CrossRef]
- Koohsari, M.J.; Mavoa, S.; Villianueva, K.; Sugiyama, T.; Badland, H.; Kaczynski, A.T.; Owen, N.; Giles-Corti, B. Public open space, physical activity, urban design and public health: Concepts, methods and research agenda. Health Place 2015, 33, 75–82. [Google Scholar] [CrossRef]
- Kaczynski, A.T.; Potwarka, L.R.; Saelens, P.B.E. Association of park size, distance, and features with physical activity in neighborhood parks. Am. J. Public Health 2008, 98, 1451–1456. [Google Scholar] [CrossRef]
- Schipperijn, J.; Cerin, E.; Adams, M.A.; Reis, R.; Smith, G.; Cain, K.; Christiansen, L.B.; Dyck, D.; van Gidlow, C.; Frank, L.D.; et al. Access to parks and physical activity: An eight country comparison. Urban For. Urban Green. 2017, 27, 253–263. [Google Scholar] [CrossRef]
- Wang, R.; Helbich, M.; Yao, Y.; Zhang, J.; Liu, P.; Yuan, Y.; Liu, Y. Urban greenery and mental wellbeing in adults: Cross-sectional mediation analyses on multiple pathways across different greenery measures. Environ. Res. 2019, 176, 108535. [Google Scholar] [CrossRef]
- Jennings, V.; Bamkole, O. The relationship between social cohesion and urban green space: An avenue for health promotion. Int. J. Environ. Res. Public Health 2019, 16, 452. [Google Scholar] [CrossRef] [PubMed]
- Wang, R.; Zhao, J.; Meitner, M.J.; Hu, Y.; Xu, X. Characteristics of urban green spaces in relation to aesthetic preference and stress recovery. Urban For. Urban Green. 2019, 41, 6–13. [Google Scholar] [CrossRef]
- Xie, G.; Chen, W.; Cao, S.; Lu, C.; Xiao, Y.; Zhang, C.; Li, N.; Wang, S. The Outward Extension of an Ecological Footprint in City Expansion: The Case of Beijing. Sustainability 2014, 6, 9371–9386. [Google Scholar] [CrossRef]
- Badach, J.; Dymnicka, M.; Baranowski, A. Urban vegetation in air quality management: A review and policy framework. Sustainability 2020, 12, 1258. [Google Scholar] [CrossRef]
- Lafortezza, R.; Chen, J.; van den Bosch, C.K.; Randrup, T.B. Nature-based solutions for resilient landscapes and cities. Environ. Res. 2018, 165, 431–441. [Google Scholar] [CrossRef] [PubMed]
- Russo, A.; Cirella, G.T. Modern compact cities: How much greenery do we need? Int. J. Environ. Res. Public Health 2018, 15, 2180. [Google Scholar] [CrossRef] [PubMed]
- John, H.; Neubert, M.; Marrs, C.; Alberico, S.; Bovo, G.; Ciadamidaro, S.; Danzinger, F.; Erlebach, M.; Freudl, D.; Grasso, S.; et al. Green Infrastructure Handbook—Conceptual & Theoretical Background, Terms and Definitions; Interreg Central Europe Project MaGICLandscapes: Dresden, Germany, 2019. [Google Scholar]
- European Environmental Agency Urban Green Infrastructure—Interactive Map. Available online: https://eea.maps.arcgis.com/apps/MapSeries/index.html?appid=42bf8cc04ebd49908534efde04c4eec8 (accessed on 4 October 2020).
- Kabisch, N.; Qureshi, S.; Haase, D. Human-environment interactions in urban green spaces—A systematic review of contemporary issues and prospects for future research. Environ. Impact Assess. Rev. 2015, 50, 25–34. [Google Scholar] [CrossRef]
- Wüstemann, H.; Kalisch, D.; Kolbe, J. Access to urban green space and environmental inequalities in Germany. Landsc. Urban Plan. 2017, 164, 124–131. [Google Scholar] [CrossRef]
- Biernacka, M.; Kronenberg, J. Classification of institutional barriers affecting the availability, accessibility and attractiveness of urban green spaces. Urban For. Urban Green. 2018, 36, 22–33. [Google Scholar] [CrossRef]
- Zhu, Z.; Lang, W.; Tao, X.; Feng, J.; Liu, K. Exploring the quality of urban green spaces based on urban neighborhood green index-a case study of Guangzhou city. Sustainability 2019, 11, 5507. [Google Scholar] [CrossRef]
- Kabisch, N.; Haase, D. Green spaces of European cities revisited for 1990–2006. Landsc. Urban Plan. 2013, 110, 113–122. [Google Scholar] [CrossRef]
- Rigolon, A.; Browning, M.; Lee, K.; Shin, S. Access to Urban Green Space in Cities of the Global South: A Systematic Literature Review. Urban Sci. 2018, 2, 67. [Google Scholar] [CrossRef]
- Fuller, R.A.; Gaston, K.J. The scaling of green space coverage in European cities. Biol. Lett. 2009, 5, 352–355. [Google Scholar] [CrossRef] [PubMed]
- Kabisch, N.; Strohbach, M.; Haase, D.; Kronenberg, J. Urban green space availability in European cities. Ecol. Indic. 2016, 70, 586–596. [Google Scholar] [CrossRef]
- Karimi, K. A configurational approach to analytical urban design: ‘Space syntax’ methodology. Urban Des. Int. 2012, 17, 297–316. [Google Scholar] [CrossRef]
- Batty, M. A New Theory of Space Syntax. Casa Work. Pap. 2004, 44, 1–36. [Google Scholar]
- Crucitti, P.; Latora, V.; Porta, S. Centrality in Network of Urban Streets. Chaos 2006, 16, 015113. [Google Scholar] [CrossRef]
- Pérez-Campaña, R.; Abarca-Alvarez, F.J.; Talavera-García, R. Centralities in the city border: A method to identify strategic urban-rural interventions. Ri-Vista 2016, 14, 38–53. [Google Scholar] [CrossRef]
- Wysmułek, J.; Hełdak, M.; Kucher, A. The Analysis of Green Areas’ Accessibility in Comparison with Statistical Data in Poland. Int. J. Environ. Res. Public Health 2020, 17, 4492. [Google Scholar] [CrossRef]
- Korwel-Lejkowska, B.; Topa, E. Dostępność parków miejskich jako elementów zielonej infrastruktury w Gdańsku. Rozw. Reg. Polityka Reg. 2017, 37, 63–75. [Google Scholar] [CrossRef]
- European Environment Agency (EEA). Urban Sustainability Issues—What Is a Resource-Efficient City? Publications Office of the European Union: Luxembourg, 2015; Available online: https://www.eea.europa.eu/publications/resource-efficient-cities (accessed on 14 October 2020).
- Wüstemann, H.; Kalisch, D.; Kolbe, J. Towards a national indicator provision and environmental inequalities in Germany: Method and findings. Landsc. Urban Plan. 2016, 164, 124–131. [Google Scholar] [CrossRef]
- Le Texier, M.; Schiel, K.; Caruso, G. The provision of urban green space and its accessibility: Spatial data effects in Brussels. PLoS ONE 2018, 13, e0204684. [Google Scholar] [CrossRef]
- Chiesura, A. The role of urban parks for the sustainable city. Landsc. Urban Plan. 2004, 68, 129–138. [Google Scholar] [CrossRef]
- Nam, J.; Dempsey, N. Place-Keeping for Health? Charting the Challenges for Urban Park Management in Practice. Sustainability 2019, 11, 4383. [Google Scholar] [CrossRef]
- Cortinovis, C.; Zulian, G.; Geneletti, D. Assessing Nature-Based Recreation to Support Urban Green Infrastructure Planning in Trento (Italy). Land 2018, 7, 112. [Google Scholar] [CrossRef]
- Lindberg, M.; Schipperijn, J. Active use of urban park facilities—Expectations versus reality. Urban For. Urban Green. 2015, 14, 909–918. [Google Scholar] [CrossRef]
- Bahriny, F.; Bell, S. Patterns of Urban Park Use and Their Relationship to Factors of Quality: A Case Study of Tehran, Iran. Sustainability 2020, 12, 1560. [Google Scholar] [CrossRef]
- Voigt, A.; Kabisch, N.; Wurster, D.; Haase, D.; Breuste, J. Structural diversity: A multi-Dimensional approach to assess recreational services in urban parks. Ambio 2014, 43, 480–491. [Google Scholar] [CrossRef]
- Gupta, K.; Roy, A.; Luthra, K.; Maithani, S. GIS based analysis for assessing the accessibility at hierarchical levels of urban green spaces. Urban For. Urban Green. 2016, 18, 198–211. [Google Scholar] [CrossRef]
- Onose, D.A.; Iojă, I.C.; Niță, M.R.; Vânău, G.O.; Popa, A.M. Too Old for Recreation? How Friendly Are Urban Parks for Elderly People? Sustainability 2020, 12, 790. [Google Scholar] [CrossRef]
- Kothencz, G.; Blaschke, T. Urban parks: Visitors’ perceptions versus spatial indicators. Land Use Policy 2017, 64, 233–244. [Google Scholar] [CrossRef]
- Wright Wendel, H.E.; Zarger, R.K.; Mihelcic, J.R. Accessibility and usability: Green space preferences, perceptions, and barriers in a rapidly urbanizing city in Latin America. Landsc. Urban Plan. 2012, 107, 272–282. [Google Scholar] [CrossRef]
- Arnberger, A. Urban densification and recreational quality of public Urban green spaces-A viennese case study. Sustainability 2012, 4, 703–720. [Google Scholar] [CrossRef]
- Arnberger, A.; Haider, W. Social effects on crowding preferences of urban forest visitors. Urban For. Urban Green. 2005, 3, 125–136. [Google Scholar] [CrossRef]
- Encyklopedia Krakowa. Encyklopedia Krakowa; Stachowski, A.H., Adamczyk, E., Eds.; PWN: Warszawa/Kraków, Poland, 2000. [Google Scholar]
- Romańczyk, K.M. Krakow—The city profile revisited. Cities 2018, 73, 138–150. [Google Scholar] [CrossRef]
- Purchla, J. Kraków w Europie Środka; BOSZ: Lesko, Poland, 2007. [Google Scholar]
- Office of the City of Krakow (UMK). Poczet Krakowski. Available online: https://www.poczetkrakowski.pl/ (accessed on 1 January 2021). (In Polish).
- Kurek, S.; Wójtowicz, M.; Gałka, J. The changing role of migration and natural increase in suburban population growth: The case of a non-capital post-socialist city (The Krakow Metropolitan Area, Poland). Morav. Geogr. Rep. 2015, 23, 53–70. [Google Scholar] [CrossRef]
- Musiał-Malagó, M. Procesy suburbanizacji obszarów podmiejskich Krakowa. Zesz. Nauk. Uniw. Ekon. Krakowie 2014, 936, 63–77. [Google Scholar] [CrossRef]
- Harańczyk, A. Procesy Suburbanizacji w Krakowskim Obszarze Funkcjonalnym. Stud. Miej. 2015, 18, 85–102. [Google Scholar]
- Office of the City of Krakow (UMK). Raport o Stanie Miasta 1991–2019. Available online: https://www.bip.krakow.pl/?id=509 (accessed on 12 September 2020). (In Polish).
- Zespół Parków Krajobrazowych Województwa Małopolskiego. Available online: https://zpkwm.pl/ (accessed on 29 December 2020).
- Giannakis, E.; Bruggeman, A.; Poulou, D.; Zoumides, C.; Eliades, M. Linear Parks along Urban Rivers: Perceptions of Thermal Comfort and Climate Change Adaptation in Cyprus. Sustainability 2016, 8, 1023. [Google Scholar] [CrossRef]
- Office of the City of Krakow (UMK). Kierunki Rozwoju i Zarządzania Terenami Zieleni w Krakowie na Lata 2017–2030 (In Polish); Kraków. 2017. Available online: https://zzm.krakow.pl/dla-mieszkancow/kriztz/tresc.html (accessed on 22 October 2020).
- Dąbrowska-Milewska, G. Czy w Polsce potrzebne są krajowe standardy urbanistyczne dla terenów mieszkaniowych? Arch. Artibus 2010, 2, 12–16. [Google Scholar]
- Ministerstwo Infrastruktury. Rozporządzenie Ministra Infrastruktury z dnia 12 kwietnia 2002 r. w Sprawie Warunków Technicznych, Jakim Powinny Odpowiadać Budynki i ich Usytuowanie, Wraz z Późniejszymi Zmianami. Dz.U. 2002 nr 75 poz. 690 z późn. zm. (In Polish). Available online: https://isap.sejm.gov.pl/isap.nsf/download.xsp/WDU20020750690/O/D20020690.pdf (accessed on 21 October 2020).
- Dąbrowska-Milewska, G. Standardy urbanistyczne dla terenów mieszkaniowych—wybrane zagadnienia. Arch. Artibus 2010, 2, 17–31. [Google Scholar]
- Węcławowicz, G. Urban Development in Poland, from the Socialist City to the Post-Socialist and Neoliberal City. In Social Polarisation in the New Town Regions of East-Central Europe; Institute for Sociology, Centre for Social Sciences Hungarian Academy of Sciences: Budapest, Hungary, 2016; pp. 65–82. [Google Scholar]
- Taubenböck, H.; Gerten, C.; Rusche, K.; Siedentop, S.; Wurm, M. Patterns of Eastern European urbanisation in the mirror of Western trends—Convergent, unique or hybrid? Environ. Plan. B Urban Anal. City Sci. 2019, 46, 1206–1225. [Google Scholar] [CrossRef]
- Office of the City of Krakow (UMK). STUDIUM Uwarunkowań i Kierunków Zagospodarowania Przestrzennego Miasta Krakowa—Dokument Ujednolicony; Kraków. 2014. Available online: https://www.bip.krakow.pl/?id=48 (accessed on 12 November 2020). (In Polish).
- Hołuj, A.; Zawilińska, B. Planning Documents Issued in Poland at the Municipal Level. Example of the Krakow Metropolitan Area. J. Settl. Spat. Plan. 2013, 4, 122–124. [Google Scholar]
- Musiał-Malagó, M.; Hołuj, A. Znaczenie dokumentów planistycznych w zagospodarowaniu przestrzeni Krakowa. Zesz. Nauk. Uniw. Ekon. Krakowie 2014, 1, 105–126. [Google Scholar] [CrossRef]
- Wagner, M. Evading spatial planning law-Case study of Poland. Land Use Policy 2016, 57, 396–404. [Google Scholar] [CrossRef]
- Badora, K. O potrzebie i możliwościach przebudowy Krajowego Systemu Ochrony Krajobrazu About need and possibilities of reconstruction of the National Landscape Conservation System. Landscape 2009, 23, 29–35. [Google Scholar]
- Zachariasz, A. Development of the System of the Green Areas of Krakow from the Nineteenth Century to the Present, in the Context of Model Solutions. In IOP Conference Series: Materials Science and Engineering; Institute of Physics Publishing: Prague, Czech Republic, 2019; Volume 471, p. 110297. [Google Scholar]
- Semczuk, M.; Serafin, P.; Zawilińska, B. Dzielnice samorządowe w świadomości mieszkańców miasta na przykładzie wybranych dzielnic Krakowa. Biul. Kom. Przestrz. Zagospod. Kraj. Pan 2018, 270, 159–173. [Google Scholar]
- General Statistics Office (GUS). Available online: https://krakow.stat.gov.pl/ (accessed on 20 November 2020).
- De Sousa Silva, C.; Viegas, I.; Panagopoulos, Τ.; Bell, S. Environmental Justice in Accessibility to Green Infrastructure in Two European Cities. Land 2018, 7, 134. [Google Scholar] [CrossRef]
- Fan, P.; Xu, L.; Yue, W.; Chen, J. Accessibility of public urban green space in an urban periphery: The case of Shanghai. Landsc. Urban Plan. 2017, 165, 177–192. [Google Scholar] [CrossRef]
- Mears, M.; Brindley, P.; Jorgensen, A.; Maheswaran, R. Population-level linkages between urban greenspace and health inequality: The case for using multiple indicators of neighbourhood greenspace. Health Place 2020, 62, 102284. [Google Scholar] [CrossRef]
- Stein, C.S. The Radburn Plan. Notes on the new town planned for the city Housing corporation. In The Writings of Clarence S. Stein: Architect of the Planned Community; Parsons, K.C., Ed.; John Hopkins University Press: Baltimore, MD, USA, 1998; pp. 150–152. [Google Scholar]
- Perry, C. The Neighborhood Unit: A Scheme of Arrangement for the Family Life Community. Reg. Plan N. Y. Its Envion. 1929, 8, 30. [Google Scholar]
- El-Geneidy, A.; Grimsrud, M.; Wasfi, R.; Tétreault, P.; Surprenant-Legault, J. New evidence on walking distances to transit stops: Identifying redundancies and gaps using variable service areas. Transportation 2014, 41, 193–210. [Google Scholar] [CrossRef]
- Wen, C.; Albert, C.; Von Haaren, C. Equality in access to urban green spaces: A case study in Hannover, Germany, with a focus on the elderly population. Urban For. Urban Green. 2020, 55, 126820. [Google Scholar] [CrossRef]
- Campos-Sánchez, F.S.; Valenzuela-Montes, L.M.; Abarca-Álvarez, F.J. Evidence of Green Areas, Cycle Infrastructure and Attractive Destinations Working Together in Development on Urban Cycling. Sustainability 2019, 11, 4730. [Google Scholar] [CrossRef]
- Chang, Q.; Li, X.; Huang, X.; Wu, J. A GIS-based Green Infrastructure Planning for Sustainable Urban Land Use and Spatial Development. Procedia Environ. Sci. 2012, 12, 491–498. [Google Scholar] [CrossRef]
- Campos-Sánchez, F.S.; Abarca-Álvarez, F.J.; Reinoso-Bellido, R. Assessment of open spaces in inland medium-sized cities of eastern Andalusia (Spain) through complementary approaches: Spatial-configurational analysis and decision support. Eur. Plan. Stud. 2019, 27, 1270–1290. [Google Scholar] [CrossRef]
- Dudzic-Gyurkovich, K. Pokonywanie Barier Urbanistycznych Związanych z Układami Transportu na Obszarze Metropolii Barcelońskiej—Wybrane Problemy; Wydawnictwo PK: Kraków, Poland, 2019. [Google Scholar]
- Strohmeier, F. Barriers and their Influence on the Mobility Behavior of Elder Pedestrians in Urban Areas: Challenges and Best Practice for Walkability in the City of Vienna. Transp. Res. Procedia 2016, 14, 1134–1143. [Google Scholar] [CrossRef]
- Talavera-Garcia, R.; Soria-Lara, J.A. Q-PLOS, developing an alternative walking index. A method based on urban design quality. Cities 2015, 45, 7–17. [Google Scholar] [CrossRef]
- Badland, H.M.; Keam, R.; Witten, K.; Kearns, R. Examining public open spaces by neighborhood-level walkability and deprivation. J. Phys. Act. Health 2010, 7, 818–824. [Google Scholar] [CrossRef]
- Lo, R.H. Walkability: What is it? J. Urban. 2009, 2, 145–166. [Google Scholar] [CrossRef]
- Duncan, D.T.; Aldstadt, J.; Whalen, J.; Melly, S.J.; Gortmaker, S.L. Validation of Walk Score ® for Estimating Neighborhood Walkability: An Analysis of Four US Metropolitan Areas. Int. J. Environ. Res. Public Health 2011, 8, 4160–4179. [Google Scholar] [CrossRef] [PubMed]
- Gehl, J. Life between the Buildings: Using Public Space; Island Press: Washington, DC, USA, 2011. [Google Scholar]
- Feltynowski, M.; Kronenberg, J.; Bergier, T.; Kabisch, N.; Łaszkiewicz, E.; Strohbach, M.W. Challenges of urban green space management in the face of using inadequate data. Urban For. Urban Green. 2018, 31, 56–66. [Google Scholar] [CrossRef]


Publisher’s Note: MDPI stays neutral with regard to jurisdictional claims in published maps and institutional affiliations. |
© 2021 by the author. Licensee MDPI, Basel, Switzerland. This article is an open access article distributed under the terms and conditions of the Creative Commons Attribution (CC BY) license (http://creativecommons.org/licenses/by/4.0/).