
Indoor Environmental Quality Survey in Research Institute: A Floor-by-Floor Analysis


Abstract
:1. Introduction
2. IEQ Survey in Research Institutes
2.1. Characteristics of Occupants
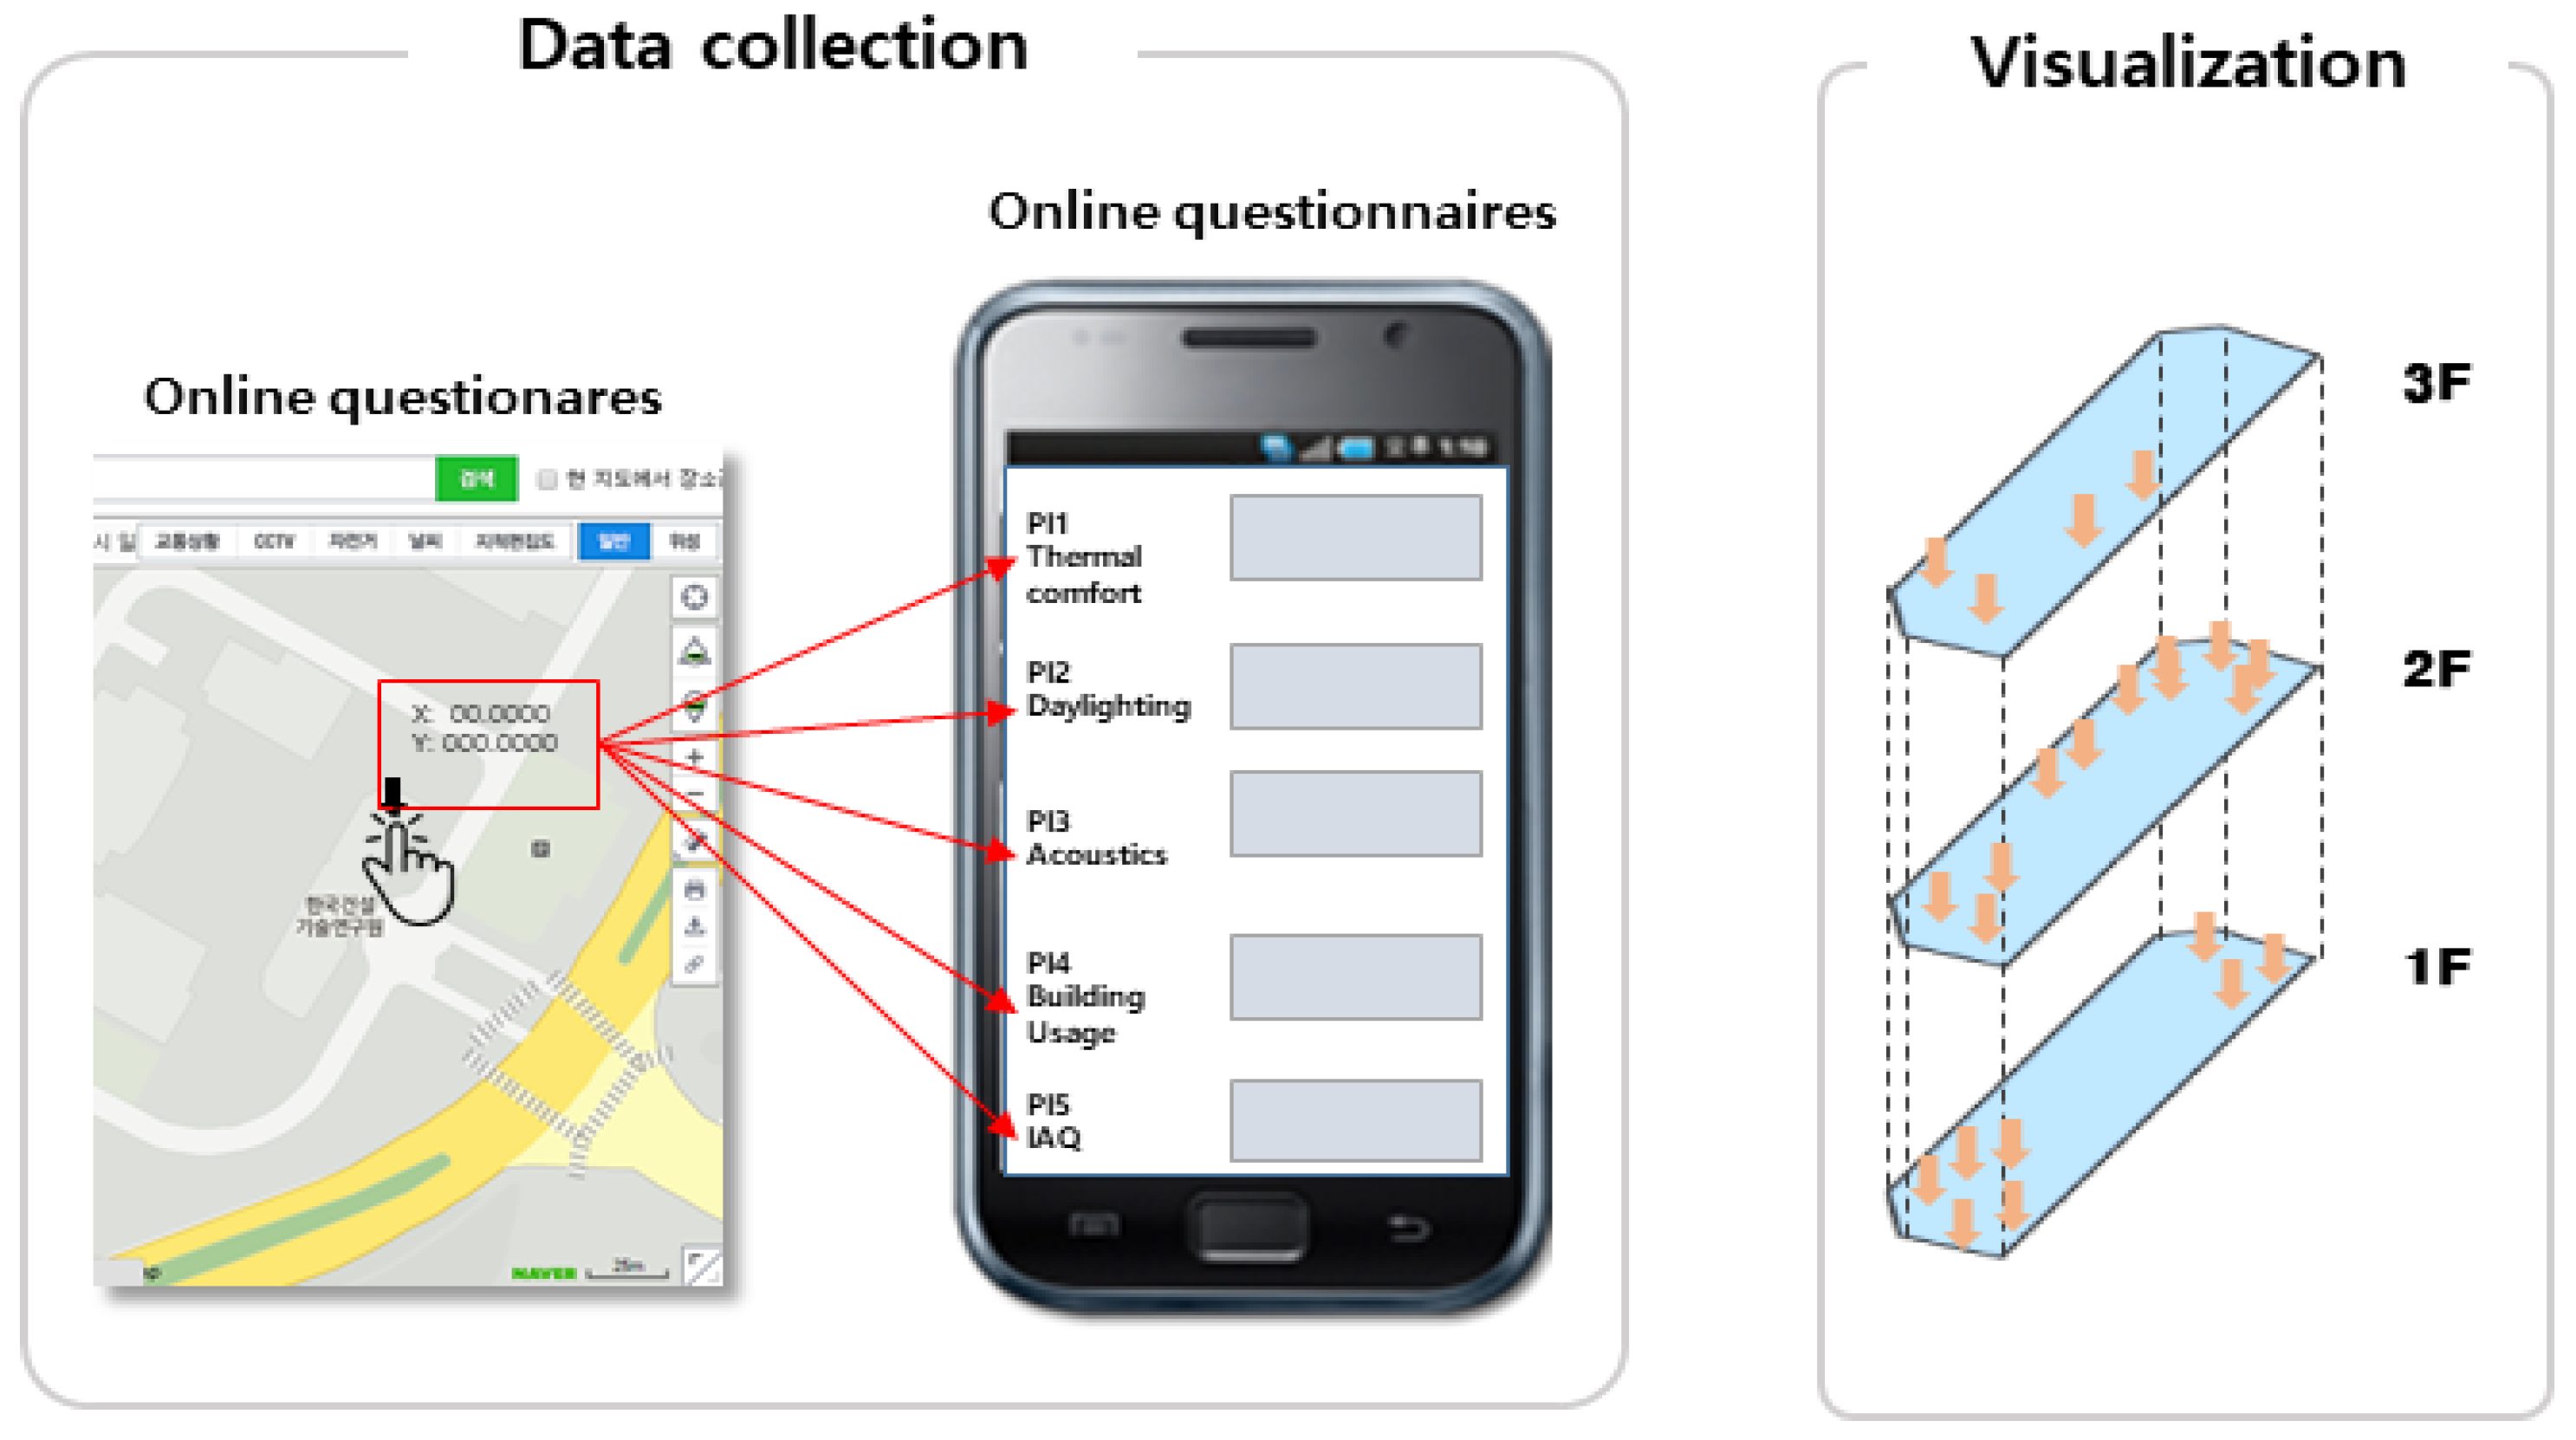
2.2. IEQ Factors and Survey Questionnaires
2.3. Survey Implementation
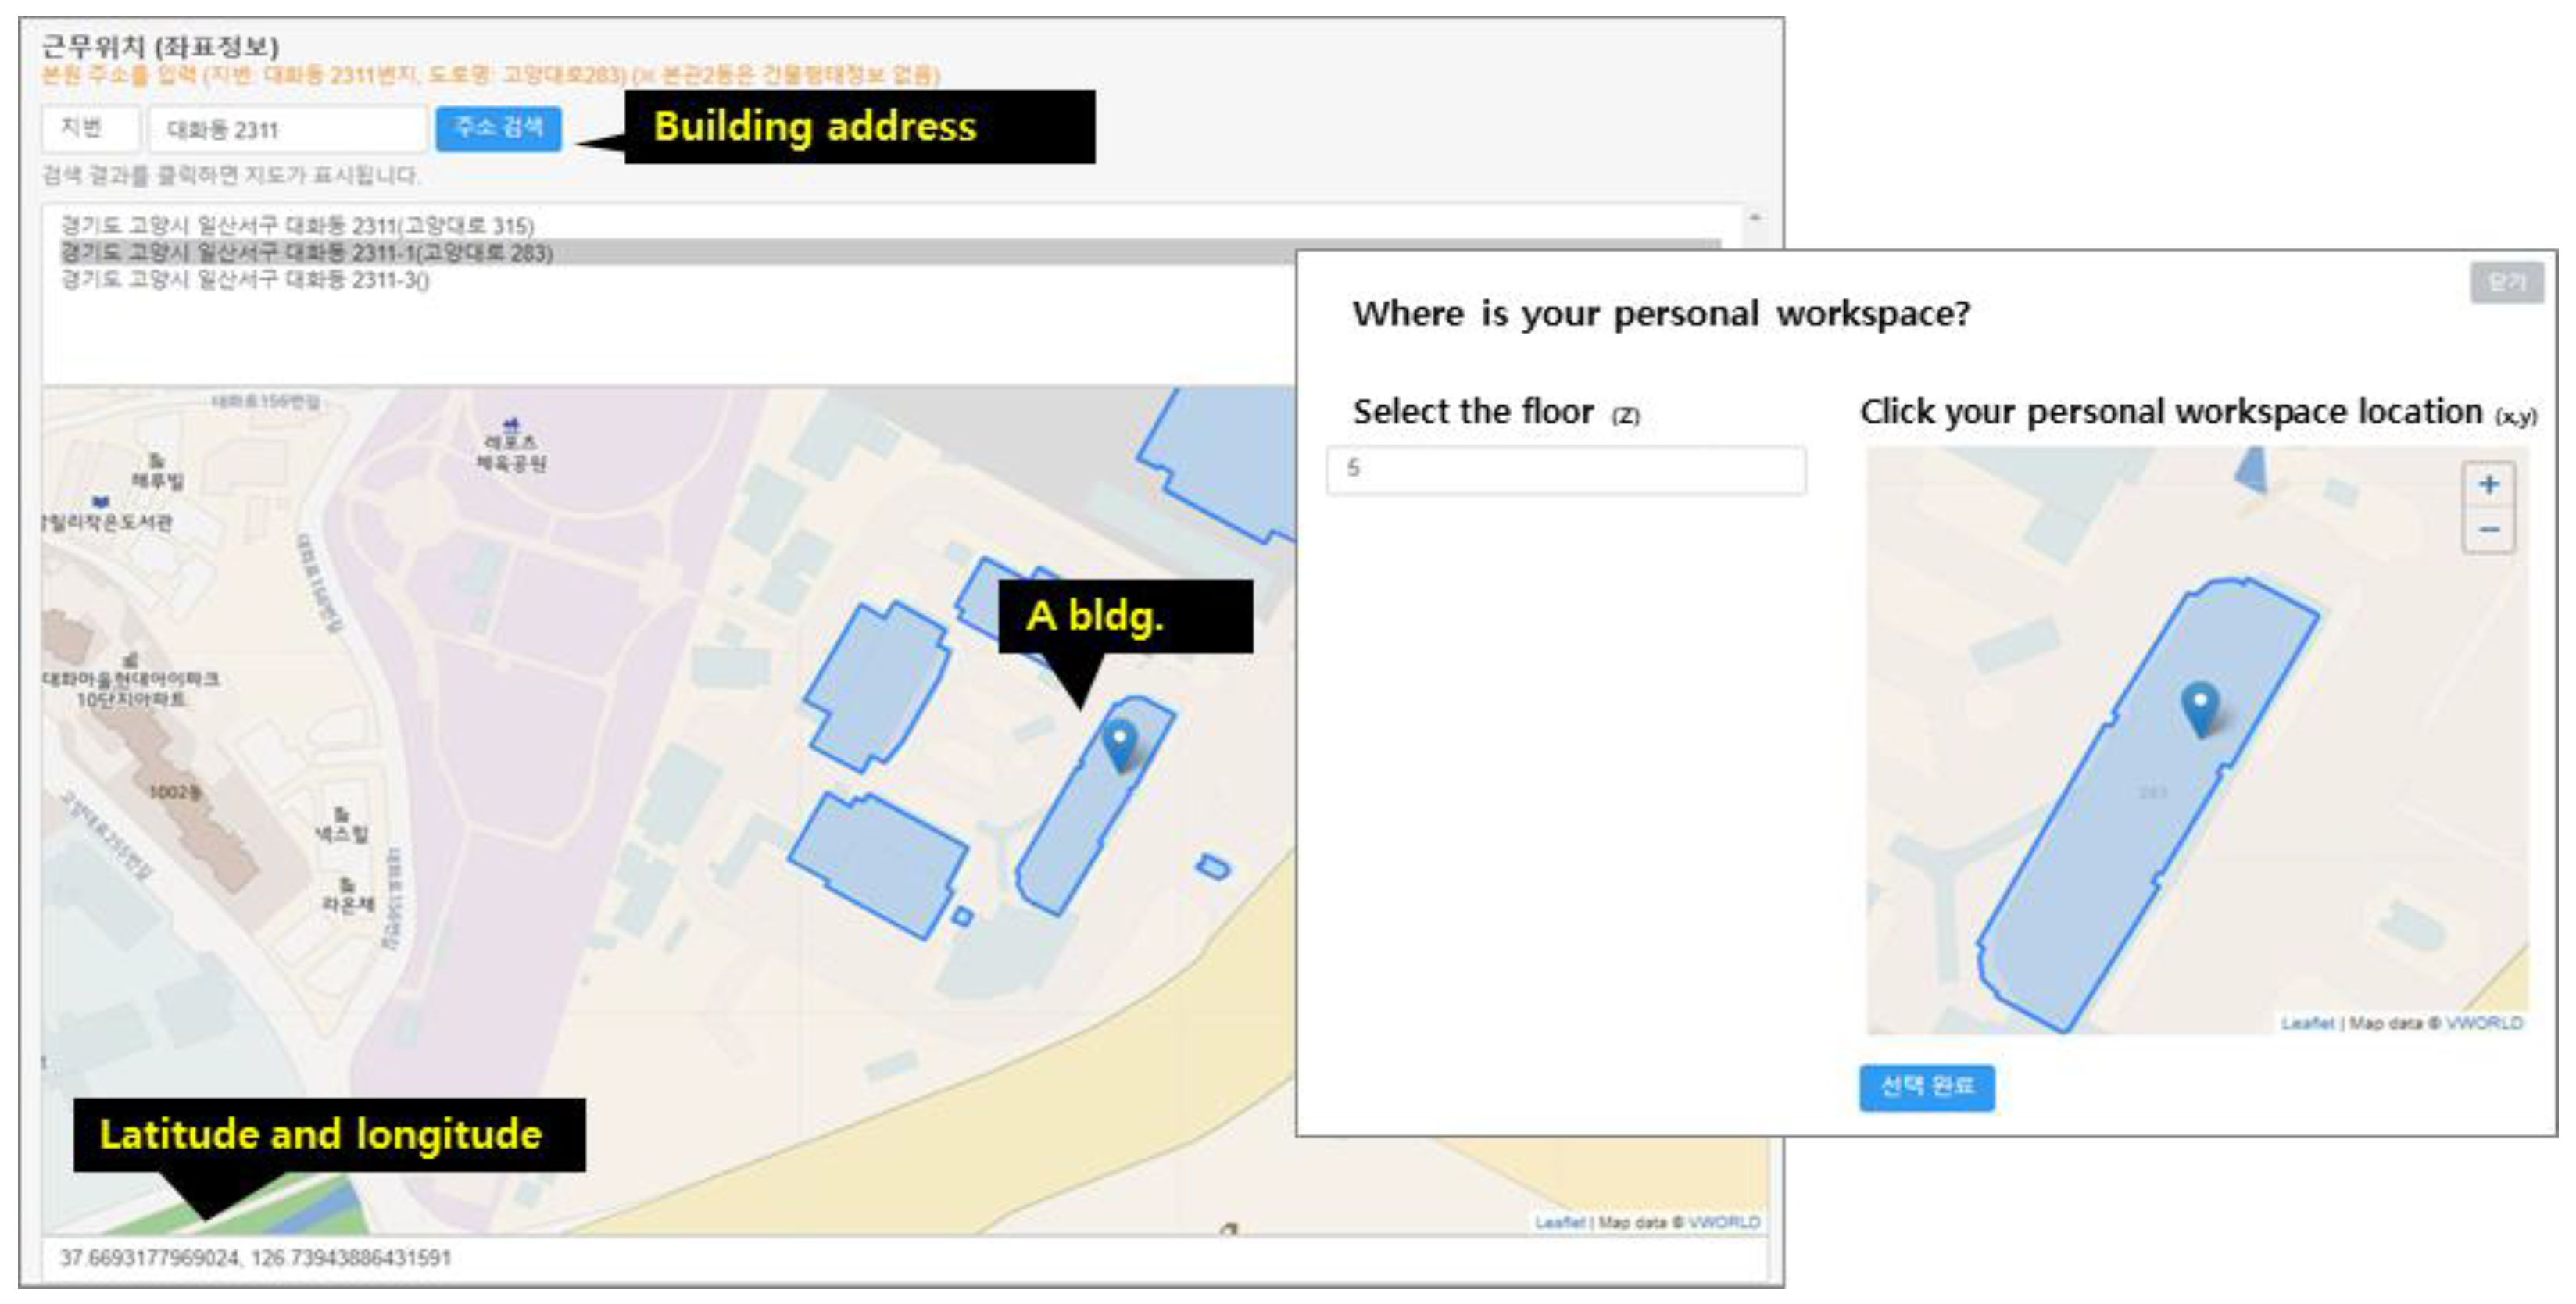
- The office building address of the user is entered, searched, and selected to complete the online survey as shown in Figure 2.
- The office location of the user is selected on the interior map of his or her office building. That is, from the pop-up window on the right-hand side, as shown in Figure 2, the user can directly click the latitude and longitude points [x, y] on the right map and select the height [z] in the left selection box.
3. Results
3.1. Descriptive Statistical Analysis Results of Individual Measurement Variables
3.2. Exploratory Factor and Reliability Analyses of Independent Variables
3.3. Exploratory Factor and Reliability Analyses for Dependent Variables
3.4. Effect of Office Layout Satisfaction, Thermal Comfort Satisfaction, Air Quality Satisfaction, Lighting Satisfaction, and Noise Satisfaction on Overall Satisfaction
3.5. Effect of Overall Satisfaction on Productivity
3.6. Critical Ratio Tests of Path Differences by Occupation
3.7. Differences in Overall Satisfaction According to Demographic Characteristics
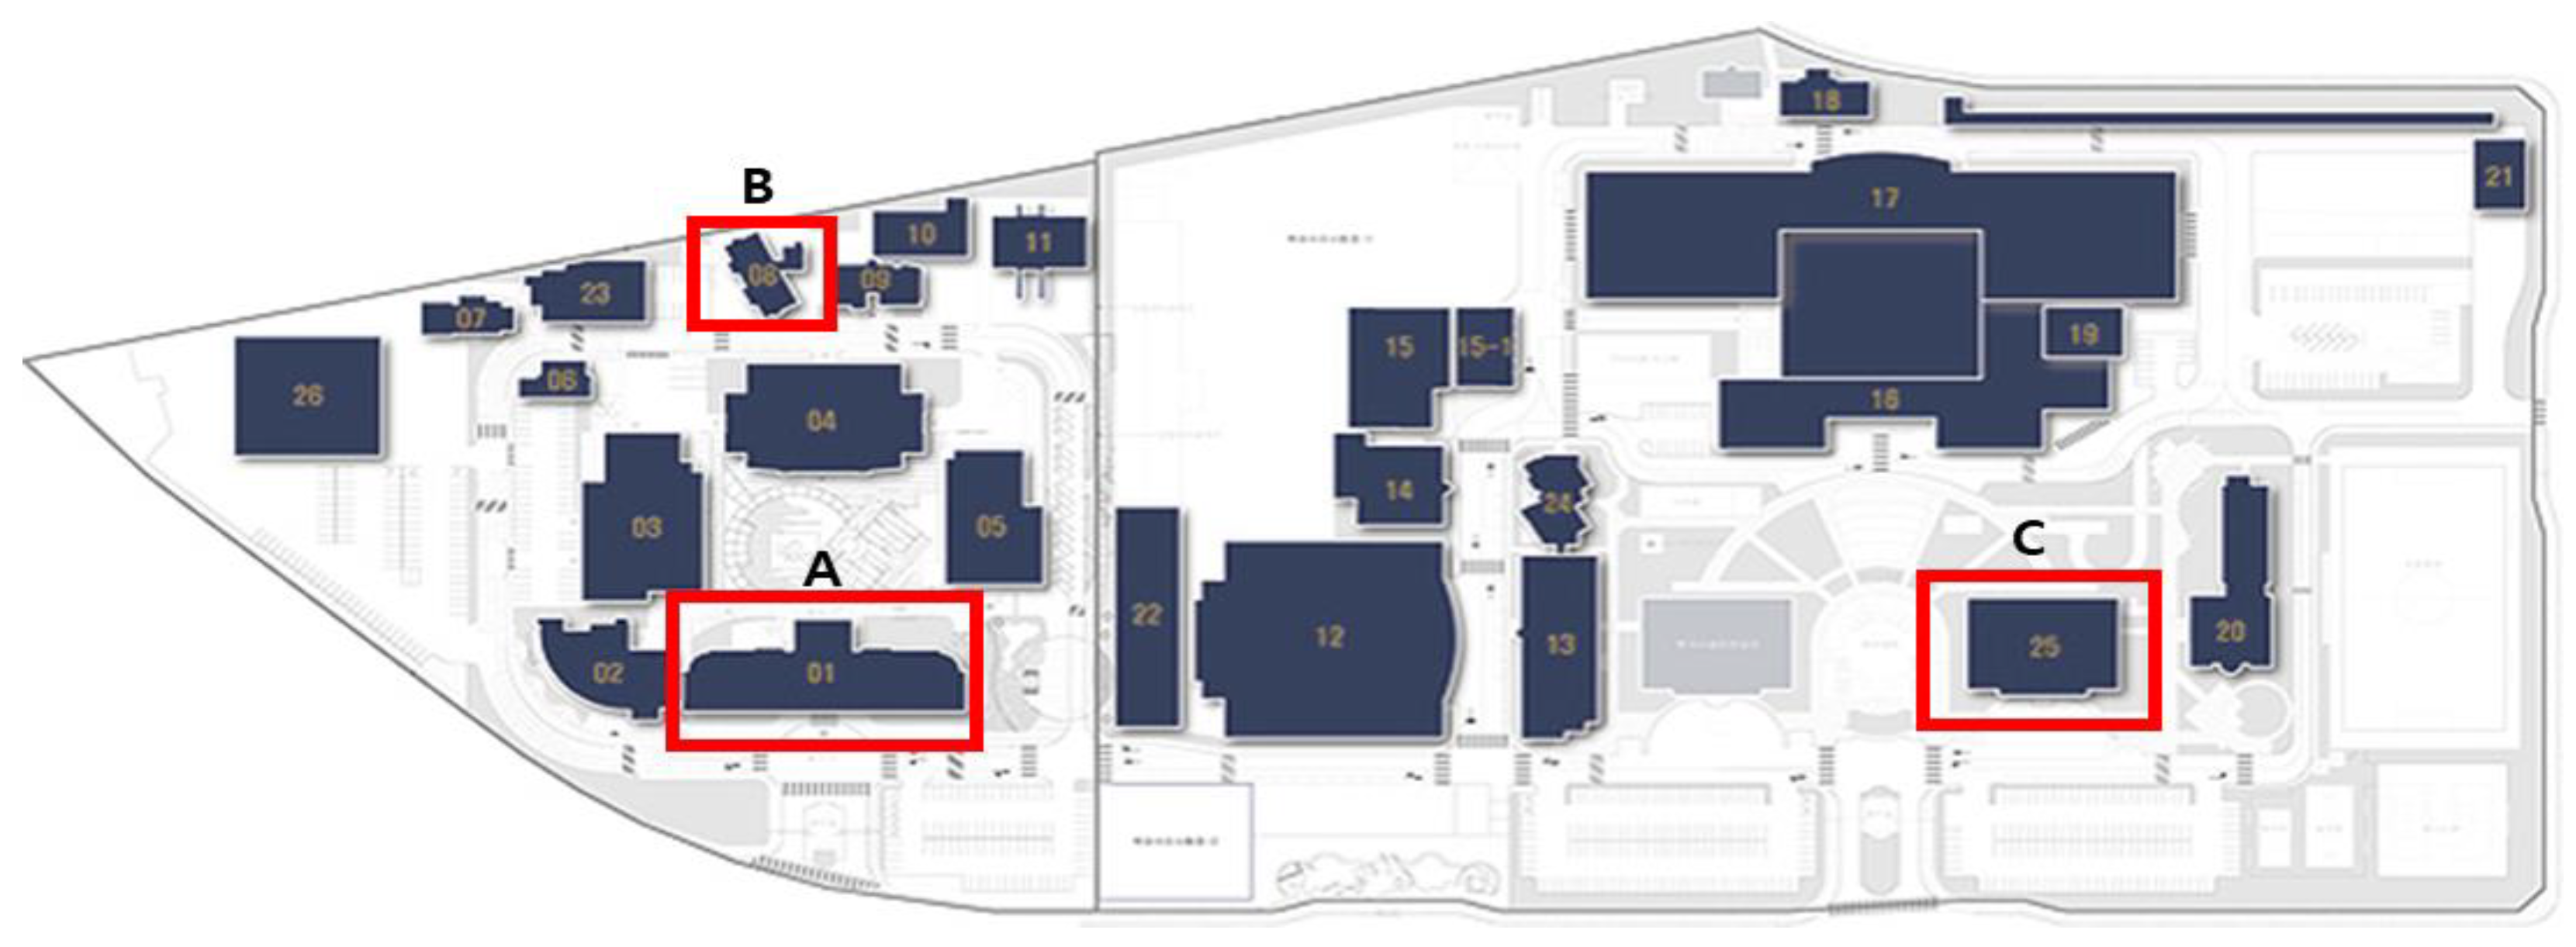
4. Building-by-Building and Floor-by-Floor Analyses
5. Discussion
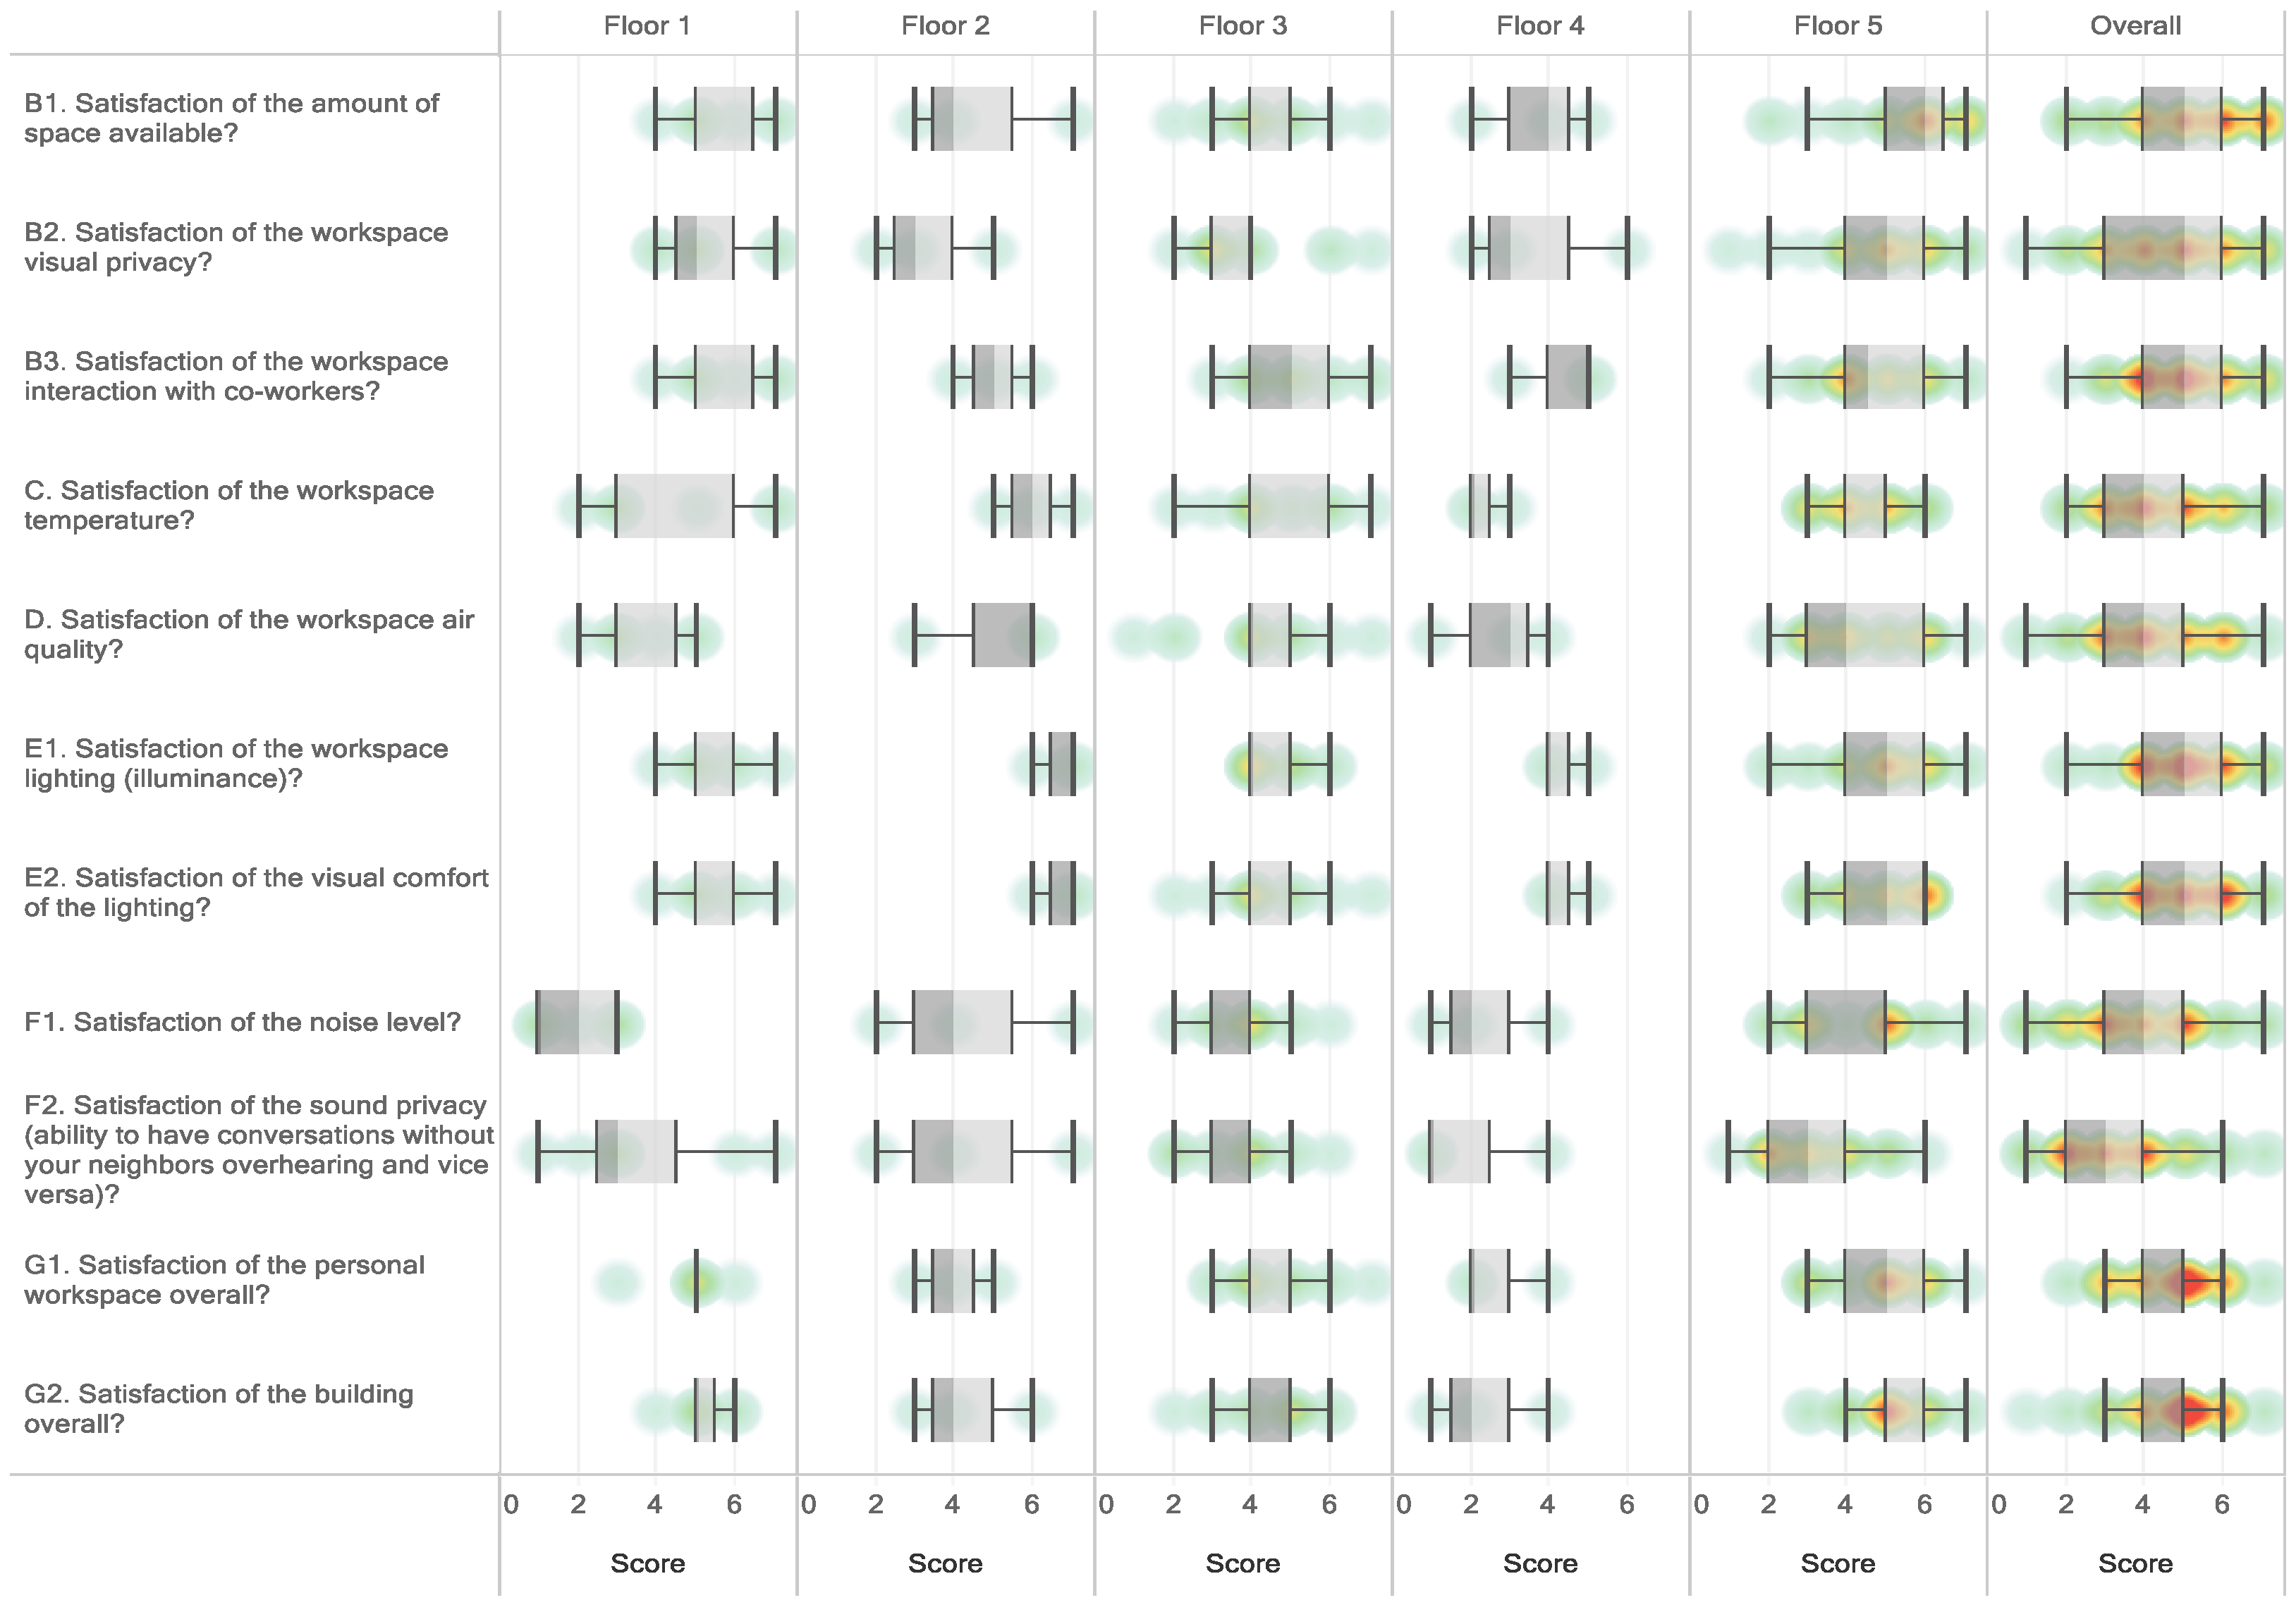
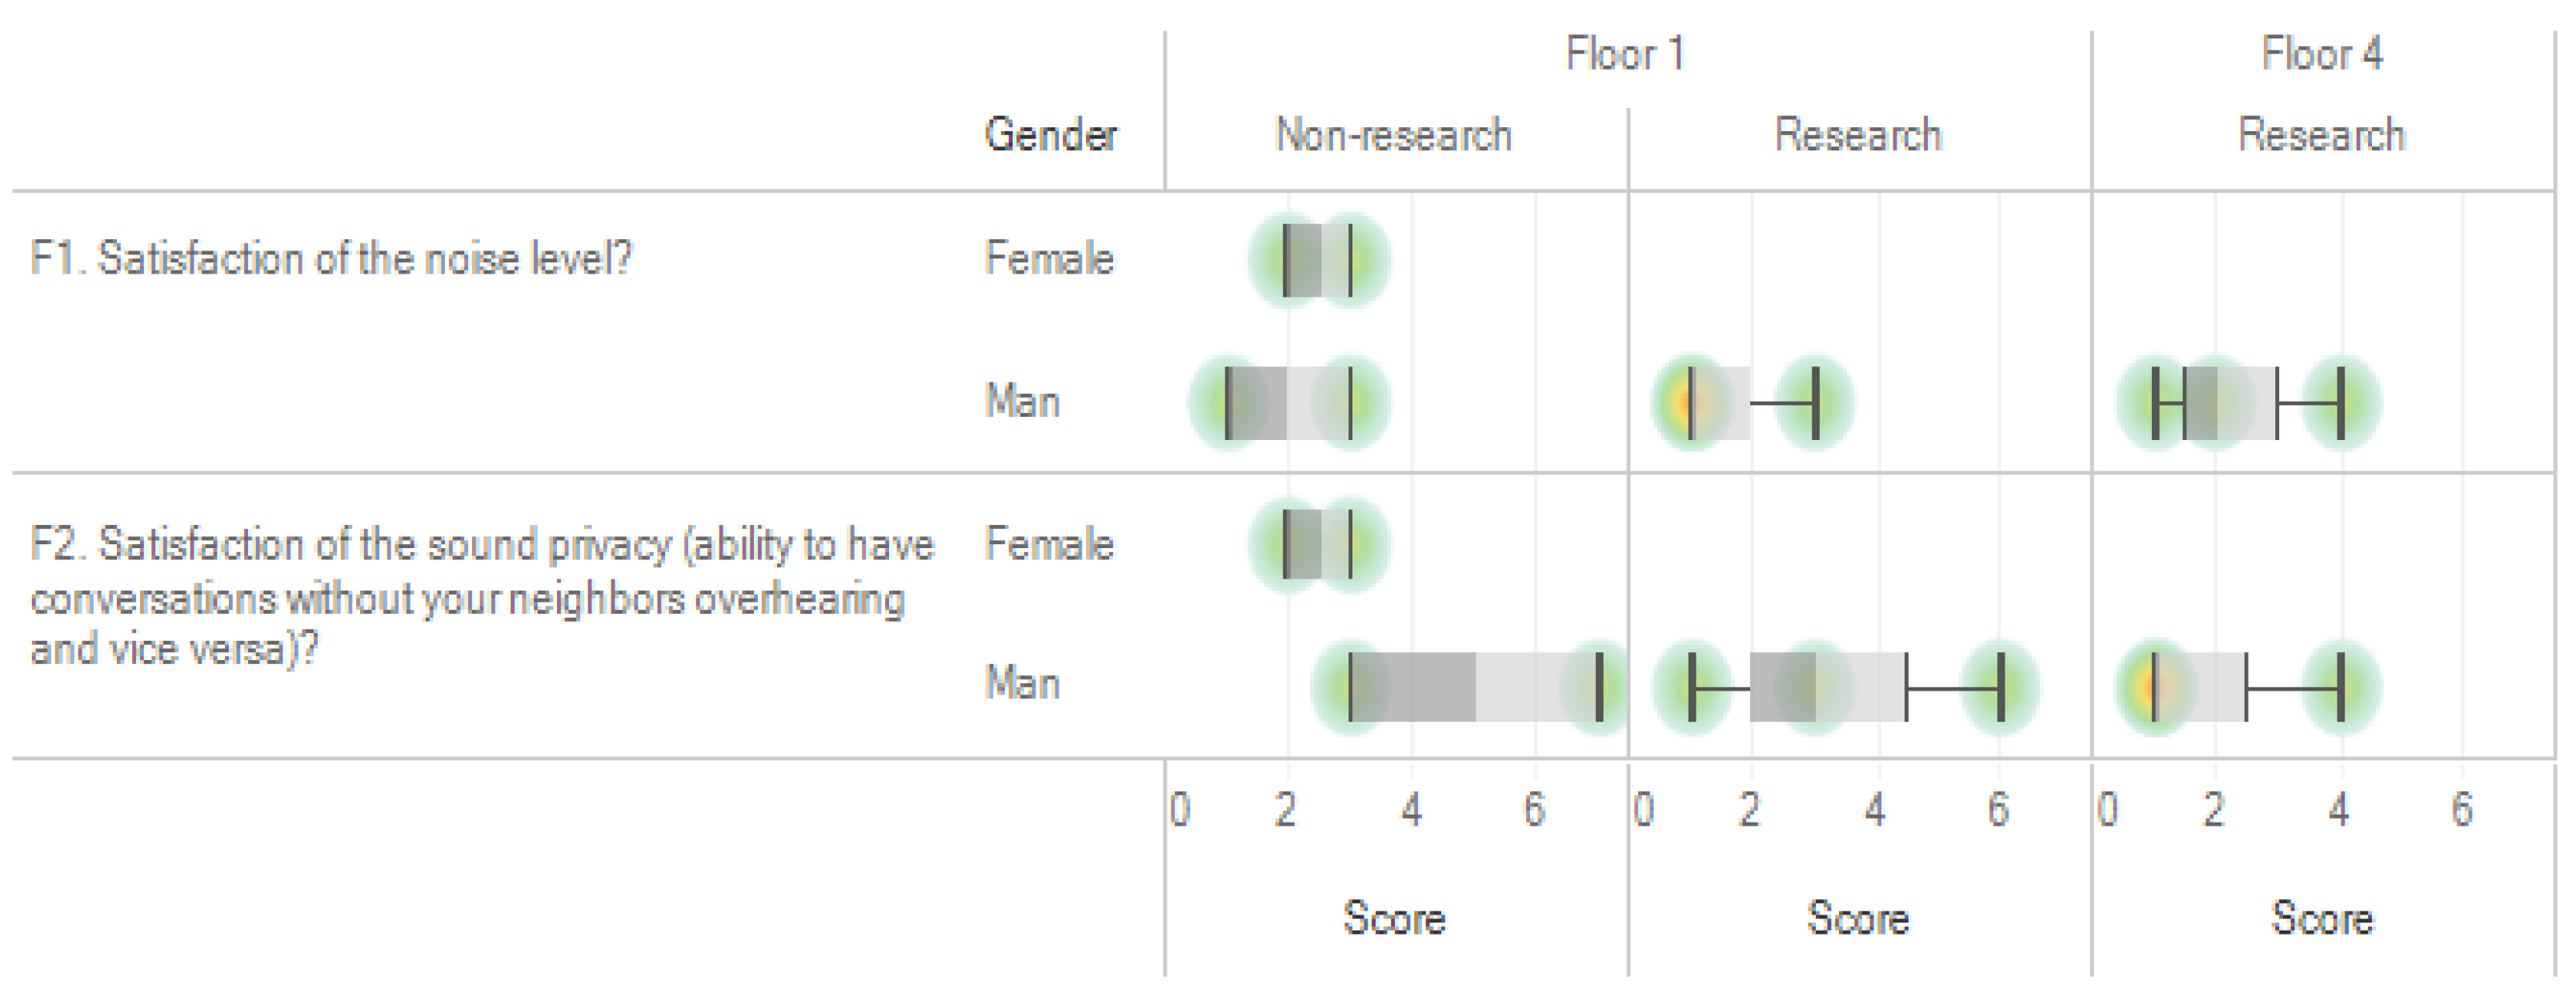
5.1. Floor-by-Floor Analysis
5.2. Limitations
- Our research sample was small and unrepresentative of the floor population in each building, and the uneven sample size across floors could be a potential weakness. Other researchers should attempt to overcome this barrier by devising a survey technique plan that considers the wide range of research institute buildings.
- Our analysis considered only three research institute buildings, despite there being a total of 26 research buildings in the area. Thus, our findings cannot be applied to other research institutes. Future research should confirm our findings in a variety of building environments. In particular, this study focused on the floor-by-floor analysis of A_bldg, so B_bldg and C_bldg should be analyzed in future research.
6. Conclusions
- A future study needs to develop KBOSS as a user-friendly system so that more occupants can conduct a survey easily and frequently to solve the limitation of the number of small samples.
- A frequent survey distribution system such as one enacted on a seasonal or monthly basis is required further to minimize biased samples.
- Further research needs to analyze the empirical data associations among building characteristics, spatial characteristics, and demographical characteristics accumulated through KBOSS.
Author Contributions
Funding
Institutional Review Board Statement
Informed Consent Statement
Data Availability Statement
Acknowledgments
Conflicts of Interest
References
- Klepeis, N.E.; Nelson, W.C.; Ott, W.R.; Robinson, J.P.; Tsang, A.M.; Switzer, P.; Behar, J.V.; Hern, S.C.; Engelmann, W.H. The National Human Activity Pattern Survey (NHAPS): A resource for assessing exposure to environmental pollutants. J. Expo. Environ. Epidemiol. 2001, 11, 231–252. [Google Scholar] [CrossRef] [PubMed] [Green Version]
- Woo, J.M.; Postolache, T.Τ. The impact of work environment on mood disorders and suicide: Evidence and implications. Int. J. Disabil. Hum. Dev. 2008, 7, 185–200. [Google Scholar] [CrossRef] [PubMed] [Green Version]
- Mujan, I.; Anđelković, A.S.; Munćan, V.; Kljajić, M.; Ružić, D. Influence of indoor environmental quality on human health and productivity-A review. J. Clean. Prod. 2019, 217, 646–657. [Google Scholar] [CrossRef]
- Mansor, R.; Sheau-Ting, L. Criteria for occupant well-being: A qualitative study of Malaysian office buildings. Build. Environ. 2020, 186, 107364. [Google Scholar] [CrossRef]
- Sakellaris, I.A.; Saraga, D.E.; Mandin, C.; Roda, C.; Fossati, S.; De Kluizenaar, Y.; Carrer, P.; Dimitroulopoulou, S.; Mihucz, V.G.; Szigeti, T.; et al. Perceived indoor environment and occupants’ comfort in European “modern” office buildings: The OFFICAIR study. Int. J. Environ. Res. Public Health 2016, 13, 444. [Google Scholar] [CrossRef] [Green Version]
- Chen, C.F.; Yilmaz, S.; Pisello, A.L.; De Simone, M.; Kim, A.; Hong, T.; Bandurski, K.; Bavaresco, M.V.; Liu, P.L.; Zhu, Y. The impacts of building characteristics, social psychological and cultural factors on indoor environment quality productivity belief. Build. Environ. 2020, 185, 107189. [Google Scholar] [CrossRef]
- Kang, S.; Ou, D.; Mak, C.M. The impact of indoor environmental quality on work productivity in university open-plan research offices. Build. Environ. 2017, 124, 78–89. [Google Scholar] [CrossRef]
- Allab, Y.; Pellegrino, M.; Guo, X.; Nefzaoui, E.; Kindinis, A. Energy and comfort assessment in educational building: Case study in a French university campus. Energy Build. 2017, 143, 202–219. [Google Scholar] [CrossRef]
- Noor, S.N.A.M.; Ding, H.H. Indoor environment quality (IEQ): Temperature and indoor air quality (IAQ) factors toward occupants satisfaction. IOP Conf. Ser. Mater. Sci. Eng. 2020, 864, 012012. [Google Scholar] [CrossRef]
- Verso, V.L.; Giuliani, F.; Caffaro, F.; Basile, F.; Peron, F.; Dalla Mora, T.; Bellia, L.; Fragliasso, F.; Beccali, M.; Bonomolo, M.; et al. Questionnaires and simulations to assess daylighting in Italian university classrooms for IEQ and energy issues. Energy Build. 2021, 252, 111433. [Google Scholar] [CrossRef]
- Lee, M.C.; Mui, K.W.; Wong, L.T.; Chan, W.Y.; Lee, E.W.M.; Cheung, C.T. Student learning performance and indoor environmental quality (IEQ) in air-conditioned university teaching rooms. Build. Environ. 2012, 49, 238–244. [Google Scholar] [CrossRef]
- Pivac, N.; Nižetić, S.; Zanki, V. Occupant behavior and thermal comfort field analysis in typical educational research institution: A case study. Therm. Sci. 2018, 22, 785–795. [Google Scholar] [CrossRef]
- Zuhaib, S.; Manton, R.; Griffin, C.; Hajdukiewicz, M.; Keane, M.M.; Goggins, J. An indoor environmental quality (IEQ) assessment of a partially-retrofitted university building. Build. Environ. 2018, 139, 69–85. [Google Scholar] [CrossRef]
- Lee, J.; Kim, D.W. Design of online platform and visualization system based on three-dimensional spatial information for occupant satisfaction with indoor environment quality. IOP Conf. Ser. Mater. Sci. Eng. 2019, 609, 042037. [Google Scholar] [CrossRef] [Green Version]
- Parkinson, T.; Parkinson, A.; de Dear, R. Continuous IEQ monitoring system: Context and development. Build. Environ. 2019, 149, 15–25. [Google Scholar] [CrossRef] [Green Version]
- Huizenga, C.; Laeser, K.; Arens, E. A web-based occupant satisfaction survey for benchmarking building quality. Proc. Indoor Air 2002. Available online: https://escholarship.org/content/qt0hs9x6gm/qt0hs9x6gm_noSplash_0791d6530775f748eb56f95744e7e4ab.pdf?t=mzuucm (accessed on 15 November 2021).
- Bae, S.; Martin, C.S.; Asojo, A.O. Indoor environmental quality factors that matter to workplace occupants: An 11-year-benchmark study. Build. Res. Inf. 2021, 49, 445–459. [Google Scholar] [CrossRef]
- Lee, J.W.; Kim, D.W.; Lee, S.E.; Jeong, J.W. Development of a Building Occupant Survey System with 3D Spatial Information. Sustainability 2020, 12, 9943. [Google Scholar] [CrossRef]
- Li, P.; Froese, T.M.; Brager, G. Post-occupancy evaluation: State-of-the-art analysis and state-of-the-practice review. Build. Environ. 2018, 133, 187–202. [Google Scholar] [CrossRef] [Green Version]
- Schweiker, M.; Ampatzi, E.; Andargie, M.S.; Andersen, R.K.; Azar, E.; Barthelmes, V.M.; Berger, C.; Bourikas, L.; Carlucci, S.; Chinazzo, G.; et al. Review of multi-domain approaches to indoor environmental perception and behaviour. Build. Environ. 2020, 176, 106804. [Google Scholar] [CrossRef]
- ASHRAE. Performance Measurement Protocols for Commercial Buildings: Best Practices Guide; ASHRAE: Atlanta, GA, USA, 2012. [Google Scholar]
- Frontczak, M.; Schiavon, S.; Goins, J.; Arens, E.; Zhang, H.; Wargocki, P. Quantitative relationships between occupant satisfaction and satisfaction aspects of indoor environmental quality and building design. Indoor Air 2012, 22, 119–131. [Google Scholar] [CrossRef] [Green Version]
- Runeson, R.; Norbäck, D.; Stattin, H. Symptoms and sense of coherence—A follow-up study of personnel from workplace buildings with indoor air problems. Int. Arch. Occup. Environ. Health 2003, 76, 29–38. [Google Scholar] [CrossRef] [PubMed]
- Balazova, I.; Clausen, G.; Rindel, J.H.; Poulsen, T.; Wyon, D.P. Open-plan office environments: A laboratory experiment to examine the effect of office noise and temperature on human perception, comfort and office work performance. Proc. Indoor Air 2008. Available online: https://www.nickel.odeon.dk/pdf/C101-Indoor_Air_2008_Balazova.pdf (accessed on 15 November 2021).
- Al Horr, Y.; Arif, M.; Kaushik, A.; Mazroei, A.; Katafygiotou, M.; Elsarrag, E. Occupant productivity and office indoor environment quality: A review of the literature. Build. Environ. 2016, 105, 369–389. [Google Scholar] [CrossRef] [Green Version]
- Kallio, J.; Vildjiounaite, E.; Koivusaari, J.; Räsänen, P.; Similä, H.; Kyllönen, V.; Muuraiskangas, S.; Ronkainen, J.; Rehu, J.; Vehmas, K. Assessment of perceived indoor environmental quality, stress and productivity based on environmental sensor data and personality categorization. Build. Environ. 2020, 175, 106787. [Google Scholar] [CrossRef]
- Jensen, K.; Edward, A. Acoustical Quality in Office Workstations, as Assessed by Occupant Surveys. Proceedings, Indoor Air, 4–9 September 2005, Beijing, China. Available online: https://escholarship.org/uc/item/0zm2z3jg (accessed on 15 November 2021).
- Freihoefer, K.; Guerin, D.; Martin, C.; Kim, H.Y.; Brigham, J.K. Occupants’ satisfaction with, and physical readings of, thermal, acoustic, and lighting conditions of sustainable office workspaces. Indoor Build. Environ. 2015, 24, 457–472. [Google Scholar] [CrossRef]
- Meng, Q.; Zhang, S.; Kang, J. Effects of typical dining styles on conversation behaviours and acoustic perception in restaurants in China. Build. Environ. 2017, 121, 148–157. [Google Scholar] [CrossRef]
- Roetzel, A.; DeKay, M.; Nakai Kidd, A.; Klas, A.; Sadick, A.M.; Whittem, V.; Zinkiewicz, L. Architectural, indoor environmental, personal and cultural influences on students’ selection of a preferred place to study. Arch. Sci. Rev. 2020, 63, 275–291. [Google Scholar] [CrossRef]
- Fattore, M.; Arcagni, A. A Reduced Posetic Approach to the Measurement of Multidimensional Ordinal Deprivation. Soc. Indic. Res. 2018, 136, 1053–1070. [Google Scholar] [CrossRef]
- Maranzano, P.; Ascari, R.; Chiodini, P.M.; Manzi, G. Analysis of Sustainability Propensity of Bike-Sharing Customers Using Partially Ordered Sets Methodology. Soc. Indic. Res. 2021, 157, 123–138. [Google Scholar] [CrossRef]
- Dykes, C.; Baird, G. A review of questionnaire-based methods used for assessing and benchmarking indoor environmental quality. Intell. Build. Int. 2013, 5, 135–149. [Google Scholar] [CrossRef]
- Dykes, C.; Baird, G. Performance benchmarks for non-domestic buildings: Towards user perception benchmarks. Build. Res. Inf. 2014, 42, 62–71. [Google Scholar] [CrossRef]

| Division | Classification | Frequency (People) | Ratio (%) |
|---|---|---|---|
| Gender | Female | 65 | 43.0 |
| Male | 86 | 57.0 | |
| Total | 151 | 100.0 | |
| Age | 20s | 14 | 9.3 |
| 30s | 72 | 47.7 | |
| 40s | 47 | 31.1 | |
| 50s | 14 | 9.3 | |
| 60s or older | 4 | 2.6 | |
| Total | 151 | 100.0 | |
| Occupation | Researcher | 100 | 66.2 |
| Administrator | 51 | 33.8 | |
| Total | 151 | 100.0 | |
| Current work building | Main building | 80 | 53.0 |
| Innovation center | 50 | 33.1 | |
| Zero carbon | 21 | 13.9 | |
| Total | 151 | 100.0 | |
| Current work floor | 1 | 14 | 9.3 |
| 2 | 24 | 15.9 | |
| 3 | 34 | 22.5 | |
| 4 | 20 | 13.2 | |
| 5 | 41 | 27.2 | |
| 6 | 6 | 4.0 | |
| 7 | 7 | 4.6 | |
| 8 | 5 | 3.3 | |
| Total | 151 | 100.0 | |
| Working period at current work building | Less than one year | 68 | 45.0 |
| One to two years | 20 | 13.2 | |
| Three to five years | 26 | 17.2 | |
| Five years or more | 37 | 24.5 | |
| Total | 151 | 100.0 | |
| Working period at current workspace | Less than three months | 56 | 37.1 |
| Four to 12 months | 71 | 47.0 | |
| One year or more | 24 | 15.9 | |
| Total | 151 | 100.0 | |
| Working hours per week | 10 h or less | 20 | 13.2 |
| 11 to 40 h | 65 | 43.0 | |
| 40 h or more | 66 | 43.7 | |
| Total | 151 | 100.0 |
| IEQ Criteria | Category | Label | Survey Questions |
|---|---|---|---|
| Personal workspace description | Important | A1 | 0. Personal workspace description |
| Office layout | Important | B1 | 1. Satisfaction with the amount of space available |
| Office layout | Important | B2 | 2. Satisfaction with visual privacy in the workspace |
| Office layout | Important | B3 | 3. Satisfaction with the workspace interaction with co-workers |
| Thermal comfort | Principal | C | 4. Satisfaction with workspace temperature |
| Air quality | Principal | D | 5. Satisfaction with workspace air quality |
| Lighting | Principal | E1 | 6. Satisfaction with workspace lighting (illuminance) |
| Lighting | Principal | E2 | 7. Satisfaction with the visual comfort of lighting |
| Acoustic quality | Principal | F1 | 8. Satisfaction with noise level |
| Acoustic quality | Principal | F2 | 9. Satisfaction with sound privacy (ability to hold conversations without your neighbors overhearing and vice versa) |
| General building comments | Important | G1 | 10. Overall satisfaction with personal workspace |
| General building comments | Important | G2 | 11. Overall satisfaction with building l |
| Productivity Criteria | Category | Label | Survey Questions |
| Office layout | Important | P1 | 1. Overall, does the office layout enhance or interfere with your ability to get your job done? |
| Thermal comfort | Principal | P2 | 2. Overall, does your thermal comfort in your workspace enhance or interfere with your ability to get your job done? |
| Air quality | Principal | P3 | 3. Overall, does the air quality in your workspace enhance or interfere with your ability to get your job done? |
| Lighting | Principal | P4 | 4. Overall, does the lighting quality enhance or interfere with your ability to get your job done? |
| Acoustic quality | Principal | P5 | 5. Overall, does the acoustic quality in your workspace enhance or interfere with your ability to get your job done? |
| Latent Variable | Measurement Variable | Mean | Standard Deviation | Skewness | Kurtosis |
|---|---|---|---|---|---|
| Office layout satisfaction | 1 | 4.87 | 1.464 | −0.427 | −0.513 |
| 2 | 4.30 | 1.669 | −0.152 | −0.959 | |
| 3 | 4.81 | 1.226 | −0.220 | −0.029 | |
| Thermal comfort satisfaction | 1 | 4.30 | 1.427 | −0.038 | −0.643 |
| Lighting satisfaction | 1 | 4.27 | 1.371 | −0.251 | −0.594 |
| Lighting satisfaction | 1 | 4.95 | 1.148 | −0.378 | 0.430 |
| 2 | 4.86 | 1.132 | −0.394 | −0.092 | |
| Noise satisfaction | 1 | 4.04 | 1.557 | 0.083 | −0.719 |
| 2 | 3.35 | 1.466 | 0.259 | −0.552 | |
| Overall satisfaction | 1 | 4.58 | 1.213 | −0.407 | −0.480 |
| 2 | 4.73 | 1.200 | −0.752 | 0.578 | |
| Productivity | 1 | 4.48 | 1.113 | −0.223 | 0.271 |
| 2 | 5.10 | 1.221 | −0.348 | −0.145 | |
| 3 | 4.69 | 1.255 | −0.149 | −0.318 | |
| 4 | 4.91 | 1.104 | −0.297 | 0.459 | |
| 5 | 4.07 | 1.545 | −0.057 | −0.641 |
| Variable | Factor 1 | Factor 2 | Factor 3 | |
|---|---|---|---|---|
| Factor | Measurement Items | |||
| Office layout satisfaction | 2 | 0.780 | ||
| 1 | 0.764 | |||
| 3 | 0.744 | |||
| Lighting satisfaction | 2 | 0.910 | ||
| 1 | 0.908 | |||
| Noise satisfaction | 1 | 0.881 | ||
| 2 | 0.793 | |||
| Eigen value | 1.874 | 1.794 | 1.731 | |
| Descriptive variance (%) | 26.764 | 25.622 | 24.734 | |
| Cumulative variance (%) | 26.764 | 52.386 | 77.120 | |
| Cronbach α | 0.733 | 0.873 | 0.736 | |
| Variable | Factor 1 | Factor 2 | |
|---|---|---|---|
| Factor | Measurement Items | ||
| Productivity | 3 | 0.838 | |
| 4 | 0.723 | ||
| 2 | 0.695 | ||
| 5 | 0.693 | ||
| Overall satisfaction | 1 | 0.929 | |
| 2 | 0.914 | ||
| Eigen value | 2.271 | 1.896 | |
| Descriptive variance (%) | 37.844 | 31.594 | |
| Cumulative variance (%) | 37.844 | 69.438 | |
| Cronbach α | 0.756 | 0.889 | |
| Dependent Variable | Independent Variable | B | SE | β | t | p | VIF |
|---|---|---|---|---|---|---|---|
| Overall satisfaction | (Constant) | −0.026 | 0.274 | - | −0.095 | 0.924 | - |
| Office layout satisfaction | 0.503 | 0.049 | 0.520 | 10.205 | 0.000 | 1.379 | |
| Thermal comfort satisfaction | 0.081 | 0.039 | 0.101 | 2.079 | 0.039 | 1.265 | |
| Air quality satisfaction | 0.184 | 0.043 | 0.220 | 4.313 | 0.000 | 1.383 | |
| Lighting satisfaction | 0.113 | 0.052 | 0.106 | 2.161 | 0.032 | 1.284 | |
| Noise satisfaction | 0.174 | 0.045 | 0.205 | 3.838 | 0.000 | 1.513 |
| Dependent Variable | Independent Variable | B | SE | β | t | p | VIF |
|---|---|---|---|---|---|---|---|
| Productivity | (Constant) | 2.885 | 0.300 | - | 9.613 | 0.000 | - |
| Overall satisfaction | 0.388 | 0.063 | 0.453 | 6.201 | 0.000 | - |
| Path | Researcher | Administrator | Critical Ratios of Difference (CR) | ||||||
|---|---|---|---|---|---|---|---|---|---|
| B | β | p | B | β | p | ||||
| Office layout satisfaction | → | Overall satisfaction | 0.421 | 0.433 | *** | 0.543 | 0.547 | *** | 1.118 |
| Thermal comfort satisfaction | → | Overall satisfaction | 0.131 | 0.158 | ** | 0.030 | 0.039 | 0.675 | −1.201 |
| Air quality satisfaction | → | Overall satisfaction | 0.152 | 0.187 | ** | 0.272 | 0.327 | ** | 1.248 |
| Lighting satisfaction | → | Overall satisfaction | 0.201 | 0.203 | *** | −0.013 | −0.012 | 0.897 | −1.805 |
| Noise satisfaction | → | Overall satisfaction | 0.182 | 0.238 | *** | 0.157 | 0.163 | 0.103 | −0.239 |
| Overall satisfaction | → | Productivity | 0.508 | 0.537 | *** | 0.273 | 0.354 | ** | −1.815 |
| Independent Variable | Group | Sample Size | Mean | Standard Deviation | F | p |
|---|---|---|---|---|---|---|
| Floor | 1 | 35 | 4.91 | 1.067 | 2.634 ** | 0.003 |
| 2 | 7 | 3.36 | 1.973 | |||
| 3 | 19 | 4.39 | 1.254 | |||
| 4 | 5 | 4.50 | 1.225 | |||
| 5 | 14 | 4.57 | 0.805 | |||
| 6 | 6 | 5.83 | 0.753 | |||
| 7 | 12 | 3.92 | 1.222 | |||
| 8 | 13 | 4.77 | 0.725 | |||
| 9 | 19 | 4.50 | 0.972 | |||
| 10 | 5 | 4.60 | 0.962 | |||
| 11 | 7 | 5.50 | 0.866 | |||
| 12 | 6 | 5.00 | 0.548 | |||
| 13 | 1 | 4.50 | - | |||
| 14 | 2 | 5.75 | 0.354 | |||
| Working period at building | Less than one year | 68 | 4.67 | 1.208 | 0.672 | 0.571 |
| One to two years | 20 | 4.33 | 1.092 | |||
| Three to five years | 26 | 4.71 | 0.992 | |||
| Five years or more | 37 | 4.76 | 1.164 | |||
| Working period at workspace | Less than three months | 56 | 4.80 | 1.111 | 1.845 | 0.162 |
| 4 to 12 months | 71 | 4.66 | 1.124 | |||
| One year or more | 24 | 4.27 | 1.242 | |||
| Working hours per week | 10 h or less | 20 | 4.88 | 1.011 | 0.899 | 0.409 |
| 11 to 40 h | 65 | 4.72 | 1.053 | |||
| 40 h or more | 66 | 4.52 | 1.263 | |||
| Age | 20s | 14 | 4.96 | 1.2 | 1.582 | 0.182 |
| 30s | 72 | 4.58 | 1.181 | |||
| 40s | 47 | 4.52 | 1.068 | |||
| 50s | 14 | 5.25 | 1.105 | |||
| 60s or older | 4 | 4.25 | 0.866 | |||
| Gender | Female | 65 | 4.72 | 1.072 | 0.435 | 0.511 |
| Male | 86 | 4.60 | 1.200 |
| Duration of Employment in Building | Building Name | Age | Administrator | Researcher | Total | Comment | ||
|---|---|---|---|---|---|---|---|---|
| Female | Male | Female | Male | |||||
| yr < 1 | A_bldg. | 20–40 | 5 | 4 | 7 | 7 | 23 | Excluded if employment period was less than one year due to response reliability concerns |
| Over 40 | 1 | 2 | 3 | |||||
| B_bldg. | 20–40 | 3 | 4 | 7 | ||||
| Over 40 | 1 | 4 | 5 | |||||
| C_bldg. | 20–40 | 3 | 5 | 5 | 6 | 19 | ||
| Over 40 | 2 | 2 | 7 | 11 | ||||
| Total | 8 | 12 | 18 | 30 | 68 | |||
| yr 1 | A_bldg. | 20–40 | 2 | 2 | 9 | 9 | 22 | - |
| Over 40 | 9 | 5 | 2 | 16 | 32 | |||
| B_bldg. | 20–40 | 4 | 1 | 5 | ||||
| Over 40 | 1 | 2 | 1 | 4 | ||||
| C_bldg. | 20–40 | 3 | 1 | 4 | 2 | 10 | ||
| Over 40 | 2 | 4 | 1 | 3 | 10 | |||
| Total | 17 | 12 | 22 | 32 | 83 | |||
| Gross total | 25 | 24 | 40 | 62 | 151 | |||
| Label | Questions | Satisfaction Score | Score Rank | ||||||
|---|---|---|---|---|---|---|---|---|---|
| A bldg. | B bldg. | C bldg. | Avg. | A bldg. | B bldg. | C bldg. | Avg. | ||
| B1 | 1. Satisfaction with amount of space available | 5.1 | 5.1 | 4.4 | 4.9 | 1 | 1 | 5 | 2 |
| B2 | 2. Satisfaction with visual privacy in the workspace | 4.6 | 5 | 3.3 | 4.3 | 6 | 3 | 10 | 7 |
| B3 | 3. Satisfaction with workspace interaction with co-workers | 4.9 | 4.9 | 4.7 | 4.8 | 2 | 5 | 3 | 3 |
| C | 4. Satisfaction with workspace temperature | 4.4 | 4.4 | 3.8 | 4.2 | 8 | 8 | 9 | 8 |
| D | 5. Satisfaction with workspace air quality | 4.2 | 4.2 | 4.1 | 4.2 | 9 | 9 | 7 | 8 |
| E1 | 6. Satisfaction with workspace lighting (illuminance) | 4.9 | 4.9 | 5 | 5 | 2 | 5 | 1 | 1 |
| E2 | 7. Satisfaction with visual comfort of the lighting | 4.9 | 4.6 | 4.8 | 4.8 | 2 | 7 | 2 | 3 |
| F1 | 8. Satisfaction with noise level | 3.8 | 3.9 | 3.9 | 3.8 | 10 | 10 | 8 | 10 |
| F2 | 9. Satisfaction with sound privacy (ability to hold conversations without your neighbors overhearing and vice versa) | 3.4 | 3.6 | 3.2 | 3.3 | 11 | 11 | 11 | 11 |
| G1 | 10. Overall satisfaction with personal workspace | 4.6 | 5 | 4.2 | 4.6 | 6 | 3 | 6 | 6 |
| G2 | 11. Overall satisfaction of building | 4.7 | 5.1 | 4.6 | 4.7 | 5 | 1 | 4 | 5 |
| Average | 4.5 | 4.6 | 4.2 | 4.4 | |||||
| Label | Questionnaires | A_bldg. Floor | Overall | ||||
|---|---|---|---|---|---|---|---|
| 1st | 2nd | 3rd | 4th | 5th | |||
| B1 | 1. Satisfaction with amount of space available | 5.6 | 4.7 | 4.3 | 3.7 | 5.5 | 5.1 |
| B2 | 2. Satisfaction with visual privacy in the workspace | 5.3 | 3.3 | 3.9 | 3.7 | 4.9 | 4.6 |
| B3 | 3. Satisfaction with workspace interaction with co-workers | 5.6 | 5.0 | 5.0 | 4.3 | 4.7 | 4.9 |
| C | 4. Satisfaction with workspace temperature | 4.3 | 6.0 | 4.6 | 2.3 | 4.4 | 4.4 |
| D | 5. Satisfaction with workspace air quality | 3.6 | 5.0 | 4.1 | 2.7 | 4.5 | 4.2 |
| E1 | 6. Satisfaction with workspace lighting (illuminance) | 5.4 | 6.7 | 4.6 | 4.3 | 4.9 | 4.9 |
| E2 | 7. Satisfaction with visual comfort of the lighting | 5.4 | 6.7 | 4.4 | 4.3 | 4.9 | 4.9 |
| F1 | 8. Satisfaction with noise level | 2.0 | 4.3 | 3.9 | 2.3 | 4.4 | 3.8 |
| F2 | 9. Satisfaction with sound privacy (ability to hold conversations without your neighbors overhearing and vice versa) | 3.6 | 4.3 | 3.7 | 2.0 | 3.2 | 3.4 |
| G1 | 10. Overall satisfaction of personal workspace | 4.9 | 4.0 | 4.6 | 2.7 | 4.9 | 4.6 |
| G2 | 11. Overall satisfaction with the building | 5.1 | 4.3 | 4.4 | 2.3 | 5.1 | 4.7 |
| Overall score | 4.6 | 4.9 | 4.3 | 3.1 | 4.7 | 4.5 | |
| Label | Floor and Gender | Type of Occupation | |
|---|---|---|---|
| Administrator | Researcher | ||
| F1 F2 | 1st Floor Female | Other outdoor noise People talking in neighboring areas | (None) |
| 1st Floor Male | Other outdoor noise Mechanical (heating, cooling, and ventilation systems) noise | Other outdoor noise People talking in neighboring areas | |
| 4th Floor Male | (None) | People talking on the phone Telephones ringing | |
Publisher’s Note: MDPI stays neutral with regard to jurisdictional claims in published maps and institutional affiliations. |
© 2021 by the authors. Licensee MDPI, Basel, Switzerland. This article is an open access article distributed under the terms and conditions of the Creative Commons Attribution (CC BY) license (https://creativecommons.org/licenses/by/4.0/).
Share and Cite
Lee, J.-W.; Kim, D.-W.; Lee, S.-E.; Jeong, J.-W. Indoor Environmental Quality Survey in Research Institute: A Floor-by-Floor Analysis. Sustainability 2021, 13, 14067. https://doi.org/10.3390/su132414067
Lee J-W, Kim D-W, Lee S-E, Jeong J-W. Indoor Environmental Quality Survey in Research Institute: A Floor-by-Floor Analysis. Sustainability. 2021; 13(24):14067. https://doi.org/10.3390/su132414067
Chicago/Turabian StyleLee, Jong-Won, Deuk-Woo Kim, Seung-Eon Lee, and Jae-Weon Jeong. 2021. "Indoor Environmental Quality Survey in Research Institute: A Floor-by-Floor Analysis" Sustainability 13, no. 24: 14067. https://doi.org/10.3390/su132414067
APA StyleLee, J.-W., Kim, D.-W., Lee, S.-E., & Jeong, J.-W. (2021). Indoor Environmental Quality Survey in Research Institute: A Floor-by-Floor Analysis. Sustainability, 13(24), 14067. https://doi.org/10.3390/su132414067