Abstract
The extraction of maximum power is a big challenge in solar photovoltaic-based power plants due to varying atmospheric and meteorological parameters. The concept of array reconfiguration is applied for the maximum power extraction in solar PV plants. Using this approach, the occurrence of multiple peaks in P-V and I-V characteristics during partial shade can be smoothened and reduced significantly. Partial shading due to the movement of the cloud is considered in the research. The cloud movement mainly because of velocity and wind direction is used for creating various shading conditions. The main focus is to reduce the power losses during partial shading using a nature-inspired optimization approach to reconfigure the array for different types of shading conditions. A grey wolf optimizer-based bridge-linked total cross-tied (GWO-BLTCT) configuration is proposed in this paper. The performance of the proposed topology is compared with standard and hybrid topologies, namely, series-parallel, total cross-tied, BLTCT, and SuDoKu-BLTCT, based on performance indicators such as fill factor, performance ratio, power enhancement, and power loss. The proposed GWO-BLTCT outperforms the remaining topologies due to the least power loss and high fill factor. It also has the highest average power enhancement and performance ratio with 23.75% and 70.02% respectively.
1. Introduction
In this era, comfort level and convenience are the basic requirements of human beings and should not be compromised at any level. It is expected that the existing and new buildings may have such provision by incorporating the energy efficiency concept or providing the energy-efficient material in the newly constructed buildings. The world’s 40% basic resources are being utilized at a rapid pace by the worldwide construction sector. The European Commission initiated the Asia-Link program to impart knowledge about sustainability and its correlation with energy. Environmental sustainability, energy security, and equity create a three-dimensional aspect for energy sustainability, this three-dimensional aspect is known as a trilemma. European countries maintain the top rank in the energy sustainability aspect, whereas India ranks 88th globally [1]. The primary goal of sustainable design is the reduction in the depletion of critical resources, minimizing environmental degradation, and promoting a built environment that is safe, efficient, and productive. These sustainable developments are achieved by promoting the use of renewable energy and developing infrastructure for the vertical expansion of the urban landscape.
Renewable energy (RE) presently has an over 26% share of worldwide electricity production. Solar photovoltaic (SPV) has been the main focus of research and application among renewable energy sources. SPV technologies have boomed mainly due to the cheaper cost of materials, easy availability of solar energy, evolving methods of application of models in residential/commercial sectors, and the involvement of the government and their initiatives. A report was presented by S. Ong et al. for the solar land usage metrics in the USA considering SPV and concentrating solar power (CSP) facilities. Some of the drawbacks of the SPV system are listed below, the land used for the PV system compared with CSP is 8.4% more [2]. Furthermore, the PV arrays have a low conversion efficiency of with 24% being the highest for the most common silicon crystalline module [3]. It becomes even more critical and challenging to improve its performance in different conditions.
Partial shading (PS) is a condition when solar panels are exposed to uneven solar irradiance. PS is temporary and nonlinear. The partial shading condition (PSC) results in a lower maximum power point (MPP) and is commonly referred to as a mismatch fault. This condition arises due to various factors like moving clouds, nearby buildings, poles, trees, and other factors [4]. The adverse impact of the PSCs can be listed as (a) hot spot formation leads to permanent damage of the PV panels; (b) multiple peaks of the MPP that create excess stress on the tracking of the MPP. To effectively solve the problem of multiple peaks of power in the P-V curve, the array reconfiguration technique is anticipated. The methodology of PV array reconfiguration is gaining importance lately as it can address the issue of MPP as well as the problem of solar land usage when incorporated in the vertical expansion of the urban landscape [5,6].
Reconfiguration of the PV arrays aims to redistribute the shade to create a uniform row current or equal irradiation. The reconfiguration can be performed either via physical relocation (PR) [7] or via electrical routing of the arrays i.e., electrical array reconfiguration (EAR) [8,9,10]. PR methods suffer from excessive interconnecting ties and skilled labor [11]. EAR techniques are also the dynamic reconfiguration technique requiring sensors to determine the partial shading and faulty conditions, whereas, in PR methods fixed interconnection of the PV modules is performed according to the physical location. The significant difference among them is the use of sensors and thus the cost of the system. Several techniques have been proposed to work effectively in tracking the GMPP of PV arrays with PS [12,13,14,15,16]. Different configurations of PV array reconfiguration such as series-parallel (SP), series (S), parallel (P), total cross-tied (TCT), bridge link (BL), and honeycomb (HC) are analyzed in [17] and performance has also been compared. The hybrid configuration of the PV system is superior when compared to the conventional topologies based on power maximization [18]. The topologies derived from SuDoKu game theory have limitations that it can be implemented where the PV array has an even number of rows [19]. In a real-world scenario, the shadow on the PV panels is rarely in the straight lines or a linear pattern, the cloud movement and its modeling are presented by S. Vijayalekshmy et al. for a TCT and rearranged TCT topology [20]. However, the predominant factor for cloud movement and cloud shade due to wind was not taken into consideration. G Sagar et al. had modeled the movement of clouds using wind velocity and had further implemented SuDoKu based shade dispersion through PR of 6 × 6 panels in a BLTCT configuration [21]. Different techniques have been proposed in the literature for shade dispersion through reconfiguration such as magic square (MS), latin square (LS), and dominance square (DS). R. Venkateswari et al. had proposed Lo Shu arrangement for physical reconfiguration of PV array for different types of shading conditions [22]. It was concluded that these were better than conventional topologies. Table 1 and Table 2 provide a better understanding of EAR and PR respectively by presenting them in a summarized form.

Table 1.
Summary of EAR application on SPV systems.
Table 2.
Summary of PR application on SPV systems.
T.S. Babu et al. proposed a swarm-based optimization (PSO) technique to overcome the PSC of a 9 × 9 TCT PV system using EAR. The method was compared with conventional TCT and SDK puzzle PR methods for the power improvement of the PV array [23]. M. Alkhatani et al. discussed a novel repositioning algorithm of PV array based on time-domain reflectometry for non-uniformly arranged PV arrays [24]. S. Dhanup et al. performed a comparative analysis of a two-phase method with other methods, but the use limits the flexibility of the method in practical applications. EAR techniques require a flexible switching matrix (FSM), a fast-computing processor, data acquisition systems, and fast switching devices that in return increase the overall cost of the system [25].
In this paper, a detailed description and modeling of the movement of clouds due to wind velocity and direction are presented. Various possible shadings that occur due to cloud movement are considered and analyzed. The work focuses on using GWO to disperse the power losses incurred due to different PSC at different times. With the help of the GWO technique, a physical array reconfiguration method is devised using row current minimization as the objective function for the PV array arrangement. Further, a comparative performance analysis of the proposed GWO-BLTCT with four other topologies such as SP, BLTCT, TCT, and SDK-BLTCT is performed for different scenarios like, long narrow (LN), long wide (LW), short narrow (SN), and short wide (SW). The performance indicators used for comparative analysis are power loss, FF, PR, and PE.
2. Description and Modeling of Solar Module
The solar panels are modeled using the single diode model of PV cells as explained in [24]. This model is the most commonly used as it has fewer parameters and is simple to understand. This model simulates the PV array configurations and their performance. Figure 1 represents the single diode model of the PV cell, in this model, the current is generated due to illumination and is known as photocurrent (). The output current () is represented by (1).
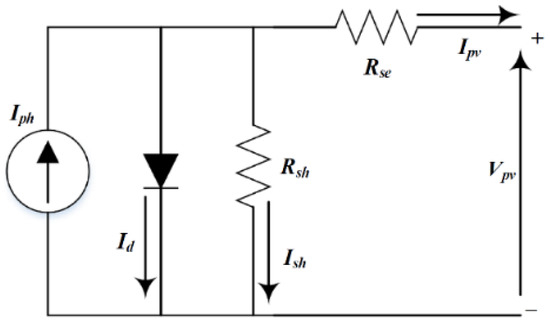
Figure 1.
PV cell representing single diode model.
The module considered for the study is TP250MBZ from Tata Power Solar Systems. The in-depth details of the module are provided in Table 3. The study considers a 5 × 5 solar panel system for maximum power extraction. Figure 2 describes the performance of the module at different irradiance and constant temperature of 25 degrees Celsius.
Table 3.
Specification of TP250MBZ PV module.
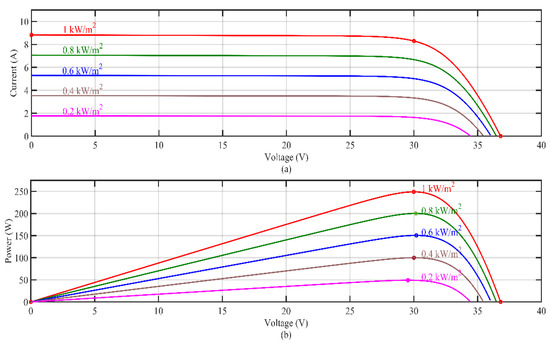
Figure 2.
(a) I-V characteristic; (b) P-V characteristic of TP250MBZ PV module.
3. Cloud Movement and Modeling of Shade
Since the solar PV array is considered as a 5 × 5 matrix, the shade will cause uneven and irregular irradiances on the modules. This reduced irradiance will further impact . In [36], the authors have modeled the movement of the cloud and explained that the irradiance on the panel is the function of the distance between the center of the module and shadow. In this work, the movement of the cloud is incorporated using acceleration, direction, and wind speed. This movement of cloud creates four different shading conditions, namely, short narrow (SN), long narrow (LN), short wide (SW), and long wide (LW). The authors of [31] have defined the above-mentioned shading conditions based on the width and length of the shading of the modules. The different shading conditions are represented in Figure 3.
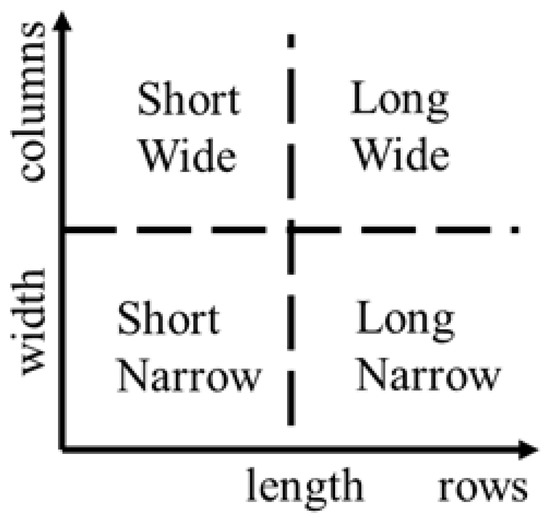
Figure 3.
Different shading conditions.
The modeling of various shades due to wind speed and cloud movement is defined using the equations below. Figure 4 shows the various components helpful in modeling partial shade on the solar PV system. Figure 4 represents the variation in cloud movement with time, resulting in non-uniform irradiance on the solar PV module. In this figure, a 5 × 5 solar PV system is considered for which shading conditions are modeled using wind speed, wind direction, the center of the PV module, and the center of the cloud.
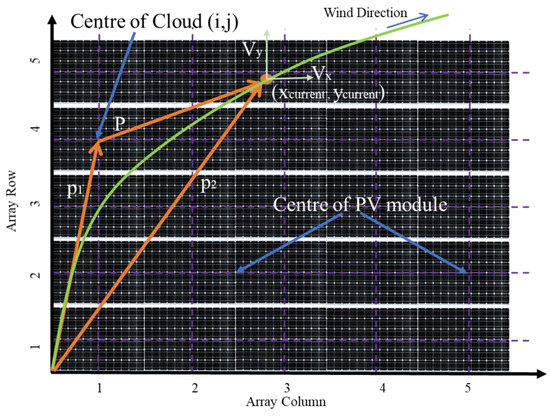
Figure 4.
Vector representation of shadow movement on 5 × 5 PV array.
The instantaneous velocity of the center of the shadow is
The movement of the clouds can be resolved into vertical and horizontal components, Equation (2) can be modified as
The vector representation of the center of shadow and PV module at any given time is depicted in Figure 4. Applying the vector addition using triangle law
The position of shadow at instance t is
From Equations (6) and (7), the magnitude of the distance of the shadow from the center of the module is given below
The cloud movement effect on every module is modeled with respect to the change in of that particular module [32]. The normalized values of irradiance are given by (12)
The variation of shade due to the movement of clouds given by the above modeling equations is categorized in four different types of shading conditions as elaborated in Figure 5.
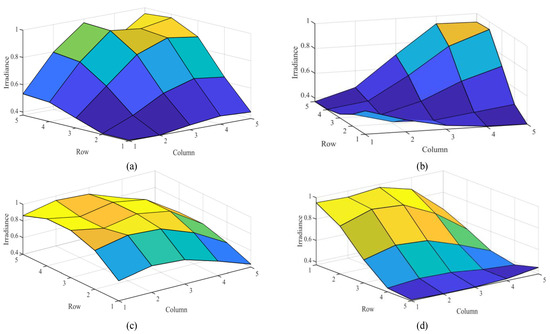
Figure 5.
Irregular irradiance at various instances representing different types of shade: (a) SW, (b) LW, (c) SN, and (d) LN.
Effect of Partial Shade
The shading of a group of cells results in the reduction of output power. This condition is even more severe when the photodiodes are reversed biased due to partial shading. During this, the diodes offer high resistance and reduce the load current. Furthermore, cells may be damaged due to heat produced as a result of high internal resistance. The output of the solar PV system in the partially shaded condition is different as the P-V characteristics have different MPPs; global and local. The performance indicators considered for the proposed shade dispersion method are mismatch power loss (MMPL), misleading power loss (MLPL), FF, and PR. MMPL occurs because of reduced irradiance on various modules during partial shading conditions, whereas MLPL is the change in power between local MPP and GMPP. Figure 6 represents the different types of power losses, namely mismatch power and misleading power in a PV array during PSC. The fluctuations in P-V characteristics and instability caused due to partial shade can also be mitigated using energy storage systems [37].
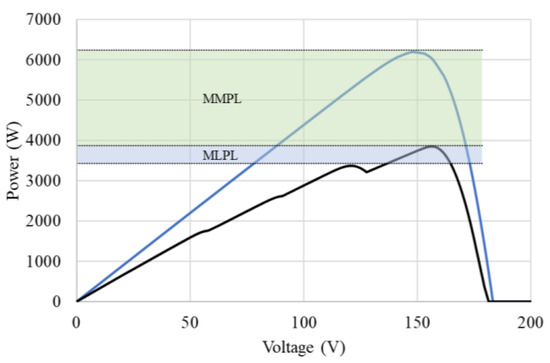
Figure 6.
Power loss in the P-V curve during PSC.
The FF of a solar PV module is the ratio of power at the shaded condition to the product of . In an ideal condition, this represents a rectangle enclosed within the rectangle formed by . In the case of a PSC, this shape deviates from a P-V characteristic and is measured in terms of FF.
4. Proposed Intelligent Model
The application of the intelligent meta-heuristic technique in array reconfiguration is vital because of numerous possibilities of shade dispersion. From the literature, different optimization techniques were available such as particle swarm optimization, ant colony, cuckoo search, and others. However, GWO is a modern nature-inspired optimization technique, capable of solving complex, nonlinear stochastic problems [38]. This algorithm uses the movement of a grey wolf for encircling and targeting its prey [39]. Thus, it does not suffer from low convergence; instead, it is fast and has a low computational burden in comparison. The algorithm uses randomly scattered particles in the search space known as wolves. These wolves are classified into four groups; alphas , betas (), deltas, and omegas). This classification is performed on the basis of hierarchical order, where the alphas are the lead pack of wolves with the least number. The betas follow the decision of the alphas, they are followed by the deltas, and the remaining group of wolves is kept in omegas. The population of wolves increases from alphas to omegas. In optimization, the best solution is given by the alphas (best position) and the entire pack is driven by them. The major benefits of implementing GWO based array reconfiguration are (1) the method effectively converges to the best combination for varying conditions, (2) the algorithm is robust and efficient, (3) the probability of converging to local MPP is reduced, and (4) the speed of convergence is high.
4.1. Proposed Algorithm for Array Reconfiguration
The proposed GWO-based reconfiguration method involves the following steps as given in Figure 7. The hyperparameters required for designing a GWO technique are defined in Table 4. This method consists of four different phases:
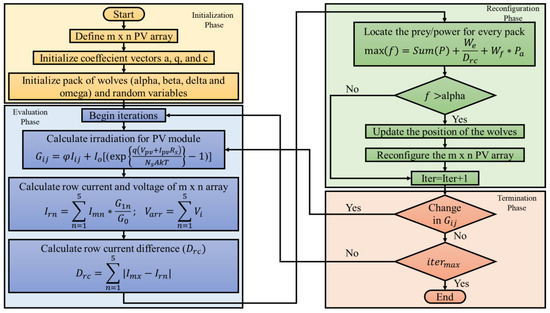
Figure 7.
Flowchart for GWO-based array reconfiguration.
Table 4.
The hyperparameter values for the GWO method.
- Initialization Phase: In this phase initialization of the PV array size, coefficient vectors for the GWO algorithm are done. Where, is linearly decreased from 2 to 0 over the course of iterations and r1, r2 are random vectors in [0, 1].
The initial values of wolves are done using (19) and (20) function and, moreover, a pack of them is formed.
are the position vectors of , , and wolves respectively. ,, define the encircling behavior of , , and wolves respectively. The equation below defines the updated position vector of the wolf.
- Evaluation Phase: Irradiance for every module of the PV array is computed. Here corresponds to row and column numbers. Then, row current and array voltage is calculated. The objective function for the proposed algorithm is row current difference as this should be minimum.
- Reconfiguration Phase: Based on , , and , the function has been defined in [23]. Here, is the output power from the PV module. It is to be noted that as the objective function reduces the power output increases of the PV system. By the trial-and-error method the value of and is observed to be 8 and 6 respectively. The updated position of the wolves is calculated by (23).
- Termination Phase: This stage checks for a change in irradiance (presence of shade) and also evaluated the termination criteria i.e., the maximum iterations. If these conditions are not met then the whole process is reinitiated until the optimal results are obtained.
4.2. Proposed Grey Wolf Optimizer-Based Bridge-Linked Total Cross-Tied (GWO-BLTCT) Configuration
The GWO algorithm is implemented on the bridge-linked total cross-tied (BLTCT) configuration for the different shading conditions. This results in a physical relocation of modules in optimal pattern resulting in GWO-BLTCT configuration. Figure 8a,b represents the BLTCT and optimal GWO-BLTCT configuration of a 5 × 5 PV array for PSC. Table 5 compares the row currents, voltage and calculates the power for PV array among the BLTCT and proposed GWO-BLTCT type of topologies. The power for each row is calculated by taking the product row current and the potential across that row. Here, in Table 5, and denote the maximum current, voltage, and power produced by the module at that respective shading condition.
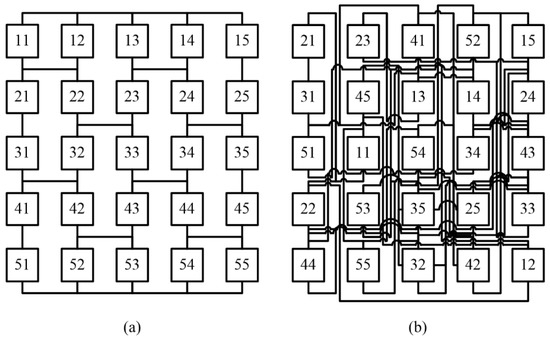
Figure 8.
(a) BLTCT configuration; (b) proposed BLTCT reconfiguration using GWO.
Table 5.
Current, voltage, and power calculation of BLTCT and GWO-BLTCT for different shading patterns.
5. Results and Discussion
The performance of the various configurations namely, SP, TCT, BLTCT, SDK-BLTCT, and GWO-BLTCT is evaluated at four different conditions of partial shade. These shading conditions define the movement of clouds and different types of shadows LN, LW, SW, and SN on the 5 × 5 PV array configuration. The I-V and P-V curves are given for each configuration in Figure 9 and Figure 10 respectively. In both Figure 9 and Figure 10, (a) represents SP, (b) represents TCT, and (c), (d), and (e) depict BLTCT, SDK-BLTCT, and GWO-BLTCT respectively.
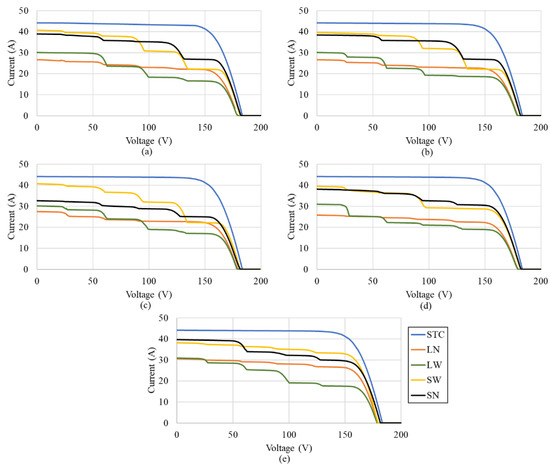
Figure 9.
I-V curves at different shading conditions for various configurations: (a) SP, (b) TCT, (c) BLTCT, (d) SDK BLTCT, and (e) GWO BLTCT.
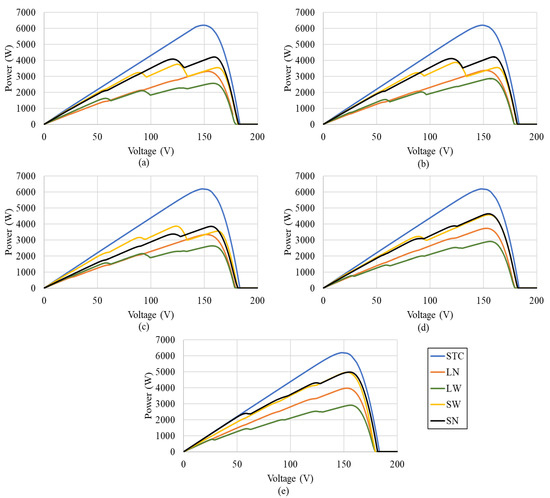
Figure 10.
P-V curves at different shading conditions for various configurations: (a) SP, (b) TCT, (c) BLTCT, (d) SDK BLTCT, and (e) GWO BLTCT.
The primary objective is to increase the power of the PV array in PSCs by incorporating the movement of clouds. The comparison of achieved GMPP by different PV array configurations in the different PSCs is given in Figure 11a–d. Table 5 shows the global maximum power point of different types of PV arrays in different shading conditions. Table 5 helps in identifying the topology in which maximum power can be extracted for the LN, LW, SW, and SN shading patterns. In LN, SN, and SW partial shade the proposed GWO-BLTCT topology produces the best global maximum power point. Furthermore, during LW shading GWO-BLTCT is better than SDK-BLTCT but the difference of 10.42 W is nominal and can be ignored when considering the significant advantage in GMPP in LN, SN, and SW shading patterns. From Table 6 and Figure 11c,d it is evident that the performance of TCT and BLTCT is closely matched in SW and SN types of shades.
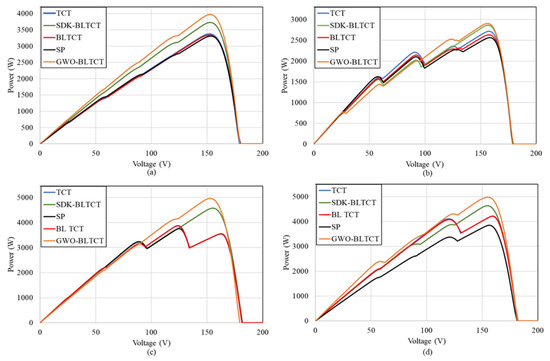
Figure 11.
Effect of different shade due to movement of cloud on the PV array: (a) LN (b) LW (c) SW and (d) SN.
Table 6.
GMPP at different shading conditions at 25 °C.
Power enhancement (PE) is calculated for all the topologies with respect to the SP configurations and is calculated using (23)
Here, is the global maximum power point achieved by SP configuration, and is the global maximum power point achieved by TCT, BLTCT, SDK-BLTCT, or GWO-BLTCT configurations. From Table 7, it is observed that the LW type of shade due to wind speed and cloud movement is the most challenging type of shade as the performance of all the topologies is most hampered during it. The best performing topologies during this instance is proposed GWO-BLTCT and marginally behind is SDK-BLTCT. The performance ratio is also the least (<50%) for the LW shade for all the topologies, whereas for all the other types of shades LN, SW, and SN, the performance ratio is high, i.e., more than 50%. Among them, the SN type of shade is the least shaded. The proposed GWO-BLTCT type of configuration is the best performing configuration for LN, SN, and SW types of shade. Power enhancement of 20.11%, 32.14%, and 29.37% is achieved for LN, SN, and SW respectively, being the highest among the rest of the topologies. Figure 12 represents the performance indicators of all the above topologies for different types of shades. Figure 12a shows power loss, Figure 12b depicts FF, Figure 12c,d plots PR and PE respectively for the four shading conditions.
Table 7.
Performance of the PV array in partial shading conditions due to cloud movement at different instances.
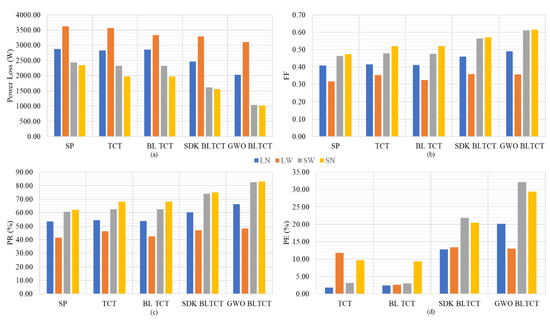
Figure 12.
Performance indicators: (a) power Loss, (b) fill-factor, (c) PR, and (d) PE.
6. Conclusions
The performance of the PV system is affected adversely by various factors such as solar irradiance, cell temperature, air mass coefficient, and wind speed. In this paper impact of partial shading on a 5 × 5 PV system is discussed in detail. The paper proposed a physical array reconfiguration technique based on the GWO method for a 5 × 5 PV array arrangement for different types of partial shading. In this work partial shade is modeled by the movement of the center of the cloud, wind speed, and wind direction. The paper models the realistic movement of could considering wind direction and wind velocity at different time instances. This movement of the cloud induces partial shade onto the PV system which is classified as LW, LN, SN, and SW types of shade. The proposed GWO algorithm uses row current minimization for solving the objective function and reconfigured the position of PV panels in a BLTCT type configuration. The performance of the proposed GWO-BLTCT was analyzed using performance indicators, such as FF, power loss, PR, and PE. The proposed GWO-BLTCT was compared with other topologies/configurations, SP, TCT, BLTCT, and SDK-BLTCT for four different types of shades: LN, LW, SW, and SN. For the proposed GWO-BLTCT array configuration GMPP, PR, PE, and FF were the highest in comparison to other configurations; moreover, the loss component was minimum. Overall, for the proposed configuration the average PE and PR are observed to be 23.75% and 70.02% respectively. Thus, the GWO-BLTCT PV array configuration is found to be superior when compared with SP, TCT, BLTCT, and SDK-BLTCT.
Author Contributions
Conceptualization, A.K. and M.R.; methodology, A.K. and U.N.; software, A.K.; validation, M.R. and M.A.; formal analysis, U.N. and M.A.; investigation, A.K.; resources, M.A.; data curation, M.A.; writing—original draft preparation, A.K.; writing—review and editing, M.R. and U.N.; visualization, A.K. and M.A.; supervision, M.R. and U.N.; project administration, M.A.; funding acquisition, M.A. All authors have read and agreed to the published version of the manuscript.
Funding
This research received no external funding.
Conflicts of Interest
The authors declare there is no conflict of interest.
Nomenclature and Abbreviations
| PV output current | |
| Number of parallel cells | |
| Photon current | |
| Diode saturation current | |
| Electron charge | |
| Voltage of PV module | |
| Series resistance | |
| Number of series cells | |
| Ideality factor | |
| Boltzman constant | |
| Actual module operating temperature in K | |
| Velocity at center | |
| Initial velocity of wind | |
| Instantaneous acceleration | |
| Net position vector | |
| Distance vector of wolves from prey | |
| Position vector of wolves | |
| Irradiance incident on (ith,jth) PV panel of array | |
| PV module power output | |
| Difference of row current | |
| Array voltage | |
| nth Row current | |
| Maximum power at PSC | |
| Maximum power at STC | |
| and | Assumed weights |
| Bridge-linked total cross-tied | |
| Fill-factor | |
| Global MPP during PSC | |
| Global MPP of series-parallel | |
| Grey wolf optimizer BLTCT | |
| Mismatched power loss | |
| Misleading power loss | |
| Maximum power point without PSC | |
| Partial shading | |
| Power enhancement | |
| Performance ratio | |
| Partial shading condition | |
| SuDoKu bridge linked TCT | |
| Standard testing conditions | |
| Series-parallel | |
| Total cross-tied |
References
- World Energy Trilemma Index 2020. World Energy Council UK. Available online: https://trilemma.worldenergy.org/reports/main/2020/ (accessed on 18 March 2021).
- Ong, S.; Campbell, C.; Denholm, P.; Margolis, R.; Heath, G. Land-Use Requirements for Solar Power Plants in the United States. Available online: http://www.nrel.gov/docs/fy13osti/56290.pdf (accessed on 11 April 2021).
- Green, M.A.; Hishikawa, Y.; Warta, W.; Dunlop, E.D.; Levi, D.H.; Hohl-Ebinger, J.; Ho-Baillie, A.W. Solar cell efficiency tables (version 50). Prog. Photovolt. Res. Appl. 2017, 25, 668–676. [Google Scholar] [CrossRef] [Green Version]
- Ahmed, J.; Salam, Z. A critical evaluation on maximum power point tracking methods for partial shading in PV systems. Renew. Sustain. Energy Rev. 2015, 47, 933–953. [Google Scholar] [CrossRef]
- Ansari, S.; Ayob, A.; Lipu, M.S.H.; Saad, M.H.M.; Hussain, A. A Review of Monitoring Technologies for Solar PV Systems Using Data Processing Modules and Transmission Protocols: Progress, Challenges and Prospects. Sustainability 2021, 13, 8120. [Google Scholar] [CrossRef]
- Kumar, A.; Thapar, S.; Addressing Land Issues for Utility Scale Renewable Energy Deployment in India. Teri School of Advance Studies, India. Available online: https://shaktifoundation.in/wp-content/uploads/2018/01/Study-Report-Addressing-Land-Issues-for-Utility-Scale-Renewable-Energy-Deployment-in-India.pdf (accessed on 20 June 2021).
- Rani, B.I.; Ilango, G.S.; Nagamani, C. Enhanced power generation from PV array under partial shading conditions by shade dispersion using Su Do Ku configuration. IEEE Trans. Sustain. Energy 2013, 4, 594–601. [Google Scholar] [CrossRef]
- Vicente, P.D.S.; Pimenta, T.C.; Ribeiro, E.R. Photovoltaic Array Reconfiguration Strategy for Maximization of Energy Production. Int. J. Photoenergy 2015, 3, 592383. [Google Scholar] [CrossRef]
- Deshkar, S.N.; Dhale, S.B.; Mukherjee, J.S.; Babu, T.S.; Rajasekar, N.; Solar, P.V. Array reconfiguration under partial shading conditions for maximum power extraction using genetic algorithm. Renew. Sustain. Energy Rev. 2015, 43, 102–110. [Google Scholar] [CrossRef]
- Pachauri, R.; Singh, R.; Gehlot, A.; Samakaria, R.; Choudhury, S. Experimental analysis to extract maximum power from PV array reconfiguration under partial shading conditions. Eng. Sci. Technol. Int. J. 2019, 22, 109–130. [Google Scholar] [CrossRef]
- Potnuru, S.R.; Pattabiraman, D.; Ganesan, S.I.; Chilakapati, N. Positioning of PV panels for reduction in line losses and mismatch losses in PV array. Renew. Energy 2015, 78, 264–275. [Google Scholar] [CrossRef]
- Eltamaly, A.M.; Farh, H.M.H. Dynamic global maximum power point tracking of the PV systems under variant partial shading using hybrid GWO-FLC. Sol. Energy 2019, 177, 306–316. [Google Scholar] [CrossRef]
- Camilo, J.C.; Guedes, T.; Fernandes, D.A.; Melo, J.D.; Costa, F.F.; Sguarezi, A.J. A maximum power point tracking for photovoltaic systems based on Monod equation. Renew. Energy 2019, 130, 428–438. [Google Scholar] [CrossRef]
- Fathy, A. Recent meta-heuristic grasshopper optimization algorithm for optimal reconfiguration of partially shaded PV array. Sol. Energy 2018, 171, 638–651. [Google Scholar] [CrossRef]
- Yousri, D.; Babu, T.S.; Beshr, E.; Eteiba, M.B.; Allam, D. A Robust Strategy Based on Marine Predators Algorithm for Large Scale Photovoltaic Array Reconfiguration to Mitigate the Partial Shading Effect on the Performance of PV System. IEEE Access 2020, 8, 112407–112426. [Google Scholar] [CrossRef]
- Liu, X.; Wang, Y. Reconfiguration method to extract more power from partially shaded photovoltaic arrays with series-parallel topology. Energies 2019, 12, 1439. [Google Scholar] [CrossRef] [Green Version]
- Pendem, S.R.; Mikkili, S. Modelling and performance assessment of PV array topologies under partial shading conditions to mitigate the mismatching power losses. Sol. Energy 2018, 160, 303–321. [Google Scholar] [CrossRef]
- Yadav, A.S.; Pachauri, R.K.; Chauhan, Y.K. Comprehensive investigation of PV arrays with puzzle shade dispersion for improved performance. Sol. Energy 2016, 129, 256–285. [Google Scholar] [CrossRef]
- Yadav, A.S.; Pachauri, R.K.; Chauhan, Y.K. Comprehensive investigation of PV arrays under different shading patterns by shade dispersion using puzzled pattern based Su-Do-Ku puzzle configuration. In Proceedings of the 2015 1st International Conference on Next Generation Computing Technologies, Dehradun, India, 4–5 September 2015; Volume 1, pp. 824–830. [Google Scholar]
- Vijayalekshmy, S.; Bindu, G.R.; Rama, I.S. A novel Zig-Zag scheme for power enhancement of partially shaded solar arrays. Sol. Energy 2016, 135, 92–102. [Google Scholar] [CrossRef]
- Sagar, G.; Pathak, D.; Gaur, P.; Jain, V. A Su Do Ku puzzle based shade dispersion for maximum power enhancement of partially shaded hybrid bridge-link-total-cross-tied PV array. Sol. Energy 2020, 204, 161–180. [Google Scholar] [CrossRef]
- Venkateswari, R.; Rajasekar, N. Power enhancement of PV system via physical array reconfiguration based Lo Shu technique. Energy Convers. Manag. 2020, 215, 112885. [Google Scholar] [CrossRef]
- Babu, T.S.; Ram, J.P.; Dragičević, T.; Miyatake, M.; Blaabjerg, F.; Rajasekar, N. Particle swarm optimization based solar PV array reconfiguration of the maximum power extraction under partial shading conditions. IEEE Trans. Sustain. Energy 2018, 9, 74–85. [Google Scholar] [CrossRef]
- Alkahtani, M.; Wu, Z.; Kuka, C.S.; Alahammad, M.S.; Ni, K. A Novel PV Array Reconfiguration Algorithm Approach to Optimising Power Generation across Non-Uniformly Aged PV Arrays by Merely Repositioning. J. Multidiscip. Sci. 2020, 3, 32–53. [Google Scholar] [CrossRef] [Green Version]
- Pillai, D.S.; Rajasekar, N.; Ram, J.P.; Chinnaiyan, V.K. Design and testing of two phase array reconfiguration procedure for maximizing power in solar PV systems under partial shade conditions (PSC). Energy Convers. Manag. 2018, 178, 92–110. [Google Scholar] [CrossRef]
- Mehta, H.K.; Warke, H.; Kukadiya, K.; Panchal, A.K. Accurate Expressions for Single-Diode-Model Solar Cell Parameterization. IEEE J. Photovolt. 2019, 9, 803–810. [Google Scholar] [CrossRef]
- Storey, J.P.; Wilson, P.R.; Bagnall, D. Improved optimization strategy for irradiance equalization in dynamic photovoltaic arrays. IEEE Trans. Power Electron. 2013, 28, 2946–2956. [Google Scholar] [CrossRef]
- Tabanjat, A.; Becherif, M.; Hissel, D. Reconfiguration solution for shaded PV panels using switching control. Renew. Energy 2015, 82, 4–13. [Google Scholar] [CrossRef]
- Parlak, K.Ş. PV array reconfiguration method under partial shading conditions. Int. J. Electr. Power Energy Syst. 2014, 63, 713–721. [Google Scholar] [CrossRef]
- Nazeri, M.N.R.; Tajuddin, M.F.N.; Babu, T.S.; Azmi, A.; Malvoni, M.; Kumar, N.M. Firefly Algorithm-Based Photovoltaic Array Reconfiguration for Maximum Power Extraction during Mismatch Conditions. Sustainability 2021, 13, 3206. [Google Scholar] [CrossRef]
- Villa, L.F.L.; Picault, D.; Raison, B.; Bacha, S.; Labonne, A. Maximizing the power output of partially shaded photovoltaic plants through optimization of the interconnections among its modules. IEEE J. Photovolt. 2012, 2, 154–163. [Google Scholar] [CrossRef]
- Vijayalekshmy, S.; Bindu, G.R.; Iyer, S.R. Performance of partially shaded photovoltaic array configurations under shade dispersion. In Proceedings of the 2014 International Conference on Advances in Green Energy, Thiruvananthapuram, India, 17–18 December 2014; pp. 1–6. [Google Scholar]
- Dhanalakshmi, B.; Rajasekar, N. Dominance square based array reconfiguration scheme for power loss reduction in solar Photovoltaic (PV) systems. Energy Convers. Manag. 2018, 156, 84–102. [Google Scholar] [CrossRef]
- Yadav, A.S.; Pachauri, R.K.; Chauhan, Y.K.; Choudhury, S.; Singh, R. Performance enhancement of partially shaded PV array using novel shade dispersion effect on magic-square puzzle configuration. Sol. Energy 2017, 144, 780–797. [Google Scholar] [CrossRef]
- Sahu, H.S.; Nayak, S.K.; Mishra, S. Maximizing the Power Generation of a Partially Shaded PV Array. IEEE J. Emerg. Sel. Top. Power Electron. 2016, 4, 626–637. [Google Scholar] [CrossRef]
- Nguyen, D.D.; Lehman, B. Modeling and simulation of solar PV arrays under changing illumination conditions. In Proceedings of the 2006 IEEE Workshop on Computers in Power Electronics, Troy, NY, USA, 16–19 July 2006; pp. 295–299. [Google Scholar]
- Andrychowicz, M. The Impact of Energy Storage along with the Allocation of RES on the Reduction of Energy Costs Using MILP. Energies 2021, 14, 3783. [Google Scholar] [CrossRef]
- Mirjalili, S.; Mirjalili, S.M.; Lewis, A. Grey Wolf Optimizer. Adv. Eng. Softw. 2014, 69, 46–61. [Google Scholar] [CrossRef] [Green Version]
- Kumar, A.; Rizwan, M.; Nangia, U. A Hybrid Intelligent Approach for Solar Photovoltaic Power Forecasting: Impact of Aerosol Data. Arab. J. Sci. Eng. 2020, 45, 1715–1732. [Google Scholar] [CrossRef]
Publisher’s Note: MDPI stays neutral with regard to jurisdictional claims in published maps and institutional affiliations. |
© 2021 by the authors. Licensee MDPI, Basel, Switzerland. This article is an open access article distributed under the terms and conditions of the Creative Commons Attribution (CC BY) license (https://creativecommons.org/licenses/by/4.0/).