Abstract
Aquaponics is the combined cultivation of fish in aquaculture systems and plants in hydroponic systems. This study aimed to explore and evaluate new aquaponics system designs in Jakarta, Indonesia, in terms of water and nutrient efficiency, and/or profitability. In total, one brackish water system with barramundi and tomato (BW) and three freshwater systems with Nile tilapia, rice, and duckweed (FW + DW), Nile tilapia and rice (FW − DW), and Nile tilapia and tomato (FW-tomato) were investigated using dynamic mathematical models. The results showed an increase of N, P, and water use efficiency by 10%, 18%, and 31%, respectively, in FW-tomato compare to FW − DW. Meanwhile, FW + DW only slightly increased the efficiency but worsened the already negative net present value (NPV) of FW − DW due to the high land prices. The BW system had similar water and nutrient efficiency to FW-tomato, but lower NPV. Profit of the BW and FW-tomato becomes comparable if the hydroponic area in the BW system can be expanded by 35%, or the selling price of tomato or fish in the BW can be increased by 20%. Given the expected growth of both the production of tomatoes and aquaculture in Indonesia, there is potential for further introduction of aquaponics systems in Indonesia.
1. Introduction
Indonesia, the fourth most populous country globally, has food and nutrition security as a central issue. The Economist Intelligence Unit ranked Indonesia as the 72nd of 109 countries in the Global Food Security Index, which measures food safety, availability, quality, and affordability [1]. Indonesia is a net importer of grains, horticulture products, and livestock [2] even though Indonesia is known as an agrarian country in which almost 32% of the land is used for agricultural production and around 30% of the population is working in agriculture, forest, and fishery [3,4]. Moreover, the country is one of the biggest rice importers in the world [5], as rice is the staple food for most of the population in Indonesia. At the same time, the production of tomatoes in Indonesia increased from 12,000 tons in 1969 to 976,790 tons in 2018, growing at an average annual rate of 12.5% [6], and in 2019 it still showed a growth of 4.5% [7]. Moreover, it is expected that the aquaculture market will register a compound annual growth rate of almost 18% by 2023 [8].
Several issues in terms of agricultural practices in Indonesia negatively affect the food security index. Firstly, chemical and fertilizer usage in Indonesia is expanding [9]. Secondly, the land is overused for agriculture. It was recorded that Indonesia is one of the five leading countries of forest loss in percentages over the past decades, with the expansion of agriculture as one of the contributing factors [10]. Thirdly, most of the food is produced outside the city, while almost half of the Indonesian population lives in urban areas [11]. For instance, Jakarta can only provide less than 0.5% of rice demand locally [12]. Considering Indonesia as archipelago country, local food production will lower energy and cost spent for food distribution. Lastly, the overexploitation of groundwater is a worrying issue [2].
Given these issues, a shift to a more innovative and sustainable way of farming in Indonesia is vital. Aside from the sustainability aspect, the ability to produce food locally in an archipelago country like Indonesia is essential to have short supply chains and low production costs. Promoting sustainable agroindustry is one of the Indonesian government’s targets in the Grand Strategy of Agriculture Development 2015–2045 [13]. One alternative for sustainable food production is to modify the growth medium such that it can prevent water and land from fast depletion.
Currently, hydroponics, a soil-less type of greenhouse horticulture, is increasing in popularity, because of the efficient management of resources and food production. A wide variety of plant species can be grown in hydroponic systems, including leafy vegetables, fruits, tuber plants, and grain. This type of food production can save a large amount of water, produces a higher yield than conventional horticulture, and is hardly influenced by climate change [14]. Additionally, small to medium-sized hydroponic systems (HPS) can potentially be installed in the city to fulfil local food demand [15].
Having a sustainable fertilizer source is essential in HPS, since nutrient solutions are the primary inputs in HPS. An option to increase the nutrient use efficiency of HPS is by connecting a recirculating aquaculture system (RAS) to the HPS. Such food production technology is known as aquaponics, in which discharged water from RAS is managed such that it meets the plant’s nutrient requirement in the HPS. Conventional aquaponics uses a one-loop system, where partly demineralized water from HPS is sent back to RAS [16]. On one hand, this system can produce both fish and plants in an environmentally friendly way, allowing a straightforward installation process. On the other hand, this system is suboptimal because it equates the water characteristics in both HPS and RAS, while each plant and fish species has its own optimal water quality conditions [17].
In the current study, the first adjustment we propose is to transform the one-loop system into a decoupled aquaponics system (DAPS), recently also called an on-demand coupled system [18]. In DAPS, water is only transported from the RAS to HPS, so that both facilities can be optimized separately [19]. However, this adjustment increases the amount of fresh water required in RAS. Sustainability of DAPS can be increased by incorporating a digester in the system to produce energy and bio-fertilizer from solid waste material from the RAS [20]. The second modification we propose is to substitute fish feed partially by duckweed. The potential of duckweed utilization as an alternative to fish feed has been proven in many studies [21,22,23]. The main reason for including duckweed in the feed is because feed cost is one of the most pressing issues in aquaculture practices, including Indonesia. Feed covers more than 50% of the total production costs and the composition can reach up to 50% of proteins [24,25]. Typically, protein sources of fish feed come from fish meal, usually not locally available and expensive [24]. The second reason for inclusion of a duckweed cultivation system (DCS) is that duckweed cultivation can be a polishing step of the water discharged from the HPS. However, so far, there has been little discussion about the sustainability of aquaponics systems integrated with duckweed cultivation [26].
Limitations in practical and scientific knowledge make it challenging to design a close to optimal aquaponics system in Indonesia. The objective of the study was to explore and investigate aquaponics system designs in Jakarta, a city with more than 9 million inhabitants, such that high water, nutrients, and energy use efficiencies are obtained while still being economically feasible. The virtual aquaponics system, called the IndonesiAP system in what follows, uses low technologies to produce sustainable food. Such a choice is very relevant in a developing country because it can be easily adapted and requires low investment costs.
The first proposed design of an aquaponics system uses freshwater and produces Nile tilapia in the RAS and uses a rice paddy in the HPS. This arrangement is, in what follows, called freshwater (FW) system. Producing rice in aquaponics facilities that can be implemented in an urban area can be a viable option for sustainable food supply in Indonesia. Nevertheless, there is not much known about the performance of aquaponics systems that grow rice in an HPS facility. In 2017, a farmer community in East Java, called Bengkel Mimpi, constructed a small scale one-loop aquaculture system integrated with a hydroponic rice paddy. Their design became an inspiration for the designs of the IndonesiAP systems.
Since IndonesiAP is virtually located in Jakarta, which is near a coastline, this study also explored and evaluated an aquaponics system design under brackish water (BW) conditions (total dissolved solid of brackish water is between 1000 to 10 000 ppm [27]. Asian barramundi (Lates calcarifer) and tomato were chosen to be evaluated in the BW IndonesiAP system. In total, four systems were studied, namely three freshwater systems that are: FW + DW (Nile tilapia, rice, and duckweed), FW − DW (Nile tilapia, rice without duckweed), FW tomato (Nile tilapia and tomato), and one brackish water system BW (barramundi and tomato).
This study aimed to explore possibility of AP system in Indonesia. The purpose of this research study is to gain insight into the dynamics and interactions of the IndonesiAP system. It also develops an understanding of the system’s sensitivity, which is essential for nutrient, water, energy, and economy optimization. In practice, the objective of this study is to create a model of nutrient, water, and energy balance of IndonesiAP system and using it to evaluate the sustainability performance and perform sensitivity analysis of the system. Finally, it is used to find optimal system design parameters.
2. Materials and Methods
2.1. System Description
IndonesiAP systems, located in Jakarta (Indonesia), consist of a combination of RAS, HPS, duckweed cultivation system (DCS), and anaerobic digester unit (ADU). The description and assumptions used for the ADU follow from Dijkgraaf et al. (2019) [19]. An overview of the system is shown in Figure 1. In FW − DW systems, duckweed production ditches and pelletizer unit are disregarded.
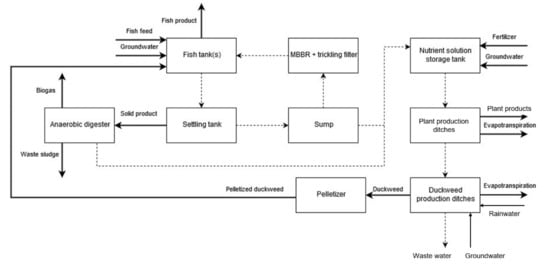
Figure 1.
An overview of the IndonesiAP system with all relevant material flows. Dashed lines indicate flow of water containing nutrients. The compounds related to the solid lines are indicated in the figure.
2.2. Recirculating Aquaculture Aystem
For the fish production, the RAS configuration, sizing, and operation is similar as proposed by Dijkgraaf et al. (2019) [20]. The RAS consists of five different elements, namely four equal fish tanks with total volume of 12.5 m3, a settling tank, a sump, a moving bed biofilm reactor, and a trickling filter. Fish production is staggered and the fish is harvested every 200 days. The maximum stocking density in the fish tanks is 40 kg/m3.
Groundwater is the main water source of the system. Characteristics of the water in the fish tanks should meet the ranges shown in Table 1 to achieve successful tilapia and barramundi production. Jakarta groundwater characteristics are presented in Table 2. As groundwater temperature (29–29.5 °C) is in the acceptable range for tilapia and barramundi, heating or cooling groundwater is unnecessary.

Table 1.
Water requirements for Nile tilapia and barramundi.
Table 2.
Characteristics of Jakarta groundwater.
Calculating the feed input is essential as it determines the nutrient dynamics of the system. The feed requirement is determined on the basis of the fish growth model of Timmons and Ebeling (2010) [36]. In the model, fish growth parameters for tilapia follow from Dijkgraaf et al. (2019) [20], while for barramundi, the growth parameters are presented in Appendix A, Table A1.
The model of Timmons and Ebeling (2010) [36] predicts a daily increase of fish length, which is then used to estimate the weight of the fish. The weight of the fish determines subsequently the amount of feed required, which is determined by the feed conversion ratio (FCR). The sigmoid function, as used by Dijkgraaf et al. (2019) [20], was used to calculate the FCR of tilapia. Meanwhile, the FCR for barramundi was defined as:
In which WT is fish weight in grams.
In the FW + DW system, 50% of the commercial feed is substituted by pelletized duckweed. Feed contents that were used in the model calculations are presented in Table 3.
Table 3.
Parameters of commercial fish feed and fresh duckweed.
Part of the feed is metabolized by the fish into biomass and another part is uneaten and ends up as solid sludge. Moreover, parts of N, P, and COD that are excreted by the fish can be in solid form as feces or insoluble form as urine. The parameter value of the fish metabolism follows from Dijkgraaf et al. (2019) [20] for both tilapia and barramundi. The fish metabolism values are crucial to calculate dilution and supplement requirements for HPS and methane production in the digester.
2.3. Plant Production System
Rice (Oryza sativa) and tomato (Solanum lycopersicum) is grown staggered in 1000 m2 of the HPS facilities, respectively, with constant yield. Rice is grown in troughs with a water depth of 0.15 m and harvested every 120 days. Tomatoes are grown in 0.5 m deep troughs with a cycle length of 145 days, as described by Dijkgraaf et al. (2019) [20]. The water temperature is assumed to be constant. Duckweed is cultivated in a non-aerated pond because fast water current limits duckweed cultivation [45]. The DCS has a depth of 0.5 m to prevent problems during harvesting duckweed [46] and has a total area of 300 m2.
In the model calculation, maximal yields of rice, tomato, and duckweed are presumed, because Indonesia’s climate conditions are optimal for their growth [47,48]. Climatological data of Jakarta (6°12′ S, 106°50′ E) were obtained from WorldWeatherOnline [49] and are presented in Appendix A, Table A2. In the system, rice yield is assumed to be 2.2 kg/m2, which is around 4 times the yield of rice cultivated in the conventional way in Indonesia. Rice cultivated in HPS can even lead to yields that are five times higher than rice cultivated in an open field [50]. Duckweed density is maintained at levels higher than 0.6 kg wet biomass/m2 to prevent algal blooms and lower than 1.2 kg wet biomass/m2 to avoid growth inhibition [39]. Relative growth rate of duckweed is 0.3 day−1 [43]. Tomato yields with EC between 0 to 2.2 dS/m are assumed to be constant at 16 kg/m2 [20]. A yield reduction of 10% occurs for every 1 dS/m above the limit [51]. Except yield, parameters related to tomato growth follow from Dijkgraaf et al. (2019) [20].
Nutrient concentrations in the HPS nutrient solution are always maintained at optimal levels by dilution or adding supplementary nutrients to ensure maximal yield. Previous research suggests significant variation of the optimal nutrient concentrations for the three plants. Nutrient concentrations used in the model are presented in Table 4.
Table 4.
N and P concentration required in the nutrient solution for rice, tomato, and duckweed production.
The evapotranspiration rate for HPS and DCS follows from Dijkgraaf et al. (2019) [20]. The crop coefficient (Kc) of rice changes over time and is based on the plant life stage, which is 0.6 in the initial, 1.2 in the middle, and 0.75 in the late stage [52]. However, for duckweed, only one value of Kc is used due to the short life cycle.
In the HPS, evaporated water is replenished by pumping water from the RAS or groundwater when the nutrient solution in RAS reaches its limits in either N or P. In the DCS, water is replenished by groundwater since lower nutrient concentrations are needed in the DCS than the HPS. However, if the volume of DCS is appropriately chosen, dilution in the DCS might be absent.
3. Model Description
The model is built from mass, water, and energy balances in the different system elements (Figure 1). In general, equations, assumptions, and order of calculation used by Dijkgraaf et al. (2019) [20] for the balances are also valid in FW − DW, FW tomato, and BW systems. However, some adjustments of their equations were applied (Supplementary Materials, Table S1). In the FW + DW case, the model needs to be extended. Mass balances of water, nutrients (N and P), and energy of FW + DW for the RAS, HPS, and DCS are shown in Appendix B, Equations (A1)–(A14).
Duckweed grown in the DCS are harvested frequently, dried, and pelletized. When duckweed biomass reaches its maximum density, 45% of the biomass is harvested to maintain the optimum growth potential. Equations for the overall mass balance and daily production of duckweed biomass can be found in Appendix B, Equations (A15)–(A16). The amount of pelletized duckweed available, and to be used as fish feed, is defined in Appendix B, Equation (A17).
All subsystems are assumed to be homogenous, making the state variables only a function of time. The resulting difference equations were solved in Microsoft ExcelTM using the forward Euler method, with a step size of one day.
3.1. System Performance Analysis
Simulated model outputs were defined and evaluated for 3000 days to compare the performances of the four systems. System performance indicators used are energy consumption, water use efficiency (WUE), nutrient use efficiency (NUE), breakeven time (BET), and net present value (NPV). To calculate the energy consumption, the amount of external energy bought from the national electricity company was used. Equations used to calculate WUE, NUE, and NPV are shown in Table 5. NPV is calculated for eight years. The composition and price used for calculating the net cash flows are shown in Appendix A, Table A3. NPV is calculated per year, thus index k in Table 4 runs from 1 to 8. In addition, two types of costs, i.e., variable and investment cost, were considered. The investment cost is spent only in the first year.
Table 5.
Equations used for system performance and sensitivity analysis, including water use efficiency (WUE), nutrient use efficiency (NUE), net present value (NPV), and normalized sensitivity coefficient (Syx).
3.2. Sensitivity Analysis of System Design Parameters
System design optimization aimed to maximize the NUE and WUE of the system under the constraint that the system is economically feasible. The optimization was done by manually varying the value of the most sensitive parameters in the model. The most sensitive parameters were determined by a sensitivity analysis of the design parameters, including protein and P content of the commercial feed, fish density, RAS volume, HPS area, and DCS area, duckweed harvesting strategy related to biomass density in the DCS, percentage of duckweed in fish feed, land price, labor cost, selling price of products, and investment cost. These parameters were increased and decreased by 50% from the initial value (later called nominal value). A normalized (non-dimensional) sensitivity coefficient (Sy) was used for a direct comparison (Table 5).
4. Results
The model calculations show that an individual barramundi fish requires more feed and gains more biomass (around 300 g higher) than Nile tilapia when harvested after 200 days of cultivation (Figure 2). Moreover, a different pattern in the feed of tilapia and barramundi is observed in Figure 2. A change in the feed requirement of tilapia occurs from around day 110 to 150 but does not occur in feed of barramundi.
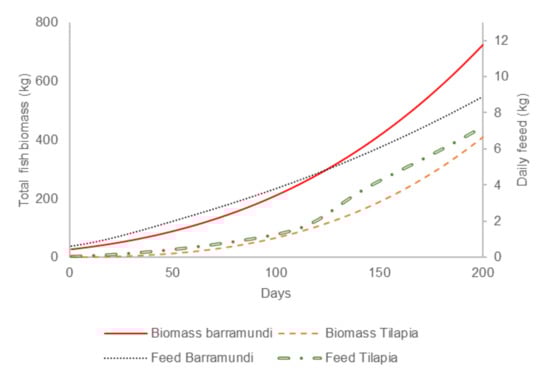
Figure 2.
Total fish biomass and individual daily feed requirement of barramundi and tilapia for 200 days of cultivation.
The FW + DW system aimed to substitute 50% of commercial feed with pelletized duckweed produced in a 300 m2 DCS. However, a 300 m2 DCS is not enough to cover all duckweed required in the RAS, as shown in Figure 3. Duckweed can substitute 50% of the daily feed requirement until approximately day 160. After that day, duckweed pellet production can only cover the feed requirement for around ten days every 50 days. A DCS of 1350 m2 is required to cover 50% of tilapia total feed (Appendix C, Figure A1). Another function of DCS is to capture excess nutrients from HPS. The model calculations found that a 300 m2 DCS is enough to capture all excess N from the HPS and sufficient to support duckweed growth without additional fertilizer from around day 180 onwards. Additionally, the DCS can increase the NUE of P, NUE of N, and WUE by around 8%, 2%, and 5%, respectively (Appendix C, Figure A2, Figure A3 and Figure A4). However, such size is not enough to capture all P excess from the HPS (Figure 4). Therefore, dilution is still needed in the DCS due to high concentration of P (Figure 4).
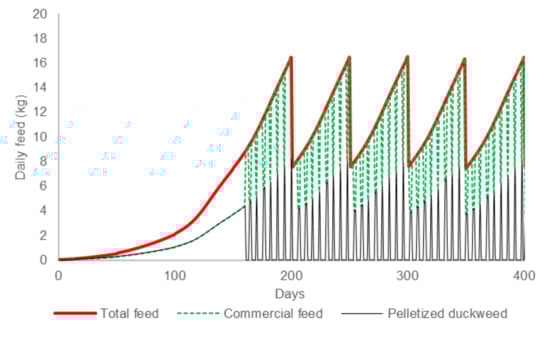
Figure 3.
Total daily feed needed, pelletized duckweed that can be supplied from a 300 m2 duckweed pond, and commercial feed required to cover all tilapia feed requirement in 50 m3 of RAS.
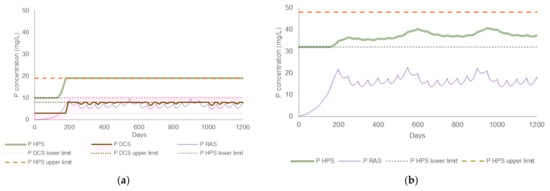
Figure 4.
Phosphorus concentration in the RAS (50 m3), HPS (1000 m2), and DCS (300 m2) along with concentration limit of plants in HPS and DCS: (a) FW system (HPS represents rice and DCS represents duckweed); (b) BW system (HPS represents tomato).
N and P concentrations in the FW + DW, FW − DW, and BW system have a pattern of 365 days (Figure 4 and Figure 5), which follows the evaporation trend in HPS (Appendix C, Figure A5). Figure 4 and Figure 5 also show that N concentration in RAS is always higher than P. Compared to the FW system, N and P concentration in the RAS unit of the BW system is higher. Further, N and P concentration in the RAS also keeps decreasing for some days after harvesting.
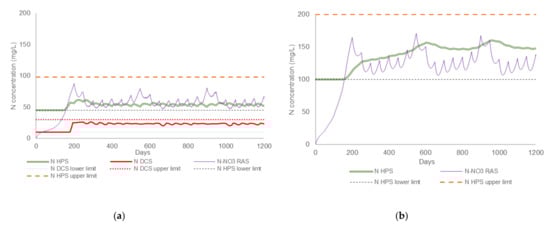
Figure 5.
Total nitrogen concentration in the RAS (50 m3), HPS (1000 m2), and DCS (300 m2) along with concentration limit of plants in HPS and DCS: (a) FW system (HPS represents rice and DCS represents duckweed); (b) BW system (HPS represents tomato).
Notice from Figure 4 and Figure 5 that in the HPS of the FW systems, additional N and P are supplied until approximately day 150 and 120, respectively. After these days, nutrients supplied from the wastewater of the ADU and RAS water is enough to support plant growth without additional supplementation. Without supplements added to the system, N and P concentration in HPS increases until around day 200. At that time, P concentration achieves its threshold for potential rice growth. Consequently, dilution is needed, hence lowering both N and P concentrations in the HPS.
Compared to the FW system which coupled with rice, the BW system which coupled with tomato shows a substantially improvement of NUE and WUE as it reaches more than 95% in the BW system (Appendix C, Figure A2, Figure A3 and Figure A4). Nutrient supplementation in the BW system only occurs in the first 150 days. Dilution of the BW system is not needed. For the FW system, a 1000 m2 area of HPS growing rice is inadequate to get high use efficiencies of water and nutrients, and especially P. The P concentration in HPS always reaches the maximum threshold at approximately day 200 onwards (Figure 4, left panel), indicating the need for dilution.
Evaluation of NPV (Figure 6) indicates that building an IndonesiAP FW − DW system in Jakarta is not economically feasible. DCS is expected to improve the profitability of the FW system by reducing feed cost. Indeed, on the one hand, duckweed pellet substitution can lower the feed cost by around EUR 2000 for a system running for 3000 days (Appendix A, Table A4). On the other hand, this design increases the expenses by about EUR 10,000 (Appendix A, Table A4) to cover additional energy, land, labor, and duckweed pond installation. In summary, the FW − DW exceeds the FW + DW system in terms of economy, although neither system is feasible, based on the nominal values used in the model. Notice from Figure 6 that the BW system improves both NPV and BET of the system significantly compared to the FW system. However, if rice in the HPS of the FW system is substituted by tomato (FW tomato), the FW system becomes more interesting than the BW system in terms of profitability.
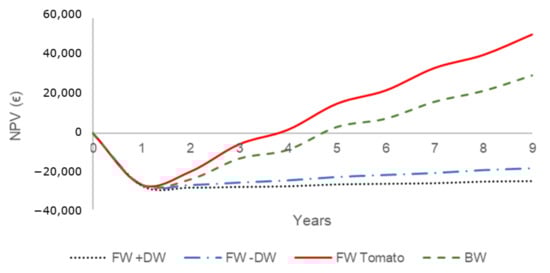
Figure 6.
Net present value (NPV) of FW + DW, FW − DW, FW Tomato, and BW designs of the IndonesiAP system.
The performance of the FW + DW and FW − DW system is suboptimal. These systems can be improved by varying the value of some of the most sensitive design parameters, namely fish density, feed P content, rice area, and duckweed area (Appendix C, Figure A9). A best-case scenario is achieved by lowering feed P content to 0.6% and doubling the fish density (Table 6). Moreover, an expansion of 300 m2 HPS is required in the FW − DW system. Although the nutrient and water efficiency can be increased, the NPV is still negative in FW + DW and low in FW − DW after 3000 days of production.
Table 6.
Nominal and best case of FW + DW (columns 3–4) and FW − DW system (columns 5–6).
5. Discussion
This study explored several virtual aquaponics systems in Indonesia and evaluated NUE, WUE, and economic analysis of the proposed system. Different patterns of the daily feed requirement of tilapia and barramundi were found (Figure 2). This difference is a result of constant FCR in Nile tilapia before day 110 and after 150. Between the mentioned days, the FCR increases from around 0.7 to 1.3 (Appendix C, Figure A6). Consequently, the increase in feed requirement also rises. In contrast, the FCR of barramundi increases during the first 50 days and then remains constant at 1.2 (Appendix C, Figure A6). Hence, the feed requirement observed in Figure 2 for barramundi is almost linear.
N and P concentrations in the RAS are determined by the composition of the fish feed. N is always higher than P because the feed added to the RAS has more N than P (9–16% N and 0.8–1.5% P, Table 3), and fish soluble excretion of TAN is higher than P [53]. N and P concentration in the RAS unit of the BW system is higher than in the FW systems, because the barramundi feed contains more N (Table 3) and the fish excretes more soluble N and P than tilapia [38,53]. A higher N excreted by barramundi indicates that tilapia uses N more efficiently than barramundi. Therefore, a higher biomass gain is expected in tilapia, if the feed protein concentration for both fish types is equal. However, the feed protein content in the BW system is 50%, while in the FW system it is only 32%. Hence, it is still possible for barramundi to gain more weight than tilapia (Figure 2).
Furthermore, N and P concentration in the RAS keeps decreasing for some days after harvesting, when a new batch of fingerling batch is added to the tank. Hence, a lower feed rate is required after the harvesting day. Consequently, nutrient input through the feed at that time has a lower concentration than the discharged nutrients through water pumped from the RAS to the HPS to cover evapotranspiration. Around 20 days after harvesting, the feed consumption rate of the fish increases due to the growth of the fish. As a result, nutrients concentration in the RAS increases again until the next harvesting day.
The pattern of N and P in the RAS are in line with the evapotranspiration in the HPS, because RAS water is pumped to the HPS to cover the evapotranspiration of the plants. Water pumped from the RAS to the HPS is replenished by groundwater, which has lower nutrient concentrations than RAS water. Consequently, nutrient concentrations in the RAS drop at high evapotranspiration rates.
Dilution of the HPS is needed due to the excess of P, not N, since N concentration in the HPS never hit its thresholds, while P is at its upper limit for most of the time (Figure 4 and Figure 5). Although N concentration in the RAS is higher than P, the mobilization rate of P in the ADU is almost four times higher than the mobilization rate of N. This explains why P is more dominant than N in the nutrient’s solution of the HPS. To minimize dilution of HPS, the rice area should be increased by at least 300 m2, which subsequently will increase NUE and WUE to around 90%. A higher NUE and WUE observed in the BW system can be explained by the fact that the N and P levels and ranges for tomato are larger than for rice (Table 4). For instance, rice requires a P concentration between 10–19 mg/L, while tomato can tolerate a P concentration of 32–48 mg/L. Since P is the leading cause of dilution of the system, a higher upper limit of P will sharply reduce the need for dilution.
A DCS can increase NUE of the FW + DW system, in which the effect on NUE P is more substantial than NUE N. Installing DCS means adding a pool to capture the excess P from HPS to produce duckweed biomass, which is subsequently used as fish feed in the RAS. By doing so, the dilution requirements of HPS and feed costs are reduced. In addition, WUE also depends on the size of the DCS. A DCS area of around 175 m2 is already enough to make FW + DW exceed the FW − DW system in terms of WUE. On the other hand, feed cost reduction is not enough to cover the extra costs spent on building and operating the DCS installation, such as land, labor, and investment costs. In this study, installing an FW + DW system in Jakarta is not recommended due to high land prices. The total amount spent on land and labor is around five times higher than the reduction of feed costs.
The choice of the size of DCS depends on the system’s objective, whether to fulfil feed requirements or to make optimal use of water and nutrients. Based on our model calculation and if the goal is to maximize NUE and WUE, doubling the DCS area is already enough to make the efficiencies higher than 90%. If the goal is to fulfil 50% of the total feed requirement, the area must be at least 4.5 times higher than the nominal value of 300 m2. If the aim is to maximize NUE and WUE by eliminating the dilution of the system, an area of around 1000 m2 is enough. Increasing the DCS means more duckweed is available to take up the nutrients discharged from the AP; hence, at a certain point dilution is not necessary anymore.
In the study of the FW + DW and FW − DW systems with respect to maximizing NUE and WUE, four plausible strategies were suggested, namely increasing rice and duckweed area, and lowering fish density and feed P content. From these options, reducing fish density is the least preferred strategy, because it can significantly reduce the NPV while insignificantly improve NUE and WUE. The most favorable strategy is to supply fish with a lower feed P concentration, since it dominates NUE and WUE without affecting NPV. P is also an exhaustible resource and the leading cause of nutrients dilution in the IndonesiAP system. However, it should be noted that the feed P content must still be in the acceptable range to grow optimally. Based on the model calculations, feed P as low as 1% is still useful to improve NUE and WUE of the system (Appendix C, Figure A7). This value is also still acceptable to Nile tilapia because the nutrient composition of typical tilapia feeds has a minimum available phosphorus content of 0.6% [35]. Furthermore, upscaling the HPS area gives better results on the NUE and WUE than upscaling the DCS area, since rice requires higher N and P levels than duckweed. Although both strategies negatively affect the system’s profitability, the rice plantation area has a less negative effect. The sensitivity coefficient of NUE and WUE with respect to these parameters might turn into positive values if the land price is lowered. Hence, at a lower land price, enlarging the HPS area can be chosen to increase NUE and WUE of the system in addition to lowering feed P content.
NPV becomes the main concern in the FW + DW system because installing DCS under the given nominal values is discouraged due to the high expenses. Based on the sensitivity analysis (Appendix C, Figure A2), NPV is, after fish density, most sensitive to the land price. However, in terms of NPV, even if the land price is only 10% of the nominal value, installing DCS to reduce 50% of feed required will never compete with the standard aquaponics system, in which all feed is bought from suppliers (Appendix A, Table A5). Further, decreasing land prices becomes more logical if the minimum wage also decreases. The minimum wage in some provinces in Indonesia can reach as low as 50% of Jakarta’s minimum salary [54]. Reducing both land price and labor cost to only 10% and 50% of the nominal value, respectively, still cannot exceed the FW − DW system in terms of NPV and BET. The FW + DW scenario starts to be more favored than FW − DW when the feed price increases by about 50% from the nominal value. However, if the duckweed maximum crop density can be increased up to the number used by Frederic et al. (2006) [55], reducing land prices to only 10% of the nominal value is enough to make a DCS extension profitable.
The economic feasibility of the aquaponics system is considerably improved when the BW system is chosen. However, substituting rice with tomato in the FW system (FW tomato) results in higher NPV than the NPV of the BW system. Thus, based on the results from the sensitivity analysis, increasing tomato production seems to be a promising solution to increase the economic feasibility of both FW and BW tomato systems without harassing the environment. Expanding the HPS area of tomato by 35% can make the NPV of the BW system surpass the nominal FW tomato system (Appendix C, Figure A8). In addition to increasing the HPS area, increasing fish density is also a possible approach to improving the BW system’s profitability without significantly decreasing NUE and WUE of the system. However, increasing fish density in the BW system will never surpass the NPV of the FW tomato system because the sensitivity coefficient of fish density in FW is higher than in the BW system (Appendix C, Figure A9and Figure A11).
A possible way to make the BW system economically more feasible than the FW tomato system is by increasing the price of tomato grown in brackish water. Tomatoes cultivated in water with higher salinity contain higher dry matter content, resulting in a better taste than tomatoes grown in fresh water [50]. Hence, it seems to be realistic to evaluate a higher selling price of tomato produced in the BW system. An increase of around 20% of the selling price already makes the BW system an economically more feasible system than the FW tomato system (Appendix C, Figure A8). If there is also a chance to raise the barramundi selling price, a 20% increase makes the NPV of the BW system exceed the NPV of the FW tomato system (Appendix C, Figure A8).
This study only covers DAPS, in which water is only transported from the RAS to HPS and the wastewater from HPS or DCS is discharged from the system. In addition to DAPS, an on-demand coupled aquaponics system configuration with a second connection, i.e., with a regained water flow from HPS to RAS [18], is worth evaluating in the future, especially in countries where water is scarce. Hence, water requirements can be minimized, too. Finally, although the results indicate a potential of introducing aquaponics systems in Indonesia, the model needs to be calibrated and validated, given data from a real plant, to ensure up-to-date model behavior.
6. Conclusions
This study examined the performance of fresh and brackish water aquaponics systems using a dynamic mathematical model. Our findings discourage the implementation of freshwater aquaponics systems with tilapia and rice in Jakarta, with or without a duckweed cultivation system, due to the high land prices. Substitution of rice by tomato improved the net present value of the systems. In addition to this, tomato has a wider range for the nutrients N and P than rice, which reduces the need for dilution. Minimizing the dilution of the hydroponic system results in higher nutrient and water use efficiencies. Adding duckweed in a freshwater aquaponics system with tomato is a potential solution to satisfy feed necessity in a system where protein source is scarce or expensive, and land and labor costs are low. However, it increases the complexity of such system. The performance of the brackish water system is comparable to the freshwater system that grows tomato in its hydroponic system.
Supplementary Materials
The following are available online at https://www.mdpi.com/article/10.3390/su132212685/s1, Table S1: Correction of equations used in the FW − DW system, compared to the one used in Dijkgraaf et al. (2019)
Author Contributions
Conceptualization, N.B.T. and K.J.K.; methodology, N.B.T., S.G., and K.J.K.; software, N.B.T.; validation, N.B.T., S.G., and K.J.K.; formal analysis, N.B.T. and K.J.K.; investigation, N.B.T., S.G., and K.J.K.; resources, N.B.T., S.G., and K.J.K.; data curation, N.B.T. and K.J.K.; writing—original draft preparation, N.B.T.; writing—review and editing, N.B.T., S.G., and K.J.K.; visualization, N.B.T.; supervision, S.G. and K.J.K.; project administration, N.B.T. and K.J.K.; funding acquisition, K.J.K. All authors have read and agreed to the published version of the manuscript.
Funding
This research received no external funding.
Institutional Review Board Statement
Not applicable.
Informed Consent Statement
Not applicable.
Data Availability Statement
Data sharing not applicable.
Acknowledgments
This work is part of the BlueCycling project that has received funding from the European Union’s Horizon 2020 research and innovation program under grant agreement No 862555 within the 2019 Joint Call of the ERA-NET Cofund on Food Systems and Climate.
Conflicts of Interest
The authors declare no conflict of interest.
Abbreviations
| Abbreviation | Definition |
| RAS | Recirculating aquaculture system |
| HPS | Hydroponic system |
| DCS | Duckweed cultivation system |
| ADU | Anaerobic digestion unit |
| FCR | Feed conversion ratio |
| DAPS | Decoupled aquaponics system |
| AP | Aquaponics |
| COD | Chemical oxygen demand |
| +DW | With duckweed |
| −RI | Without duckweed |
| DM | Dry matter |
| NUE | Nutrient use efficiency |
| WUE | Water use efficiency |
| FW | Freshwater |
| BW | Brackish water |
| NPV | Net present value |
| BET | Breakeven time |
| TAN | Total ammonia nitrogen |
| NS | Nutrient solution |
Glossary
| Symbols | Definition of symbols | Units |
| total volume of water in the system | L | |
| volumetric flow rate of inflowing groundwater in the AP | L day−1 | |
| volumetric flow rate of rainwater entering the DCS | L day−1 | |
| volumetric flow rate of evaporation water in the HPS | L day−1 | |
| volumetric flow rate of evaporation water in the DCS | L day−1 | |
| fraction of fish sludge water that ends up in the waste sludge, thus leaving the system | - | |
| volumetric flow rate of fish sludge | L day−1 | |
| volumetric flow rate of water removed during dilution of the nutrients solution in the HPS | L day−1 | |
| volumetric flow rate of water removed during dilution of the nutrients solution in the DCS | L day−1 | |
| mass flow rate of commercial feed entering the RAS at time t | kg day−1 | |
| dry matter content of commercial feed enters the RAS | % | |
| mass flow rate of pelletized duckweed entering the RAS at time t | kg day−1 | |
| dry matter content of commercial feed enters the RAS | % | |
| total suspended solid, which is mass fraction of feed (dry matter) that ends up as solids in the RAS | - | |
| mass fraction of solids in the fish sludge | - | |
| density of the fish water | kg L−1 | |
| volume of dilution in the nutrient solution in the HPS or DCS at time t | L | |
| mass of x in the nutrient solution in the HPS or DCS at time t | Kg | |
| volume of nutrient solution in the HPS or DCS | L | |
| maximum concentration of x in the nutrient solution in the HPS or DCS | kg L−1 | |
| concentration of x in groundwater | kg L−1 | |
| concentration of x in the nutrient solution in the HPS or DCS at time t | kg L−1 | |
| x indicates nitrogen (N) or phosphorus (P) NS indicates HPS or DCS | ||
| total volume of water in the DCS | L | |
| volumetric flow rate of groundwater into the DCS | L day−1 | |
| volume of dilution of the RAS at time t | L | |
| mass of x in the RAS at time t | kg | |
| volume of the RAS | L | |
| maximum concentration of x allowed in the RAS | kg L−1 | |
| concentration of x in groundwater | kg L−1 | |
| concentration of x in the RAS at time t, where | kg L−1 | |
| x indicates NH3-N or NO3-N | ||
| mass of x in the feed at time t | kg | |
| mass fraction of x in commercial feed | - | |
| mass fraction of x in duckweed feed | - | |
| x indicates nitrogen (N) or phosphorus (P) | ||
| mass of x after dilution | kg | |
| mass of x in the HPS at time t (mg) | kg | |
| volume of dilution in the nutrient solution in the HPS | L | |
| total mass of N in the DCS | kg | |
| mass concentration of x in the HPS | kg L−1 | |
| mass concentration of x in the groundwater | kg L−1 | |
| mass concentration of x in the rainwater | kg L−1 | |
| mass flow rate of N supplement into the nutrients solution in DCS | kg day−1 | |
| mass concentration of x in the DCS | kg L−1 | |
| x indicates nitrogen (N) or phosphorus (P) | ||
| mass concentration of N in the HPS | kg L−1 | |
| mass concentration of NO3-N in the HPS | kg L−1 | |
| mass concentration of TAN in the HPS | kg L−1 | |
| mass concentration of N in groundwater | kg L−1 | |
| mass concentration of NO3-N in the groundwater | kg L−1 | |
| mass concentration of TAN in the groundwater | kg L−1 | |
| mass flow rate of N supplement into the nutrient solution | kg day−1 | |
| volume of the nutrient solution | L | |
| mass concentration minimum of nutrients x in the nutrient solution | kg L−1 | |
| mass of nutrient x in the nutrient solution at time t | kg | |
| period in which supplement is added to the nutrient solution | day | |
| mass concentration of nutrients x in the nutrient solution at time t | kg L−1 | |
| minimum concentration of x in the nutrient solution in the HPS or DCS | kg L−1 | |
| x indicates nitrogen (N) or phosphorus (P)NS indicates nutrient solution, which is HPS or DCS | ||
| production energy by the generator | kWh | |
| external energy bought from a national electricity company | kWh | |
| power of the pump | kWh | |
| power of the blower | kWh | |
| total mass of duckweed in the DCS | kg | |
| mass of duckweed produced in the DCS | kg | |
| mass of pelletized duckweed from the DCS used as feed fish | kg | |
| mass of duckweed produced | kg | |
| maximum growth rate of duckweed | day−1 | |
| maximum density of duckweed in the DCS | kg m−2 | |
| cultivation area of duckweed in the DCS | m−2 | |
| mass of duckweed harvested from the DCS at time t | kg | |
| dry matter content of fresh duckweed | % | |
| moisture content of pelletized duckweed | % | |
| dry matter content of pelletized duckweed | % |
Appendix A. Parameters Used in IndonesiAP Model and Economical Output
Table A1.
Fish growth parameters of barramundi.
Table A1.
Fish growth parameters of barramundi.
| Parameters | Value | Source | Note |
|---|---|---|---|
| K | 1.88 | [36] | Assumed equal to European sea bass |
| n | 3.18 | [38] | |
| T | 29.5 °C | [32] | Jakarta groundwater temperature |
| Tbase | 15 °C | [56] | |
| TUbase | 5.47 | [36] | Assumed equal to European sea bass |
Table A2.
Indonesia weather data, compiled from weather data of ten years (2009–2018).
Table A2.
Indonesia weather data, compiled from weather data of ten years (2009–2018).
| Max Temperature [49] | Min Temperature [49] | RHmax [49] | RHmin [49] | RH [49] | Solar Radiation (Rs) [57] | ET0 * | |
|---|---|---|---|---|---|---|---|
| °C | °C | % | % | % | MJ/m2/day | mm/day | |
| January | 29 | 25 | 83.93 | 68.67 | 76.3 | 9.0 | 5.56 |
| February | 28.9 | 24.9 | 86.35 | 70.65 | 78.5 | 9.7 | 5.50 |
| March | 29.8 | 25 | 85.14 | 69.66 | 77.4 | 12.0 | 5.78 |
| April | 30.2 | 25.3 | 84.15 | 68.85 | 76.5 | 12.7 | 5.21 |
| May | 30.5 | 25.4 | 82.39 | 67.41 | 74.9 | 11.8 | 5.02 |
| June | 30 | 25.1 | 82.5 | 67.5 | 75 | 11.4 | 4.06 |
| July | 29.9 | 24.2 | 81.62 | 66.78 | 74.2 | 12.5 | 4.39 |
| August | 30.4 | 24.1 | 79.09 | 64.71 | 71.9 | 14.6 | 5.10 |
| September | 31 | 25 | 76.01 | 62.19 | 69.1 | 16.1 | 5.86 |
| October | 31.6 | 25.8 | 75.02 | 61.38 | 68.2 | 14.9 | 6.14 |
| November | 31.1 | 26.2 | 78.54 | 64.26 | 71.4 | 12.5 | 5.70 |
| December | 30.3 | 25.7 | 79.64 | 65.16 | 72.4 | 12.7 | 5.77 |
* ET0 is reference evapotranspiration.
Table A3.
Composition of revenues and expenses.
Table A3.
Composition of revenues and expenses.
| Revenues | Price (EUR) |
|---|---|
| Nile tilapia | 1.5/kg |
| Rice | 0.77/kg |
| Barramundi | 4.8/kg |
| Tomato | 0.44/kg |
| Expenses | |
| Variable costs | |
| Energy | 0.1/kWh |
| Minimum wage | 254.2/month |
| Land | 2.67/m2/year |
| Feed | 0.54/kg |
| N supplementation | 0.58/kg |
| P supplementation | 0.74/kg |
| Rice seed | 1.92/kg |
| Tomato seed | 0.89/g |
| Nile tilapia juvenile | 0.05/ individual |
| Barramundi juvenile | 0.19/individual |
| Investment costs | |
| RAS 1 | 2/kg fish |
| HPS 2 | 8.49/m2 |
| DCS 3 | 1.6/m2 |
| ANA | 600/unit |
1 The investment cost of the RAS is derived from Timmons and Ebeling (2010) [36]. The value used in this model is only 75% of the total equipment and facilities costs because it was assumed that the technology used in IndonesiAP is lower than in the mentioned study. Furthermore, the study of Timmons and Ebeling included heating facilities, which are not necessary for Indonesia. 2 The investment cost of the HPS is gathered from Bengkel Mimpi which gave information of the investment cost for both aquaculture and rice hydroponic facilities. In the current study, it is assumed that total investment cost required for the HPS is 40% of the total investment cost used in Bengkel Mimpi. 3 The cost of investment for DCS is from Skillicorn et al. (1993) [58]. Since the value in the report is for year 1993, future value of the cost for the year 2019 was calculated assuming a rate of 5%.
Table A4.
Total revenue and expenses of both FW − DW and FW + DW in the IndonesiAP system after 3000 days of operation. Brackets indicates minus values.
Table A4.
Total revenue and expenses of both FW − DW and FW + DW in the IndonesiAP system after 3000 days of operation. Brackets indicates minus values.
| FW – DW12345678(EUR) | FW + DW(EUR) | (FW − DW) − (FW + DW)12345678(EUR) | ||
|---|---|---|---|---|
| Revenue | ||||
| Nile tilapia | 42,251 | 42,251 | 0 | |
| Rice | 43,951 | 43,951 | 0 | |
| Total revenue | 86,202 | 86,202 | 0 | |
| Variable expenses | ||||
| Tilapia seed | 307 | 307 | 0 | |
| Rice seed | 51 | 51 | 0 | |
| Feed | 18,242 | 16,139 | 2102 | |
| Supplementation | 16 | 18 | (3) | |
| N supplementation | 12 | 14 | (1) | |
| P supplementation | 3 | 5 | (1) | |
| Energy | 20,481 | 20,509 | (28) | |
| Labour | 11,757 | 15,117 | (3359) | |
| Land | 23,020 | 29,597 | (6577) | |
| Total variable expenses | 73,874 | 81,738 | (7864) | |
| Fixed expenses | ||||
| RAS | 18,000 | 18,000 | 0 | |
| HPS | 8492 | 8492 | 0 | |
| ANA | 600 | 600 | 0 | |
| DCS | 0 | 480 | (480) | |
| Total fixed expenses | 27,572 | 27,092 | (480) | |
| Total expenses | 100,966 | 109,310 | (8344) | |
Table A5.
NPV of optimized scenario of FW − DW and FW + DW systems (rice area of 1300 m2, feed P content of 0.6%, and fish density of 80 kg/m3) if land price, salary cost, feed price, and investment cost of the scenarios is reduced.
Table A5.
NPV of optimized scenario of FW − DW and FW + DW systems (rice area of 1300 m2, feed P content of 0.6%, and fish density of 80 kg/m3) if land price, salary cost, feed price, and investment cost of the scenarios is reduced.
| FW − DW | FW + DW | |
|---|---|---|
| NPV (EUR) | NPV (EUR) | |
| Nominal Value | 905 | (5804) |
| Land price 50% | 12,569 | 8455 |
| Land price 10% | 21,900 | 19,860 |
| Salary cost 50% | 6862 | 1481 |
| Feed price 50% | 15,129 | 7595 |
| HPS investment 50% | 6425 | (281) |
| RAS investment 50% | 9905 | 3199 |
| DCS investment 50% | (5561) | |
| Land price 10% and salary cost 50% | 2419 | 1945 |
| Land price 10%, salary cost 50%, and feed price 150% | 13,634 | 13,745 |
Appendix B. Equations and Symbols
Water balance
A volume balance for water is crucial to give insight on the water usage and nutrients flows within the system. The overall water balance is defined as:
in which is total volume of water in the system, is volumetric flow rate of inflowing groundwater in the AP, is volumetric flow rate of rainwater entering the DCS, is volumetric flow rate due to evapotranspiration in the HPS, is volumetric flow rate due to evaporation of the DCS, is fraction of fish sludge that ends up in the waste sludge, thus leaving the system, is volumetric flow rate of fish sludge, and is volumetric flow rate of water removed during dilution of the nutrients solution in the DCS.
Water level in the AP is constant, thus:
The volumetric flow rate of fish sludge is calculated from:
In which is mass flow rate of commercial feed entering the RAS at time t, is dry matter content of commercial feed enter the RAS, is mass flow rate of pelletized duckweed entering the RAS at time t, is dry matter content of commercial feed enter the RAS, is total suspended solids, which is mass fraction of feed (dry matter) that ends up as solids in the RAS, is mass fraction of solids in the fish sludge, and is density of the fish water.
Volume of water required for dilution of the nutrients solution (NS) in the HPS and DCS is given by:
In which is volume of dilution in the nutrients solution in the HPS or DCS at time t, is mass of x in the nutrients solution in the HPS or DCS at time t, is volume of nutrients solution in the HPS or DCS, is maximum concentration of x in the nutrients solution in the HPS or DCS, is concentration of x in groundwater, is concentration of x in the nutrients solution in the HPS or DCS at time t, x indicates nitrogen (N) or phosphorus (P). The equation holds for both HPS and DCS.
Water level in the RAS and HPS is constant, and the volume balance of water in these units is calculated using the same equation as Dijkgraaf et al. (2019). The volume balance of water in the DCS is also constant and defined as
In which is total volume of water in the DCS, and is volumetric flow rate of groundwater into the DCS.
Meanwhile, the volume of water required to replace water in the RAS is defined as
In which is volume of dilution of the RAS at time t, is mass of x in the RAS at time t, is volume of the RAS, is maximum concentration of x allowed in the RAS, is concentration of x in groundwater, is concentration of x in the RAS at time t, and x indicates NH3-N or NO3-N.
Nitrogen, Phosphorus, and COD mass balance
The mass balances of N and P for the DCS are shown in this paragraph. In the RAS, HPS, and ADU, the N and P mass balance used for the FW + DW system is similar to the FW − DW system. The COD mass balance in the RAS also holds for both systems. The mass balances follow from Dijkgraaf et al. (2019) [20]. The only difference is that there are two sources of feed in FW + DW, which are the commercial and duckweed pellet. In the FW − DW, the mass of N and P in the feed is defined as:
while in FW + DW, the mass of N and P from the feed is defined as:
In which is mass of x in the feed at time t, mass fraction of x in commercial feed, is mass fraction of x in duckweed feed, and x indicates nitrogen (N) or phosphorus (P).
Further, the mass balance of N and P in the HPS after dilution is different from what Dijkgraaf et al. (2019) used. In the current study, it is defined as:
in which is mass of x after dilution, is mass of x in the HPS at time t (mg), and is volume of dilution in the nutrient solution in the HPS.
The mass balance of N and P in the DCS is defined as
in which is total mass of x in the DCS, is mass concentration of x in the HPS, is mass concentration of x in the groundwater, is mass concentration of x in the rainwater, is mass flow rate of x supplement into the nutrients solution in DCS, is the volume of water in the DCS, and x indicates nitrogen (N) or phosphorus (P).
For the mass balance of N in the DCS, total N is used, which comes from NO3-N and TAN. Therefore, the mass concentration of N that enters the DCS from the HPS and groundwater is defined as:
In which is mass concentration of N in the HPS, is mass concentration of NO3-N in the HPS, is mass concentration of TAN in the HPS, is mass concentration of N in groundwater, is mass concentration of NO3-N in the groundwater, and is mass concentration of TAN in the groundwater.
The mass flow rate of nutrients supplement N and P in the nutrients solution in HPS and DCS at time t is similar, and is defined as:
In which is mass flow rate of N supplement into the nutrients solution, is volume of the nutrients solution, is mass concentration minimum of nutrients x in the nutrients solution, is mass of nutrients x in the nutrients solution at time t, is time period in which supplement is added to the nutrients solution, is mass concentration of nutrients x in the nutrients solution at time t, is minimum concentration of x in the nutrients solution in the HPS or DCS, x indicates nitrogen (N) or phosphorus (P), and NS indicates nutrients solution, which is HPS or DCS.
Energy balance
In the energy balance, energy is generated from a generator that converts methane produced from anaerobic digestion into electricity. The electricity is consumed constantly by two identical pumps and a blower, which holds for both systems. When energy shortage occurs, electricity is bought from a national electricity company. Hence, the energy balance can be defined as:
In which is production energy by the generator, is external energy bought from a national electricity company, is power of the pump, is power of the blower. The production of energy by the anaerobic digestion in both FW + DW and FW − DW system is similar, hence, following Dijkgraaf et al. (2019).
Duckweed growth model
Duckweed growth is relevant to obtain understanding of the dynamics of the duckweed biomass in the system. Duckweed is grown in the DCS and harvested frequently to be used as fish feed in pellet form. Hence, the mass balance of duckweed in the system is defined as:
In which is total mass of duckweed in the DCS, is mass of duckweed produced in the DCS, and is mass of pelletized duckweed from the DCS used as feed fish.
The daily production of duckweed biomass follows a logistic growth curve. The differential equation that describes the duckweed biomass dynamics is given by:
In which is mass of duckweed produced, is maximum growth rate of duckweed, is maximum density of duckweed in the DCS, is cultivation area of duckweed in the DCS.
The amount of pelletized duckweed available to be used as fish feed is given by:
In which is mass of duckweed harvested from the DCS at time t, is dry matter content of fresh duckweed, is moisture content of pelletized duckweed, and is dry matter content of pelletized duckweed.
Appendix C. Additional Model Outputs

Figure A1.
Total daily feed needed, pelletized duckweed that can be supplied from a 1350 m2 duckweed pond, and commercial feed required to cover all feed requirement in the RAS.

Figure A2.
Cumulative NUE of N of FW − DW, FW + DW, and BW system in the IndonesiAP system.

Figure A3.
Cumulative NUE of P of FW − DW, FW + DW, and BW system in the IndonesiAP system.

Figure A4.
Cumulative WUE of FW − DW, FW + DW, and BW system in the IndonesiAP system.

Figure A5.
Evaporation of rice in the HPS and duckweed in the DCS in the IndonesiAP system.

Figure A6.
FCR of Nile tilapia and barramundi during 200 days of cultivation [20,38].

Figure A7.
NUE and WUE of IndonesiAP system in both FW + DW and FW − DW system at different P concentrations in the feed.

Figure A8.
NPV of BW system when tomato selling price, barramundi selling price, and HPS area are increased by 0 to 40% from the nominal value. Intersection between the horizontal line and the lines of the respective parameters shows conditions when NPV of the BW equals NPV of FW tomato.

Figure A9.
Normalized sensitivity coefficient of NUE N, NUE P, and WUE after 50% increase and decrease of the values of eight selected parameters: duckweed upper limit density, percentage of duckweed harvested from DCS, DCS area, HPS area, RAS volume, fish density, and feed P and protein content in the IndonesiAP FW − DW and FW + DW systems.

Figure A10.
Normalized sensitivity coefficient of NPV for increasing and decreasing 50% value of 14 selected parameters: fish density, duckweed upper limit density, RAS volume, percentage of duckweed harvested from DCS, feed protein and P content, HPS area, DCS area, labor cost, feed price, land price, investment cost of DCS, HPS, and RAS in the IndonesiAP FW − DW and FW + DW systems.

Figure A11.
Normalized sensitivity coefficient of NUE N, NUE P, and WUE for increasing and decreasing 50% value of five selected parameters: RAS volume, fish density, feed protein and P content, and HPS area in the IndonesiAP BW system.

Figure A12.
Normalized sensitivity coefficient of NPV for increasing and decreasing 50% value of 12 selected parameters: fish price, tomato price, HPS area, feed price, investment cost HPS and RAS, labor cost, land price, RAS volume, fish density, and feed P and protein content in the IndonesiAP BW system.
References
- The Economist Intellegence Unit. Global Food Security Index 2013: An Annual Measure of the State of Global food Security; The Economist Intellegence Unit: London, UK, 2013. [Google Scholar]
- Quincieu, E. Summary of Indonesia’s Agriculture, Natural Resources, and Environment Sector Assessment. Jakarta; ADB Papers on Indonesia, No 08: Manila, Philippines, 2015. [Google Scholar]
- FAO. Small Family Farms Country Factsheet: Indonesia; FAO: Rome, Italy, 2018; pp. 1–2. [Google Scholar]
- Midayanti, N. Keadaan Ketengakerjaan Indonesia Februari 2018; BPS-Statistics Indonesia: Jakarta, Indonesia, 2018. [Google Scholar]
- Ministry of Agriculture Indonesia. Macro Statistics for Agricultural Sector; Ministry of Agriculture Indonesia: Jakarta, Indonesia, 2017. Available online: http://epublikasi.pertanian.go.id/download/file/358-buku-statistik-makro-2017 (accessed on 15 November 2021).
- The Production of Tomatoes in Indonesia. Available online: https://knoema.com/data/indonesia+agriculture-indicators-production+tomatoes (accessed on 15 September 2021).
- BPS-Statistics Indonesia. Horticultural Statistics 2019; BPS-Statistics Indonesia: Jakarta, Indonesia, 2019; pp. 44–47. [Google Scholar]
- TechNavio. Aquaculture Market in Indonesia 2019–2023; Report ID: 4771157; Research and Markets: London, UK, 2021. [Google Scholar]
- Syuaib, M.F. Sustainable agriculture in Indonesia: Facts and challenges to keep growing in harmony with environment. Agric. Eng. Int. CIGR J. 2016, 18, 170–183. [Google Scholar]
- Leimona, B.; Amaruzaman, S.; Arifin, B.; Yasmin, F.; Hasan, F.; Agusta, H.; Frias, J. Indonesia’s ‘Green Agriculture’ Strategies and Policies: Closing the Gap between Aspirations and Application; World Agroforestry Centre: Nairobi, Kenya, 2018; p. 8. [Google Scholar]
- Purnomohadi, N. Jakarta: Urban Agriculture as an Alternative Strategy to Face the Economic Crisis; Resource Centre on Urban Agriculture and Forestry: AN Leusden, The Netherlands, 2001; pp. 467–482. [Google Scholar]
- Produki Padi1 Setara Beras Menurut Kabupaten/Kota (ha) di Provinsi DKI Jakarta. 2018–2019. Available online: https://jakarta.bps.go.id/indicator/53/655/1/produki-padi1-setara-beras-menurut-kabupaten-kota-ha-di-provinsi-dki-jakarta-.htm (accessed on 10 January 2021).
- Grand Strategy of Agricultural Development 2015–2045: Sustainable Agricultural-Bioindustry as Solution to Future Development in Indonesia. Available online: https://ap.fftc.org.tw/article/902 (accessed on 15 October 2021).
- Sharma, N.; Archarya, S.; Kumar, K.; Singh, N.; Chaurasia, O.P. Hydroponics as an advanced technique for vegetable production: An overview. J. Soil Water Conserv. 2018, 17, 364–371. [Google Scholar] [CrossRef]
- Home Gardens/Vertical Farming, Hydroponics and Aquaponics. Available online: https://www.fao.org/land-water/overview/covid19/homegardens/fr/ (accessed on 19 October 2021).
- Rakocy, J.E.; Masser, M.P.; Losordo, T.M. Recirculating Aquaculture Tank Production Systems: Aquaponics—Integrating Fish and Plant Culture. South. Reg. Aquac. Cent. 2006, 16, 454. [Google Scholar]
- Goddek, S.; Delaide, B.; Mankasingh, U.; Ragnarsdottir, K.V.; Jijakli, H.; Thorarinsdottir, R. Challenges of Sustainable and Commercial Aquaponics. Sustainability 2015, 7, 4199–4224. [Google Scholar] [CrossRef]
- Baganz, G.F.M.; June, R.; Portella, M.C.; Goddek, S.; Keesman, K.J.; Baganz, D.; Staaks, G.; Shawl, C.; Lohrberg, F.; Kloas, W. The aquaponic principle—It is all about coupling. Rev. Aquac. 2021, 1–13. [Google Scholar] [CrossRef]
- Goddek, S.; Espinal, C.A.; Delaide, B.; Jijakli, M.H.; Schmautz, Z.; Wuertz, S.; Keesman, K.J. Navigating towards Decoupled Aquaponics Systems: A System Dynamics Design Approach. Water 2016, 8, 303. [Google Scholar] [CrossRef]
- Dijkgraaf, K.H.; Goddek, S.; Keesman, K.J. Modeling innovative aquaponics farming in Kenya. Aquac. Int. 2019, 27, 1395–1422. [Google Scholar] [CrossRef]
- El-Shafai, S.A.; El-Gohary, F.A.; Nasr, F.A.; Van der Steen, N.P.; Gijzen, H.J. Suitability of using duckweed as feed and treated sewage as water source in tilapia aquaculture. In Proceedings of the Prospects of Oil, Gas and Petrochemical Industries in the Arab Region: Opportunities and Challenges, Cairo, Egypt, 27–29 December 2004. [Google Scholar]
- Olaniyi, C.O.; Oladunjoye, I.O. Replacement value of duckweed (Lemna minor) in Nile tilapia (Oreoochromis niloticus) diet. Transnatl. J. Sci. Technol. 2012, 2, 54–62. [Google Scholar]
- Paul, M.; Barman, A.C.; Siddque, M.F.; Bhadra, A.; Rahman, M.S. Effect of Use of Duckweed Powder as a Fish Feed on Polyculture of Carps. J. Environ. Sci. Nat. Resour. 2013, 6, 213–216. [Google Scholar] [CrossRef][Green Version]
- Rana, K.J.; Siriwardena, S.; Hasan, M.R. Impact of Rising Feed Ingredient Prices on Aquafeeds and Aquaculture Production; FAO: Rome, Italy, 2009. [Google Scholar]
- Craig, S. Understanding Fish Nutrition, Feeds, and Feeding. Virginia Tech. 2017, pp. 256–420. Available online: https://fisheries.tamu.edu/files/2019/01/FST-269.pdf (accessed on 15 November 2021).
- Somerville, C.; Cohen, M.; Pantanella, E.; Stankus, A.; Lovatelli, A. Small-Scale Aquaponics Food Production: Integrated Fish and Plant Farming; FAO Fisheries and Aquaculture Technical Paper; FAP: Rome, Italy, 2014; p. 589. [Google Scholar]
- Matthes, G.; Harvey, J. The Properties of Grounwater, Chapter 4: Classification and Assessment of Groundwater; A Wiley – Interscience Publication, John Wiley & Sons: New York, NY, USA, 1982. [Google Scholar]
- DeLong, D.P.; Losordo, T.; Rakocy, J. Tank culture of tilapia. SRAC Publ. 2009, 282, 1–8. [Google Scholar]
- Kungvankij, P.; Tiro, L., Jr.; Pudadera, B., Jr.; Potesta, I. Training Manual Biology and Culture of Sea Bass (Lates calcarifer); Network of Aquaculture Centres in Asia: Bangkok, Thailand, 1985; Available online: https://www.fao.org/3/ac230e/ac230e00.htm (accessed on 15 November 2021).
- Rimmer, M.A.; Russell, D.J. Aspects of the Biology and Culture of Lates calcarifer. In Tropical Mariculture; Academic Press: Cambridge, MA, USA, 1998; pp. 449–476. [Google Scholar] [CrossRef]
- Tiensongrusmee, B.; Chantarasri, S.; Budileksono, S.; Yuwono, S.; Santoso, H. Propagation of Seabass, Lates calcarifer in Captivity. FAO: Rome, Italy, 1989. Available online: http://www.fao.org/3/AB889E/AB889E01.htm (accessed on 15 November 2021).
- Sabdono, A.; Rochaddi, B.; Chrisna, A.; Susanti, B. Persistent organochlorine residues in household wells of Java coastal urban areas, Indonesia. Appl. Sci. 2008, 8, 2318–2323. [Google Scholar] [CrossRef][Green Version]
- Umezawa, Y.; Hosono, T.; Onodera, S.-I.; Siringan, F.; Buapeng, S.; Delinom, R.; Taniguchi, M. Sources of nitrate and ammonium contamination in groundwater under developing Asian megacities. Sci. Total. Environ. 2008, 404, 361–376. [Google Scholar] [CrossRef] [PubMed]
- Phanuwan, C.; Takizawa, S.; Oguma, K.; Katayama, H.; Yunika, A.; Ohgaki, S. Monitoring of human enteric viruses and coliform bacteria in waters after urban flood in Jakarta, Indonesia. Water Sci. Technol. 2006, 54, 203–210. [Google Scholar] [CrossRef]
- Asseggaf, A.; Hendarmawan, H.; Hutasoit, L.M.; Hutabarat, J. Salinitas Airtanah Akifer Tertekan Kedalaman 0–20 m Daerah Kalideres–Cengkareng, Jakarta Barat. Riset Geologi Dan Pertambangan 2017, 27, 15–25. [Google Scholar] [CrossRef]
- Timmons, M.B.; Ebeling, J.M. Aquaculture Production Systems, 3rd ed.; Ithaca Publishing Company: Ithaca, NY, USA, 2010. [Google Scholar]
- Aquaculture Feed and Fertilizer Resources Information System. Available online: http://www.fao.org/fishery/affris/species-profiles/nile-tilapia (accessed on 15 September 2021).
- Barramundi. Available online: https://www.aller-aqua.com/species/warm-saltwater-species/barramundi (accessed on 10 October 2021).
- Leng, R.; Stambolie, J.; Bell, R. Duckweed—A potential high-protein feed resource for domestic animals and fish. Livest. Res. Rural. Dev. 1995, 7, 36. [Google Scholar]
- De Almeida Tavares, F.; Lapolli, F.R.; Roubach, R.; Jungles, M.K.; Fracalossi, D.M.; de Moraes, A.M. Use of domestic effluent through duckweeds and red tilapia farming in integrated system. Pan-Am. J. Aquat. Sci. 2010, 5, 1–10. [Google Scholar]
- Yogev, U.; Barnes, A.; Gross, A. Nutrients and energy balance analysis for a conceptual model of a three loops off grid, aquaponics. Water 2016, 8, 589. [Google Scholar] [CrossRef]
- Meriac, A. Dietary Carbohydrates and Denitrification in Recirculating Aquaculture Systems. Ph.D. Thesis, Wageningen University, Wageningen, The Netherlands, 28 August 2014. [Google Scholar]
- Timmerman, M.; Hoving, I.E. Purifying Manure Effluents with Duckweed; Livestock Research Report 942; Wageningen UR (University & Research Centre) Livestock Research: Wageningen, The Netherlands, 2016. [Google Scholar]
- Nijhof, M. Theoretical effects of feed composition, feed conversion and feed spillage on waste discharge in fish culture. J. Appl. Ichthyol. 1994, 10, 274–283. [Google Scholar] [CrossRef]
- Iqbal, S. Duckweed Aquaculture: Potentials, Possibilities and Limitations for Combined Wastewater Treatment and Animal Feed Production in Developing Countries; Eawag-Sandec: Dübendorf, Switzerland, 1999; p. 16. [Google Scholar]
- Leng, R. Duckweed: A Tiny Aquatic Plant with Enormous Potential for Agriculture and Environment; FAO: Rome, Italy, 1999; Available online: http://www.fao.org/ag/againfo/resources/documents/DW/Dw2.htm (accessed on 16 August 2021).
- Nagai, T.; Makino, A. Differences between rice and wheat in temperature responses of photosynthesis and plant growth. Plant Cell Physiol. 2009, 50, 744–755. [Google Scholar] [CrossRef] [PubMed]
- Landolt, E. The Family of Lemnaceae—A Monographic Study: Morphology, Karyology, Ecology, Geographic Distribution, Systematic Position, Nomenclature, Descriptions; Veroffentlichungen des Geobotanischen Institutes der ETH, Stiftung Rubel: Zurich, Switzerland, 1986; p. 566. [Google Scholar]
- Jakarta Monthly Climate Averages. Available online: https://www.worldweatheronline.com/jakarta-weather-averages/jakarta-raya/id.aspx (accessed on 16 August 2021).
- Resh, H.M. Hydroponic Food Production: A Definitive Guidebook of Soilless Food-Growing Methods, 5th ed.; Woodbridge Press Pub. Co: Santa Barbara, CA, USA, 1995. [Google Scholar]
- Stanghellini, C.; Ooster, B.; Heuvelink, E. Greenhouse Horticulture: Technology for Optimal Crop Production. Heuvelink, E., Ed.; Wageningen Academic Publishers: Wageningen, The Netherlands, 2019. [Google Scholar]
- Allen, R.G.; Pereira, L.S.; Raes, D.; Smith, M. Crop Evapotranspiration—Guidelines for Computing Crop Water Requirements; FAO Irrigation and Drainage Paper 56; 300(9), D05109; FAO: Rome, Italy, 1998; pp. 1–50. [Google Scholar]
- Neto, R.; Ostrensky, A. Nutrient load estimation in the waste of Nile tilapia Oreochromis niloticus (L.) reared in cages in tropical climate conditions. Aquac. Res. 2015, 46, 1309–1322. [Google Scholar] [CrossRef]
- Upah Minimum Regional/Provinsi (UMR/UMP) Dan Rata-Rata Nasional Per Tahun (Dalam Rupiah) 1997–2016. Available online: https://www.bps.go.id/linkTableDinamis/view/id/917 (accessed on 20 August 2021).
- Frederic, M.; Samir, L.; Louise, M.; Abdelkrim, A. Comprehensive modeling of mat density effect on duckweed (Lemna minor) growth under controlled eutrophication. Water Res. 2006, 40, 2901–2910. [Google Scholar] [CrossRef] [PubMed]
- Cheong, L. Status of knowledge on farming of Seabass (Lates calcarifer) in South East Asia. Adv. Trop. Aquac. 1989, 9, 421–428. [Google Scholar]
- Budiyanto, M.A.; Nawara, R. Comparative study of the monthly global solar radiation estimation data in Jakarta. IOP Conf. Ser. Earth Environ. Sci. 2018, 105, 012111. [Google Scholar]
- Skillicorn, P.; Spira, W.; Journey, W. Duckweed Aquaculture: A New Aquatic Farming System for Developing Countries. The World Bank: Washington, DC, USA, 1993. [Google Scholar]
Publisher’s Note: MDPI stays neutral with regard to jurisdictional claims in published maps and institutional affiliations. |
© 2021 by the authors. Licensee MDPI, Basel, Switzerland. This article is an open access article distributed under the terms and conditions of the Creative Commons Attribution (CC BY) license (https://creativecommons.org/licenses/by/4.0/).