Abstract
While police enforcement is a well-known means of reducing traffic violations, it is also recognized that other agents should be involved in creating sustainable deterrence. This paper describes and evaluates the Israeli Road Guards program, a new and unique type of traffic enforcement, which enables simple technology-based enforcement of traffic violations by citizens. In its 24 months of operation, more than 3400 volunteers who submitted over 64,000 violation reports were involved in this program. Each report went through a rigorous evaluation process. More than 80% of the submitted reports were rejected in the various stages of the procedure. In 13.7% of the cases a notice letter was sent, and in 4.3% of cases (reflecting the most severe offenses) a citation was issued by the police. The monthly rate of report submission by the volunteers was at its highest initially, then decreased and stabilized after about six months at 1.4 reports per month. The proportion of active volunteers also decreased over time to a level of 0.26 at the end of the study period. The violation types reported within the program differed substantially from those captured by police enforcement. These differences are likely due to the manner in which each mode of enforcement was performed. The most common violations reported by volunteers were lane deviations, red light running and driving on the roads’ shoulders, which are easily documented by means of video recordings. They are also associated with higher crash risks. Thus, the results show that such public technology-based traffic enforcement, which can be carried out during regular daily driving and does not require anyone to make extra trips, may efficiently complement traditional police enforcement.
1. Introduction
Road safety is a major concern in safeguarding human life. Road crashes impact individuals, communities and countries. Therefore, improved road safety is essential to sustainable development. A broad range of measures to increase road safety are available. These differ in the social, environmental and economic resources that they use and their related costs and potential benefits. Some examples include improvements to infrastructure design, traffic control, motor vehicles, use of technological devices, influencing road users’ behavior though technology, education and media campaigns [1,2,3,4,5,6,7,8].
Among these measures, police enforcement is an important means of improving road safety. It aims to deter road users from non-compliance with traffic rules and to prevent risky behaviors and situations [9,10,11,12,13]. Furthermore, traffic violations are repeatedly raised as an important concern of the public. This perception is prominent in the context of offenses such as drunk driving, excessive speeding and running a red light, which may cause serious injury to people or damage to vehicles and/or infrastructure [9,14]. Traffic enforcement enables police agencies to be responsive to these community priorities. However, at the same time, as traffic citations generate revenue for municipal and state governments, the motivation for police enforcement may be perceived with suspicion [10,15,16]. Consequently, it is essential to balance the promotion of road safety with maintaining the public’s trust, which depends on the enforcement intensity and the types of citations issued [14,17,18,19].
While traditional enforcement is mainly sanctioned by the police, it is well recognized that a wide range of agents such as individuals, private entities and the community should be involved in the process to facilitate efficient enforcement [20,21,22,23,24]. Such collaboration may increase police accountability [25]. However, when many agents are involved, there is also a substantial risk that the public will not clearly understand these agents’ roles and responsibilities [26].
Technological advancements play an important role in enforcement; one way in which they do this is by capturing aggressive driving and violation events such as speeding and running a red light [27,28]. Simple, cheap and widespread technologies may enable a new type of enforcement by the public, which can also be deployed for monitoring and deterring traffic violations.
The Community Speedwatch (CSW) program has operated throughout the UK since 2012 in response to public calls for action against speeding. Local volunteers monitor vehicle speeds using hand-held speed measurement devices that they purchase themselves. The organization and coordination with the local police of all CSW activity is done via a dedicated website. Volunteers are trained and instructed by the police, who also handle the records of speeding vehicles. Offenders receive a police warning letter. A list of repeat offenders is generated. These may receive further attention, such as a visit from the police team. Yet, the violation records do not allow for legal prosecution of drivers, and the program does not monitor other violation types [25].
The Delhi India traffic police allow the public to post photos and videos of traffic violators and hazards, e.g., unauthorized parking and faulty traffic signals, on social media (Facebook, WhatsApp). The posts are monitored by a dedicated team of 25 police officers. If relevant, the violations are confirmed by patrolling police on-site. During six months in 2014, over 85,000 reports were recorded through WhatsApp alone. The format has been adopted by several other Indian cities [29,30]. Similarly, in Singapore [31], citizens can report traffic violations, as well as other offenses, via the police website. They are required to provide image or video proof. A major disadvantage of this reporting approach is the difficulty of validating the images posted, which can be relatively easily manipulated. Therefore, only violations that can be confirmed by the police are further considered. Moreover, if the violation is confirmed by the police, the reporting citizen is likely to be summoned to testify, which may deter people from reporting violations.
Such programs of public traffic enforcement have the potential to be broadly implemented but need further improvements. This paper describes and evaluates the Israeli Road Guards program, which aims to enable technology-based public enforcement of traffic violations. To the best of the authors’ knowledge, this is the first study to report on the outputs of this new type of traffic enforcement. The analysis presented addresses the characteristics of the process and its outputs. Thus, it evaluates the program’s potential usefulness. Specifically, it focuses on assessing citation and notice letter outputs, violation types, volunteers’ behaviors and the program’s sustainability over time.
The rest of this paper is organized as follows: in the next section, the Road Guards program is described and the framework for the process of report evaluation is set out. Then, data, methods and the research questions are presented. Next, the results are described, followed by a discussion of the main results and their policy implications. Finally, conclusions from the study, its limitations and avenues for further research are outlined.
2. The Road Guards Program
The Road Guards program is operated for the Israeli National Road Safety Authority (NRSA) by a non-profit organization called “Safe Lane” in cooperation with the Police Traffic Department (PTD). Its main objective is to increase the deterrence from committing traffic violations through civilian enforcement. The program makes use of a specifically tailored smartphone app, which records video clips of violations. Severe traffic violations that are recorded by the program’s volunteers are transferred to the PTD for further consideration. The program was launched in 2016.
Individuals who wish to volunteer need to meet screening criteria: they must be aged 30 years or older and have no record of severe traffic offenses within the last five years. Priority is given based on locations of residence, to generate a more uniform spatial distribution. Those that pass the screening process receive brief training on using the technology. The volunteers install the app on their own smartphones. While they drive, the smartphone needs to be mounted on the windshield so that the road ahead of the vehicle is visible. Out of concern for the safety and security of the volunteers, participation is currently allowed only inside vehicles, where the recording is covert and so the risk that the volunteer will be identified by violators is minimal. The app keeps the smartphone camera on in the background for the entire duration of driving. When volunteers notice a traffic violation, they can record the event using voice command. A video clip covering 60 s (30 s before and 30 s after the activation) is recorded and location and time information is captured by the app. A report is automatically transmitted to a secure application server at the program’s control center, which initiates its evaluation. The volunteers are not expected to make any trips specifically for the purpose of enforcement. They are also not compensated in any way for their participation.
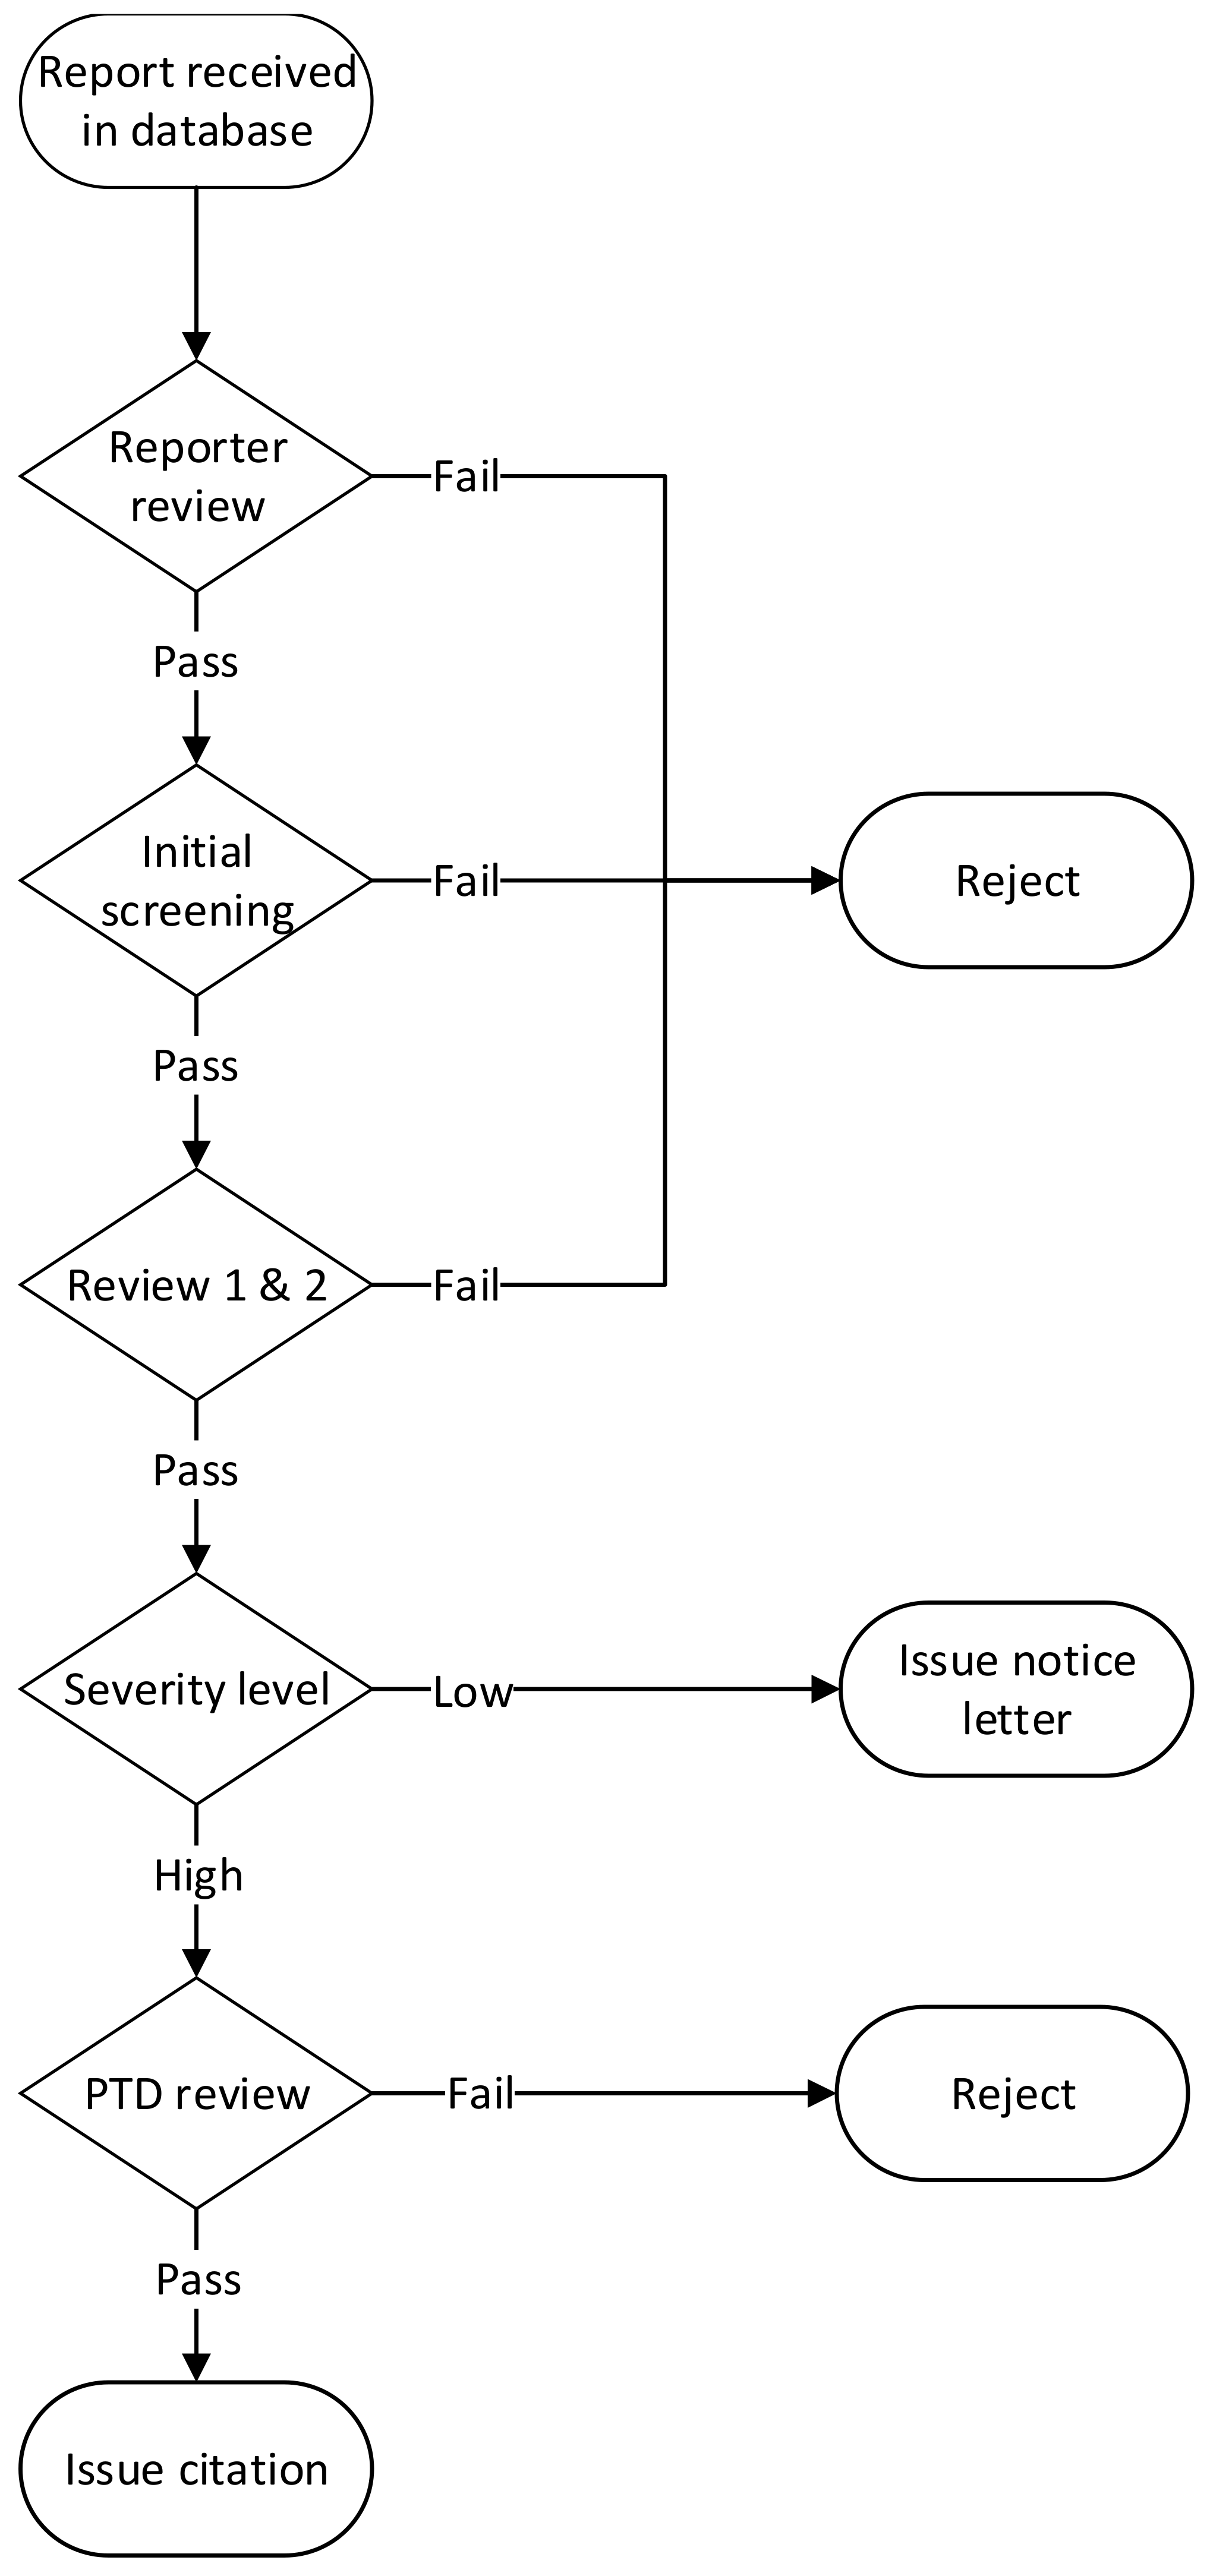
The overall reports’ evaluation process is shown in Figure 1. After a violation report is received, the reporting volunteer can view the video clip in the server portal and decide whether to withdraw or keep it for further assessment. At this point, the volunteer can also add text or audio descriptions of the violation. The completed report is passed on for review at the control center. There, another volunteer conducts an initial screening focusing on the quality and completeness of the information provided. Reports may be rejected for various reasons, such as having poor video quality, inability to identify the violating vehicle, an incomplete record of the violation itself (e.g., red traffic light not visible in the video) and so on. The reports that pass this screening are then reviewed by two professional inspectors. They verify the occurrence of the violation and the existence of the necessary evidence, and they evaluate the severity of the violation. While these are also volunteers, normally, at least one of them has relevant professional experience (e.g., past police service or long-time volunteer experience in traffic enforcement). Reports that are not confirmed by both inspectors are discarded.
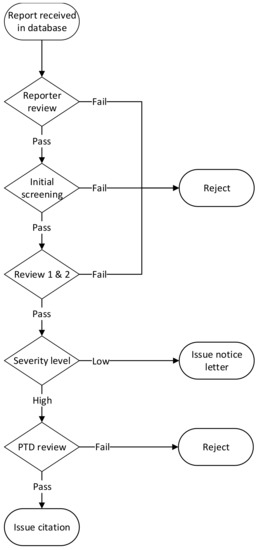
Figure 1.
Framework for the process of reports’ evaluation.
Next, reports that document violations that are perceived as severe or life-threatening are forwarded to the PTD for further action. Notice letters are sent by the control center to the violators in cases that are judged to be less severe. The notice letter describes the violation, explains its safety consequences and provides a link to the recorded video clip. The PTD examines the reports and issues citations, including court subpoenas if needed, to the violators. Due to administrative difficulties, violators in cases that are not considered for further action by the PTD do not receive notice letters.
3. Data, Methods and Research Questions
The analysis is based on a database of all recorded reports within the program and their handling during the initial 24 months of its operation. For each report, the following data items were provided: a unique report index, report creation date, status update date, controller index (party who updates the status), vehicle type, violation classification, location and description. Due to privacy regulations, personal information and socio-economic characteristics of both violators and volunteers were not provided to the researchers.
The final dataset created for the analysis was a fusion of the available information in the raw data. It included for each report the details of its creation date, all steps taken in its evaluation according to the process illustrated in Figure 1, the final outcome, violation classification and coded identity of the reporting volunteer.
The focus of the analysis was on evaluating the characteristics of the Road Guards program that indicate its potential usefulness as an enforcement tool. Specifically, the program’s outcomes and the volunteers’ level of engagement in the program over time were analyzed. The research questions addressed are threefold:
First, what is the volunteers’ level of engagement in the program in terms of enrollment and report production rates and their change over time? Continued substantial levels of engagement are critical for the program’s sustainability. Second, what are the process outcomes in terms of the final states of submitted reports, especially the citations and notice letters they produce, and how do these vary with respect to the characteristics of the volunteers, such as their level of engagement or seniority? This indicates the program’s efficiency and may help to evaluate scaling possibilities and cost implications. Third, what types of reports and citations are produced, and how do they compare to those generated by traditional police enforcement? This can indicate the program’s potential to not only increase enforcement quantities but also capture violations that are otherwise difficult to enforce.
4. Results
4.1. Volunteers’ Reporting Behavior
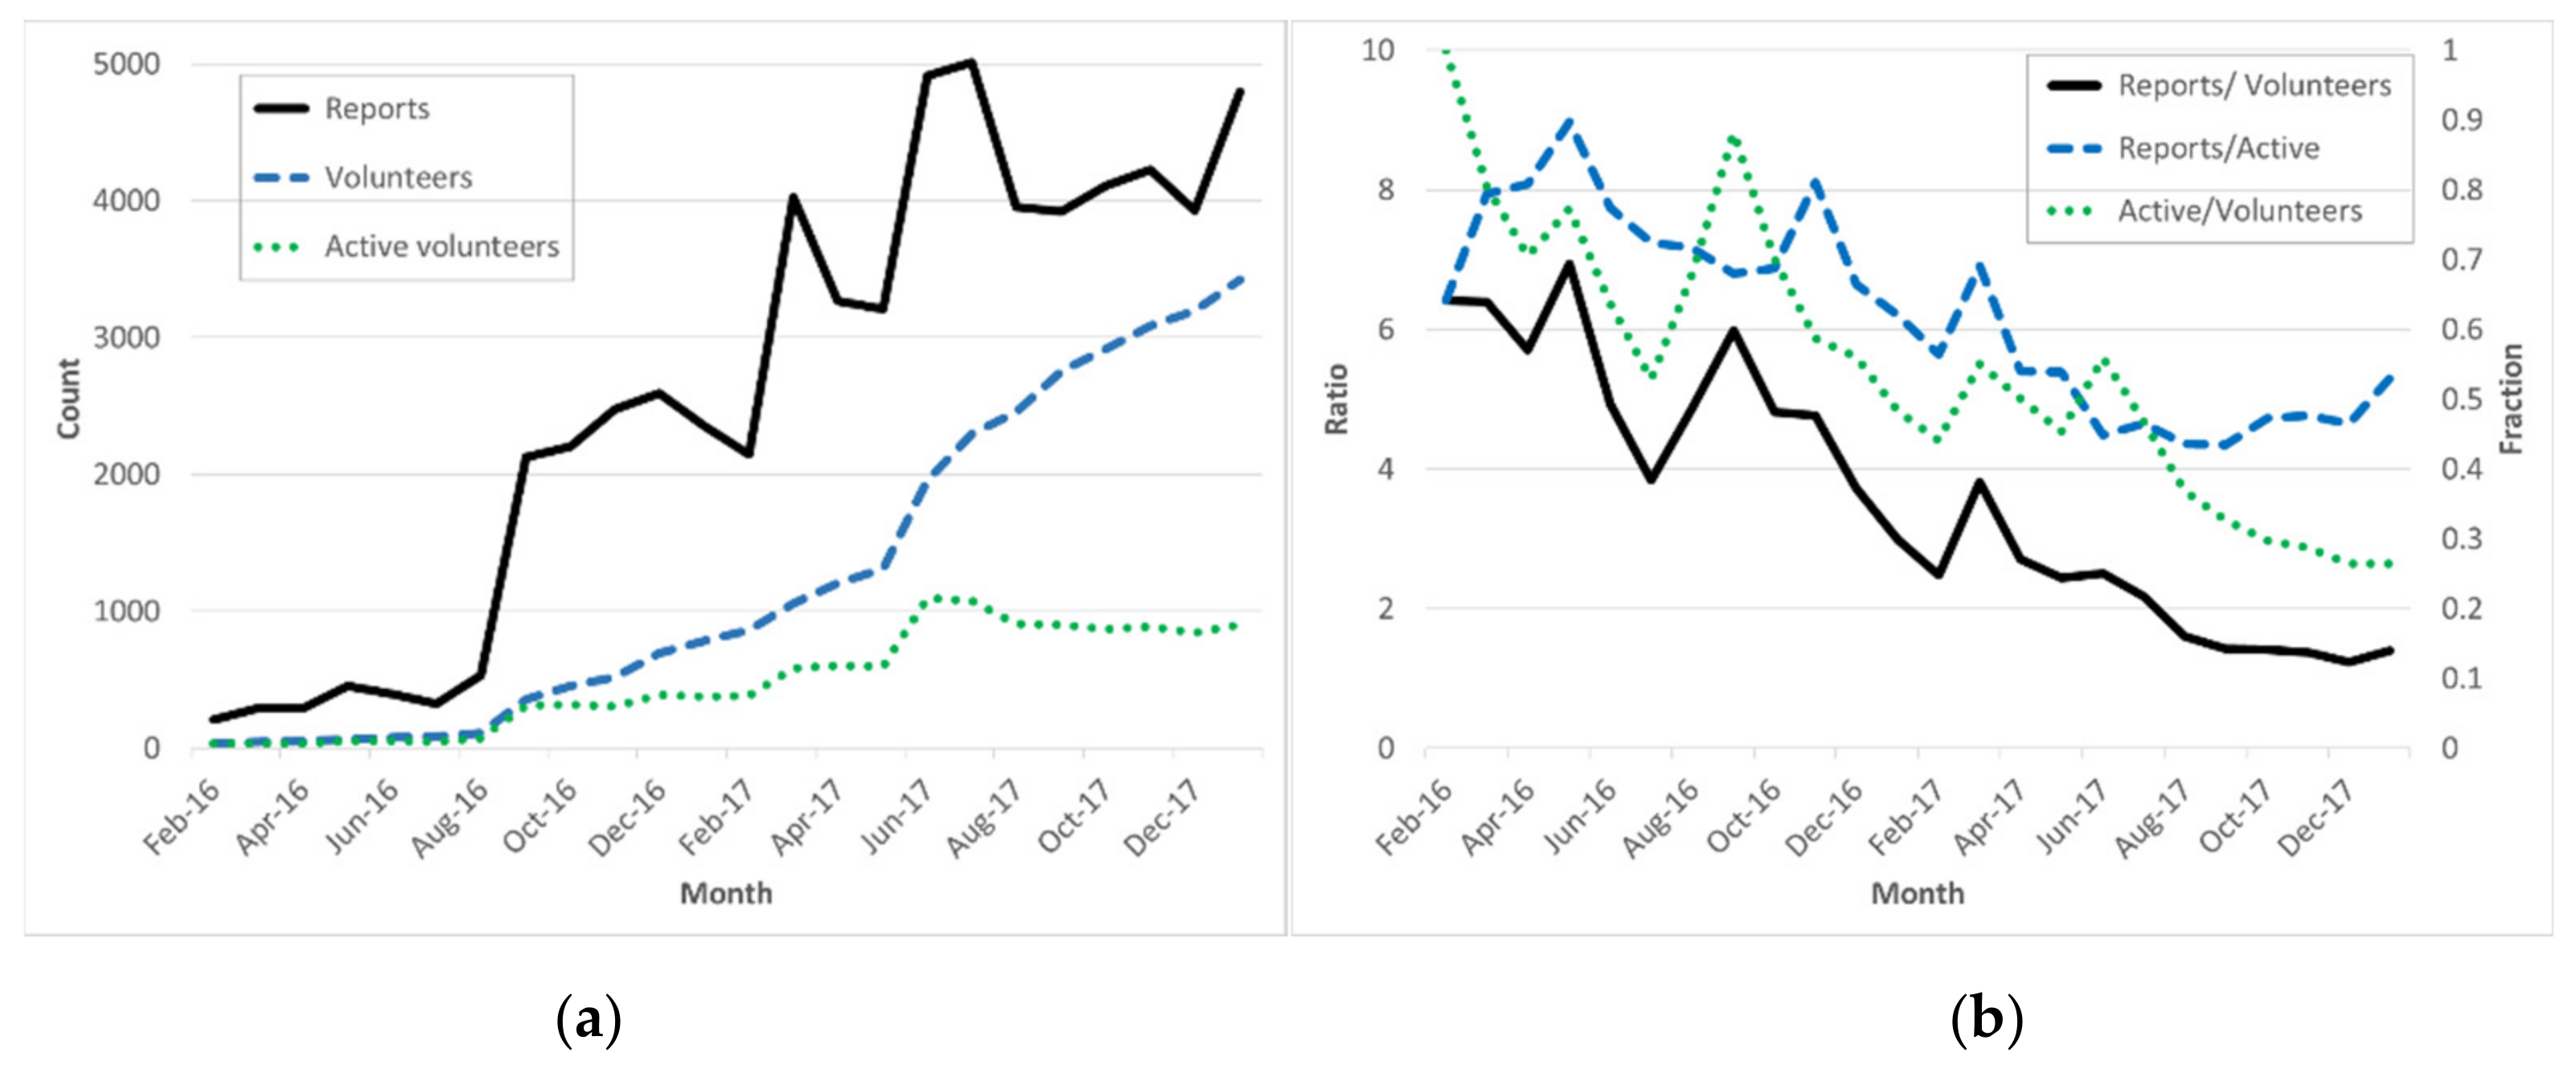
By the end of January 2018, after 24 months of operation, there were 3424 volunteers involved in this program who submitted 64,258 violation reports. Figure 2 presents the levels of volunteers’ activity over time. Part (a) of the figure shows the total number of volunteers in the system at the end of a specific month, the number of active volunteers (i.e., those that submitted reports within that specific month) and the number of reports that they submitted. Part (b) shows the average number of reports submitted in each month normalized by the total number of volunteers or by the number of active volunteers, along with the ratio of active volunteers to all volunteers. The figures show that the number of volunteers started to grow after about six months of operation and continued to increase steadily from then onward. However, the numbers of active volunteers did not increase at the same rate and remained roughly constant over the last six months. As a result, the proportion of active volunteers to all volunteers in the system decreased over time to a level of 0.26 in the last two months. That is, only a quarter of the volunteers were actually active in the program at the end of the study period. Similarly, the number of submitted reports increased over time, but stabilized in the last few months. The average number of reports per volunteer generally decreased over time and stabilized in the last six months at about 1.4 reports per volunteer and 4.8 reports per active ones.
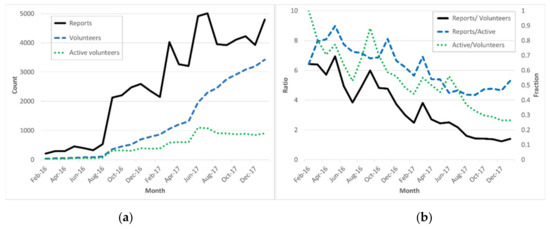
Figure 2.
(a) Numbers of submitted reports and total and active volunteers by month; (b) average number of reports per volunteer, per active volunteer and the ratio of active volunteers to all volunteers by month.
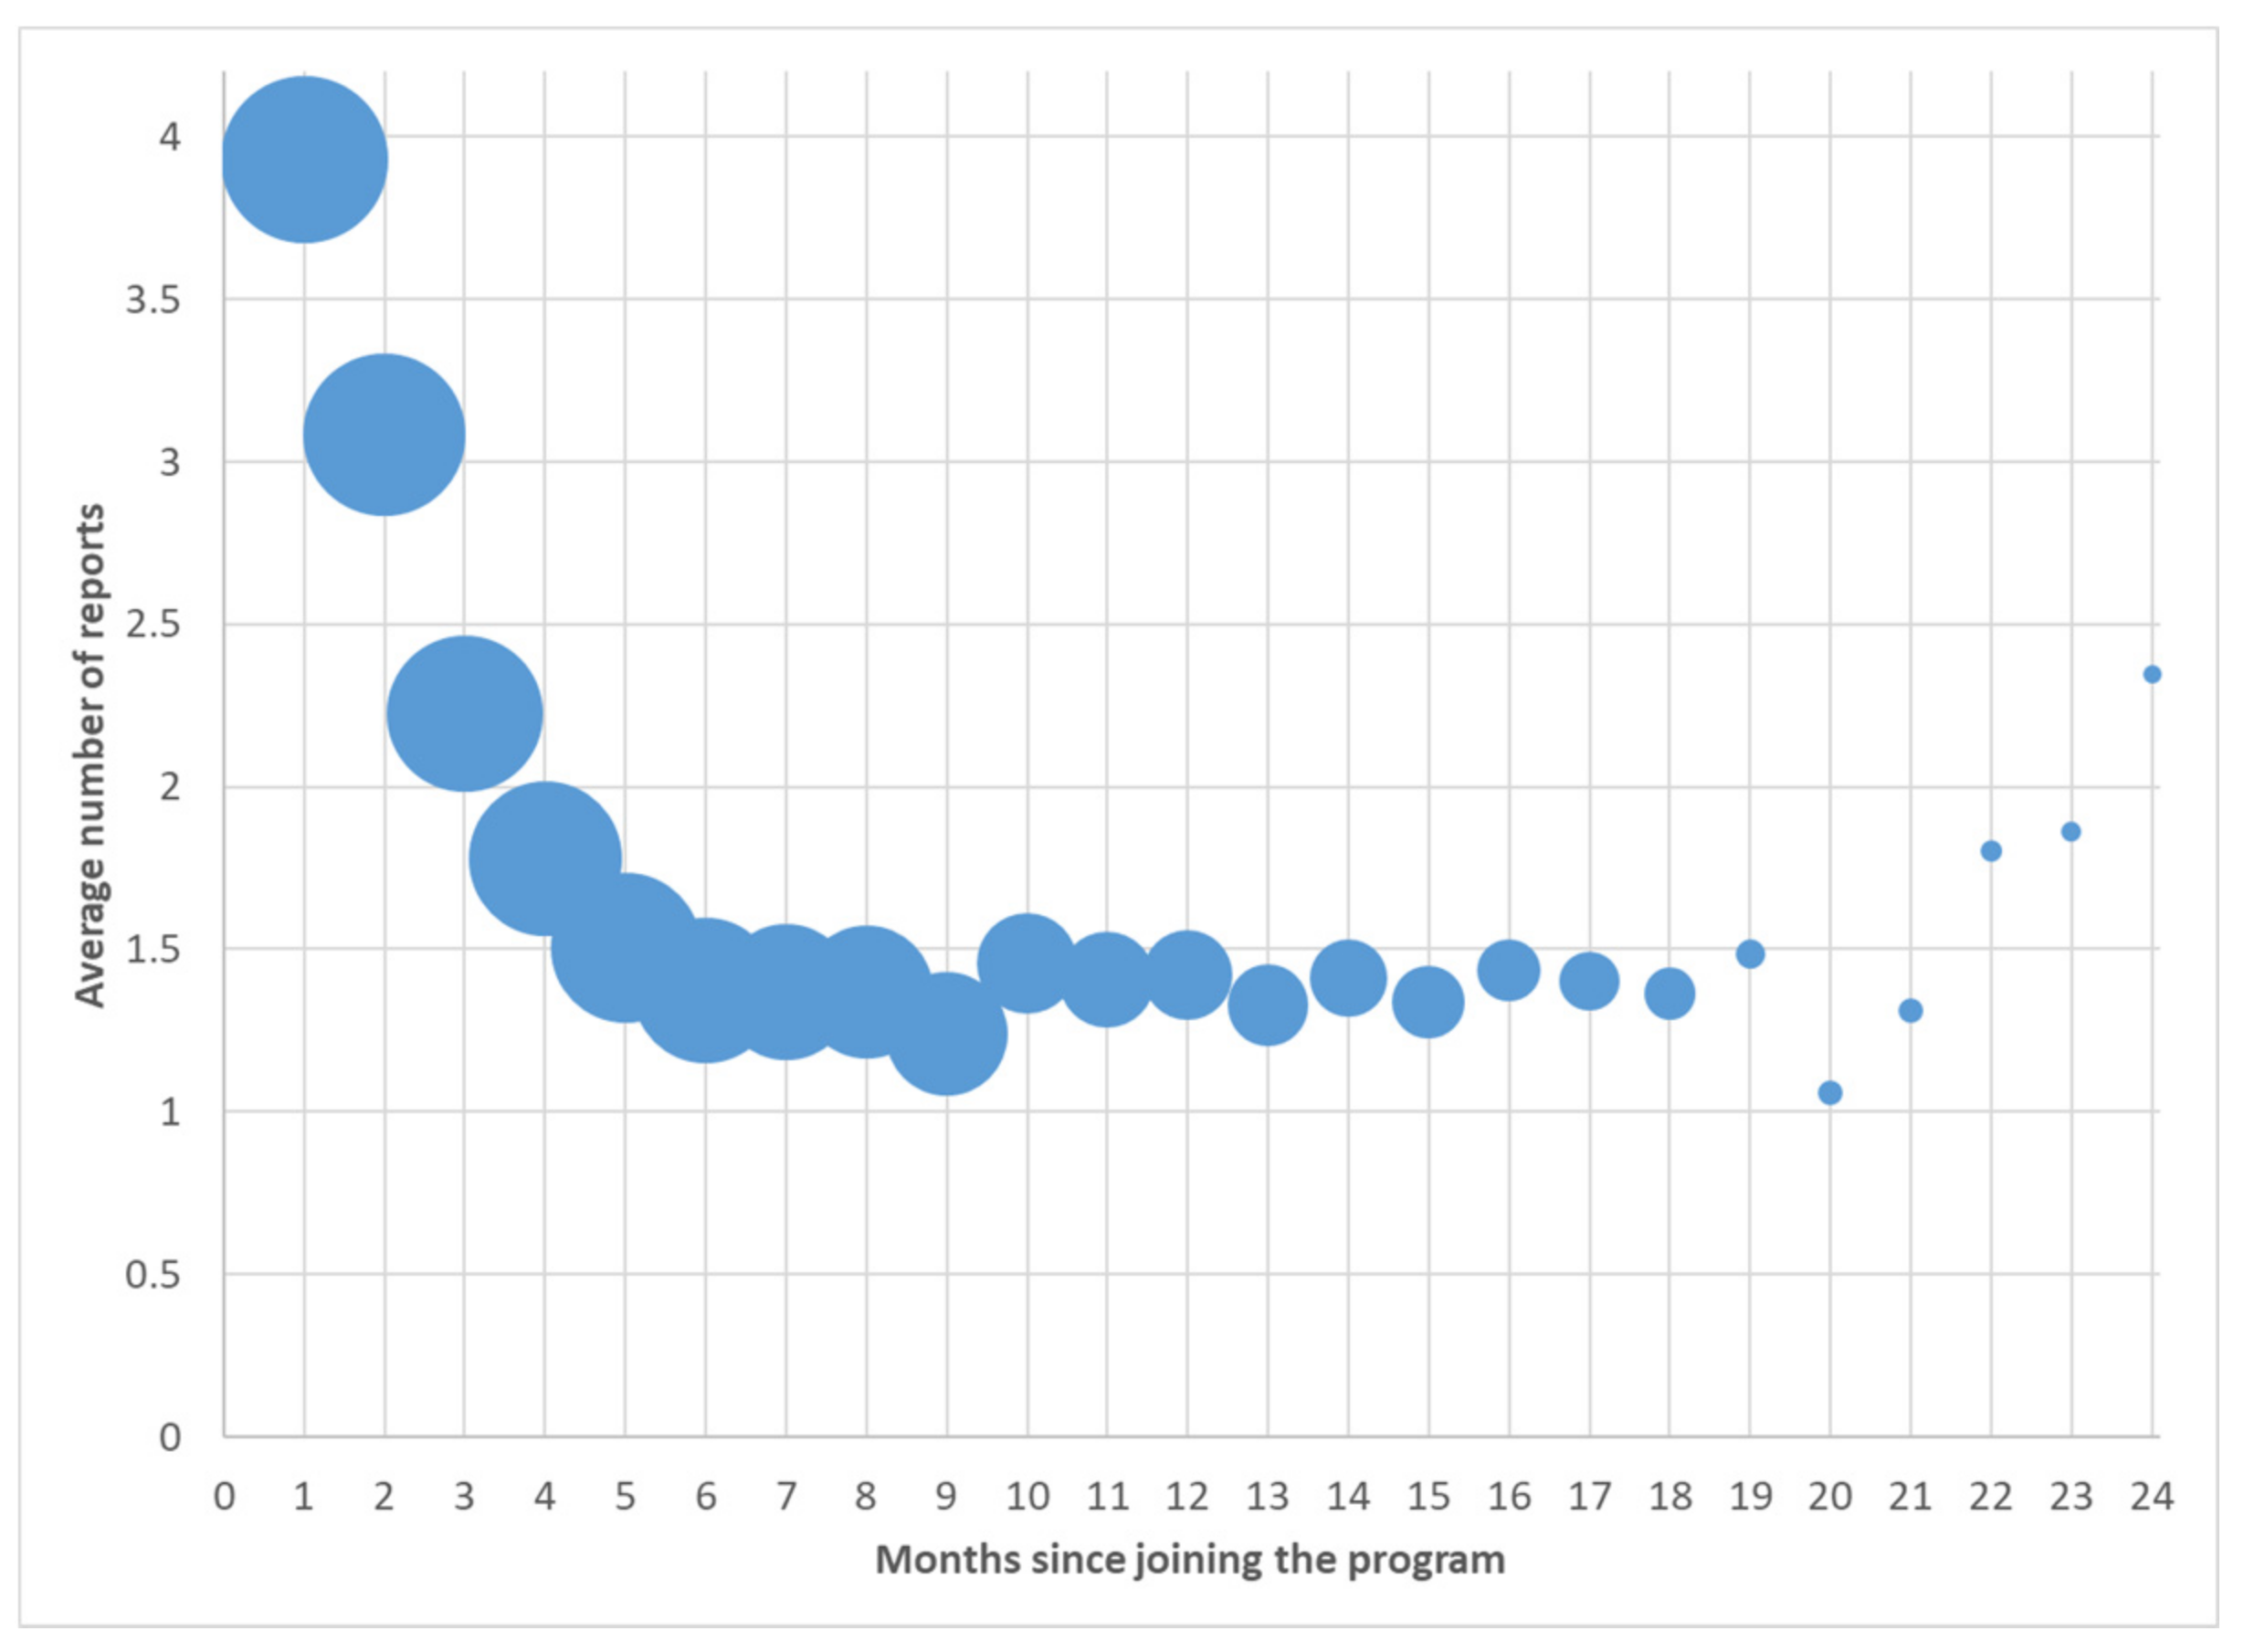
Figure 3 shows the average number of reports that volunteers submitted as a function of their seniority, i.e., the time that had passed since they joined the program. The sizes of the circles representing various seniority levels signify the numbers of relevant volunteers. A decaying trend is evident in the figure. On average, the volunteers submitted about four reports in their first month in the program. This value decreases within the next six months and then stabilized at about 1.4 reports in a month. These values reflect the same trend mentioned earlier: a large proportion of inactive volunteers and a small proportion of active ones.
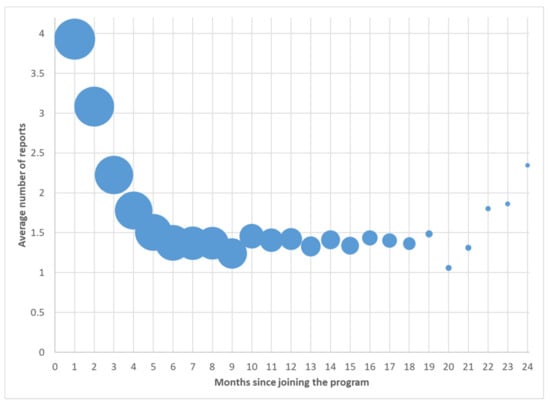
Figure 3.
Average number of submitted reports by seniority in the program.
4.2. Process Outcomes
Table 1 shows the numbers of reports that passed through the various steps of the evaluation process, which was presented in Figure 1, and the final actions taken on these reports. The percentages presented in the table are derived from the total of initially submitted reports. More than one-third of the submitted reports were immediately rejected by the individuals that submitted them. Another 40% were rejected in the later steps of the initial screening and after two rounds of review. Among the remaining reports (23.4% of all submitted reports), about 40% (9.7% of all initially submitted reports) were judged to be of high severity and sent to the police. The rest of the offenders (13.7% of all submitted reports) were issued notice letters. The police issued citations in response to about 40% of the reports it received, which amounted to 4.3% of all submitted reports. Notice letters were not issued when the reports were rejected by the police, although the violations were judged more severely by the reviewers compared to those in reports where letters were sent. Had letters also been sent in these cases, they would have amounted to over 19% of all submitted reports.

Table 1.
Final status of all the submitted reports.
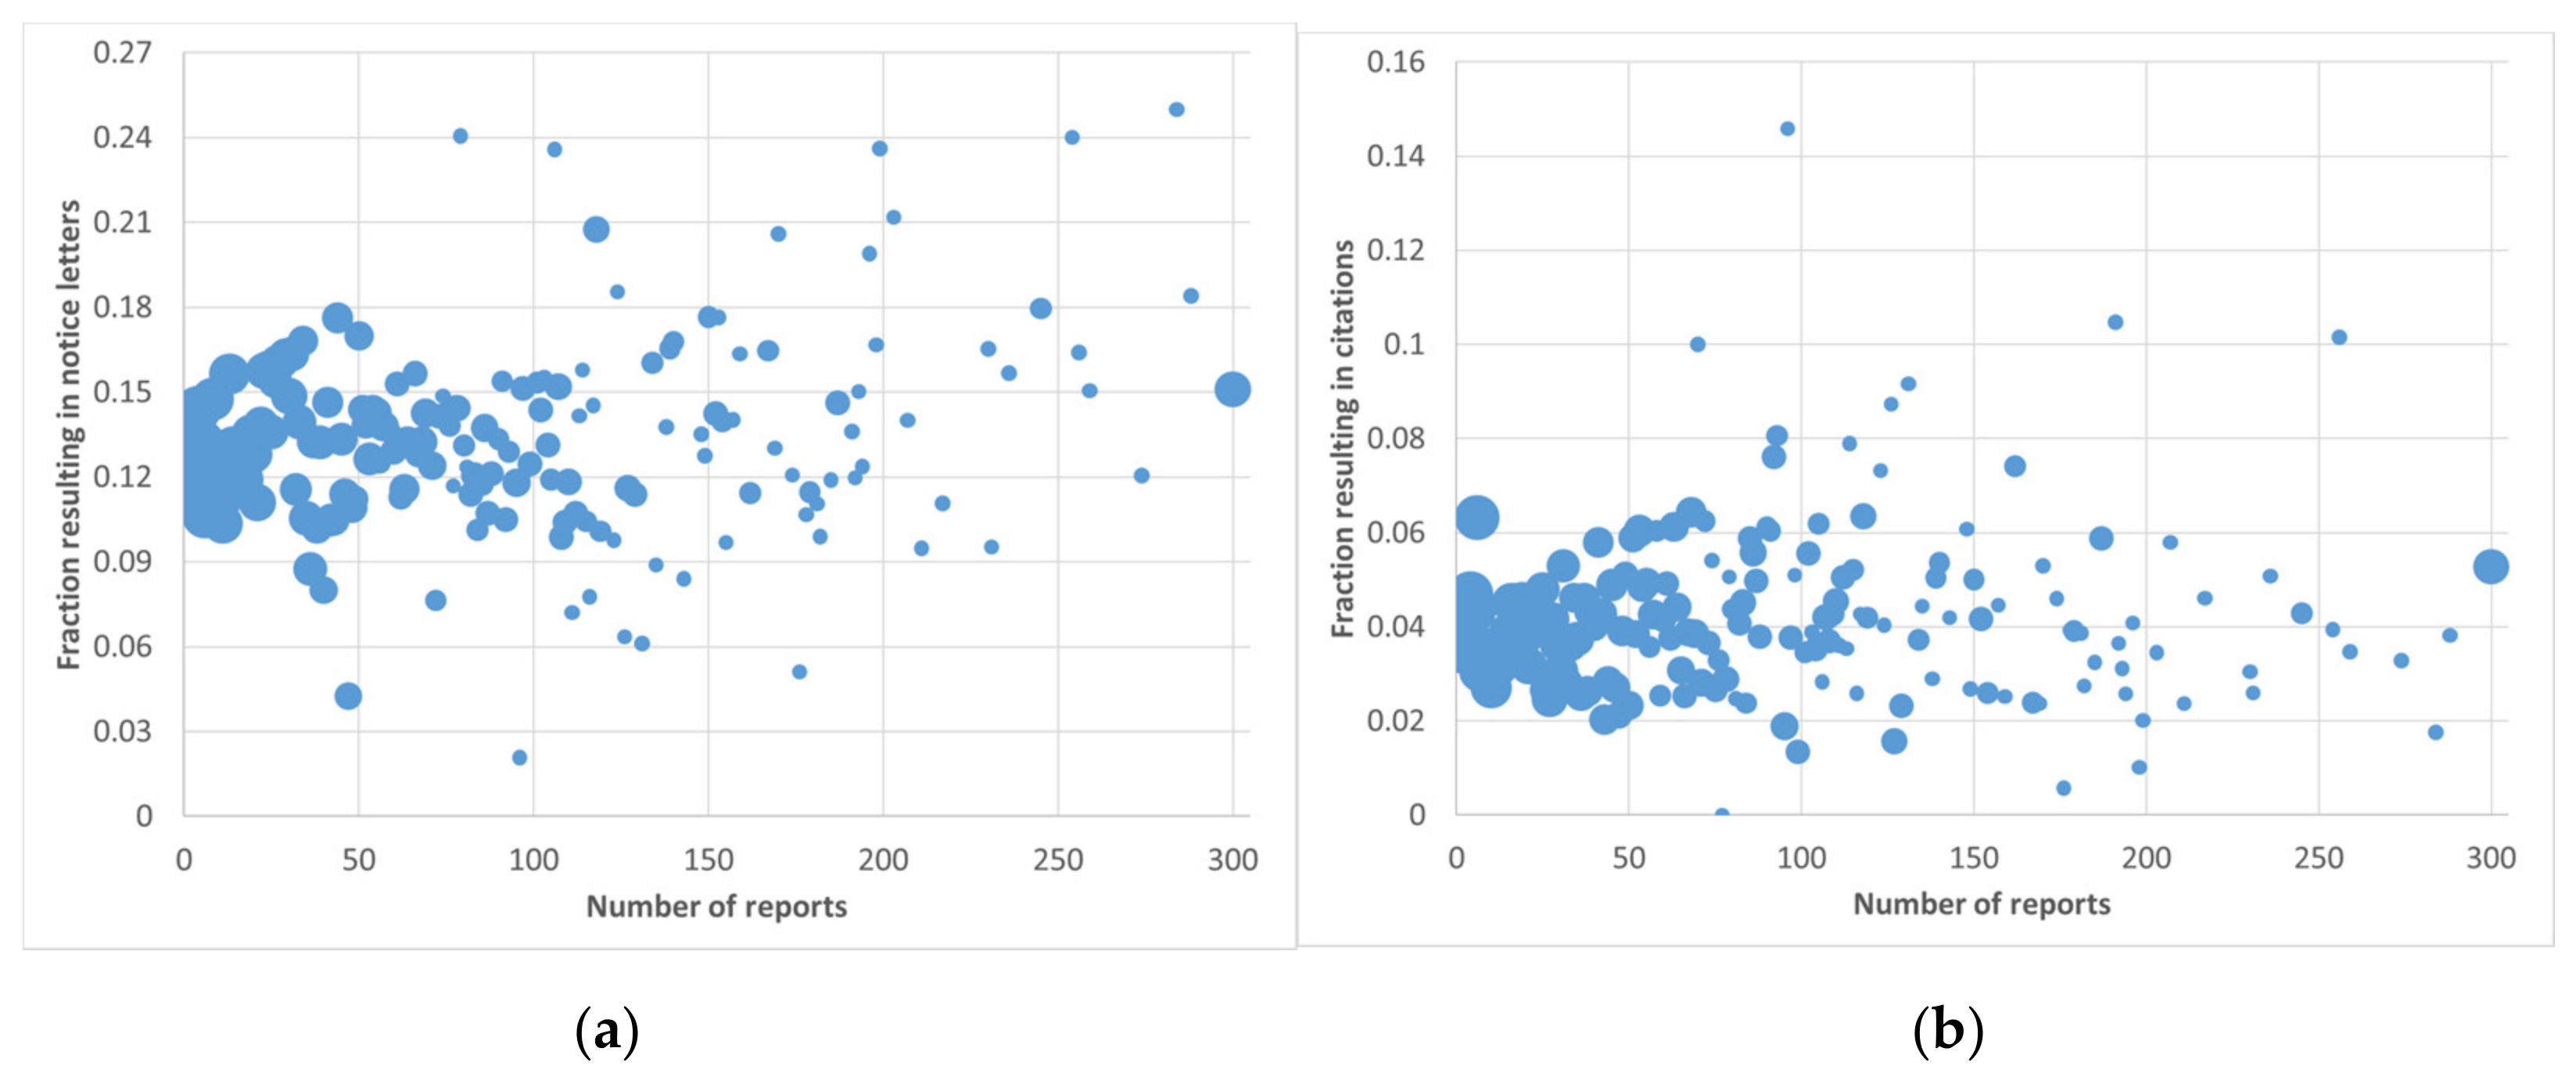
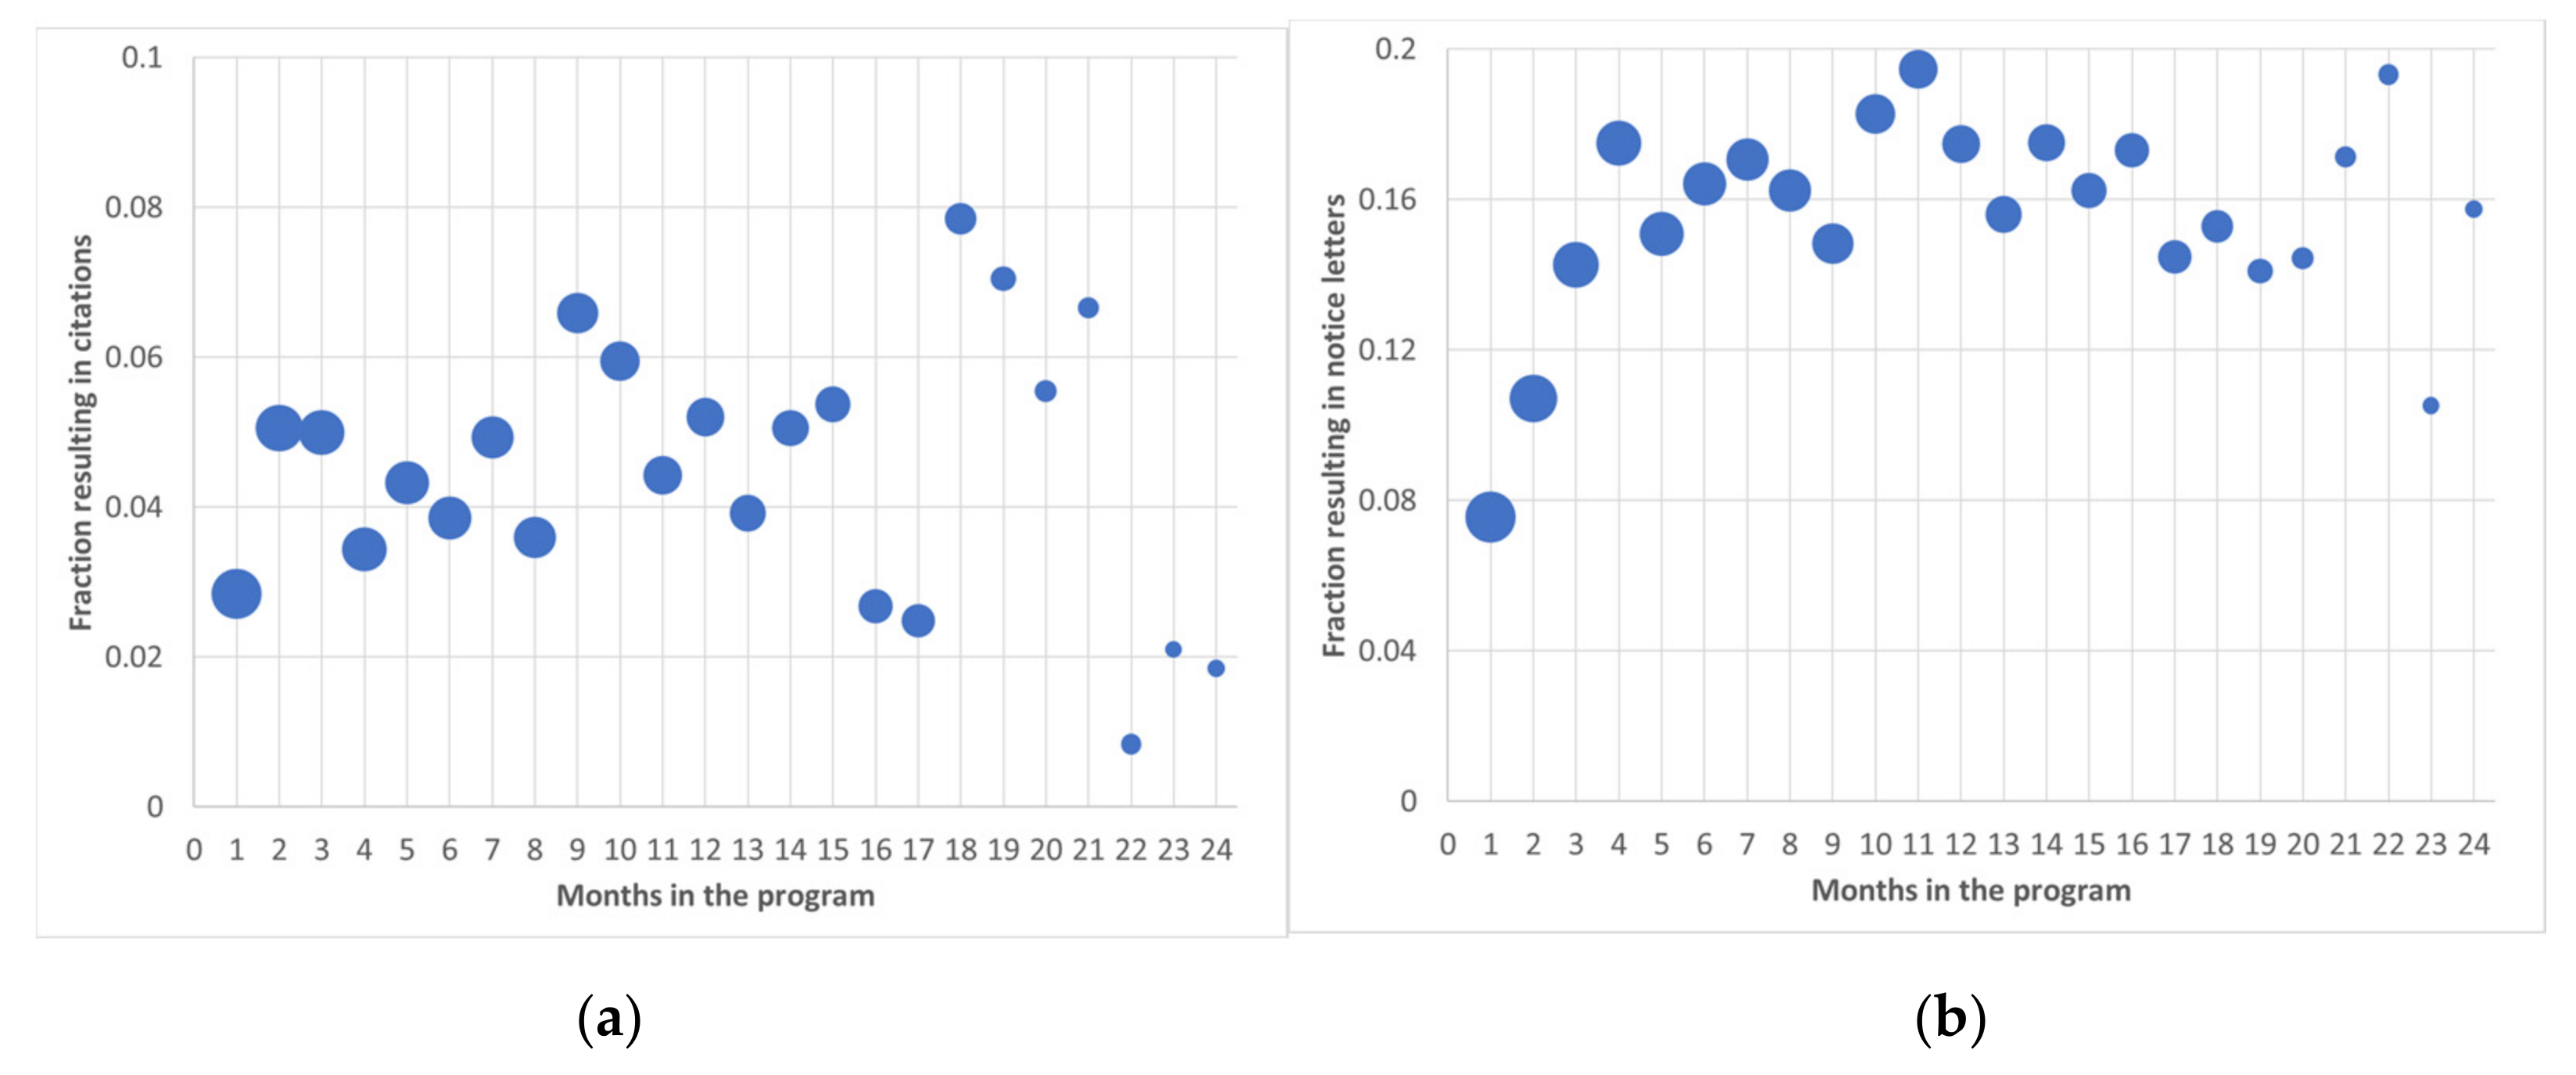
These results show that most reports were discarded without taking action. Thus, it is useful to examine whether specific characteristics of the volunteers and their behaviors over time affect the final statuses of the reports they submitted. Figure 4 and Figure 5 show the proportions of reports terminated with a citation (a) or notice letter (b) as a function of the total number of reports that the volunteer had submitted and of the number of months the volunteer had been on the program, respectively. All volunteers who submitted the same number of reports or had the same level of seniority in the program are grouped together, and their average proportion is reported. The size of a circle signifies the number of volunteers in the group. In Figure 4, the point at the highest value of the range shown (300 reports) represents 21 volunteers that submitted a larger number of reports. The figure shows that citations and notice letters were not strongly associated with the number of submitted reports. The correlation coefficients between the number of submitted reports and these outcomes were 0.15 and 0.18, respectively. The results in Figure 5 also show that no association was found between the proportion of reports resulting in citations and the volunteer’s seniority in the program; the correlation between these variables was −0.10. A clearer pattern can be observed with respect to reports that resulted in notice letters. This proportion was initially low and increased over time; after the initial four months, it remained stable. This result may reflect a learning experience for the volunteers with respect to submitting reports on less severely perceived violations.
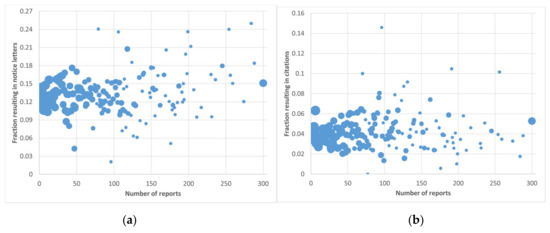
Figure 4.
Proportion of reports resulting in citations (a) and in notice letters (b) by the number of reports that the volunteer submitted.
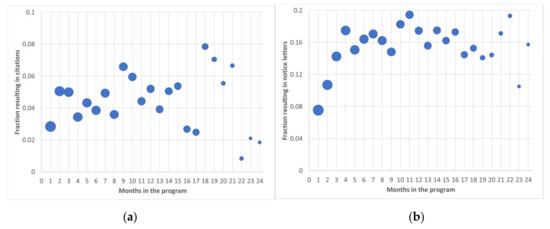
Figure 5.
Proportion of reports resulting in citations (a) and in notice letters (b) by the number of months the volunteer had been in the program.
4.3. Violation Types
The nature and circumstances of enforcement within the program differed substantially from that typically conducted by the police, which may have impacted the violation types captured by the volunteers. Table 2 presents the distribution of violation types in volunteer reports and citations and in regular police citations. The police data were obtained from their 2016 and 2017 annual statistical reports [32,33]. Table 2 also shows the crash risk implications of various violation types derived from analyses in Boris and Murry (2018) and Ba et al. (2018) [34,35].

Table 2.
Violation type proportions and their crash risk associations.
The most common citations issued by the police were for speeding, parking and failure to use safety equipment (e.g., seat belt, child restraint). It is difficult or impossible to capture these violations with sufficient legal proof in video recordings, and therefore, they are not present in the volunteer reports at all. The violation types that could be clearly observed in the recordings, such as disregarding traffic signs, running red lights and using lanes illegally or deviating from them, were better represented in the volunteer reports and citations compared to in the police citations. The most evident difference concerned unsafe driving violations. These included, for example, using a held-hand phone, overtaking, illegally crossing the median line, reckless driving, driving backwards and driving on the shoulder. These are often violations that are difficult for the police to enforce due to their widespread geographic distribution and short duration. As a result, they make up only 9% of police citations. However, they received substantial attention from the volunteers. Altogether, 42% of their reports and 57% of the citations generated from these reports were in this category. Most notably, 20% of the citations were for overtaking and median crossing violations and 31% were for driving on the shoulders. These violations are relatively easy to capture in recordings and are generally perceived as severe by the public.
A comparison of the volunteers’ reports and the citations generated from them shows higher rates of rejected reports for failing to adhere to traffic signs, deviating from lane and ‘other’ violations. This reflects the difficulty of clearly observing these violations, in a legal sense, in the recordings. Running a red light, driving on the shoulders, overtaking, crossing median lines and other unsafe driving violations are easier to observe and so are rejected at lower rates.
Research has shown that the effect of enforcement is stronger when it uses multiple methods [36] and when the offense is non-stationary and unpredictable [37,38]. The volunteer reports demonstrated both these characteristics. As shown above, they helped to diversify the types of violations enforced, and by their nature, increased the geographic spread and randomness of locations where enforcement took place. Furthermore, the crash risk implications of various violation types differed. Boris and Murry (2018) and Ba et al. (2018) [34,35] quantify the increased crash risks associated with specific violation types for truck and taxi drivers, respectively. Their violation classifications differ from each other and from that reported in this research. Therefore, the violations in the data in this study were matched with the most similar ones from the literature and the impacts were converted to a three-level scale: high, medium and low. Note that not all violation types used in the current studies were matched. Table 2 shows that 91% of the volunteers generated citations for violation types that were associated with at least a medium increase of crash risk in at least one of the two studies, compared to only a 55% association for the police citations. Thus, the volunteer-generated citations were of high quality in terms of the violation types’ association with the crash risk.
5. Discussion
The available data from the first 24 months of operation of the Road Guards program included over 64,000 reports that were submitted by more than 3400 volunteers. The number of volunteers, and with it, the number of submitted reports, started to grow after about six months of operation, and continued to increase steadily afterward.
The first research question addressed in this paper related to the level of engagement of volunteers and the evolution of this over time. The long-term sustainability of the program depends on its ability to generate and maintain a high level of engagement from volunteers. The data showed that newly recruited volunteers were more active. On average, volunteers submitted about four reports in their first month on the program. This value decreased within the next six months and then stabilized at about 1.4 reports per month. Many volunteers became inactive with the passage of time: The proportion of active volunteers (i.e., those who submitted reports within a specific month) to all volunteers in the system decreased over time to a level of 0.26 in the last two months. Thus, on one hand, a large proportion of volunteers became less active or practically dropped off the program; on the other hand, the stabilization of the rate of report submission indicates that other volunteers remained active and continued to contribute to the program. Consequently, steps should be taken to preserve volunteers’ interest and willingness to participate over time, with the goal of keeping the high initial involvement and reducing attrition.
The second research question related to the final outcomes of the submitted reports. The program would be more efficient if a large proportion of reports resulted in practical outcomes, namely, notice letters and citations. In the current data, more than one-third of the submitted reports were immediately rejected by the volunteers who submitted them. Another 40% were rejected in later steps of the review process. These numbers suggest that volunteers, who are generally not professional enforcement officers, submit many irrelevant reports. However, it should be noted that this may also be a by-product of the nature of such enforcement and its evaluation process: Some of the rejections, especially in the initial steps, were an inevitable result of differences between what the volunteers saw and the information captured in the recordings. Feedback and training programs, as well as improvements to the app’s interface, may support the volunteers in their initial review and help to avoid the additional effort associated with later rejections.
The remaining 15,062 reports accounted for less than a quarter of the initially submitted reports. For about 60% of these, the offenders were issued notice letters. The remaining 40% were judged to reflect more severe violations and the recordings were sent to the police. The police issued citations in response to about 40% of the reports that they received, which amounted to 4.3% of all submitted reports. Notice letters were not issued when the reports were rejected by the police, although the violations were judged more severely by the programs’ reviewers compared to those in reports where letters were sent. Had letters also been sent in these cases, they would have amounted to over 19% of all submitted reports (instead of 13.7%, as were actually issued letters). Thus, the program would benefit from issuing notice letters to offenders in cases where the police reject the report. Furthermore, consideration may be given to identifying repeat violators and treating these reports with careful consideration.
As noted above, most reports were discarded without taking action, neither issuing a citation nor a notice letter. Thus, it is useful to examine whether specific characteristics of the volunteers and their behaviors over time affected the final statuses of the reports that they submitted. It was found that the proportion of cases ending in a citation or notice letter was not strongly associated with the volunteer’s level of engagement (when that was measured by the number of reports that they submitted). The correlation coefficients between the number of submitted reports and these two outcomes were 0.15 and 0.18, respectively. Further to this, no association was found between the volunteers’ seniority in the program, in terms of months since they joined, and the proportion of reports resulting in citations; the correlation between these variables was -0.10. A clearer pattern was observed with respect to reports that resulted in notice letters; these were initially low, then increased over time and remained stable. This may reflect a learning experience for the volunteers with respect to submitting reports on supposedly less severe violations whether or not they deserved consideration.
The third research question addressed the types of violations captured in the program. These, both in terms of the reports submitted and the citations issued, greatly differed from those issued by the police in their regular enforcement activities. Some of these differences resulted from the capabilities and limitations of the technology used to record the violations in the Road Guard program. It is difficult or impossible to produce reports with clear evidence on speeding or violations taking place inside the vehicle, such as the use of handheld devices while driving or failure to use seatbelts. In contrast, violations that are easily noticed and documented from the volunteers’ vehicles were the most common. These included lane deviations (including crossing continuous white line), running a red light, driving on the road shoulders and reckless driving behavior (including aggressive turns and failure to give the right of way. These easily observed violations were also less likely to be rejected in the report evaluation process. Moreover, our comparison showed that the vast majority of volunteer citations were for the violations associated with the highest risk levels, whilst these were significantly less represented in police citations.
These results indicate that the program can be used to complement police enforcement, thus helping to boost conventional approaches where they are less effective. The violations captured by the volunteers were characterized by a wide spatial distribution and violation types that differed substantially from those addressed by traditional police activity. These characteristics support the main goal of enforcement, which is deterrence from engagement in risky and non-compliant driving behaviors. Furthermore, the work of the program may increase public acceptance of enforcement and awareness of road safety as the violations captured by the volunteers were generally ones perceived as severe by the public. It should be noted that this program does not induce negative externalities to society since the volunteers record offenses they note during regular daily driving.
This study is, to the best of the authors’ knowledge, the first evaluation of a volunteer-based enforcement program. The program demonstrates how technology can be utilized to increase enforcement levels through public engagement when that is kept evidence-based and professional. The evaluation showed that the program may benefit from improved training and feedback to the volunteers on their reporting and initial review inputs, which could help to reduce the rate of rejection in later steps. Further actions to preserve volunteers’ interest and willingness over time should also be taken.
While the paper points out the program’s potential, the study’s limitations should also be acknowledged. During the period of two years of operation, there were changes in the program, such as updates to the app and technical and staffing changes in the control center. These were not captured in the data and so were not considered in the analysis. Furthermore, the analysis focused on evaluation of the program’s outputs: reports, citations and notice letters. The resources used to produce these (e.g., work hours, manpower) were not evaluated in the current study due to a lack of availability of the relevant data. Volunteers’ socioeconomic characteristics, which were also not available, may too have played a role in their reporting behavior and thus influenced the program’s outputs. Furthermore, the data available from the PTD on the types of violations reported, and their comparison to PTD-recorded violations, were limited to an assessment of broad types. More detailed information, and association of the violation types with additional characteristics such as spatial and temporal distributions, would support additional research in this direction. Finally, the program affects many parties (e.g., it helps to reduce the strain on the limited resources available to the PTD), and therefore, a stakeholder analysis should be performed for a comprehensive evaluation.
6. Conclusions
This study presents an evaluation of a new and unique type of traffic enforcement—the Israeli Road Guards program. This program uses simple technology to enable evidence-based enforcement of traffic violations by the general public. In doing so, it supports increased enforcement levels and public engagement in the process. This analysis of data from the initial 24 months of operation showed that this type of program is a useful complementary tool to traditional police enforcement. The volunteers report different types of traffic violations compared to those typically captured by the police. They also help to increase the geographic spread and spontaneity of enforcement locations. Furthermore, the citations they generate tend to be of violations that are associated with higher crash risks.
The program is sustainable as the enforcement activities are carried out during the volunteers’ regular daily trips and so do not induce additional traffic. The volunteers’ work may also increase public acceptance of traffic enforcement and promote public awareness of road safety. Although the average number of reports that volunteers submitted declined initially, it stabilized after few months at around 1.4 reports per month. Furthermore, the quality of these reports in terms of the proportions that resulted in citations or notice letters improved with experience, indicating that volunteers learned with experience.
The program’s implementation could be improved. Its efficiency was negatively affected by high levels of rejected reports and by volunteer attrition. More comprehensive training and feedback for the volunteers on their reporting and initial review inputs could help to reduce the rate of rejections in later steps, and as a result, the workload for reviewers. Actions to preserve volunteers’ interest and willingness to actively participate in the program may include the use of incentive plans, periodic meetings with volunteers and other forms of acknowledgement for their contribution. Another specific problem with the current operation of the program is that no action is taken for those reports that are transferred to the police but a citation is then not issued. The resolution of this issue is straightforward, i.e., sending notice letters to these offenders who currently fall through a procedural gap. Finally, consideration should be given to identifying repeated violators and treating reports associated with them with careful attention.
Regardless of the limitations of this study, the results highlight the contribution of this type of enforcement to a sustainable and safe transportation system.
Author Contributions
Conceptualization, G.A. and T.T.; methodology, G.A. and T.T.; software, D.B.; validation, T.T. and D.B.; formal analysis, T.T. and D.B.; investigation, G.A., T.T. and D.B.; resources, D.B.; data curation, D.B.; writing—original draft preparation, G.A. and D.B.; writing—review and editing, G.A. and T.T.; visualization, G.A. and T.T.; supervision, G.A. and T.T.; project administration, G.A. All authors have read and agreed to the published version of the manuscript.
Funding
This research received no external funding.
Data Availability Statement
Restrictions apply to the availability of these data.
Acknowledgments
The authors thank Yair Nativ from Safe Lane and his colleagues at the program’s management center for their support and for providing access to the data used in this study.
Conflicts of Interest
The authors declare no conflict of interest.
References
- Elvik, R.; Vaa, T.; Hoye, A.; Sorensen, M. (Eds.) The Handbook of Road Safety Measures; Emerald Group Publishing: Bradford, UK, 2009. [Google Scholar]
- Elvik, R. Cost–benefit analysis of road safety measures: Applicability and controversies. Accid. Anal. Prev. 2001, 33, 9–17. [Google Scholar] [CrossRef]
- Granà, A.; Giuffrè, T.; Macioszek, E.; Acuto, F. Estimation of Passenger Car Equivalents for two-lane and turbo roundabouts using AIMSUN. Front. Built Environ. 2020, 6, 86. [Google Scholar] [CrossRef]
- Macioszek, E. Roundabout entry capacity calculation—A case study based on roundabouts in Tokyo, Japan, and Tokyo surroundings. Sustainability 2020, 12, 1533. [Google Scholar] [CrossRef] [Green Version]
- Maheshwari, P.; Khaddar, R.; Kachroo, P.; Paz, A. Dynamic modeling of performance indices for planning of sustainable transportation systems. Netw. Spat. Econ. 2016, 16, 371–393. [Google Scholar] [CrossRef] [Green Version]
- Severino, A.; Pappalardo, G.; Curto, S.; Trubia, S.; Olayode, I.O. Safety Evaluation of Flower Roundabout Considering Autonomous Vehicles Operation. Sustainability 2021, 13, 10120. [Google Scholar] [CrossRef]
- Wegman, F.; Aarts, L.; Bax, C. Advancing sustainable safety: National road safety outlook for The Netherlands for 2005–2020. Saf. Sci. 2008, 46, 323–343. [Google Scholar] [CrossRef]
- World Health Organization. Global Status Report on Road Safety 2015; World Health Organization: Geneva, Switzerland, 2015. [Google Scholar]
- DeAngelo, G.; Hansen, B. Life and death in the fast lane: Police enforcement and traffic fatalities. Am. Econ. J. Econ. Policy 2014, 6, 231–257. [Google Scholar] [CrossRef]
- Greer, S.; Barends, E. Does Police Traffic Enforcement Result in Safer Roads? A Critically Appraised Topic; Center for Evidence-Based Management: Leiden, The Netherlands, 2017. [Google Scholar]
- Stanojević, P.; Jovanović, D.; Lajunen, T. Influence of traffic enforcement on the attitudes and behavior of drivers. Accid. Anal. Prev. 2013, 52, 29–38. [Google Scholar] [CrossRef]
- Redelmeier, D.A.; Tibshirani, R.J.; Evans, L. Traffic-law enforcement and risk of death from motor-vehicle crashes: Case-crossover study. Lancet 2003, 361, 2177–2182. Available online: http://www.thelancet.com (accessed on 15 August 2021). [CrossRef]
- Yannis, G.; Papadimitriou, E.; Antoniou, C. Impact of enforcement on traffic accidents and fatalities: A multivariate multilevel analysis. Saf. Sci. 2008, 46, 738–750. [Google Scholar] [CrossRef]
- Schafer, J.A.; Mastrofski, S.D. Police leniency in traffic encounters: Exploratory findings from observations and interviews. J. Crim. Justice 2005, 33, 225–238. [Google Scholar] [CrossRef]
- Garrett, T.A.; Wagner, G.A. Red Ink in the Rearview Mirror: Local Fiscal Conditions and the Issuance of Traffic Tickets. J. Law Econ. 2009, 52, 71–90. [Google Scholar] [CrossRef] [Green Version]
- McCoy, T. Ferguson Shows How a Police Force Can Turn into a Plundering ‘Collection Agency’. Washington Post Online, 5 March 2015. Available online: https://www.washingtonpost.com/news/morning-mix/wp/2015/03/05/ferguson-shows-how-a-police-force-can-turn-into-a-plundering-collection-agency/?utm_term=.29764c974d96 (accessed on 15 August 2021).
- Armenta, A. Between public service and social control: Policing dilemmas in the era of immigration enforcement. Soc. Probl. 2015, 63, 111–126. [Google Scholar] [CrossRef]
- Sahin, N.M. Legitimacy, Procedural Justice, and Police-Citizen Encounters: A Randomized Controlled Trial of the Impact of Procedural Justice on Citizen Perceptions of the Police during Traffic Stops in Turkey. Ph.D. Thesis, Rutgers University-Graduate School, Newark, NJ, USA, 2014. [Google Scholar]
- Makowsky, M.D.; Stratmann, T. More tickets, fewer accidents: How cash-strapped towns make for safer roads. J. Law Econ. 2011, 54, 863–888. [Google Scholar] [CrossRef] [Green Version]
- Becker, G.S.; Stigler, G.J. Law enforcement, malfeasance, and compensation of enforcers. J. Leg. Stud. 1974, 3, 1–18. [Google Scholar] [CrossRef]
- Shavell, S. The optimal structure of law enforcement. J. Law Econ. 1993, 36 Pt 2, 255–287. [Google Scholar] [CrossRef]
- Garoupa, N. The economics of organized crime and optimal law enforcement. Econ. Inq. 2000, 38, 278–288. [Google Scholar] [CrossRef]
- Fuster, A.; Meier, S. Another hidden cost of incentives: The detrimental effect on norm enforcement. Manag. Sci. 2010, 56, 57–70. [Google Scholar] [CrossRef] [Green Version]
- DeAngelo, G.; Humphreys, B.R.; Reimers, I. Are public and private enforcement complements or substitutes? Evidence from high frequency data. J. Econ. Behav. Organ. 2017, 141, 151–163. [Google Scholar] [CrossRef]
- Wells, H.; Millings, M. Scrutinising the appeal of volunteer Community Speedwatch to policing leaders in England and Wales: Resources, responsivity and responsibilisation. Polic. Soc. 2019, 29, 376–391. [Google Scholar] [CrossRef]
- Murphy, P.; Eckersley, P.; Ferry, L. Accountability and transparency: Police forces in England and Wales. Public Policy Adm. 2017, 32, 197–213. [Google Scholar] [CrossRef] [Green Version]
- Wang, C.; Xu, C.; Fan, P. Effects of traffic enforcement cameras on macro-level traffic safety: A spatial modeling analysis considering interactions with roadway and land use characteristics. Accid. Anal. Prev. 2020, 144, 105659. [Google Scholar] [CrossRef] [PubMed]
- Li, Y.; Abdel-Aty, M.; Yuan, J.; Cheng, Z.; Lu, J. Analyzing traffic violation behavior at urban intersections: A spatio-temporal kernel density estimation approach using automated enforcement system data. Accid. Anal. Prev. 2020, 141, 105509. [Google Scholar] [CrossRef] [PubMed]
- The Hindu. Traffic Police’s Whatapp Helpline an Instant Hit. 2019. Available online: https://www.thehindu.com/news/cities/kozhikode/traffic-polices-whatsapp-helpline-an-instant-hit/article26343365.ece (accessed on 15 June 2020).
- Times of India. Delhi Traffic Police Launch New Whatsapp Helpline. 2014. Available online: https://timesofindia.indiatimes.com/city/delhi/Delhi-traffic-police-launch-new-WhatsApp-helpline/articleshow/44853939.cms (accessed on 15 June 2020).
- The Straits Times. Submit Clips of Road Offenses to Us: Traffic Police. 2015. Available online: https://www.straitstimes.com/singapore/submit-clips-of-road-offences-to-us-traffic-police (accessed on 15 June 2020).
- Israel Police. 2016 Annual Statistics; Planning and Organization Department, Israel Police: Jerusalem, Israel, 2017.
- Israel Police. 2017 Annual Statistics; Planning and Organization Department, Israel Police: Jerusalem, Israel, 2018.
- Boris, C.; Murray, D. Predicting Truck Crash Involvement: 2018 Update; American Transportation Research Institute: Alexandria, VA, USA, 2018. [Google Scholar]
- Ba, X.; Zhou, F.; Wang, Y. Predicting personal injury crash risk through working conditions, job strain, and risky driving behaviors among taxi drivers. Eur. Transp. Res. Rev. 2018, 10, 48. [Google Scholar] [CrossRef]
- Rousseau, S.; Blondiau, T. Insights into road safety enforcement. Rev. Bus. Econ. Lit. 2013, 58, 158–184. [Google Scholar]
- Zaidel, Z.M. The Impact of Enforcement on Accidents, Deliverable 3, ESCAPE Project, 4th Framework Programme; European Commission: Brussels, Belgium, 2002. [Google Scholar]
- Blais, E.; Dupont, B. Assessing the Capability of Intensive Police Programmes to Prevent Severe Road Accidents A Systematic Review. Br. J. Criminol. 2005, 45, 914–937. [Google Scholar] [CrossRef]
Publisher’s Note: MDPI stays neutral with regard to jurisdictional claims in published maps and institutional affiliations. |
© 2021 by the authors. Licensee MDPI, Basel, Switzerland. This article is an open access article distributed under the terms and conditions of the Creative Commons Attribution (CC BY) license (https://creativecommons.org/licenses/by/4.0/).

