Abstract
Typically, the main control on alternating current (AC) power systems is performed by the scheduling of rotary machines of synchronous generators and static machines of on-load tap changer (OLTC) transformers and volt-ampere reactive (VAR) sources. Large machines of synchronous generators can be managed by utilizing terminal voltage control when synchronized in parallel to the power system. These machines are typically terminal voltage regulated. In addition, substation on-load tap changer (OLTC) transformers improve system voltage management by controlling variable turn ratios that are adjusted in different levels known as taps along either the primary or secondary winding. Moreover, volt-ampere reactive (VAR) sources of static VAR compensators (SVCs), which are automated impedance devices connected to the AC power network, are designed for voltage regulation and system stabilization. In this paper, scheduling of these machines is coordinated for optimal power system operation (OPSO) using a recent algorithm of social network search optimizer (SNSO). The OPSO is performed by achieving many optimization targets of cost of fuel, power losses, and polluting emissions. The SNS is a recent optimizer that is inspired from users in social networks throughout the different moods of users such as imitation, conversation, disputation, and innovation mood. The SNSO is developed for handling the OPSO problem and applied on an IEEE standardized 57-bus power system and real Egyptian power system of the West Delta area. The developed SNSO is used in various assessments and quantitative analyses with various contemporary techniques. The simulated findings prove the developed SNSO’s solution accuracy and resilience when compared to other relevant techniques in the literature.
1. Introduction
The principal management of alternating current (AC) power systems is often operated by the scheduling of synchronous generator rotary machines and static machines of on-load tap changer (OLTC) transformers and volt-ampere reactive (VAR) sources. When large machines of synchronous generators are paralleled to the utility bus, terminal voltage control can be used to manage them. These machines are typically terminal voltage regulated. In addition, substation on-load tap changer (OLTC) transformers improve system voltage management by controlling variable turn ratios that are adjusted in different levels known as taps along either the primary or secondary winding. Moreover, volt-ampere eactive (VAR) sources of static VAR compensators (SVCs), which are automated impedance devices connected to the AC power network, are designed for voltage regulation and system stabilization [1,2]. Real and reactive power management as a result of the installation of power generation at suitable buses can lead to a significant losses reduction and voltage regulation, especially in congested networks. Integration of renewable energy resources such as wind turbines and photovoltaic solar systems into the electricity network is currently a difficult task [3]. The power grid must fulfill two distinct necessities: maintaining a near real-time balance of generations and demands and adjusting managed machines to regulate active and reactive power flows via transmission network [4]. The electrical demands represent the aggregate of thousands of various consumers’ power needs, extending from individual residences to huge commercial and industrial facilities [5,6].
The optimal power system operation (OPSO) is a non-linear, multi-model technique for power system control and operation. OPSO may be used to develop financial and safe operating conditions for power systems [7]. The OPSO can optimize one or more objectives such as fuel cost, emission of power system sources, and transmission losses [8]. These goals can be met while maintaining power flow balance and operating variables within their respective restrictions, such as voltage limits, line flow limits, valve constraints, and generator power [9].
Miscellaneous conventional mathematic approaches have been proposed to solve the OPSO such as semidefinite programming [10], non-linear programming [11], linear programming (LP) [12], Newton-based approach [13], interior-point methods (IPMs) [14], fuzzy linear programming [15], and sequential unconstrained minimization technique [16], and interior point method [17].
A variety of these methods can effectively enforce inequality constraints and have high convergence properties. However, because they rely on the initial settings, these traditional methods cannot produce the true optimal result and may become stuck in a local minimum. Furthermore, each technique must be represented using a specific variant(s) of OPSO, thus they cannot cope with integer and discrete variables seamlessly. As a result, developing metaheuristic approaches to overcome the aforementioned drawbacks is critical.
The finest solution of the OPSO can be determined by diverse augmentations of the algorithm techniques. An enhanced social spider optimization technique has been proposed, in ref. [18], by varying the movement strategy of male and female spiders to an appropriate ratio, to optimize fuel cost, emission, and losses independently. An enhanced NSGA-III with constraints handling, in environment selection operation and reducing selection efforts, has been illustrated to fuel cost, emission, and losses in [19]. In [20], a multi-objective backtracking search optimizer (MBSO) was demonstrated to formulate and solve the 30-bus, 57-bus, and 118-bus systems with objective functions fuel cost, voltage deviation, and power losses. An enhanced manta ray foraging technique (EMRFT), in ref. [21], has been characterized, in AC meshed power systems, for minimizing fuel cost, emission, and losses (with and without) voltage source converter (VSC) stations.
Experts are looking for ways to replace fossil energies with renewable generation in order to create ecologically friendly and emissions-free communities. In [22], PSO and GWO have been hybridized for solving OPSO issues, and they were combined with probabilistic photovoltaic and wind resources. In this study, wind speed distribution related to the wind turbines was presented through the Weibull probability distribution function [23]. Moreover, the produced power from the solar photovoltaic systems, which can be modeled as single and double-diode models [24,25,26,27], were presented through the lognormal probability distribution function. In [28], the OPSO has been discussed for the AC power flow tool where the DC flow tool has been investigated as well by linearizing the Ac variables in the system. In [29], a multi-period OPSO issue has been formulated considering the penetrations of variable renewable sources with uncertainties due to weather fluctuations.
In [30], an optimal generation scheduling has been presented including different renewable sources of photovoltaic, micro-turbine, wind, fuel cell and batteries. In this study, a beetle antenna search optimization has been employed considering hourly loadings in real time. In [31], the equilibrium optimizer technique (EO) was applied for the OPSO issue incorporating different renewable sources by formulating their uncertainties via probability density functions in order to expect their produced power. In this work, many objective functions were considered and handled using the weight factors. In [32], a technique for effectively distributing various kinds of renewable resources in the distribution network has been developed but the reduction of yearly energy losses has been framed as a single objective optimization framework. In [33], the EO technique was applied for integrating the photovoltaic distributed generations and batteries in distribution systems. In this study, many objective functions were taken into account of improving the reliability, minimizing the investment costs, reducing the power losses, and minimizing the environmental emissions but they were handled in a single objective model.
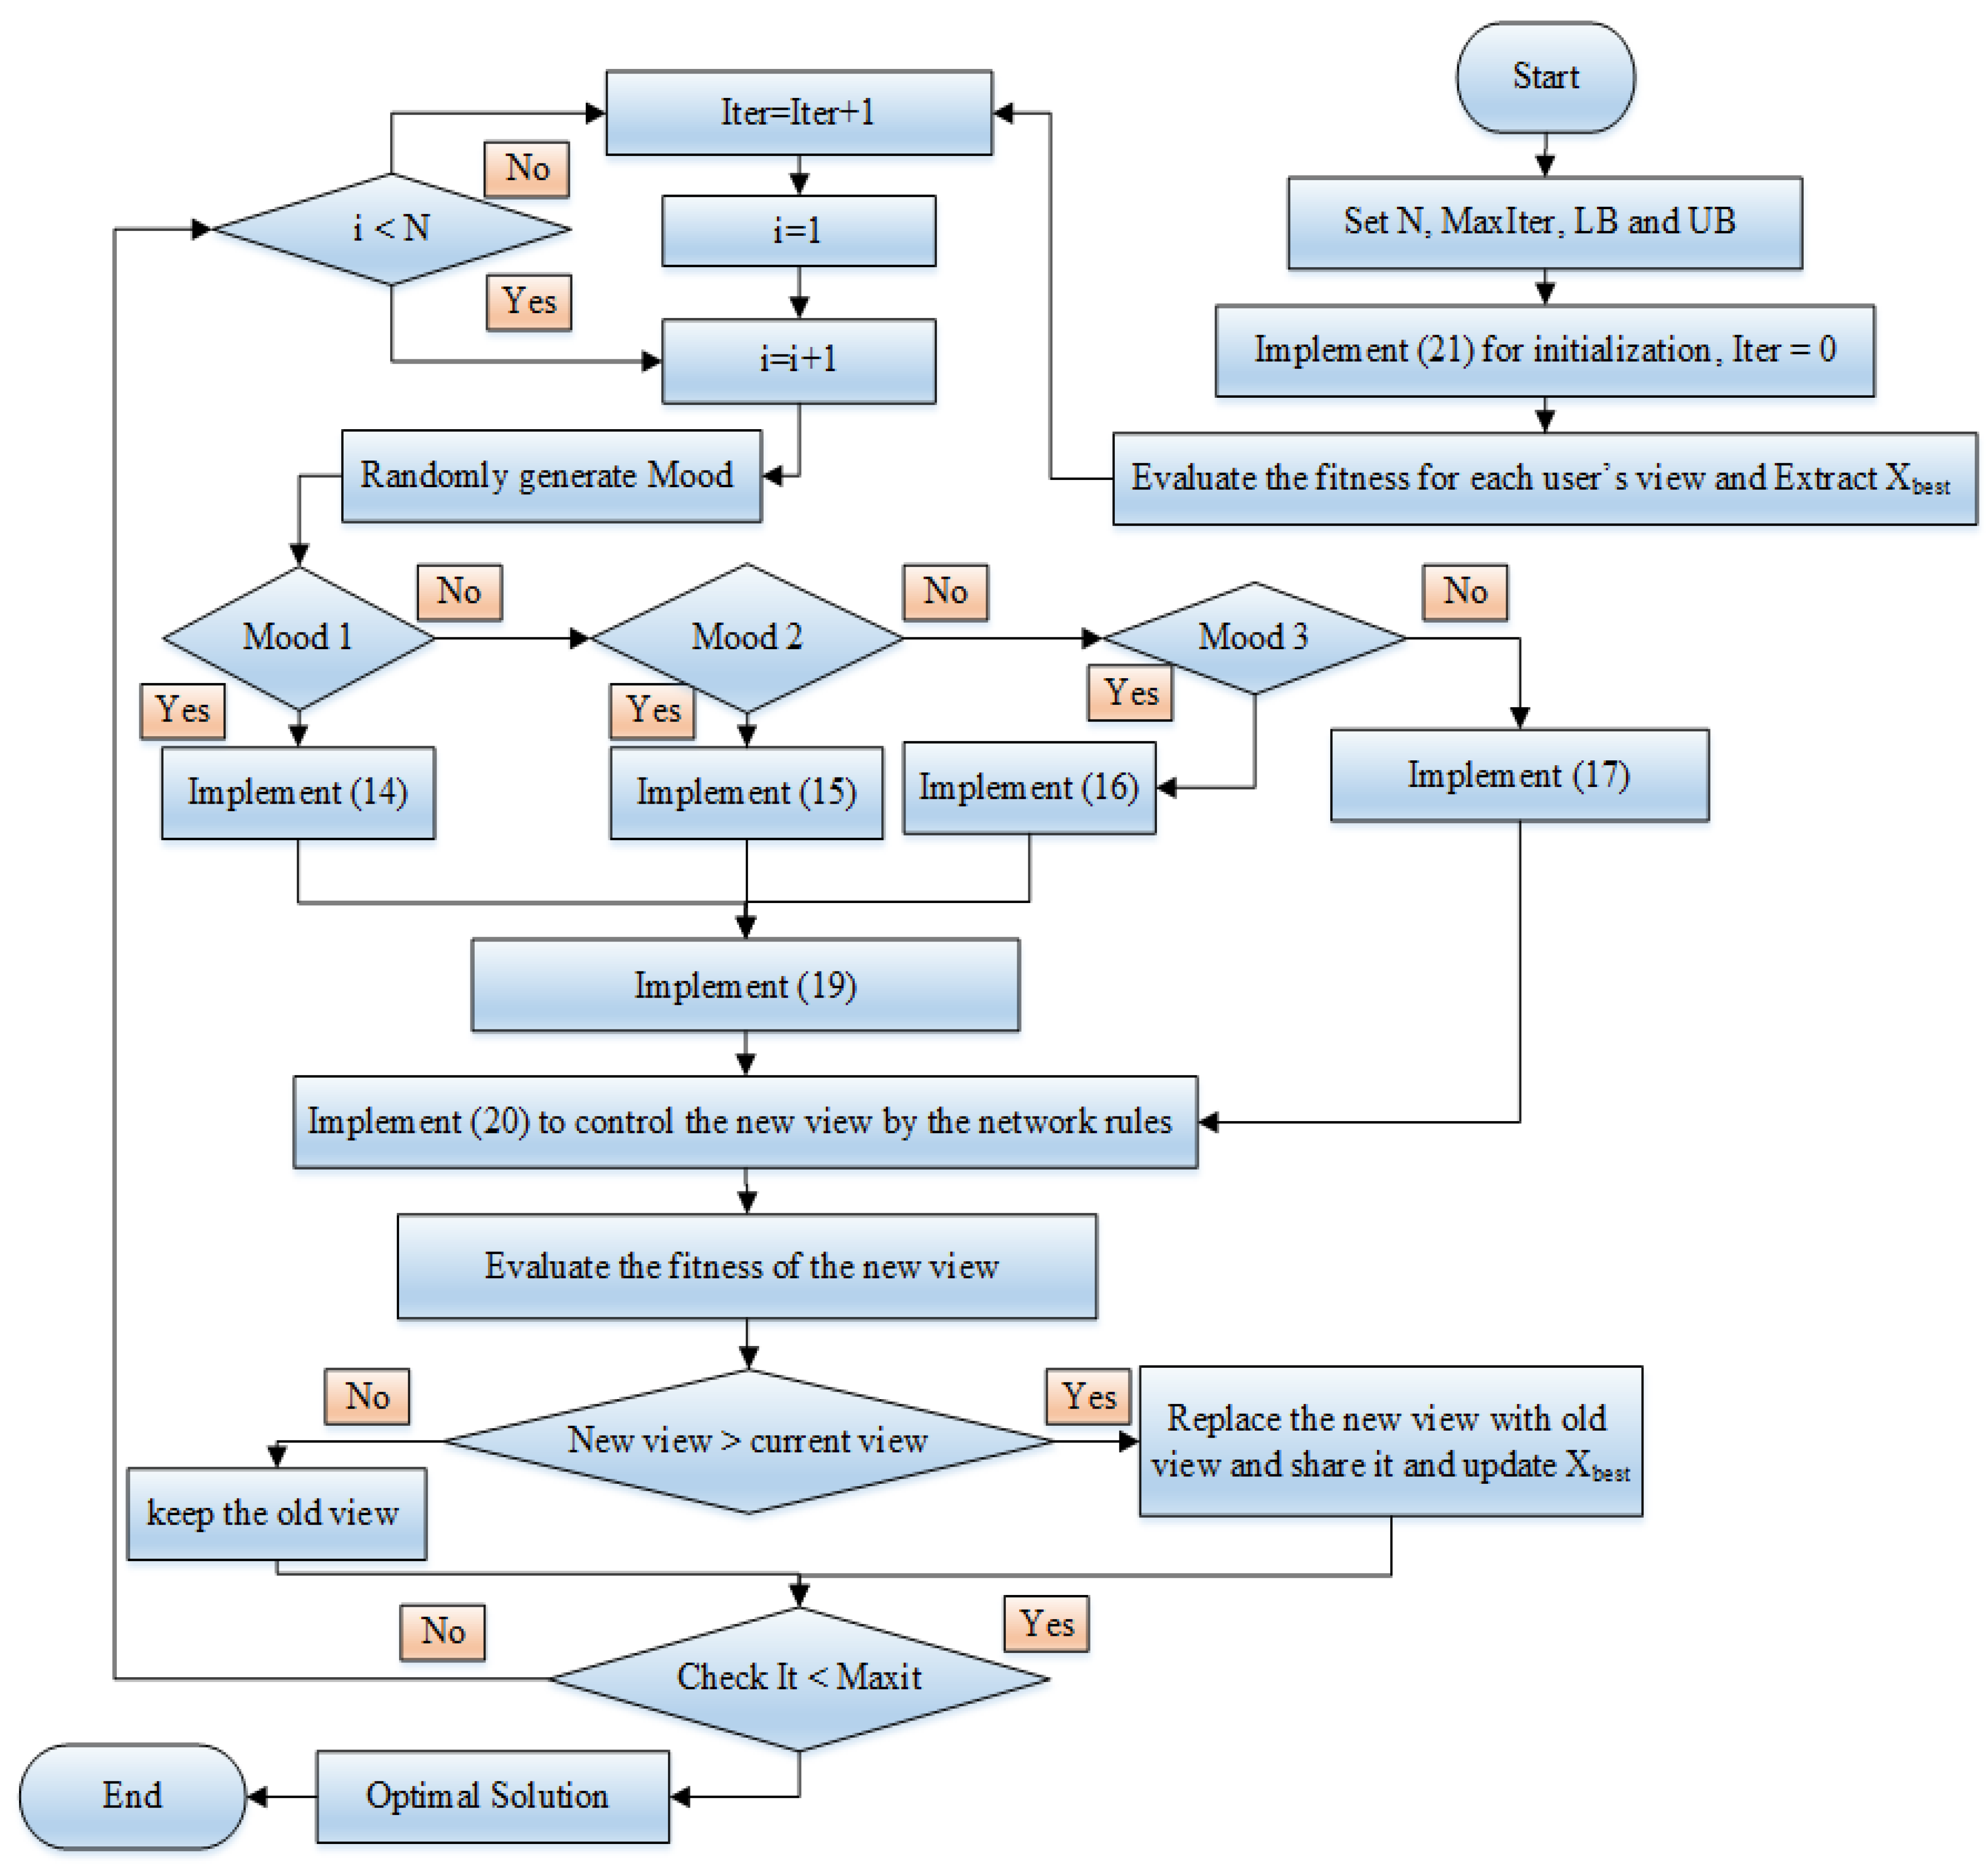
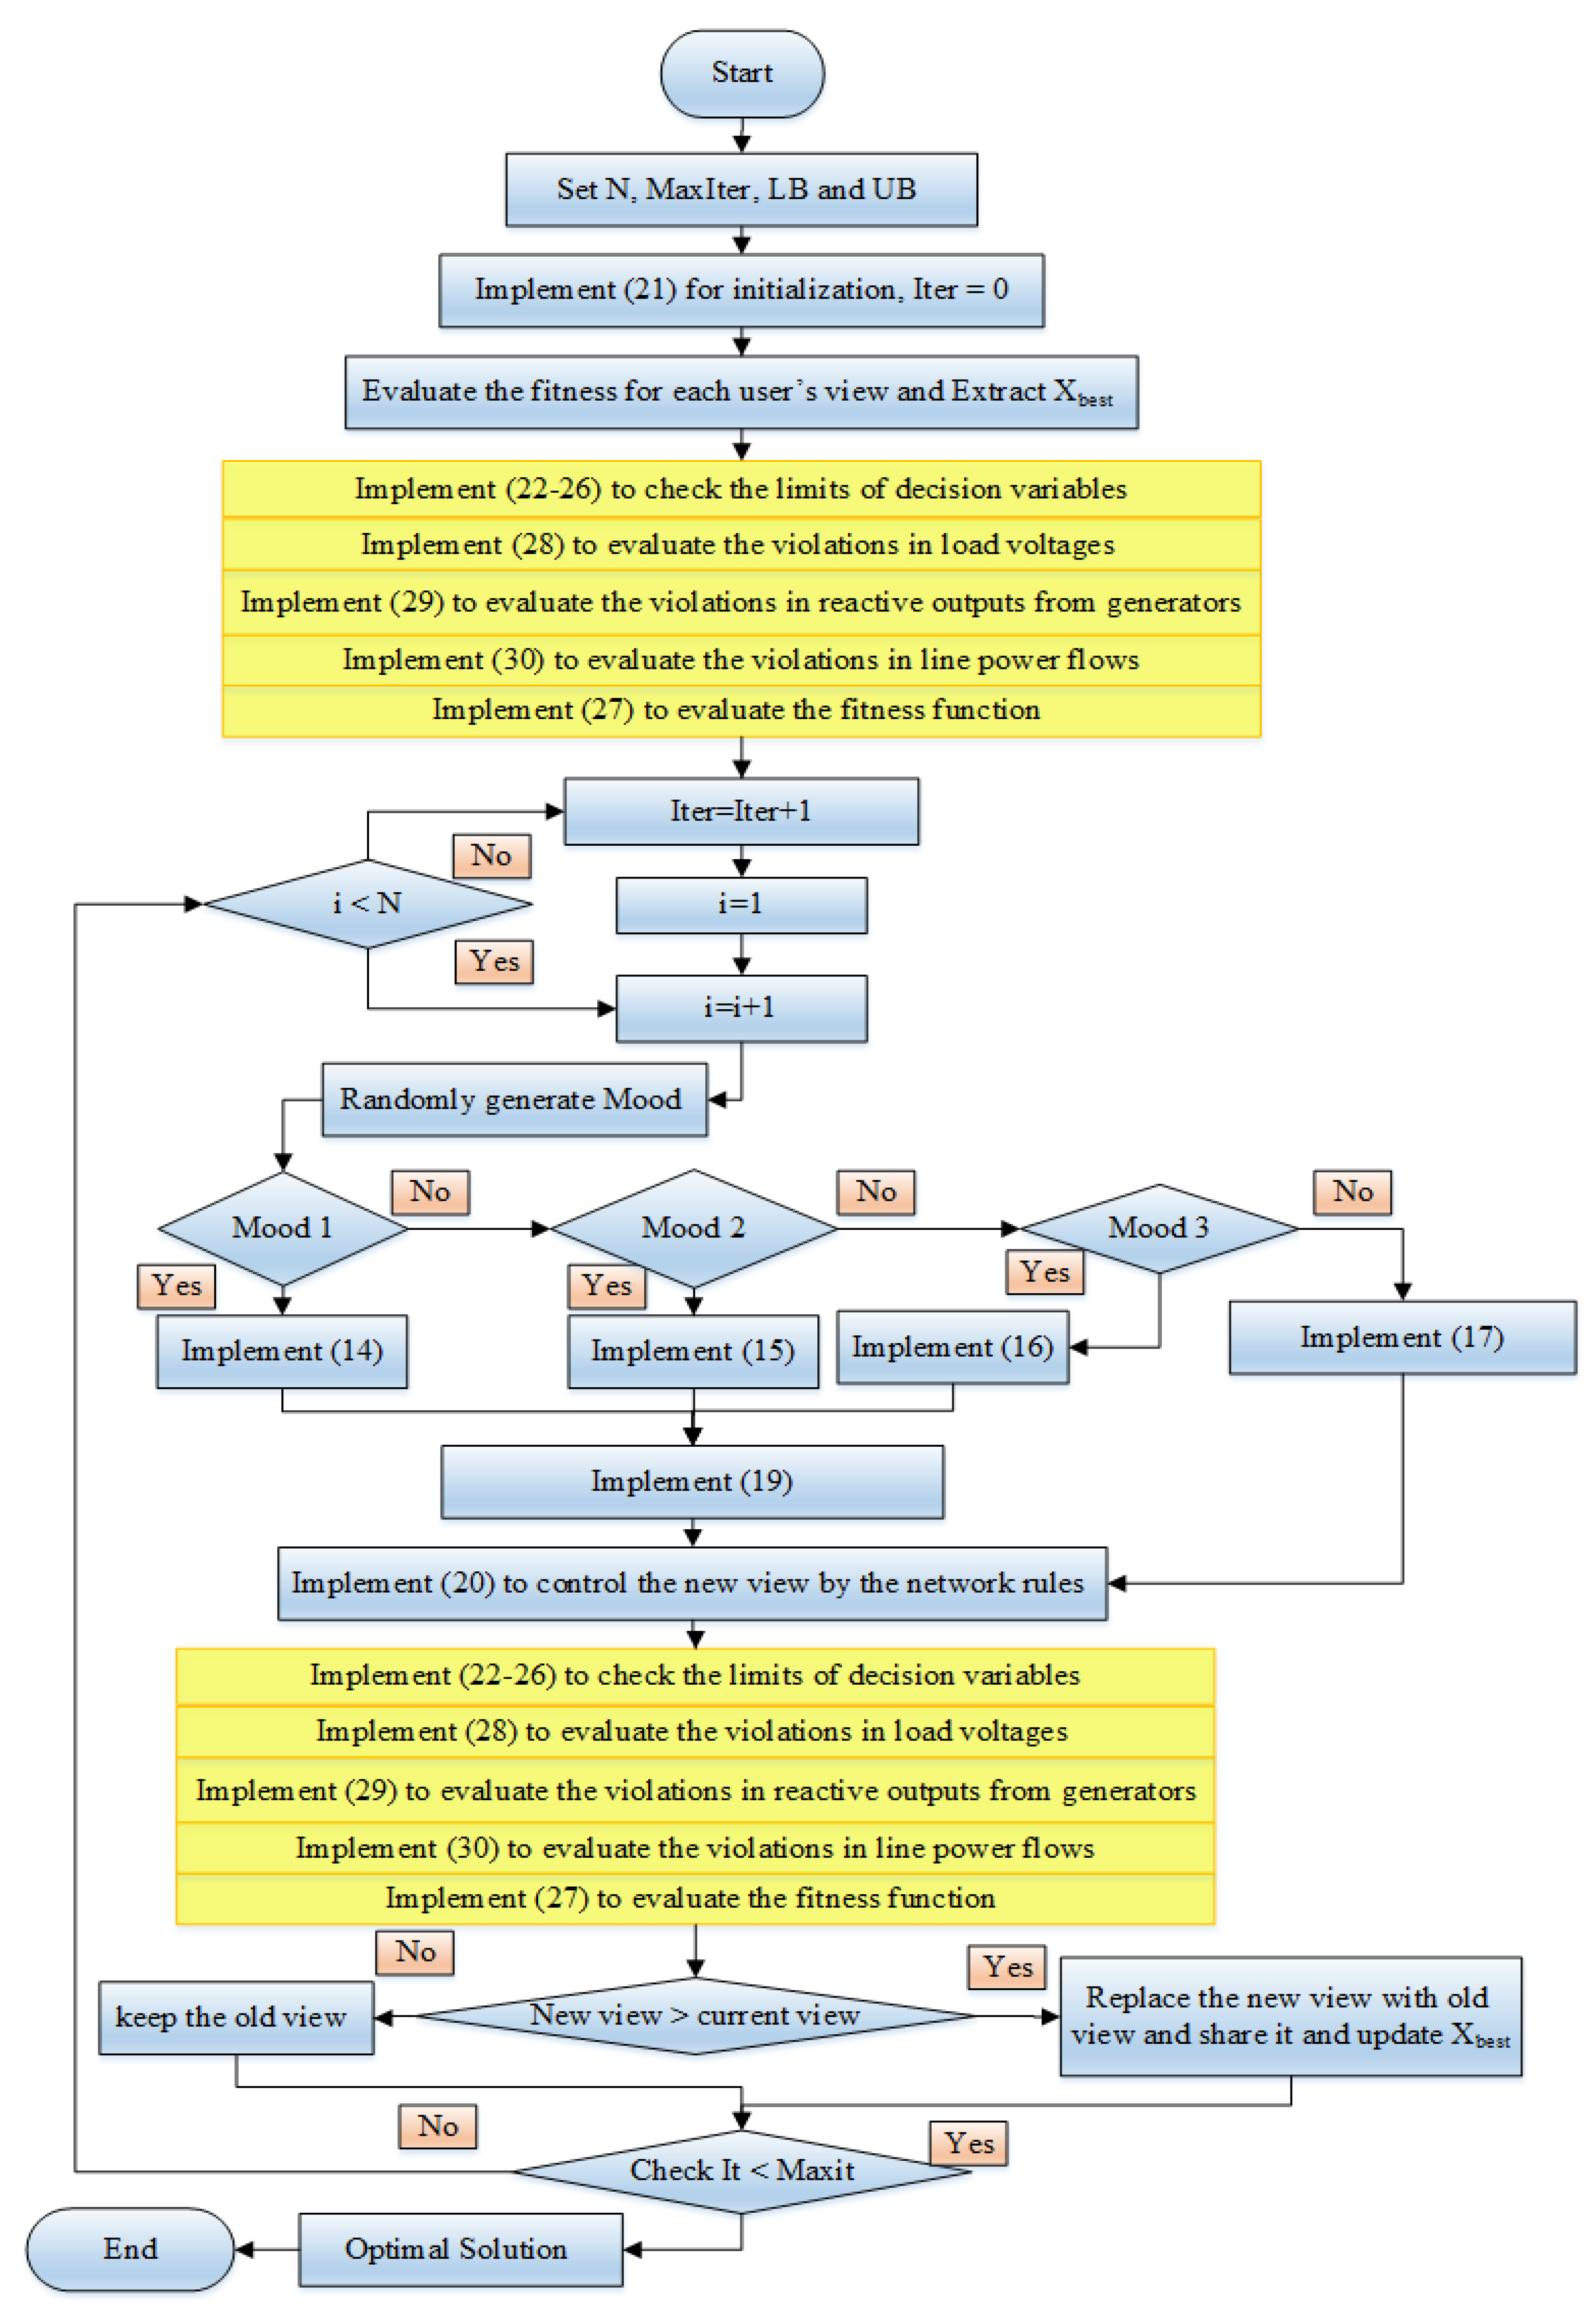
Despite these performed applications for solving the OPSO, the simplifications by ignoring the reactive power injections from capacitive sources and transformer tap settings potentially lead to inaccurate results. In this paper, a scheduling of synchronous generator rotary machines and static machines of on-load tap changer (OLTC) transformers and volt-ampere reactive (VAR) sources is coordinated for optimal power system operation (OPSO) using a recent algorithm of social network search Optimizer (SNSO). The OPSO is performed by achieving many optimization targets of cost of fuel, power losses, and polluting emissions. The SNSO is a recent optimizer that is inspired by users in social networks throughout the different moods of users such as imitation, conversation, disputation, and innovation mood [34]. The SNSO is developed for handling the OPSO problem and applied on an IEEE standardized 57-bus power system and real Egyptian power system of the West Delta area. The developed SNSO is used in various assessments and quantitative analyses with various contemporary techniques. The key contributions of this paper are as follows:
- The developed SNSO has been employed to minimize the objective functions of fuel costs, losses, and emissions in electrical power networks and applied on the standardized network of IEEE 57-bus and a practical Egyptian network of WDA.
- The developed SNSO provides better performance than various recent techniques.
- Significant stability is demonstrated for the developed SNSO for solving the OPSO in electrical power networks.
- A validation assessment is conducted for the rotary and static machines of the IEEE 57-bus and WDA power systems.
- High validation is illustrated based on the SNSO for the optimal scheduling of synchronous generator rotary machines and static machines of on-load tap changer (OLTC) transformers and Volt-Ampere Reactive (VAR) sources.
The remaining sections of this paper are considered as follows: the OPSO formulation is established in Section 2, while the developed SNSO for OPSO is manifested in Section 3. Moreover, the simulation results and discussion are illustrated in Section 4, and conclusion remarks are given in Section 5.
2. Problem Formulation
In OPSO, the independent/decision and the dependent variables are manifested. The active power outputs of the generators and the reactive power injection of switched capacitors and reactors are represented by (Pg1, Pg2, …, PgNg) and (Qc1, Qc2, …, QcNq), respectively. The generator voltages and the transformer tap settings are denoted by (Vg1, Vg2, …, VgNg) and (Tap1, Tap2, ……, TapNt), respectively, Where the number of generators, the number of on-load tap changing transformers, and the number of the VAR sources are demonstrated, respectively, by Ng, Nt, and Nq. The dependent variables include load bus voltage magnitudes, generator reactive power outputs of the generators and transmission line loadings, which are demonstrated by (VL1, …, VLNPQ), (Qg1, Qg2, …, QgNg), and (SF1, …, SFNF), Where the number of load buses and the transmission lines are illustrated by NPQ and NF, respectively. This issue can be formulated mathematically as follows:
where F illustrates the considered vector of diverse m objectives; u and v are the decision and the dependent variables, respectively.
2.1. Problem Objectives
The first objective is the fuel generation costs (OV1) in USD/h as depicted in (2):
where Pgi refers to the active output power in MW of each generator i; ai, bi, and ci represent the relevant cost coefficients of each generator i.
The second objective function includes the total ton/h emissions (OV2) of the atmospheric pollutants which are expressed as in Equation (3):
where and denote the atmospheric pollutants emission coefficients of generator i.
The third objective involves minimizing the total power losses of the transmission network as expressed [35]:
where Gij is the conductance of each line between bus i and j; Nb is the total number of buses; V indicates voltage and θ refers to the phase angle.
2.2. System Constraints
The equality constraints are manifested by the load flow balance equations as depicted in the following equation:
where PL and QL indicate both the active and reactive power demand, respectively. Moreover, Gij and Bij define the mutual conductance and susceptance between bus i and j, respectively.
Furthermore, the operational variables and their corresponding constraints, denoted by the superscripts “min” and “max” limits, are formulated as follows:
where Sf is the transmission line flows in line f; VLi is the voltage of load bus i; NPQ and Nf are the total number of load buses and system lines, respectively.
3. Developed SNSO for OPSO in Power Systems
3.1. SNSO
Individuals in social networking sites drive the social network search optimizer (SNSO), which seeks to be appealing across different user moods such as imitation, conversation, disputation, and innovation [34]. These moods are methods for expressing people’s fresh thoughts on a new occurrence. Other users’ points of view are appealing in the imitation mood, and users commonly strive to imitate one another in expressing their ideas. Users with the conversation mood can communicate with one another and benefit from one another’s viewpoints. Others in a dispute mood can engage in a debate with a group of people and discuss their points of view. Users in the innovation mood post a topic on social media, usually based on their new opinions and experiences. The mathematical modeling and explanation of these (moods) are shown below:
3.1.1. Imitations
If a new event with an exciting concept is launched in this mood, users may try to imitate the renowned individuals who share their thoughts by writing a conversation about this event. This mental state can be represented quantitatively as follows:
where exemplifies the vector, which is selected randomly, of the jth user’s view (position) and the vector of the ith user’s view, respectively, and i ≠ j. In addition to this, the two terms rand (0, 1) and rand (−1, 1) indicate two random vectors in intervals [0, 1] and [−1, 1], respectively.
3.1.2. Conversations
People in this mood can improve their understanding of an event by learning from one another and exploring ideas about the event from many viewpoints, helping them to develop a fresh perspective on the event. This mental state can be represented quantitatively as follows:
where k illustrates the vector of the issue which is randomly selected to speak about it. Moreover, R represents the impact of chat. This impact depends on the opinions’ differences and characterizes the change in their views about the event (Xk), while D illustrates the difference among the beliefs of users. In addition, Xj displays the vector of a randomly selected user’s belief for a talk and Xi displays the vector of view of the ith user and i ≠ j ≠ k. Additionally, the term (sign) illustrates the sign function, while the term (sign(fi-fj)) establishes a comparison between fi and fj which illustrates the moving direction of Xk.
It can be noted that the user’s viewpoint about the event changes because of conversations with the jth user, where the developed opinion represents a new belief to share with others. Adjusting the user’s belief about the events is considered as the replacement of the events.
3.1.3. Disputations
In this mood, people can defend their ideas by describing them in comments or establishing groups’ sections; nevertheless, they can be influenced by other commentators or members of a virtual group that has been formed to discuss a point of view on a certain issue. The new impacted view can be expressed mathematically as follows:
where M represents the mean of views of friends in the group or commenters, while the term (AF) expresses the Admission Factor that illustrates the assertion from users on their opinion in discussions and represented as an integer number of 1 or 2. The symbol (round) rounds the real input to the adjacent integer number, whereas the symbol (Nr) represents the group size or commenters and represents a random number between 1 and Nuser (the number of users of the network).
3.1.4. Innovations
Users can express their own opinions and feelings regarding a certain event in unique and inventive ways while in this mindset. As a result, a new concept will be generated, and the new impacted viewpoint may be mathematically expressed as follows:
where the symbol (d) illustrates the dth variable in the interval [1,D] which is selected randomly, and (D) manifests the problem variables’ number, whereas the two variables (rand1) and (rand2) are random numbers with interval of [0, 1]. In addition to that, ubd and lbd are upper and lower values of the dth variable, whilst signifies the new thought about the dth dimension of the problem. The variable characterizes the existing thought about dth variable produced by another user jth user () and ith user requires to adjust it due to new thought (). As a result, the new view about the dth dimension will be established. is an interpolation about the existing thought () and the new thought ().
As a result, a change in one dimension () creates a general shift in the fundamental notion and may be seen as a new point of view to be conveyed. As a result, this process may be mathematically expressed as follows:
It is illustrated that Xi,new elaborates a new perception into the event in accordance with the dth viewpoint and substituted with the existing view as depicted in Equation (18).
3.1.5. Rules Related to Network
Each social network defines a set of roles for its users, and these roles are regarded by all users in shared perspectives. The following factors are used to limit the users’ perspectives:
where xi manifests the ith variable of (new idea) Xinew, while LBi and ubi depicts the ith component of UB and LB of problem.
3.1.6. Rules for Publishing
The method of this algorithm is produced by various moods, where each user’s viewpoint is altered, and fresh views are utilized based on their merit. To demonstrate, if the new idea is superior to the existing one, it will be approved. As a result, the value of a new concept may be determined by the objective function of Xi,new, which can be calculated analytically and compared to the value of an existing thought (Xi) as follows:
To execute the method, the maximum number of iterations (MaxIter), the number of users (N), and variable limitations must be manifested, where the starting view for each user may be determined as in Equation (21):
where Xo illustrates the primitive view vector for each user, whilst UB and LB represent upper and lower vectors of the variables, respectively. Later, the objective function for each user’s viewpoints is computed. Figure 1 describes the main steps of the SNST. From that figure, the random process governs the selection of one mood from the imitations, conversations, disputations, and innovations modes that are described in Equations (14)–(17), respectively. In these moods, there is no specified parameters are used as elements of the vectors described but they are randomly created and updated. its random updating mechanism shows further advantage since the SNSO algorithm isn’t dependent on specified parameters which makes it very sensitive to its choices.
Figure 1.
SNSO Flowchart.
3.2. Developed SNSO for OPSO
When dealing with the previously described OPSO challenge, the equality and inequality requirements are taken into account. The Newton–Raphson (NR) technique is used to fulfill the equality criteria that characterize load flow balancing equations. The NR technique maintains the balancing requirements of (5) and (6) because it describes the service’s steady-state for power network engineers, it is included in this section. As a result, the NR approach exemplifies an important platform for showing three-phase circuits and is employed by MATPOWER [36]. Two operational constraints reflect any other of the constraints, that are decision and dependent variable constraints.
3.2.1. SNSO Development for Including Opertaional Limits of Decision Variables
The first category (decision variables) continues to achieve their limits, and if either of them exceeds assessments, they are randomly recreated within the suitable bounds. Therefore, Equations (7)–(11) can be re-formulated as follows:
3.2.2. SNSO Development for Including Opertaional Limits of Dependent Variables
Furthermore, the targeted cost function extends and penalizes the constraints of the second category (dependent variables). As a result, if the solution related to the view of users violates any of the corresponding limitations, it will be rejected in the following iteration. The considered objective goal (OJ) can be defined using these principles:
whereas, ΔVL, ΔQG, and ΔSF are represented as:
where OJi refers to each objective goal of the m goals; Penv, Penq and Penf, are the penalty factors for the violations in load voltages, reactive outputs from generators and line power flows. Figure 2 describes the main steps of the developed solution based SNSO for OPSO in electrical power systems.
Figure 2.
SNSO for solving the OPSO in electrical power systems.
4. Simulation Results
The designed SNSO is employed on two test power systems. The first is a typical IEEE 57-bus power system, and the second is an actual Egyptian power system known as the West Delta area (WDA) power system. Thirty simulated tests are performed for the created SNSO, with a maximum iteration of 300 and a user view of 25 members. As previously stated, the initial power system consists of 57 buses, 80 lines, 17 on-load tap changing transformers, 7 generators on buses 1, 2, 3, 6, 8, 9, and 12, and three capacitive sources on buses 18, 25, and 53. The statistics for buses, the minimum and maximum reactive power generation limitations, and transmission lines are extracted from [37]. Table 1 illustrates the cost and emission coefficients for IEEE 57-bus power system.
Table 1.
Cost and emission coefficients for IEEE 57-bus power system [36].
The configuration of the real power system, which includes 52 buses [15]. Data of lines and buses are gathered from [38,39]. The maximum and minimum generator voltages are 1.06 and 0.94 p.u., respectively. MatlabR2017b is used to run the simulations, which are run on a CPU (2.5 GHz) Intel(R)-Core (TM) i7-7200U with 8 GB of RAM.
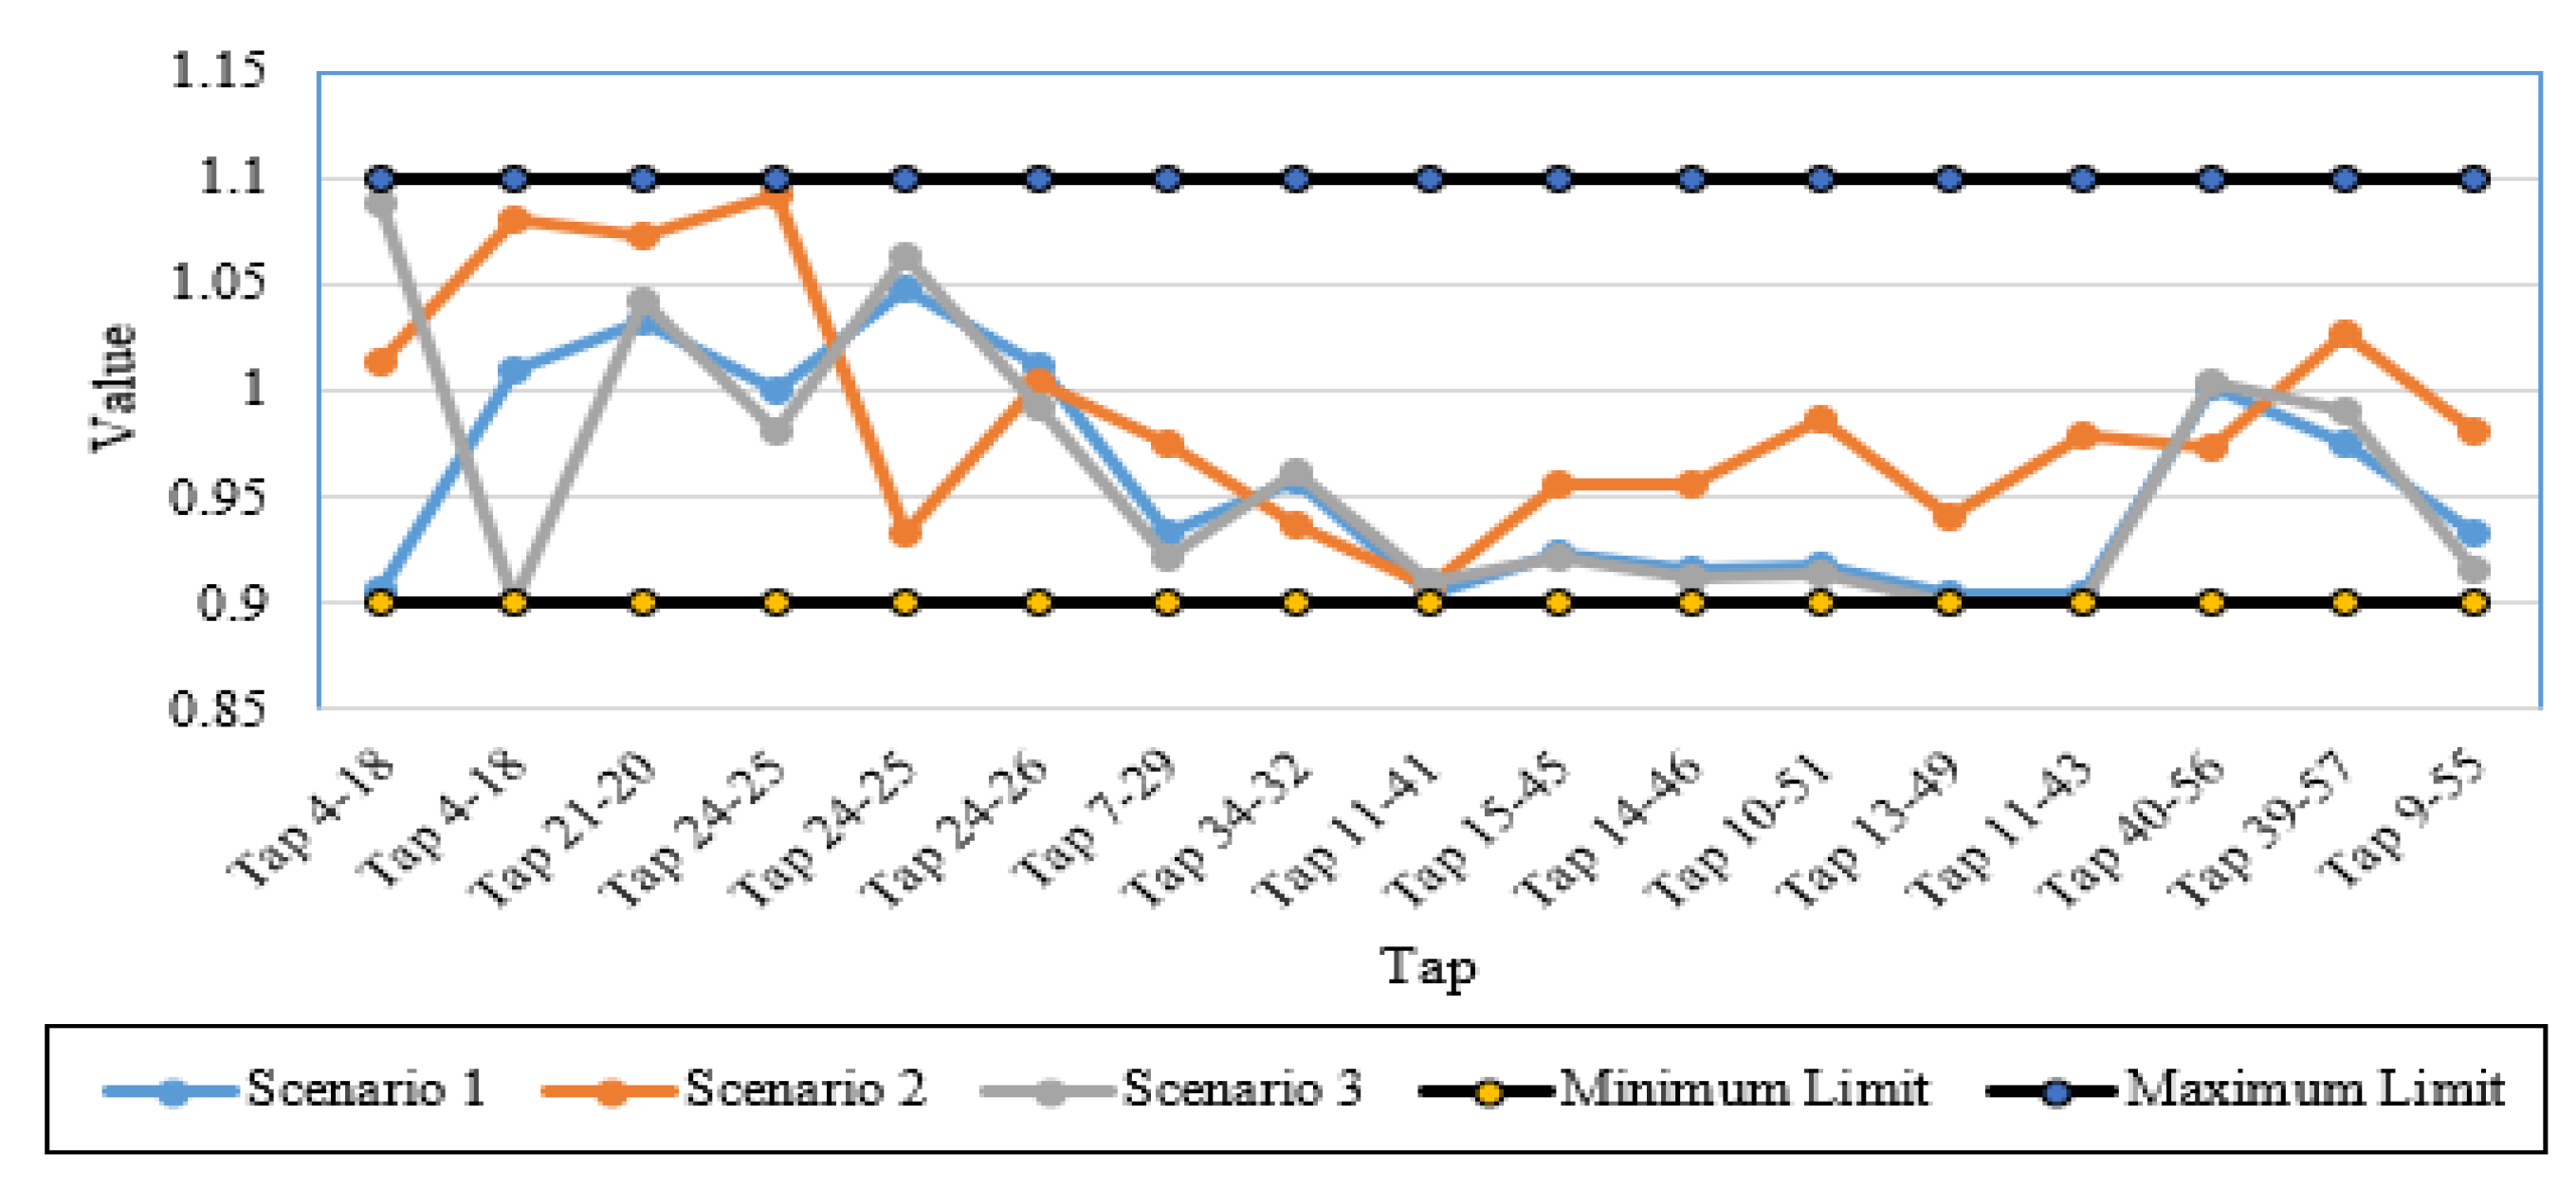
A tap changer mechanism (TCM) is a device in transformers that enables the selection of varied turn ratios in discrete stages. This is accomplished by connection to a series of entry points termed as taps located along the secondary or primary windings. TCMs come in two major kinds on-load and on-load mechanisms. The first TCM must be turned off first before the turns ratio is altered while the second one may change the ratio while servicing. The selection of tap points can be performed automatically, as is typically the case with on-load TCM, or manually, as no-load TCM. TCMs are commonly mounted on the side of high-voltage windings in power systems for the convenience of accessing and to decrease the current burden while servicing. A TCM controls the turn ratio in discrete steps. It operates with some steps in the positive and negative direction that provides ±10% turn ratio variation. Therefore, the maximum and minimum limits of the tap settings are 1.1 and 0.90 p.u., accordingly.
4.1. The First System Results
The following three scenarios are investigated as follows:
- Scenario 1: OV1 Minimization of Fuel Generation Costs (FGC) that manifested in Equation (2)
- Scenario 2: OV2 Minimization of Produced Emissions (PE) that manifested in Equation (3)
- Scenario 3: OV3 Minimization of Overall Power Loss (OPL) that manifested in Equation (4)
4.1.1. FGCs Minimizing (Scenario 1)
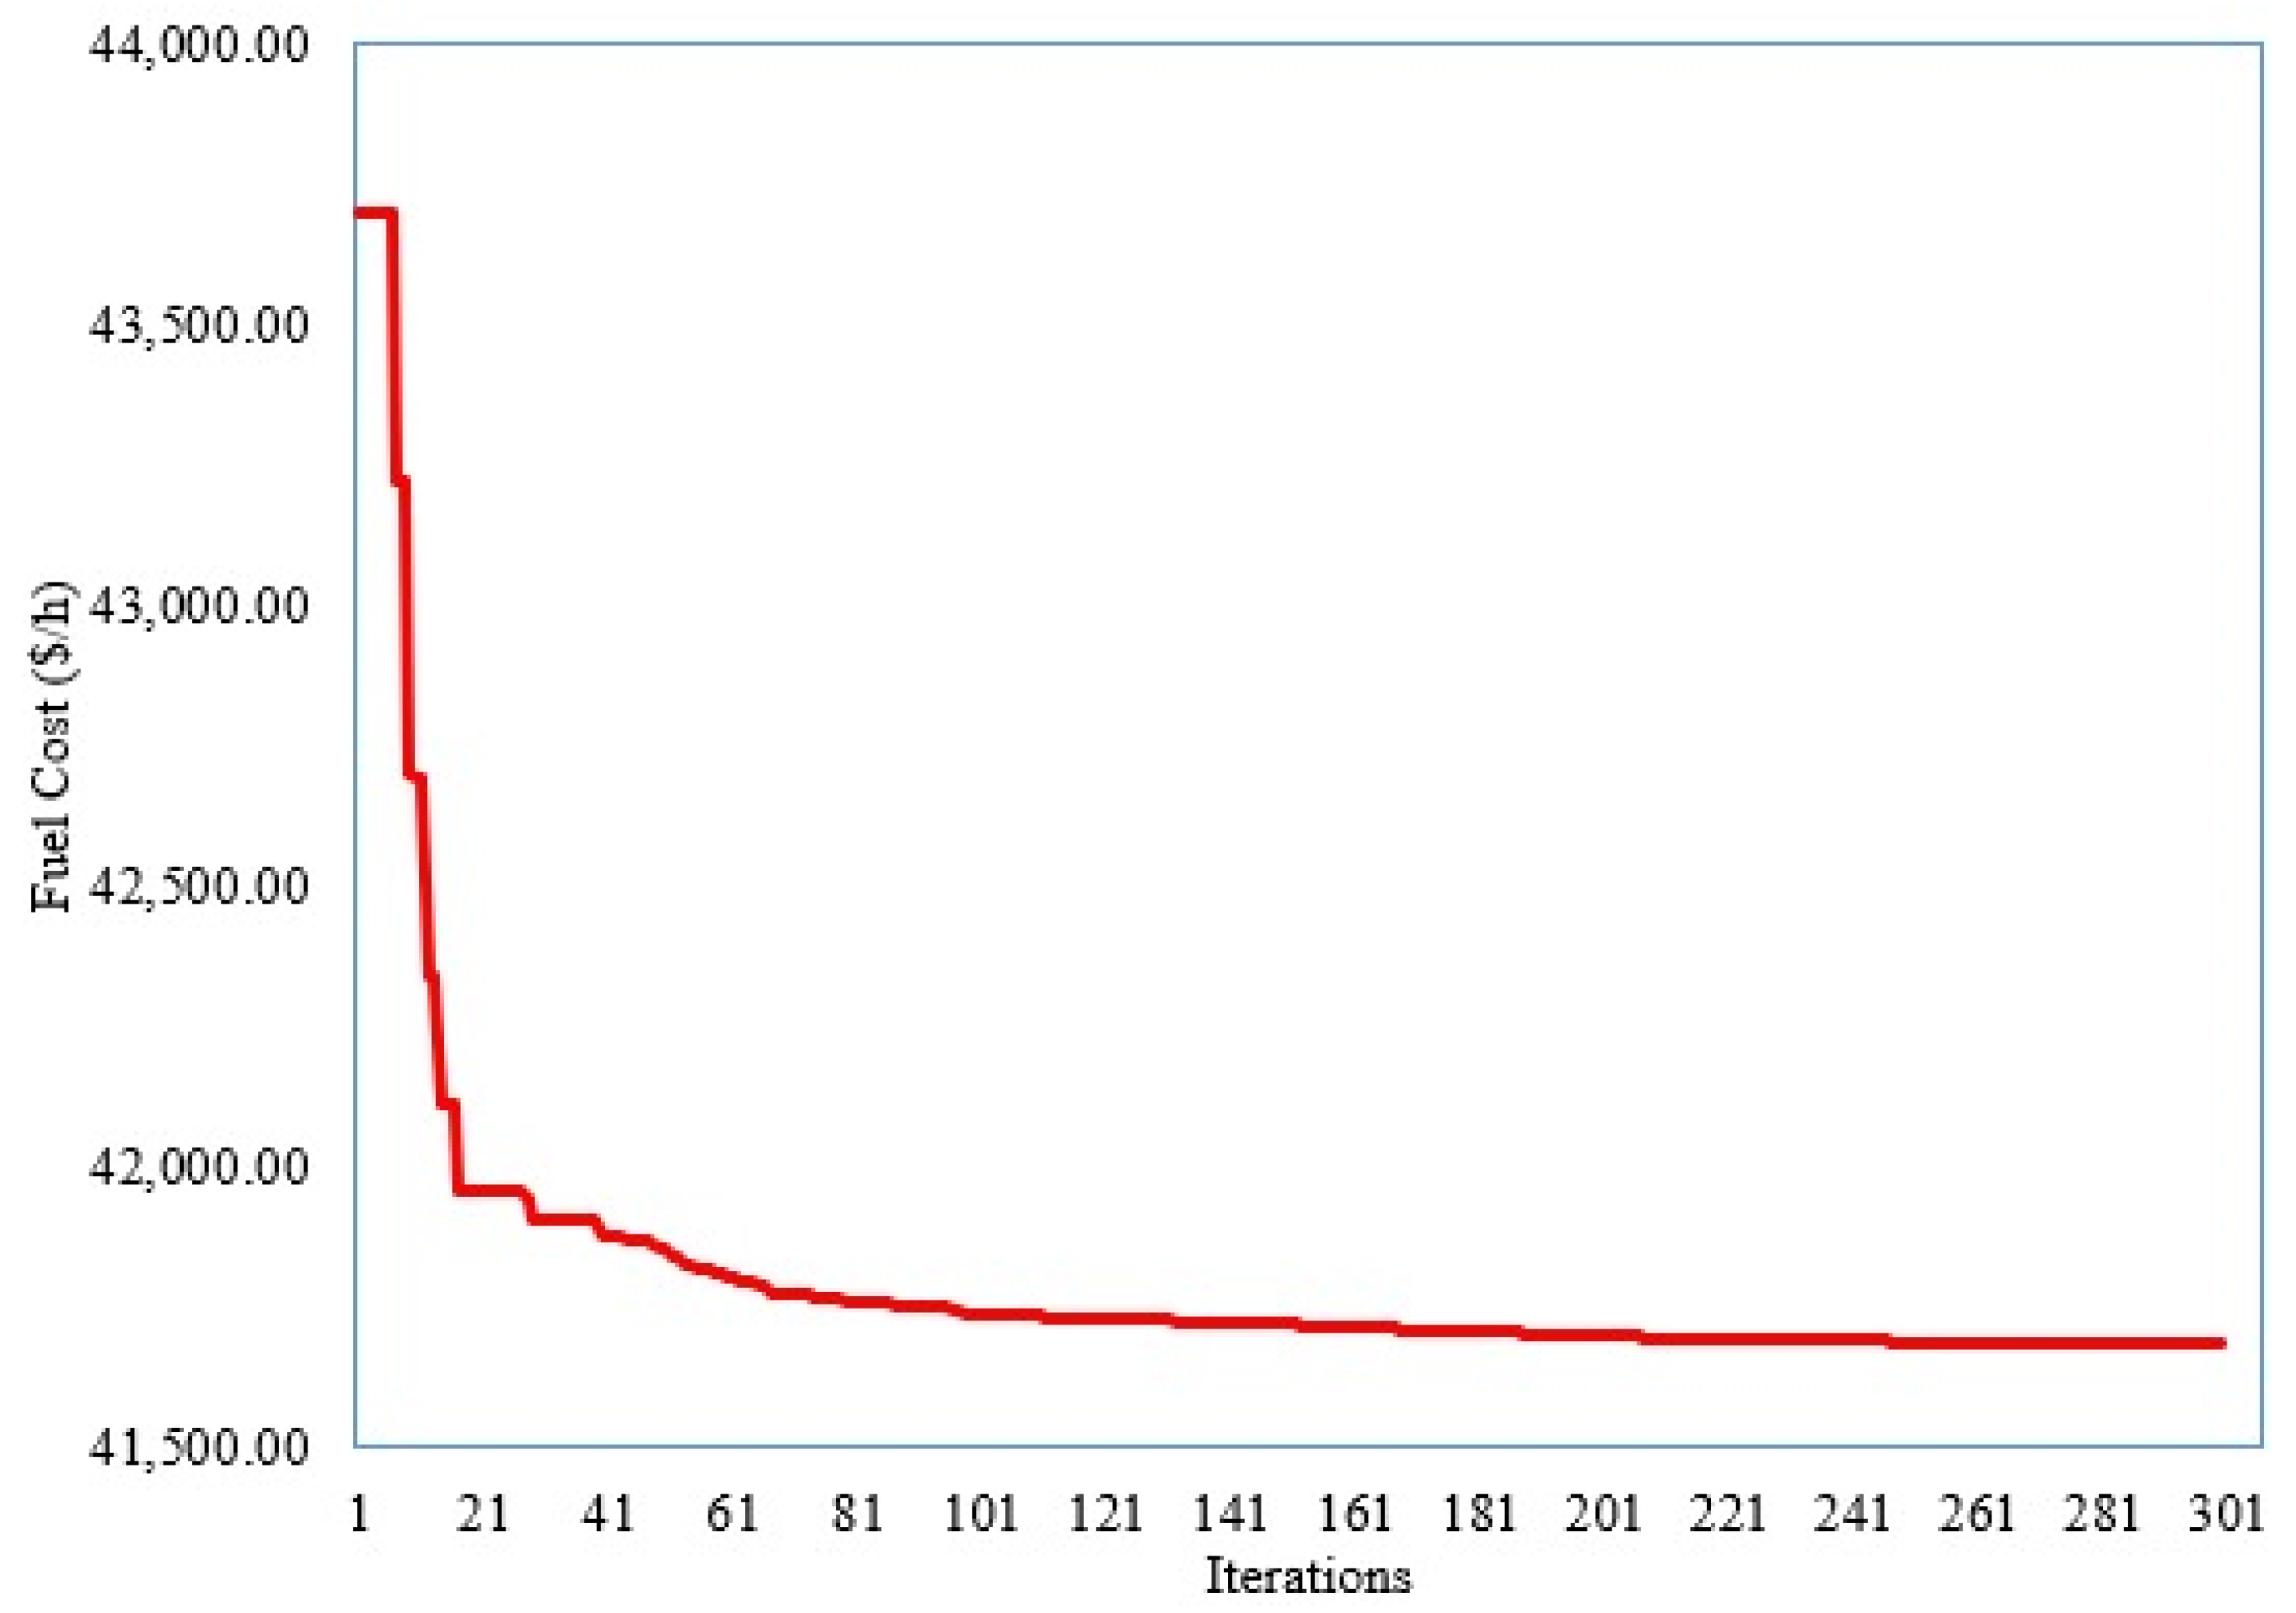
For this scenario, the developed SNSO is applied, where their obtained outputs are recorded in Table 2. Added to that, Figure 3 illustrates the convergence feature of the developed SNSO for Scenario 1. As shown, the developed SNSO minimizes from 41,685.5 USD/h at the initial scenario to 51,345 USD/h. This reduction represents a percentage of 18.81%.
Table 2.
Optimal results using the developed SNSO for Scenario 1.
Figure 3.
Convergence feature of developed SNSO for Scenario 1.
Table 3 further compares the outcomes of minimizing the FGCs (Scenario 1) with numerous alternative techniques which are real coded biogeography-based optimization [40], social spider optimization [18], enhanced social spider optimization [18], salp swarm optimizer [41], bat Search algorithm [42], electromagnetic field optimization [43], modified imperialist competitive algorithm [44], improved salp swarm optimizer [45], genetic algorithm [19], improved genetic algorithm [19] and differential search algorithm [46]. As shown, the developed SNSO demonstrates the best performance over the others since it obtains the minimum FGCs of 41,685.5 USD/h among other techniques. The whole solutions of the developed SNSO algorithm, enhanced social spider optimizer [18], improved salp swarm optimizer [45], salp swarm optimizer [41], and sli me mould algorithm [47] are revealed in 
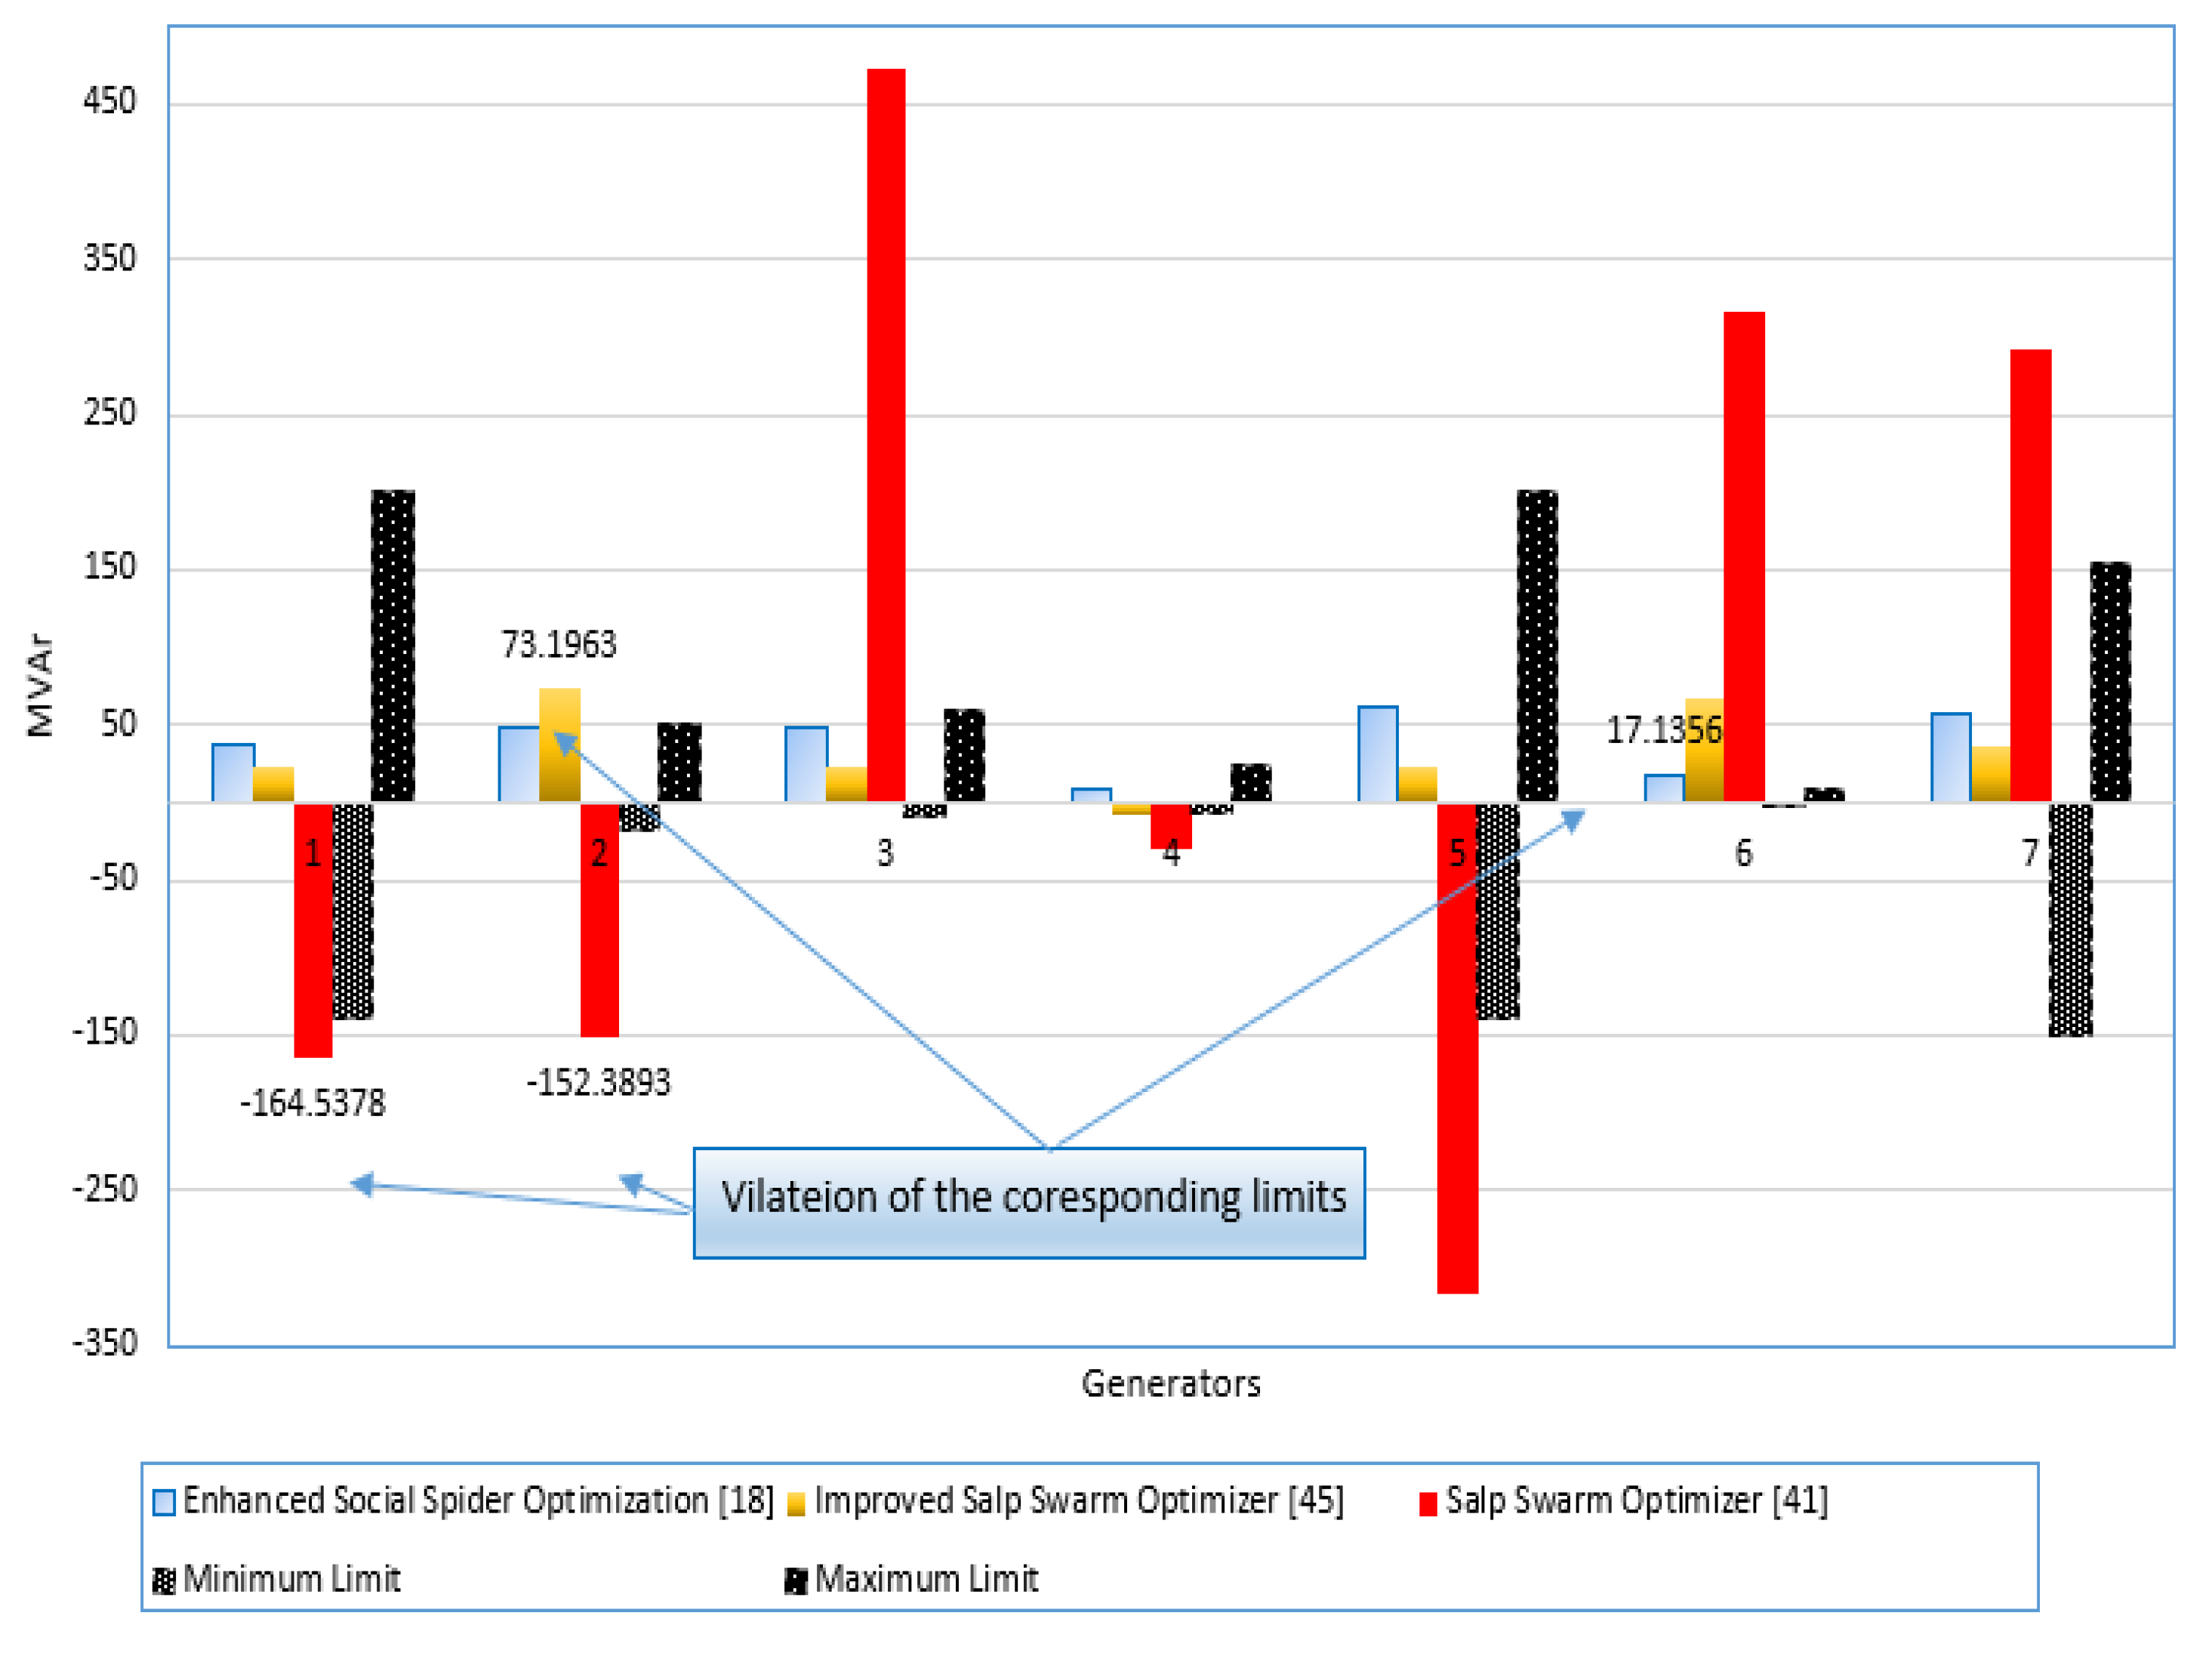
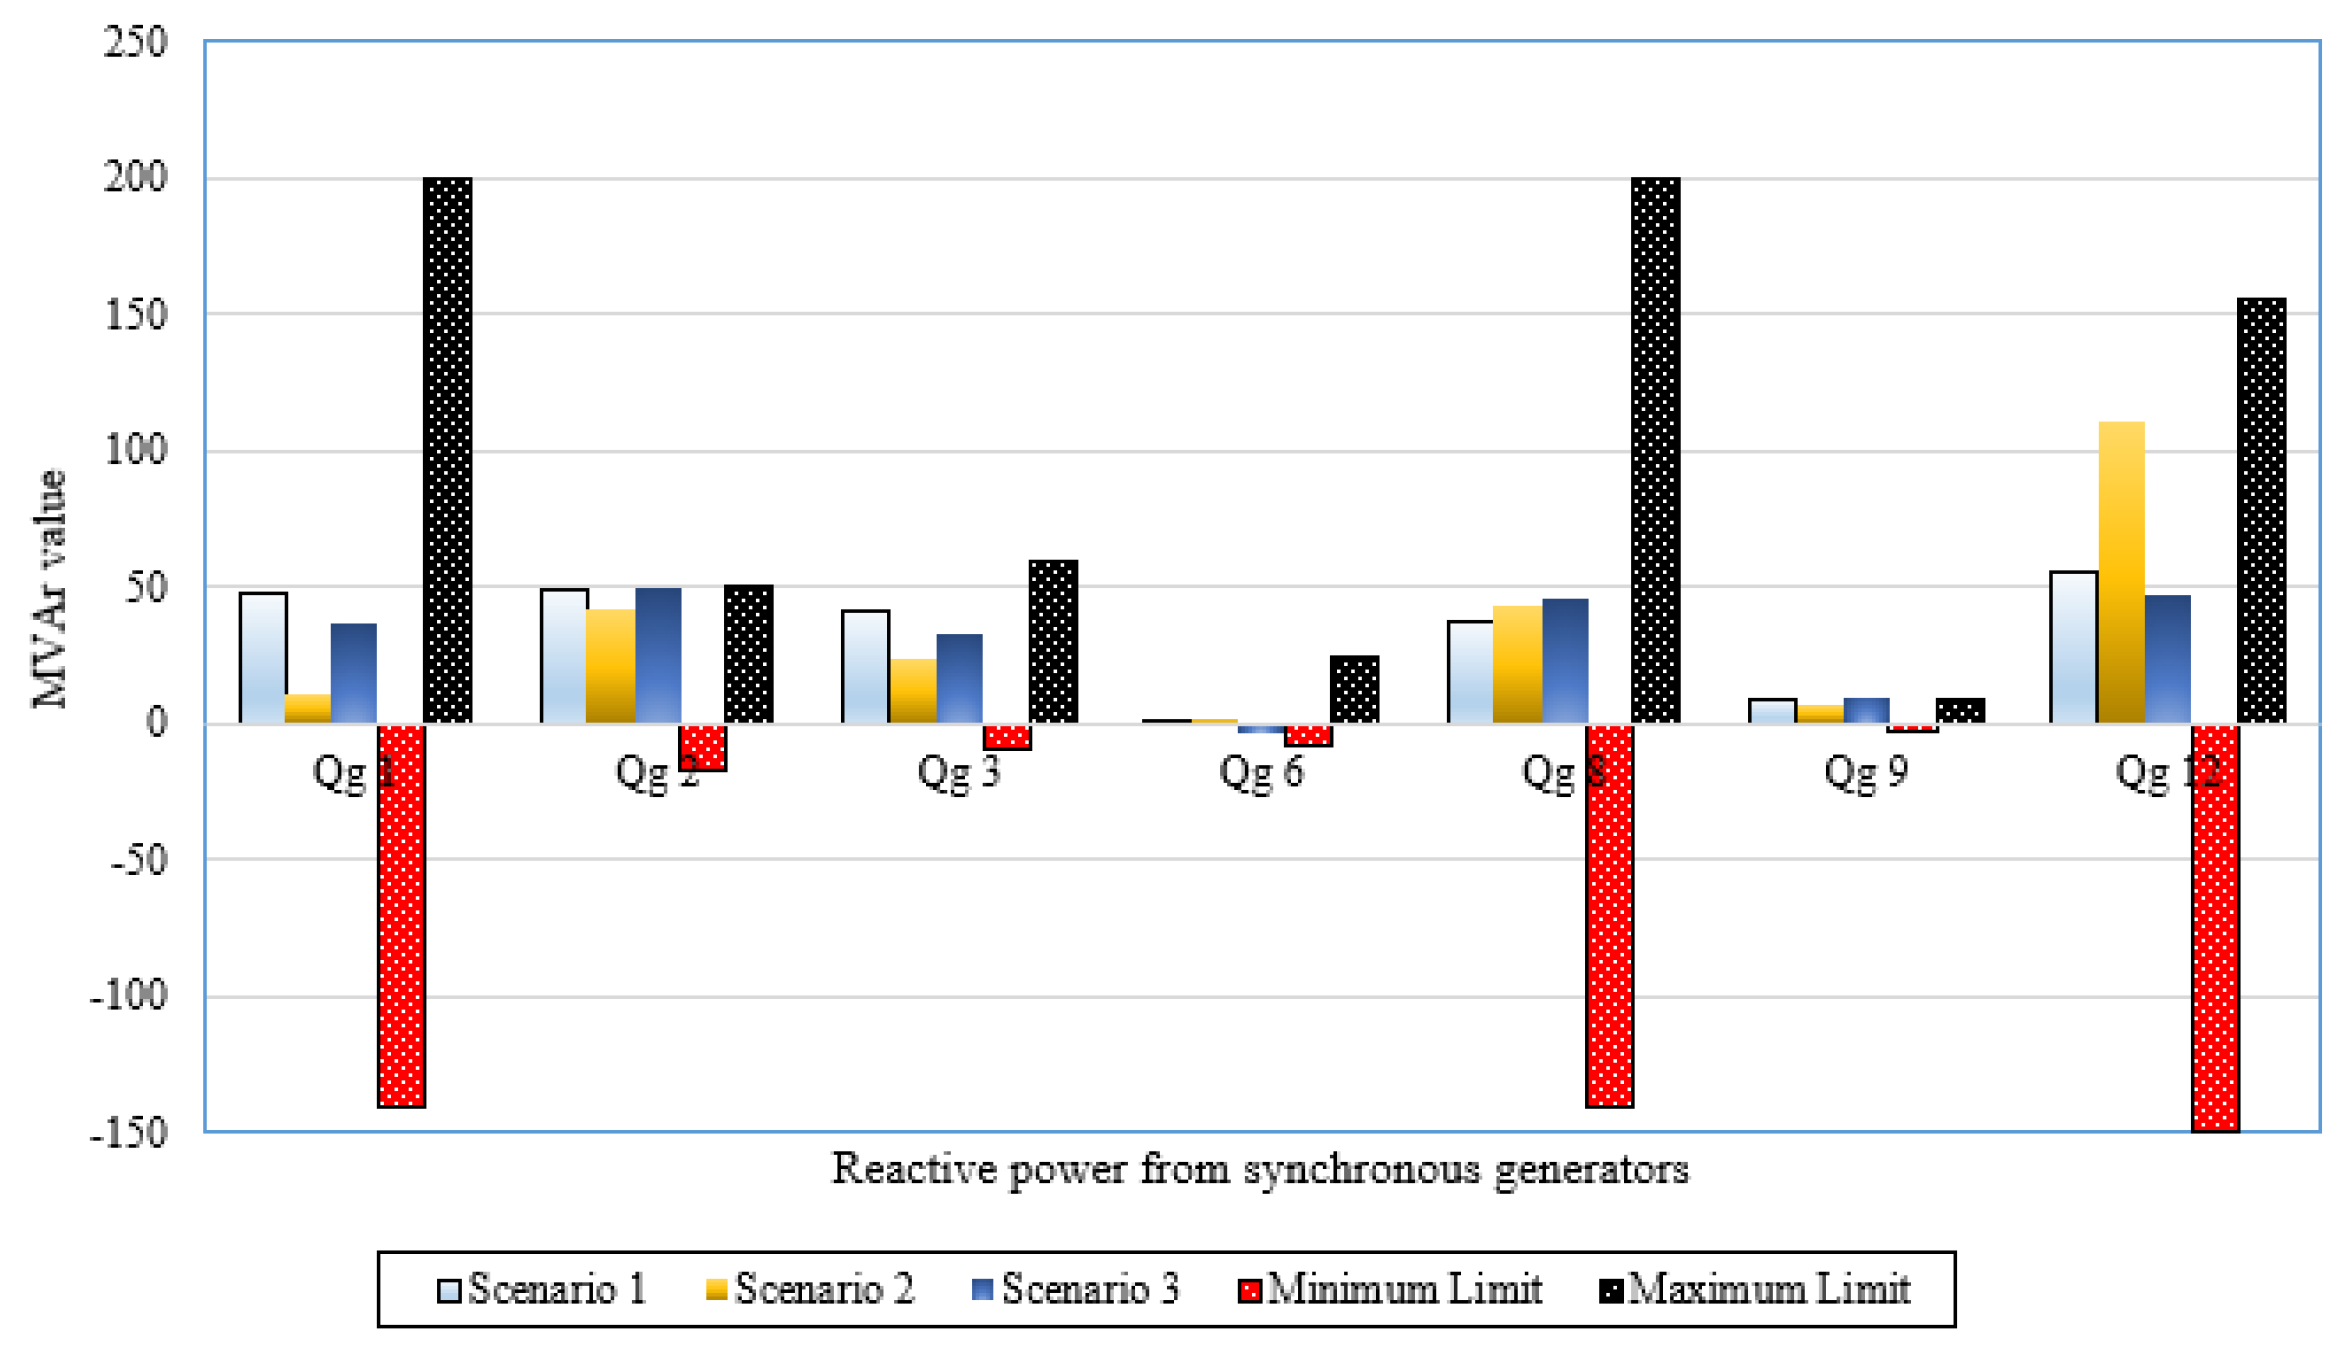
Table 2. The solutions are analyzed and by checking their performance, Figure 4 describes the inequality constraints related to MVAr outputs of the generators. Despite the better performance of the developed SNSO, some techniques provide lesser FGCs values. Enhanced social spider optimization [18], salp swarm optimizer [41] and improved salp swarm optimizer [45] achieved FGCs of 41,665.540, 41,672.3, and 41,675.02 USD/h. This figure demonstrates that some violations of the inequality constraints related to MVAr outputs of the generators which declares the inadequacy of the acquired operating conditions of enhanced social spider optimization [18], salp swarm optimizer [41], and improved salp swarm optimizer [45].
Table 3.
Comparisons for Scenario 1.
Figure 4.
Violation of inequality constraints related to MVAr outputs of the generators.
4.1.2. PEs Minimizing (Scenario 2)
As demonstrated in Table 4, the designed SNSO minimizes the PEs in the third scenario. The resulting PE value is 1.038 ton/h, as indicated in the table. Furthermore, Figure 5 shows the convergence features of the produced SNSO for Scenario 3. Table 5 shows how it compares to other metaheuristic optimization approaches. As demonstrated, the developed SNSO meets the minimal PE target of 1.038 ton/h. In terms of the minimum ability, it beats the other metaheuristics of the improved genetic algorithm [19], social spider optimization [18], Improved genetic algorithm [19], enhanced social spider optimization [18], teaching-learning based optimization [37], and modified imperialist competitive algorithm [44] in minimizing the PEs.
Table 4.
Optimal results using the developed SNSO for Scenario 2.
Figure 5.
Convergence feature of the developed SNSO for Scenario 2.
Table 5.
Comparison for Scenario 3.
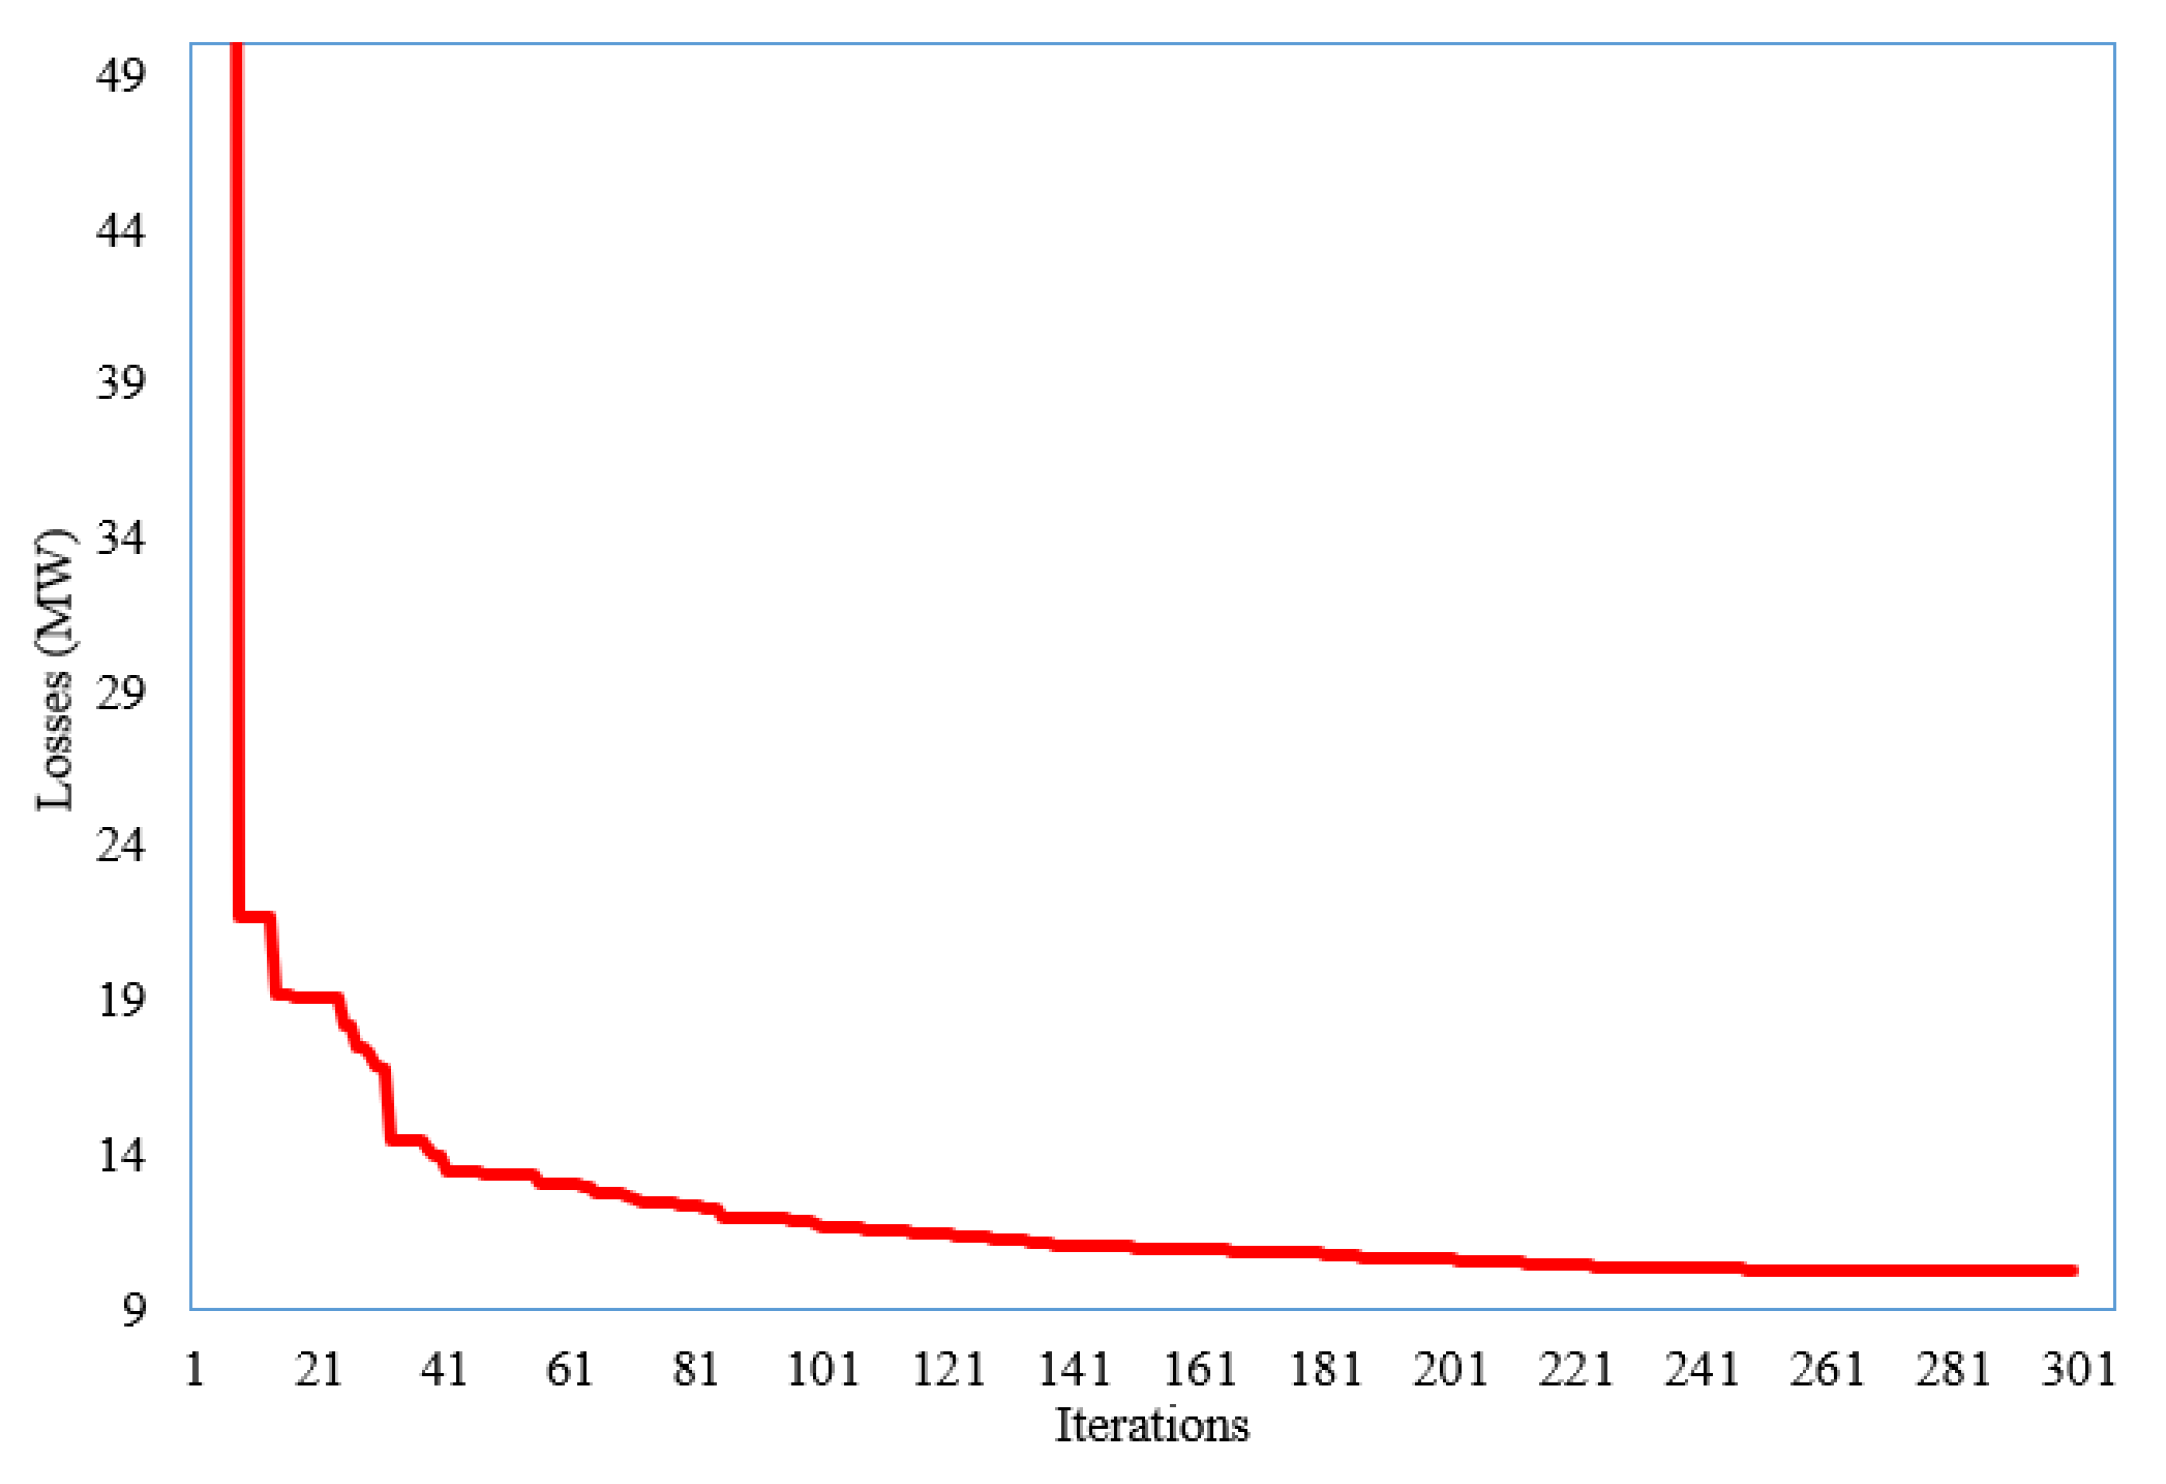
4.1.3. OPLs Minimizing (Scenario 3)
The created SNSO achieves the minimizing of the OPLs in the fourth scenario, as shown in Table 6. In addition, Figure 6 depicts the convergence characteristic of the proposed SNSO for Scenario 3. As indicated, the gained value of OPLs is 10.195 MW, whereas the original value is 27.835 MW. This decrease is a 63.37% reduction. Table 7 shows how it compares to other metaheuristic optimization approaches. As demonstrated, the designed SNSO meets the minimal OPLs target of 10.195 MW. It surpasses the other metaheuristics of enhanced social spider optimization [18], genetic algorithm, improved genetic algorithm [19], modified differential evolution [48], salp swarm optimizer [41], and stud krill herd algorithm [49] in minimizing the OPLs.
Table 6.
Optimal results using the developed SNSO for Scenario 3.
Figure 6.
Convergence feature of the developed SNSO for Scenario 4.
Table 7.
Comparison for Scenario 3.
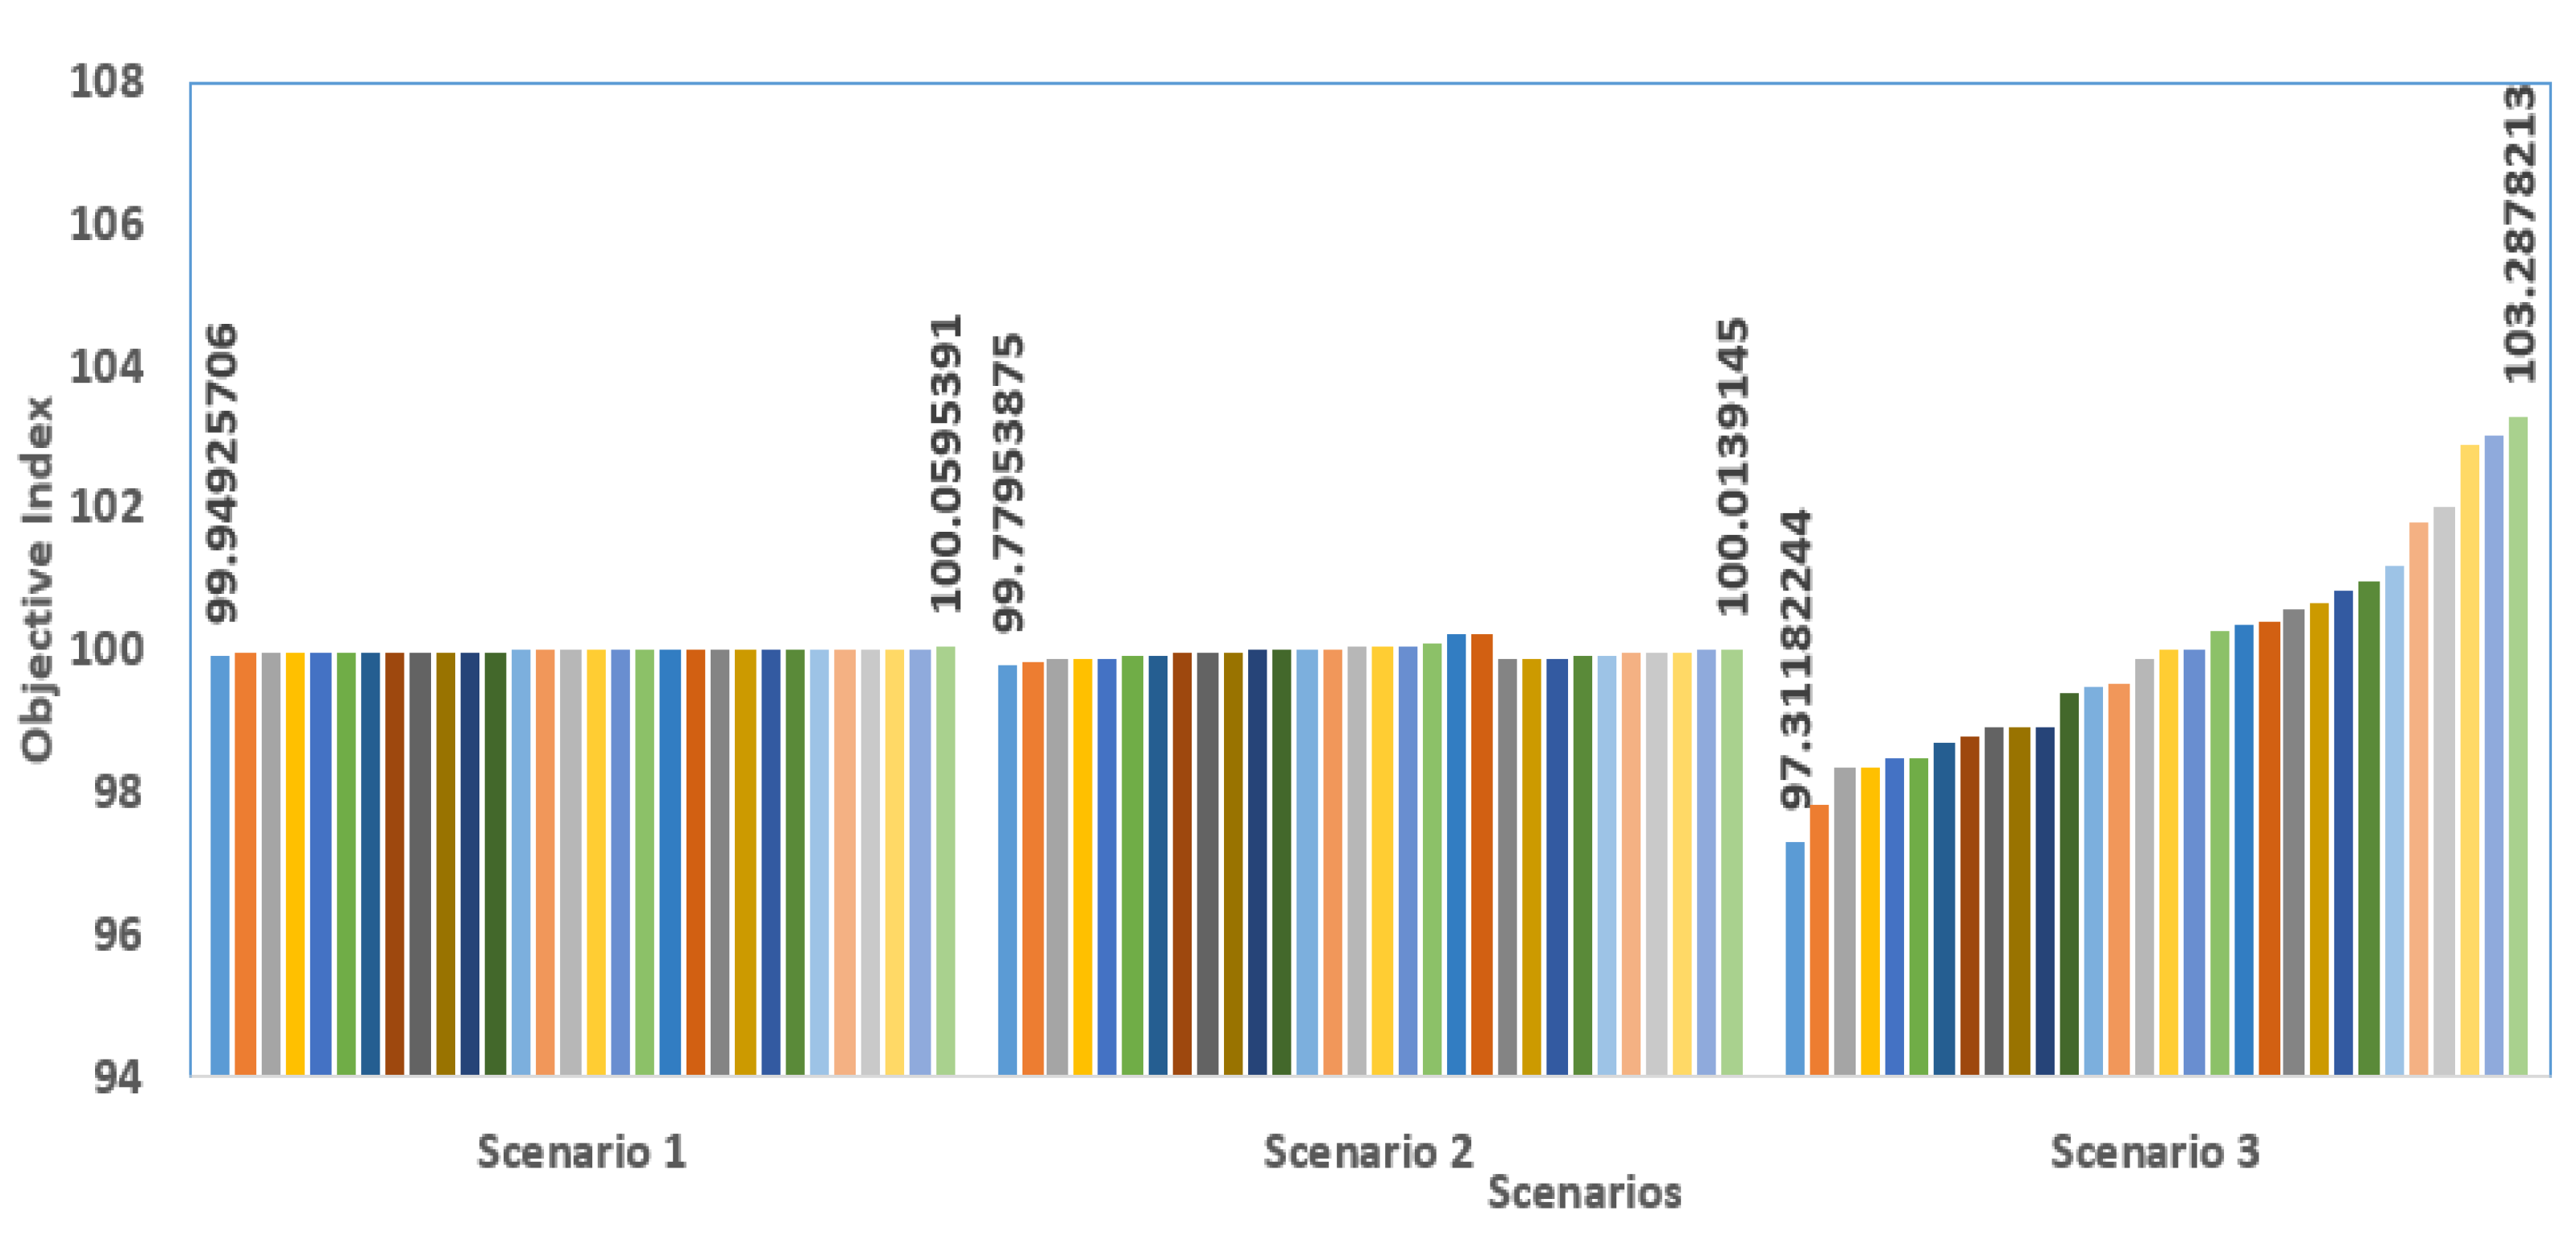
4.1.4. Assessment of the Stability of the Developed SNSO for IEEE 57-Bus Power System
The acquired objectives of the thirty runs are documented in order to perform a comprehensive assessment of the stability of the generated SNSO for all scenarios. The associated average objective is determined for each scenario, and a graph is shown to depict the proportion of each run to the average as a dynamic indicator (IndOJi) through Equation (31) and, therefore, the proximity of each run to the average. Figure 7 depicts the acquired indications of the associated objective percentages via the created SNSO runs.
Figure 7.
Obtained objectives percentages through the runs via the developed SNSO.
As demonstrated, the developed SNSO has the capability of always locating near percentages to 100% if its average is close to its lowest. The lowest and maximum index percentages in the first scenario are 99.949 and 100.059%, respectively, but in the second scenario, they are 99.779 and 100.014%, respectively. For the third scenario, the lowest and highest index percentages are 97.311 and 103.287%, respectively. This demonstrates the developed SNSO’s exceptional stability under all circumstances.
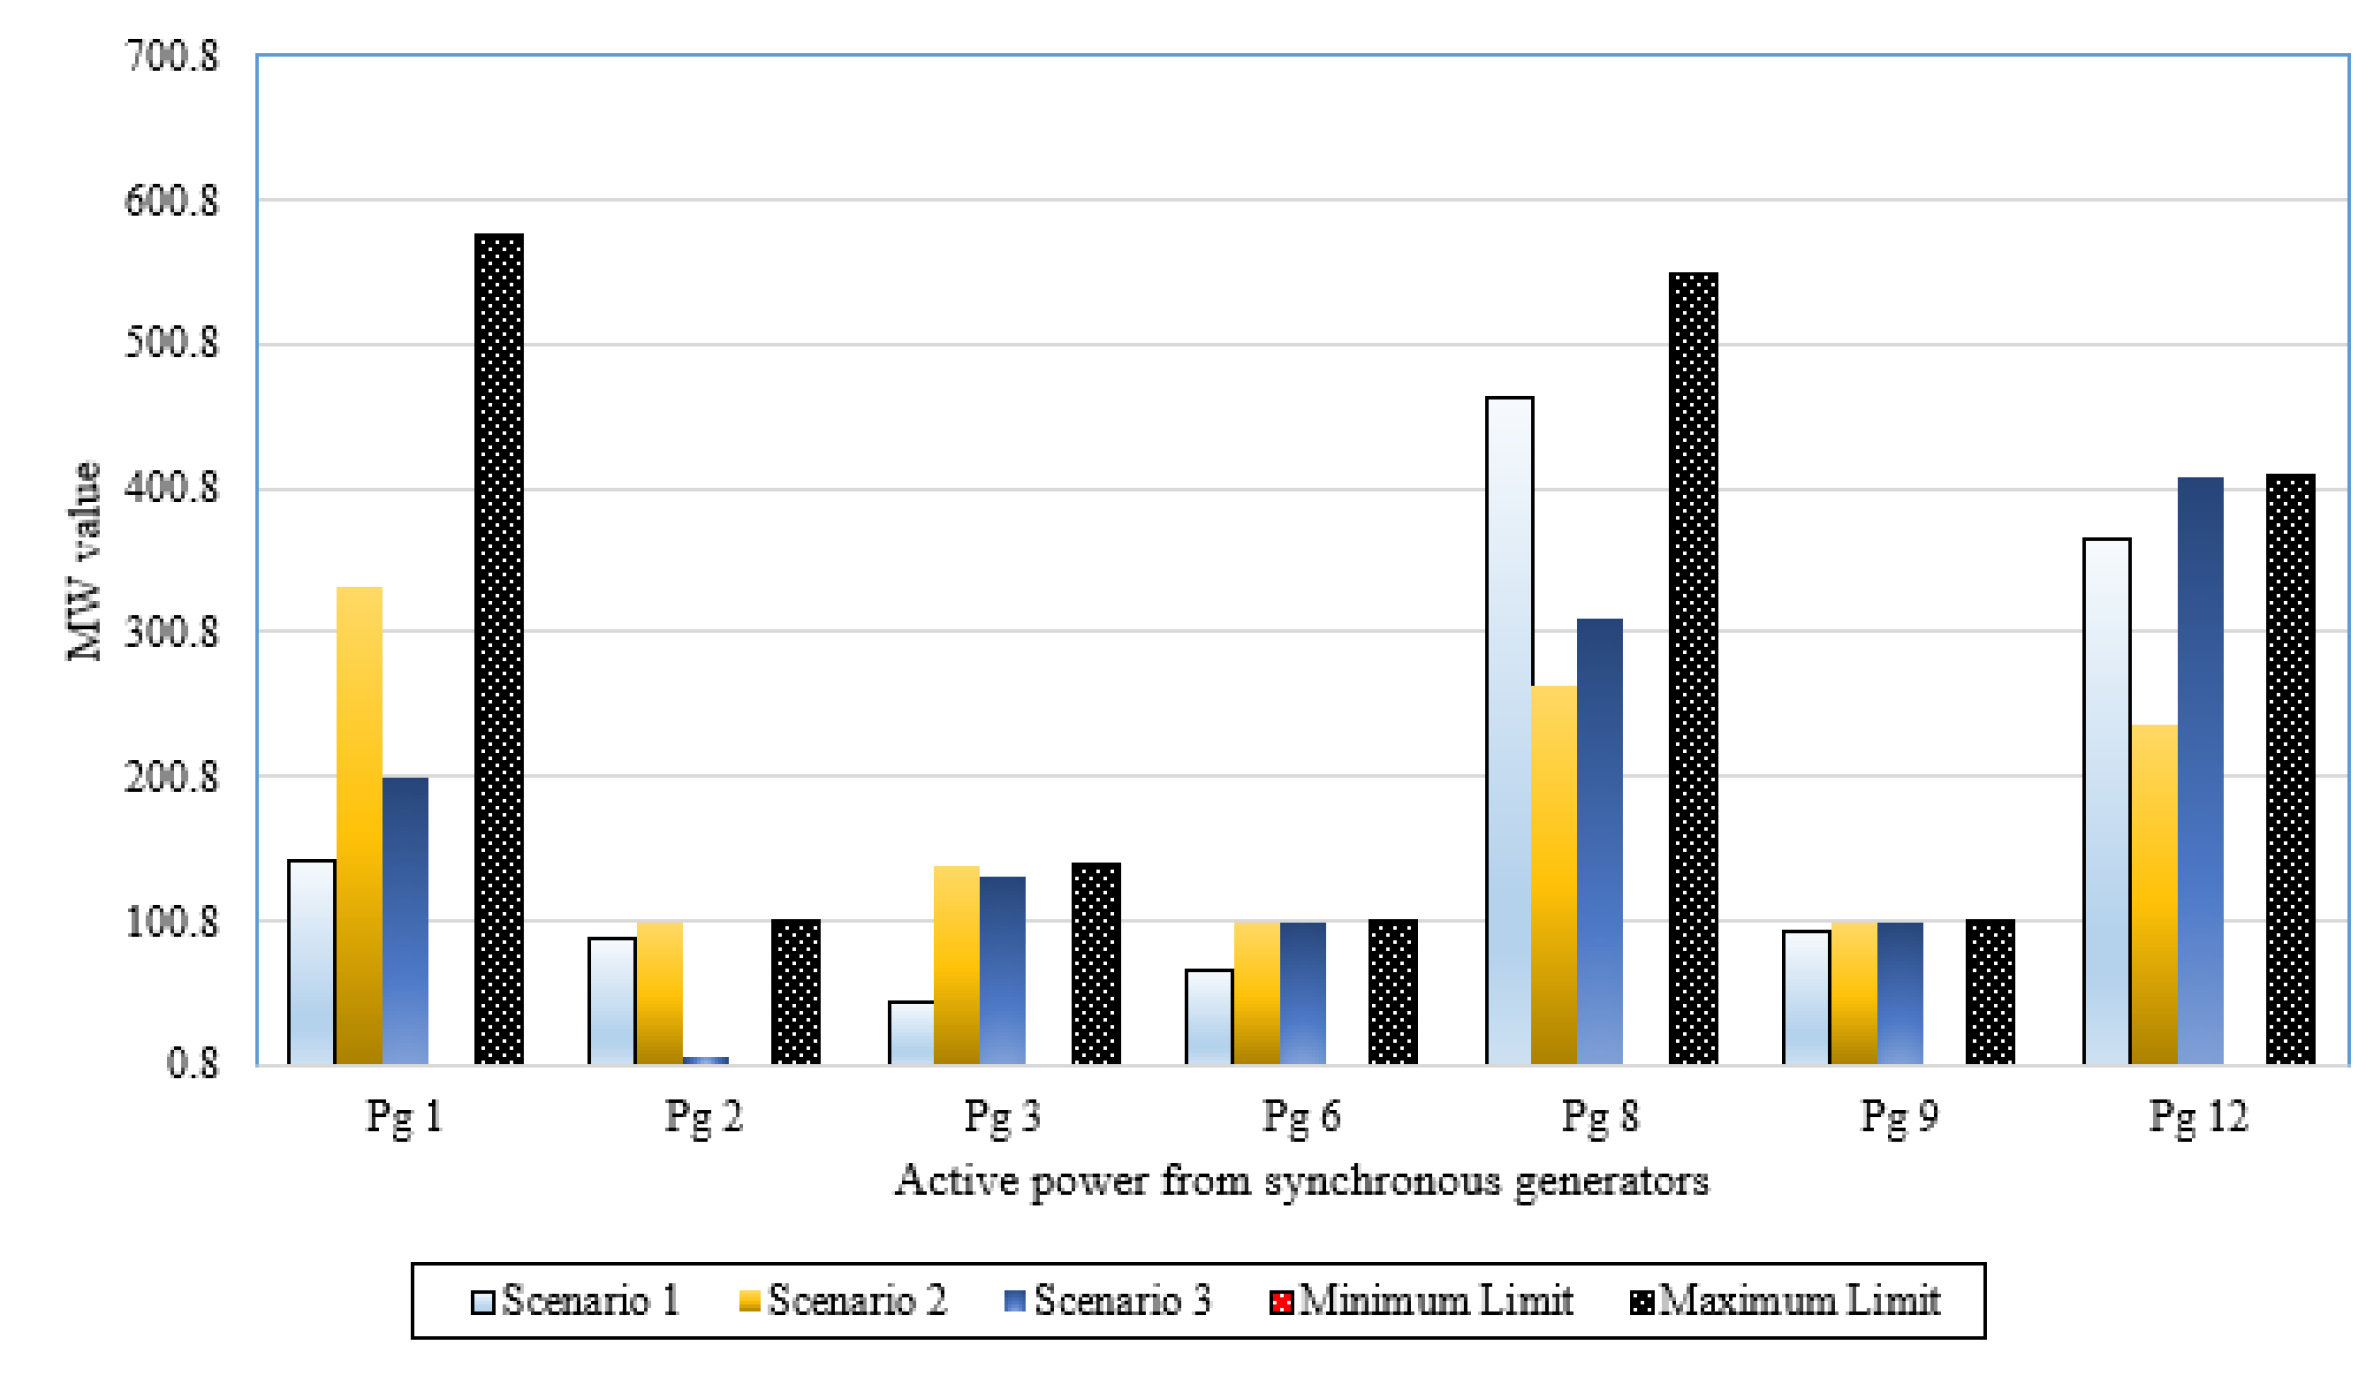
4.1.5. Validations of Operation for Rotary and Static Machines in the IEEE 57-Bus Power System
In this section, a validation assessment has been investigated for the rotary and static machines of the IEEE 57-bus power system. To illustrate, Figure 8 plots the active power outputs of synchronous machines and the corresponding limits while Figure 9. depicts the reactive power outputs of synchronous machines and the corresponding limits for Scenarios 1–3 in the IEEE 57-bus power system. As shown, the active and reactive power outputs of all synchronous machines for all studied scenarios are within their limits with no violations. Additionally, operating Tap points and their limits of transformers for Scenarios 1–3 in the IEEE 57-bus power system are demonstrated in 
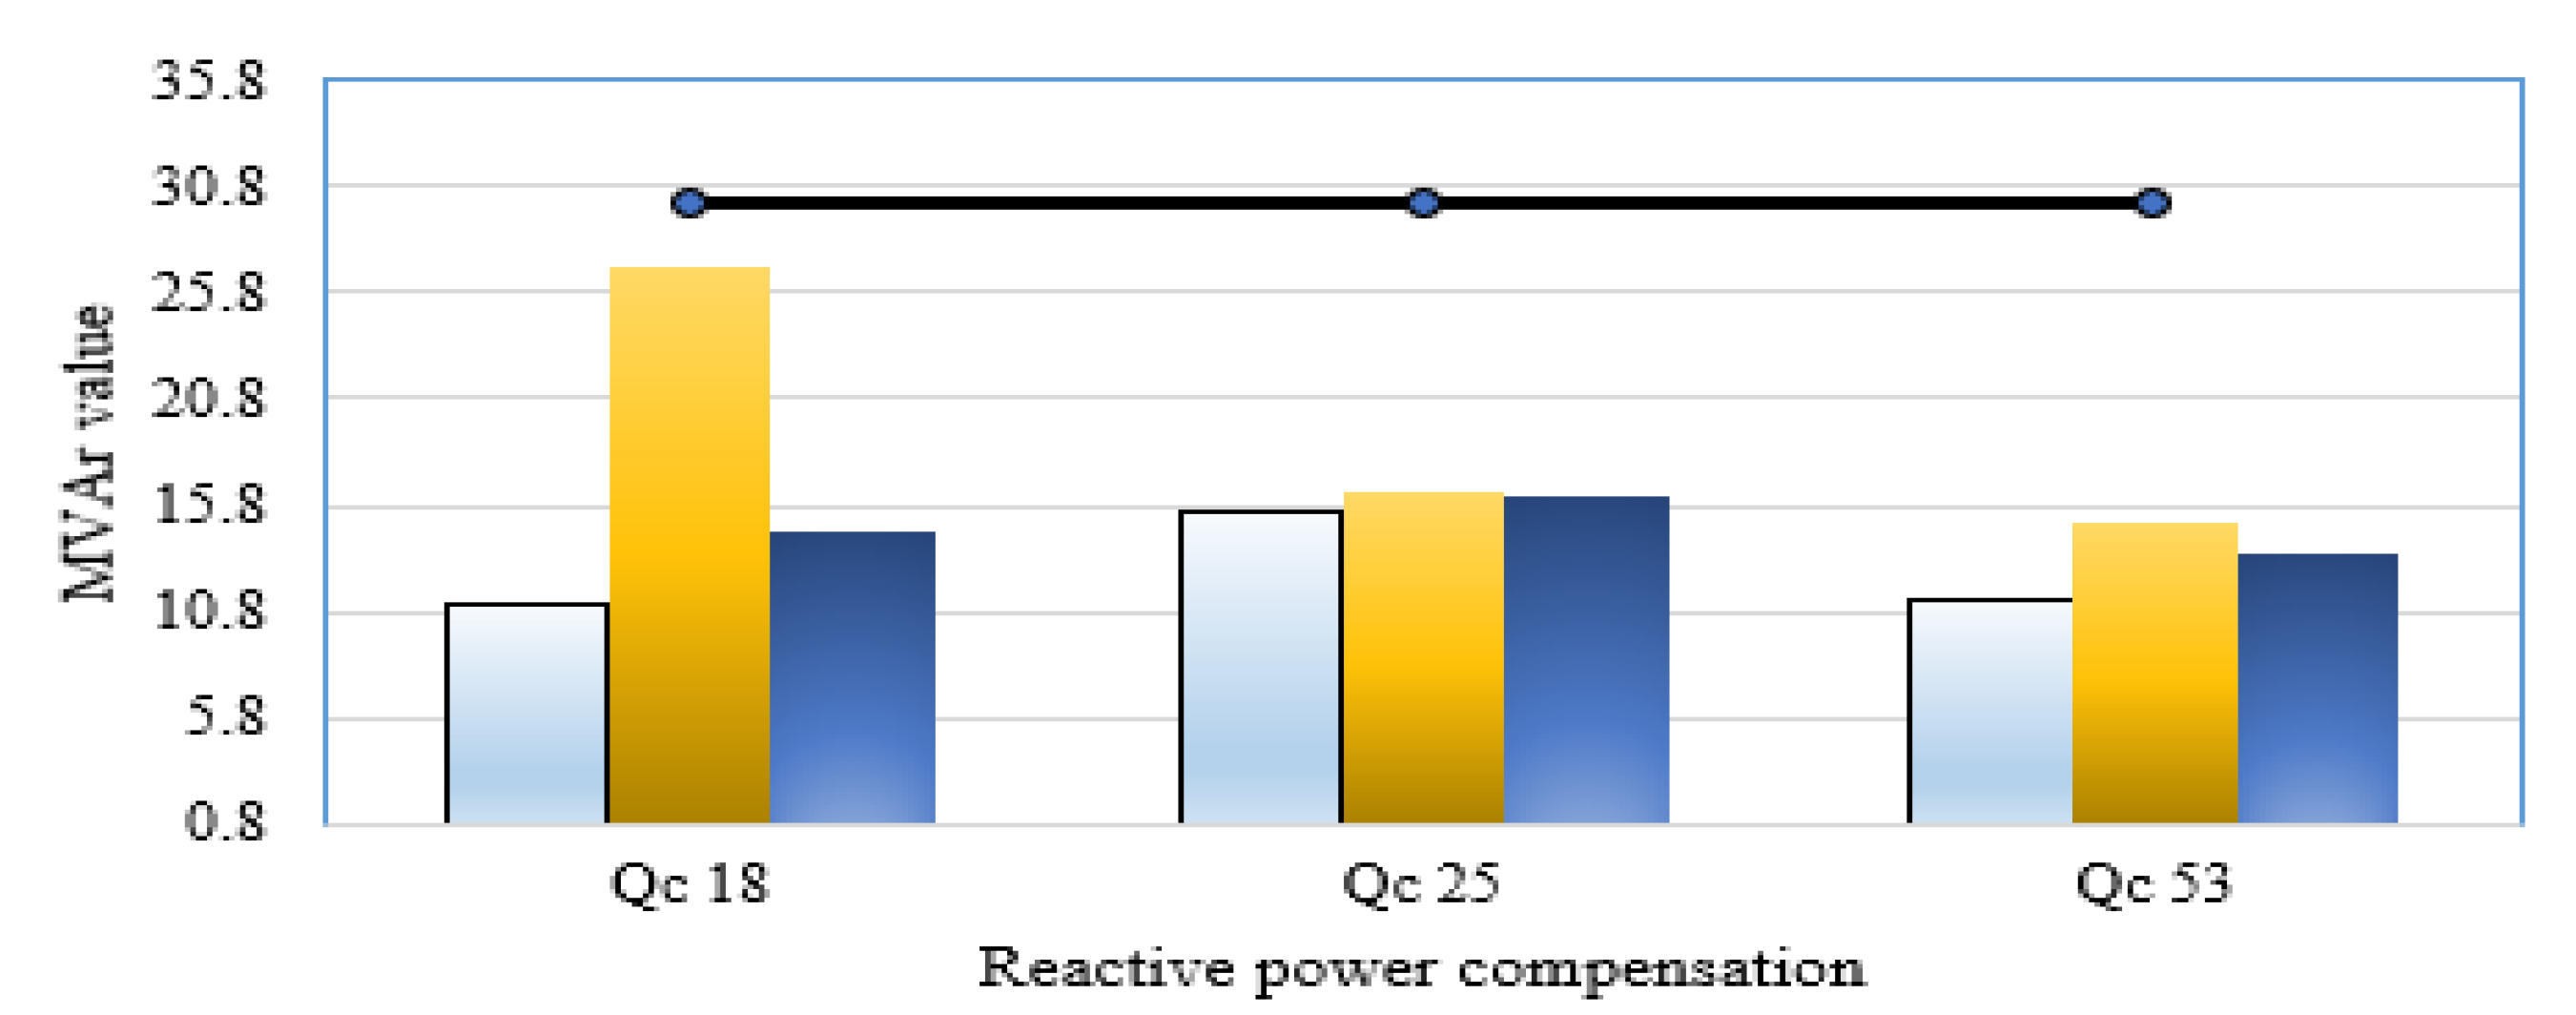
Figure 10. This figure illustrates that all the operating levels of the taps are inside their maximum and minimum limitations of 1.1 and 0.9, respectively. Furthermore, the reactive power outputs of VAR sources for Scenarios 1–3 in the IEEE 57-bus power system are within their limits with no violations as illustrated in Figure 11.
Figure 8.
Active power outputs of synchronous machines for Scenarios 1–3 in the IEEE 57-bus power system.
Figure 9.
Reactive power outputs of synchronous machines for Scenarios 1–3 in the IEEE 57-bus power system.
Figure 10.
Operating Tap points and their limits of transformers for Scenarios 1–3 in the IEEE 57-bus power system.
Figure 11.
Reactive power outputs of VAR sources for Scenarios 1–3 in the IEEE 57-bus power system.
4.2. The Second System Results
The following two scenarios are investigated for the second EPS:
- Scenario 4: OV1 Minimization of FGCs
- Scenario 5: OV3 Minimization of OPLs
4.2.1. FGCs Minimizing (Scenario 4)
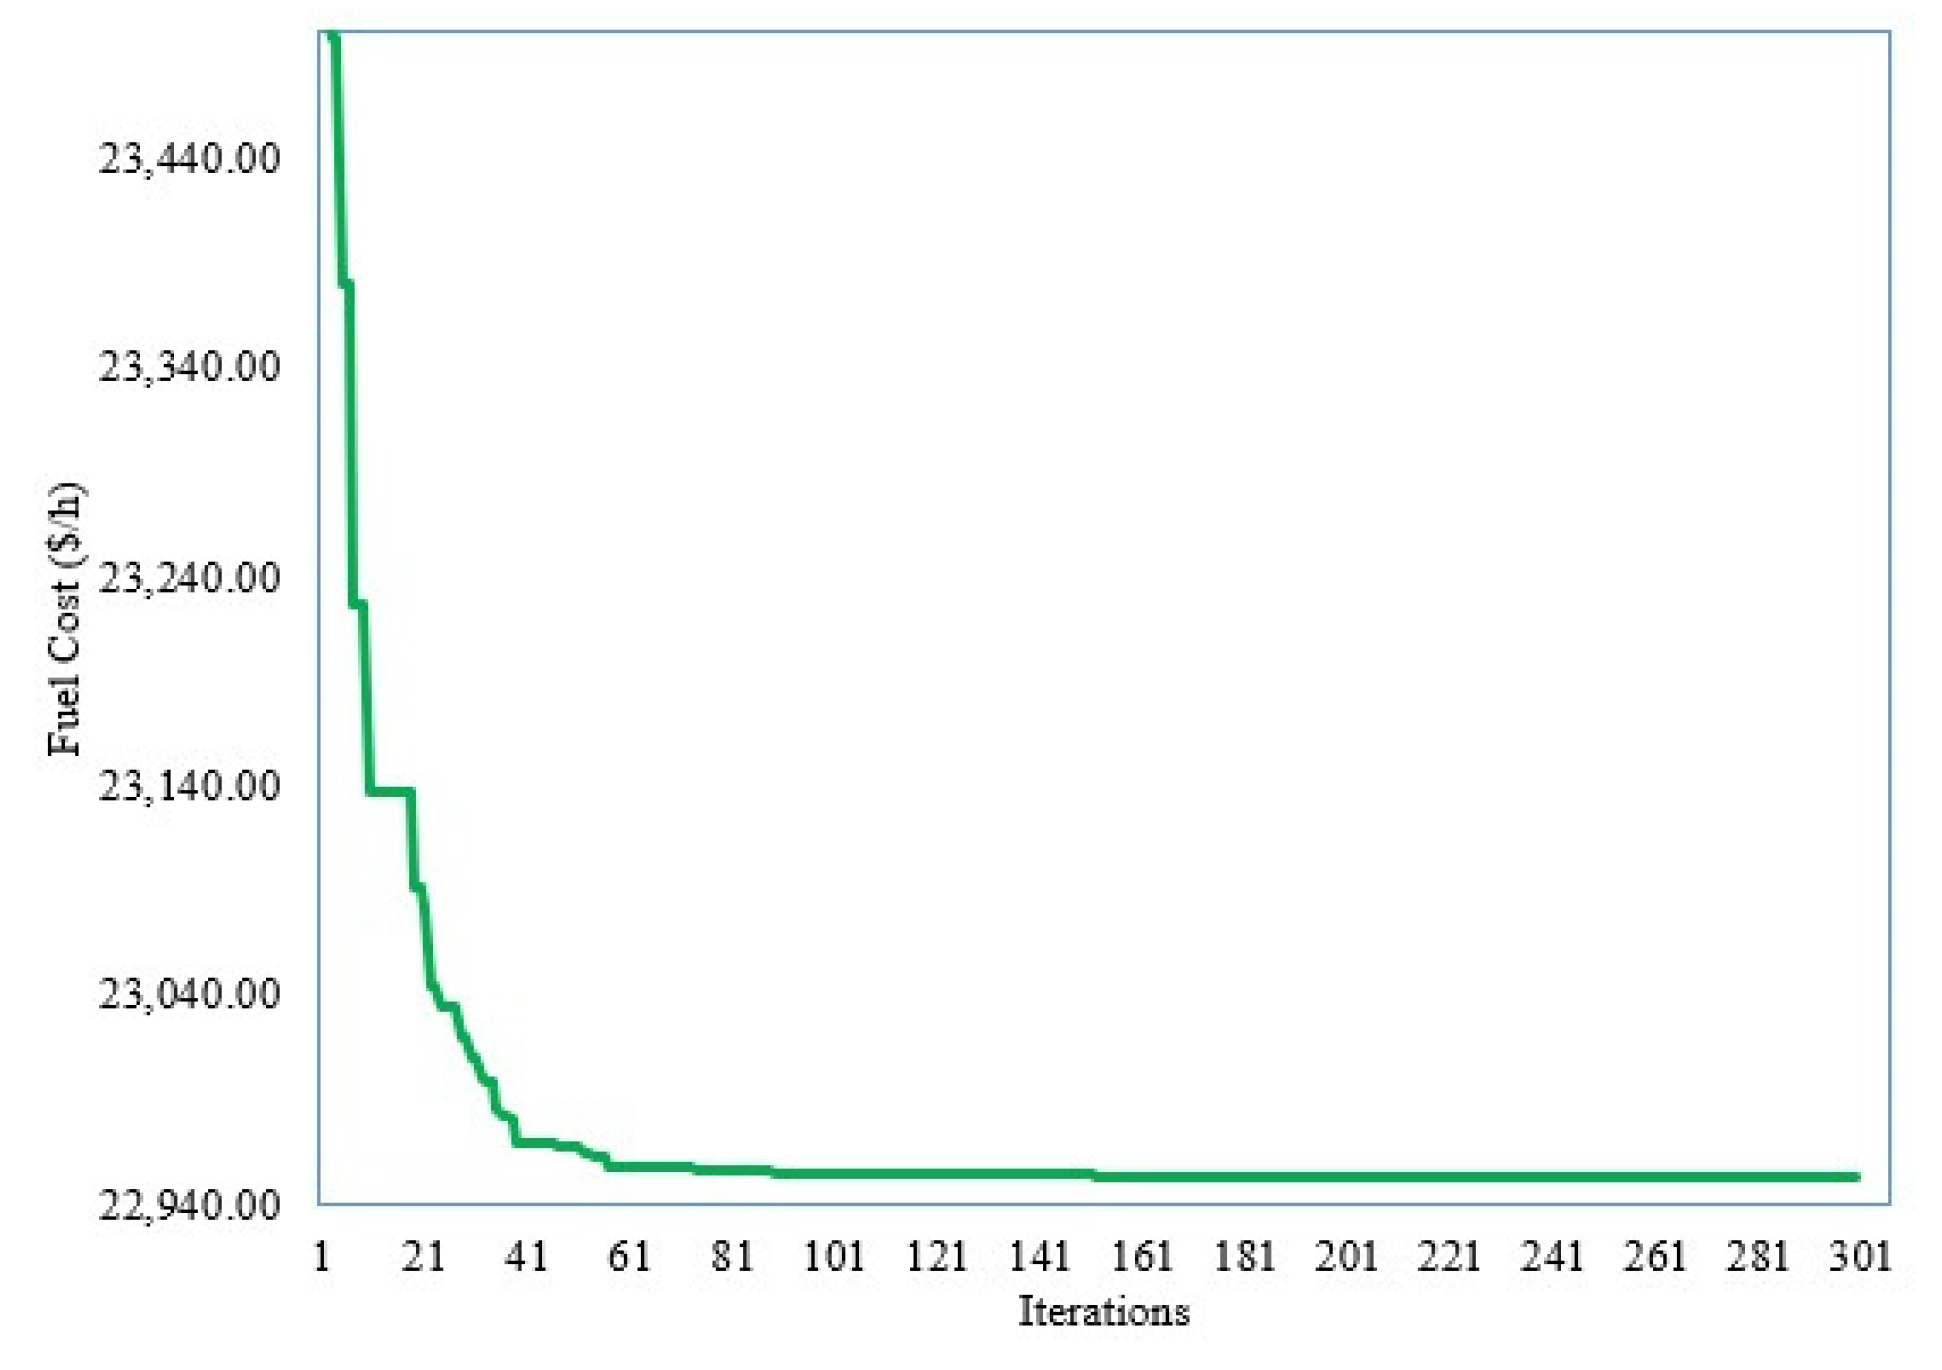
For this scenario, the developed SNSO is applied whereas their obtained outputs are recorded in Table 8. Added to that, Figure 12 illustrates the convergence feature of the developed SNSO for Scenario 4. As shown, the developed SNSO minimizes the FGCs from 25,098.70 USD/h at the initial scenario to 22,953.425 USD/h. This reduction represents a percentage of 8.54%.
Table 8.
Optimal results using the developed SNSO for Scenario 4.
Figure 12.
Convergence feature of developed SNSO for Scenario 4.
For this scenario, the developed SNSO is compared with several other new techniques such as enhanced grey wolf technique [50], crow search technique [35], salp swarm technique, novel bat technique, and spotted hyena technique that are applied for this scenario as tabulated in Table 9. As seen, the developed SNSO outperforms all other techniques in minimizing the FGCs where the developed SNSO obtains the least FGCs of 22,953.425 USD/h. On contrary, novel bat, salp swarm, enhanced grey wolf, spotted hyena, crow search and modified crow search techniques obtain 22,960.8, 22,965.6, 22,957.7, 22,958.8, 22,959.4 and 22,955.6 USD/h, respectively.
Table 9.
Comparison for Scenario 5.
4.2.2. OPLs Minimizing (Scenario 5)
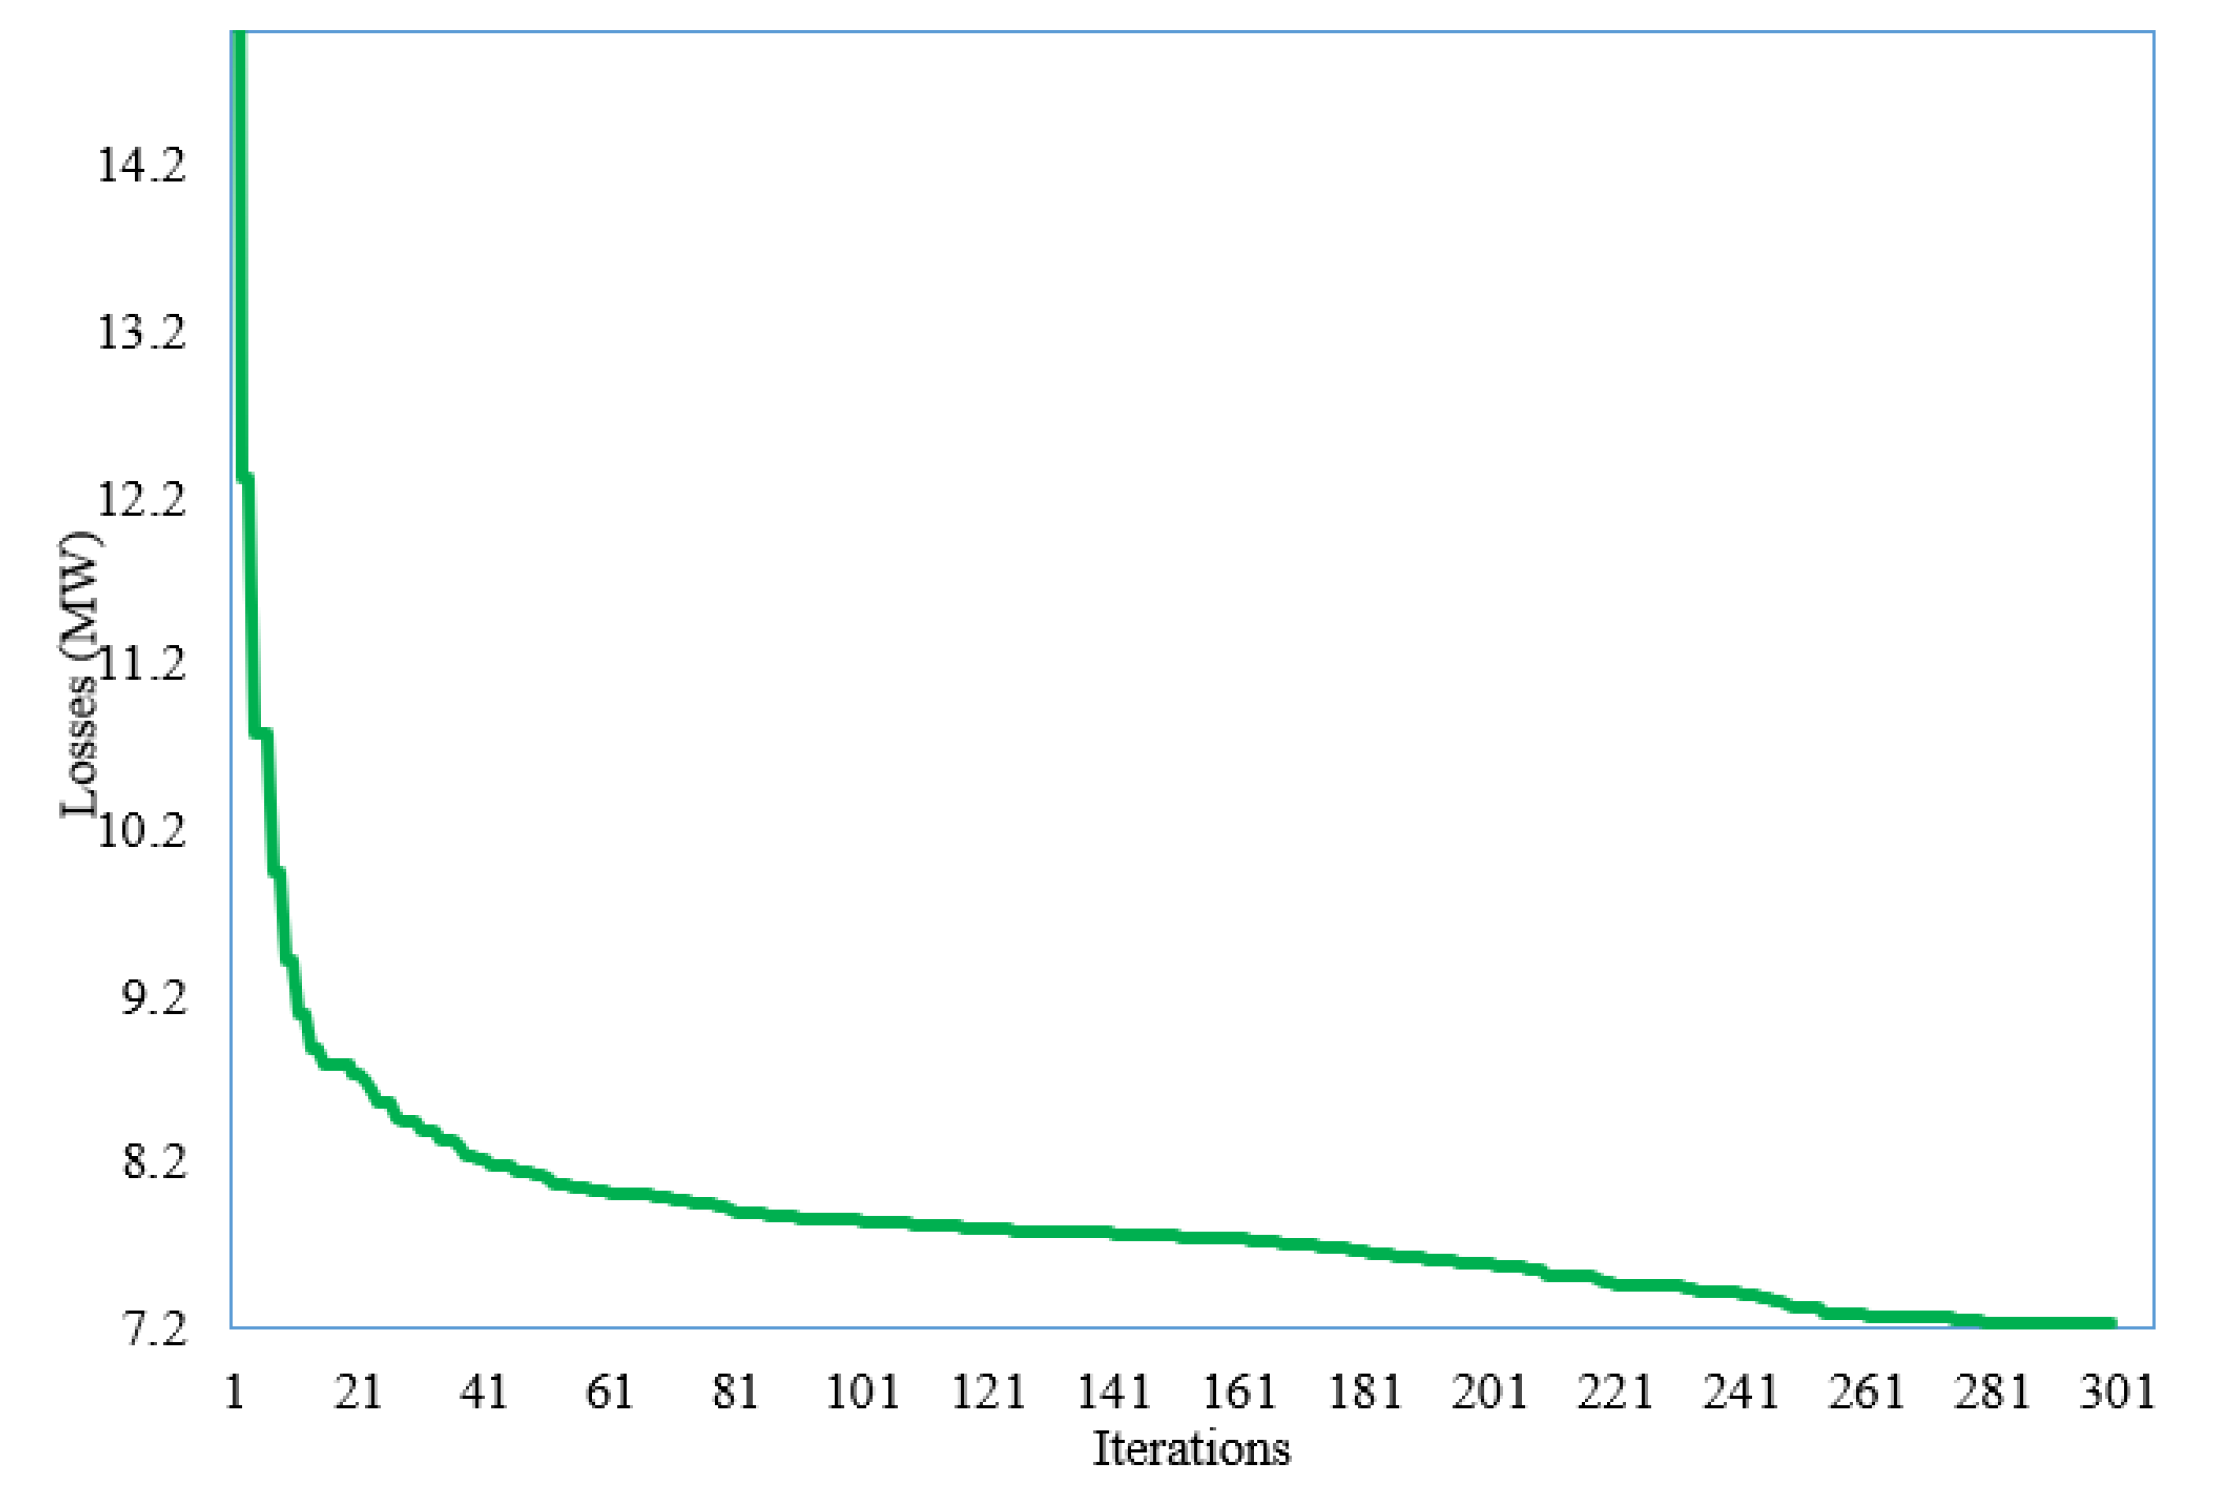
For the fifth scenario, the minimization of the OPLs is obtained by the developed SNSO as reflected in Table 10. In addition, Figure 13 illustrates the convergence feature of the developed SNSO for Scenario 5. As shown, the developed SNSO minimizes the OPLs from 19.02 MW at the initial scenario to 7.24 MW. This reduction represents a percentage of 61.93%.
Table 10.
Optimal results using the developed SNSO for Scenario 6.
Figure 13.
Convergence feature of the developed SNSO for Scenario 5.
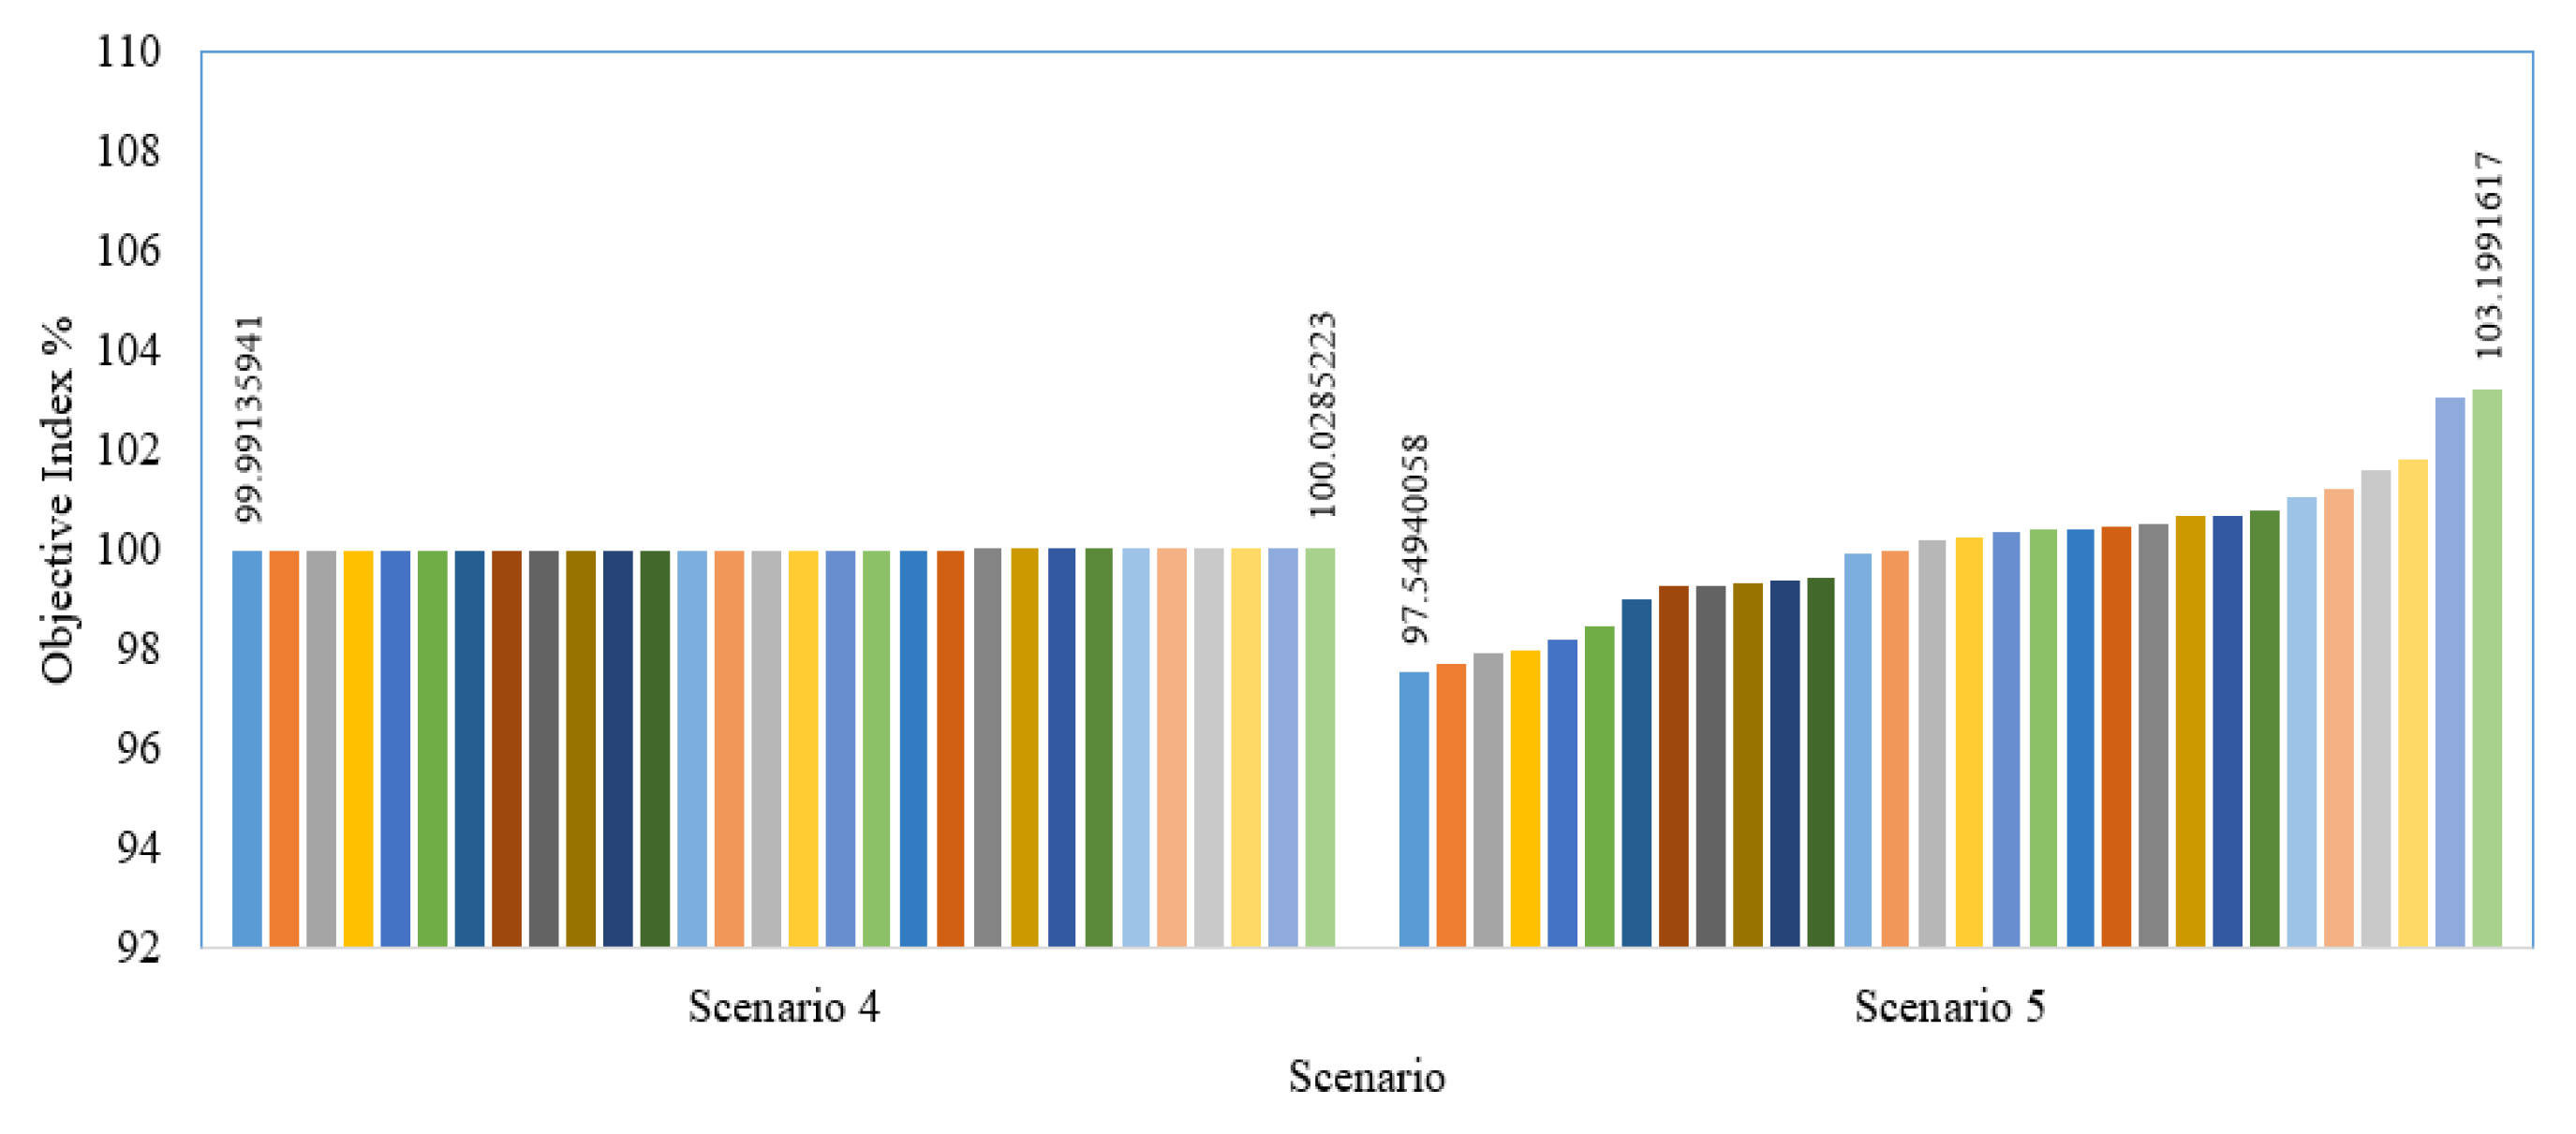
4.2.3. Assessment of the Stability of the Developed SNSO for WDA Power System
For the WDA power system, similar assessment methodology in Section 4.1.4, the objective indexes via Equation (31) are described for all runs of the developed SNSO. For each scenario, Figure 14 describes the obtained indicators of the related objective percentages through the runs via the developed SNSO.
Figure 14.
Obtained objectives percentages through the runs via the developed SNSO.
As can be shown, the evolved SNSO has the potential to always locate close percentages to 100% if its average is close to its minimum. In the first situation, the mini-mum and maximum index percentages are 99.99 and 100.03%, respectively, whereas in the second scenario, they are 97.55 and 103.2%, respectively. This displays the developed SNSO’s remarkable stability in all conditions for the WDA power system.
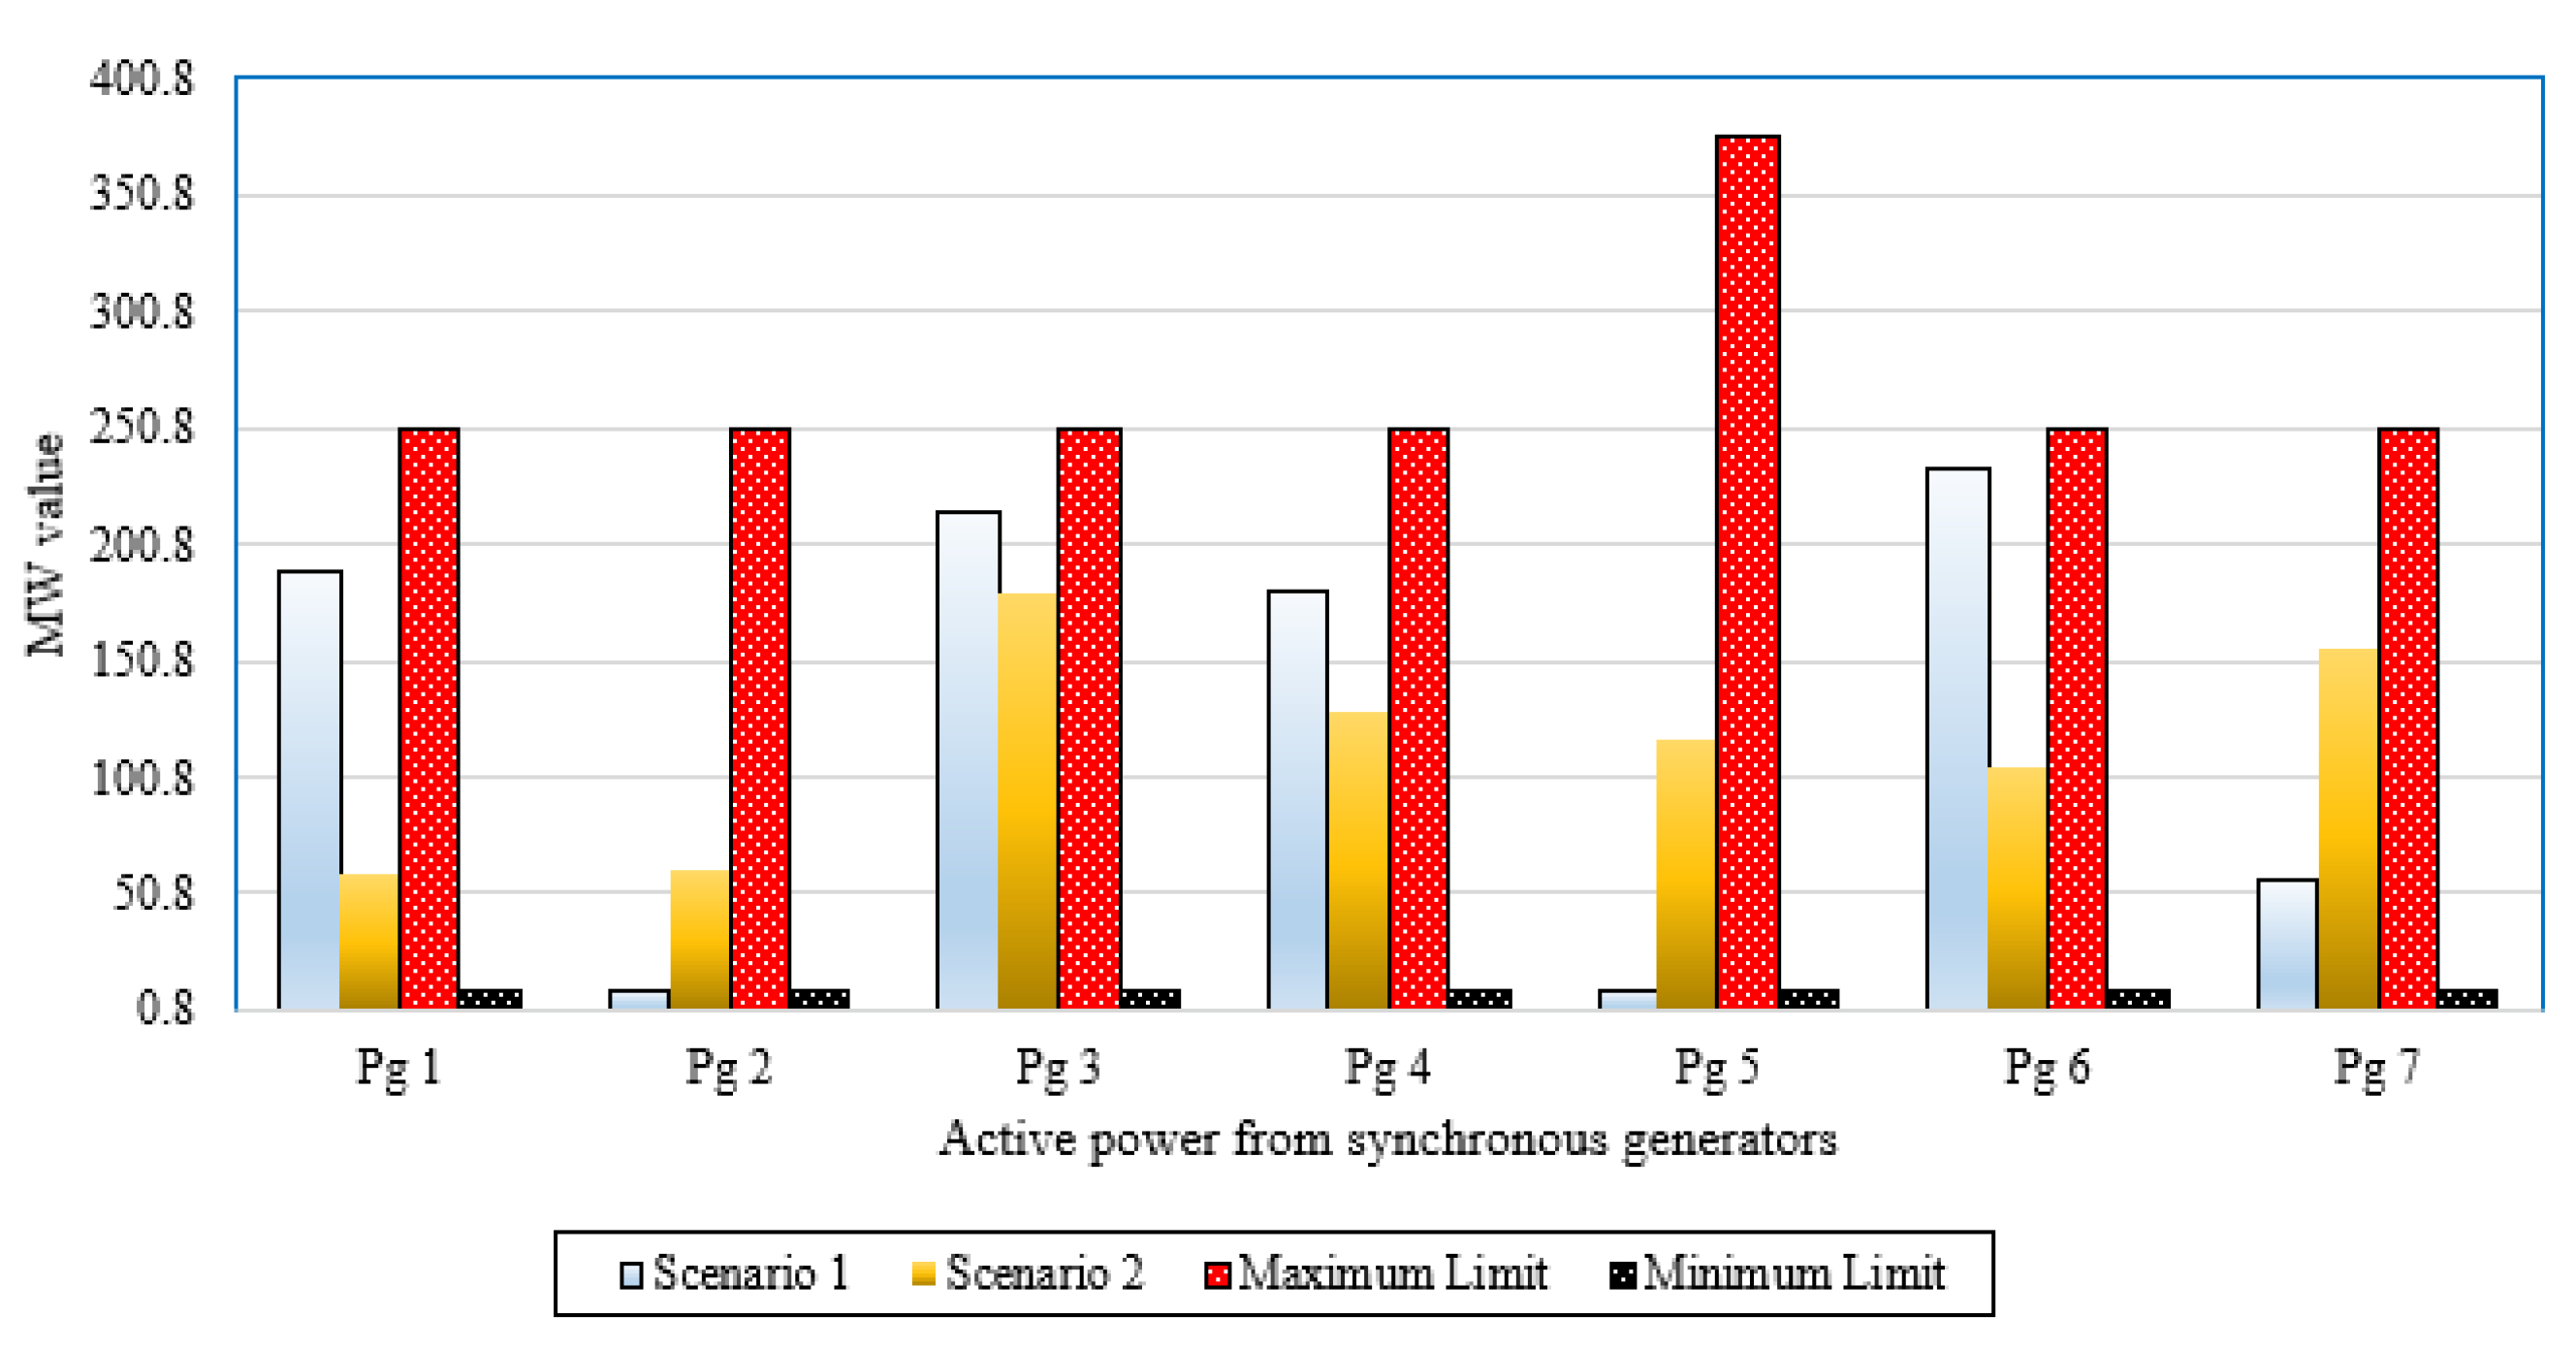
4.2.4. Validations of Operation for Rotary Machines in the WDA Power System
In this section, a validation assessment has been conducted for the rotary machines of the WDA power system. To illustrate, the active power outputs of synchronous machines for Scenarios 4 and 5 in the WDA power system are within their limits with no violations as illustrated in 
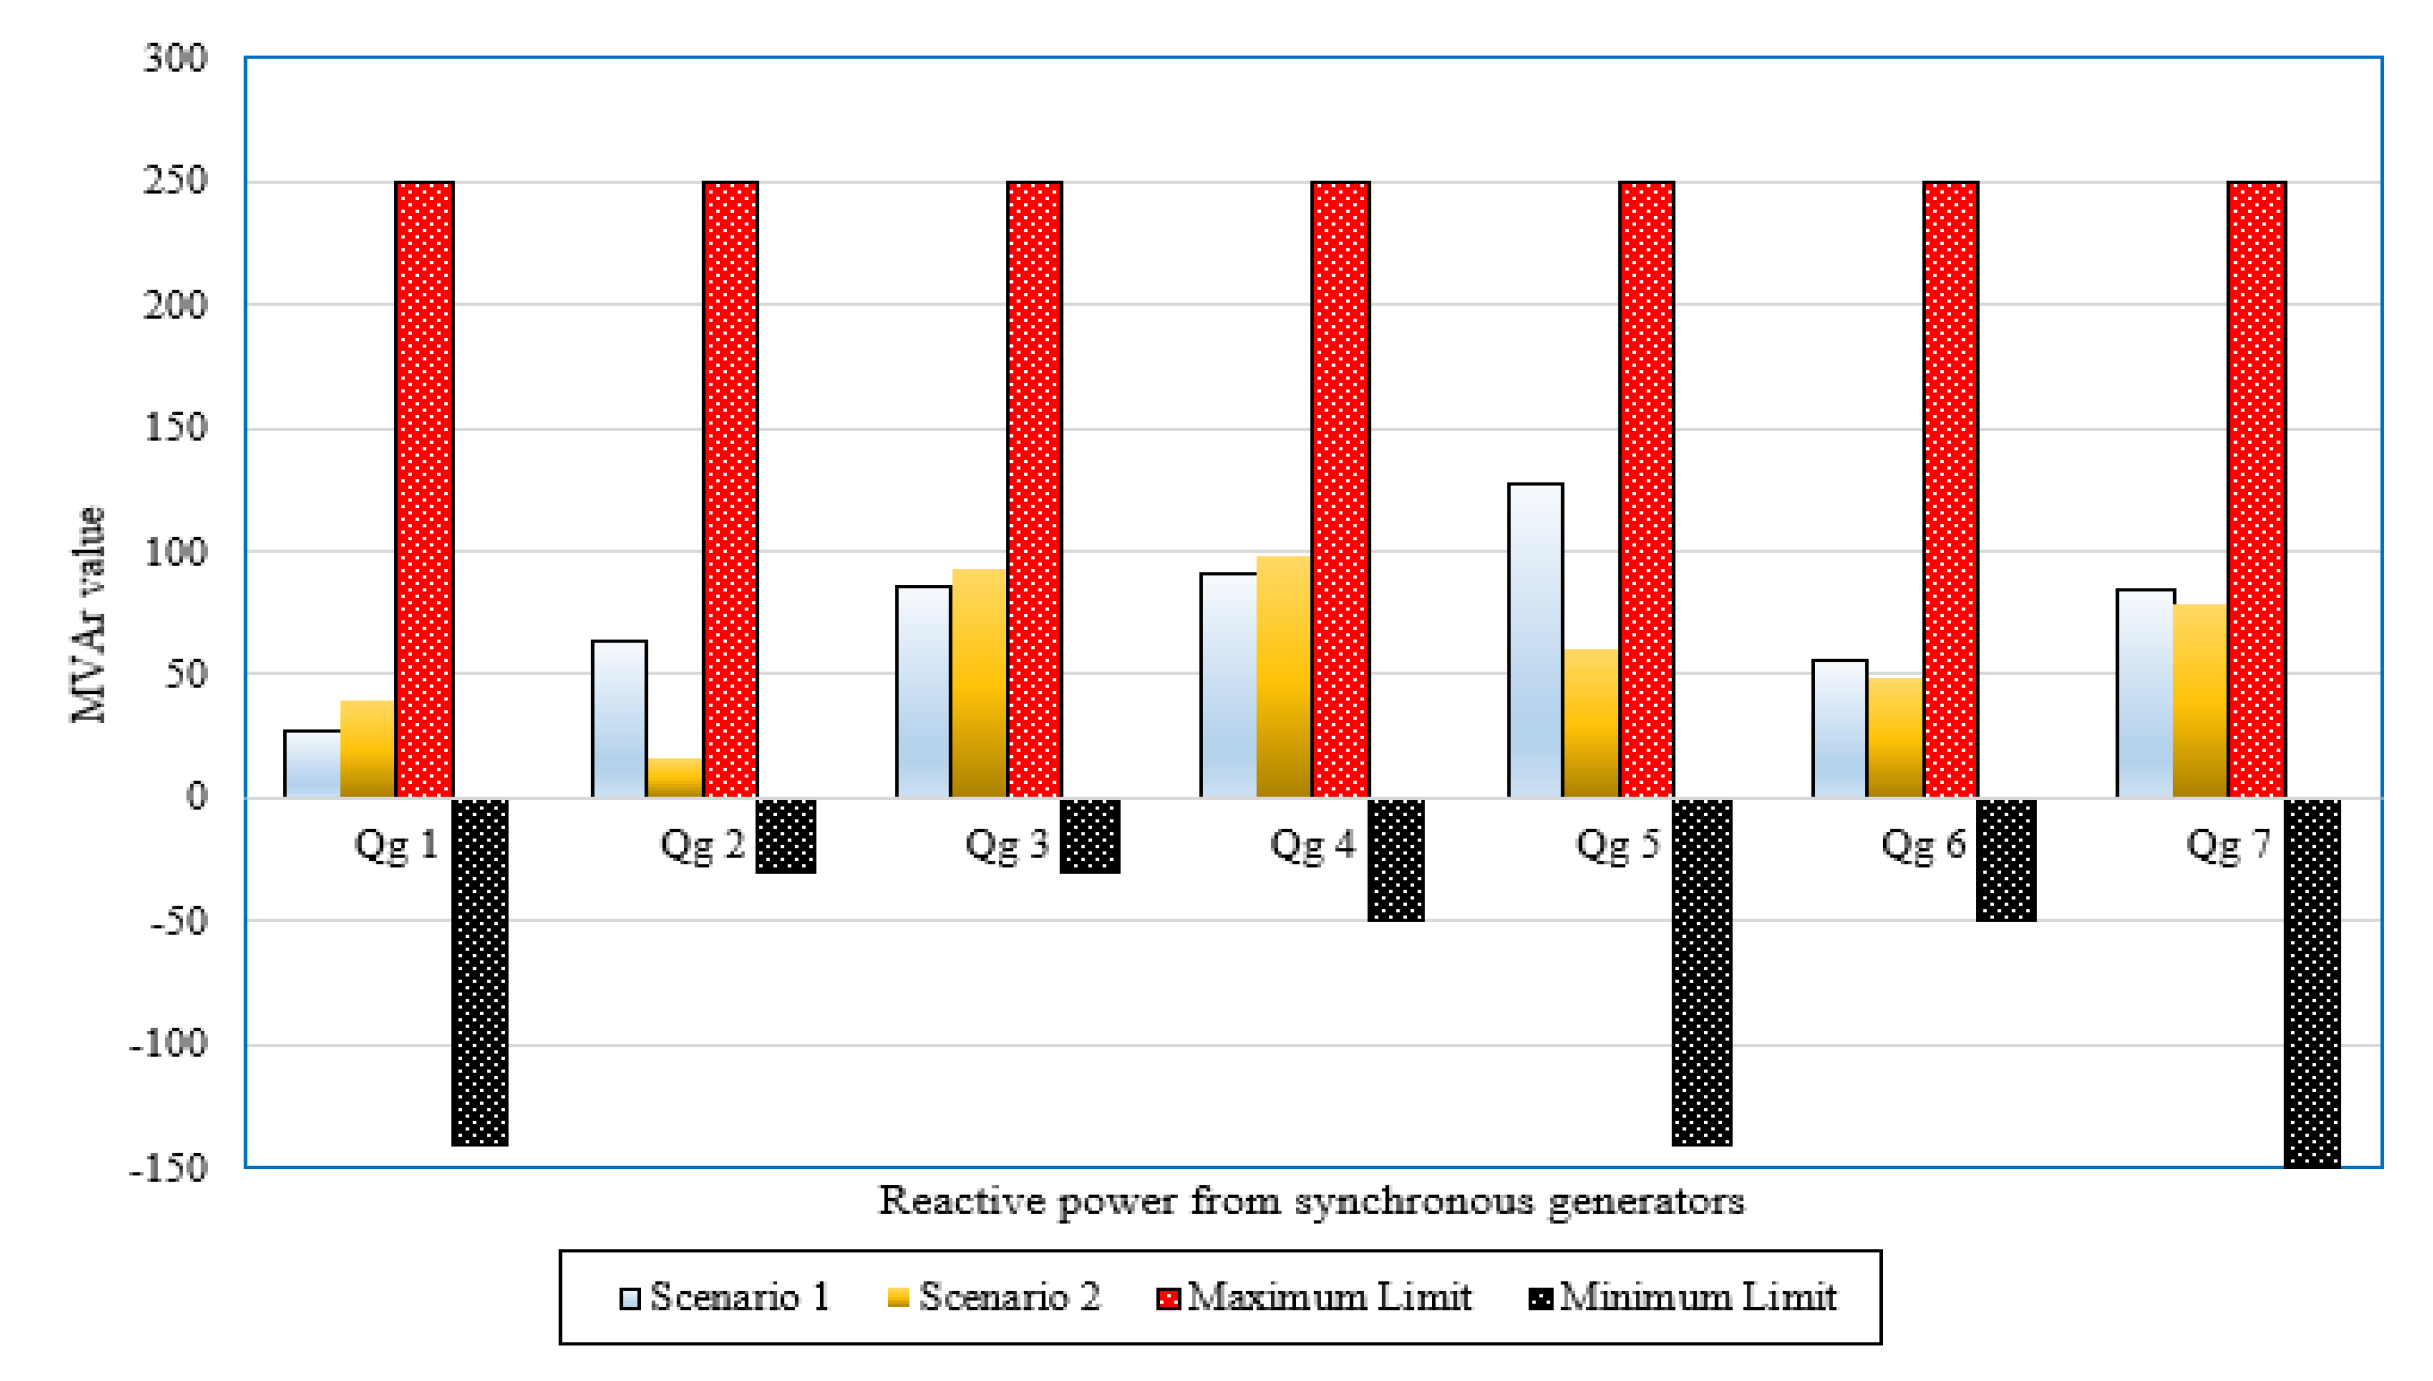
Figure 15. Moreover, the reactive power outputs of synchronous machines for Scenarios 4 and 5 in the WDA power system are within their limits with no violations as illustrated in Figure 16.
Figure 15.
Active power outputs of synchronous machines for Scenarios 4 and 5 in the WDA power system.
Figure 16.
Reactive power outputs of synchronous machines for Scenarios 4 and 5 in the WDA power system.
4.3. Computational Burden of the Developed SNSO for Both Systems
The computation time of the designed SNSO is computed and reported in Table 11 for both systems. It is calculated as the mean time required for each iteration, incorporating the power flow technique. One such table demonstrates that the accompanying timeframe for the created SNSO is distinct for both systems, with the developed SNSO taking the shortest time by 0.545 sec in the second scenario for the IEEE 57-bus power system and 0.418 sec in the sixth scenario for the WDA power system.
Table 11.
Computational burden of the developed SNSO for both systems.
5. Conclusions
In this paper, a developed solution based on social network search (SNS) optimizer (SNSO) for optimal power system operation (OPSO) in power systems. The developed OPSO’s evaluation is conducted using an IEEE standardized 57 bus power system and real Egyptian power system of the West Delta area (WDA). Five diverse scenarios are considered based on the targeted objective function of the cost of fuel, power losses, and polluting emissions. The developed SNSO derives considerable stability for all scenarios. A validation assessment is conducted for synchronous generator rotary machines and static machines of on-load tap changer (OLTC) transformers and volt-ampere reactive (VAR) sources of the IEEE 57-bus and WDA power systems which illustrate that all machines are operating inside their limits with no violation. The simulated findings prove the developed OPSO’s solution accuracy and resilience when compared to other relevant techniques in the literature. Moreover, the developed SNSO declares significant effectiveness compared with various contemporary techniques. For all investigated scenarios, significant reductions are attained in the targeted goal.
- For the IEEE standardized 57 bus power system, The reduction percentage is reached to represent a percentage of 18, 14.39% and 63.37% for scenarios 1–3 compared to the initial scenario, respectively.
- For the real Egyptian power system of WDA, the reduction percentage is reached to represent a percentage of 8.54% and 61.95% for scenarios 4 and 5 compared to the initial scenario, respectively.
In contrast, the reliability of the developed SNSO requires more support and more applications in the area of power system optimization should be verified including renewable sources. Therefore, it is recommended as future work to derive enhanced versions of the SNSO and apply it for mathematical benchmark models and engineering optimization problems in the field of power systems.
Author Contributions
Conceptualization, R.E.-S. and A.S. methodology. A.S. and R.E.-S.; software and validation, formal analysis, investigation, A.G.; resources, A.E. data curation, writing—original draft preparation, E.E.; writing—review and editing, R.E.-S.: supervision, E.E.; funding acquisition. All authors have read and agreed to the published version of the manuscript.
Funding
This research was funded Taif University Researchers Supporting Project number (TURSP-2020/86), Taif University, Taif, Saudi Arabia.
Institutional Review Board Statement
Not applicable.
Informed Consent Statement
Not applicable.
Acknowledgments
This work was supported by Taif University Researchers Supporting Project number (TURSP-2020/86), Taif University, Taif, Saudi Arabia.
Conflicts of Interest
The authors declare no conflict of interest.
References
- Naderi, E.; Narimani, H.; Pourakbari-Kasmaei, M.; Cerna, F.V.; Marzband, M.; Lehtonen, M. State-of-the-Art of Optimal Active and Reactive Power Flow: A Comprehensive Review from Various Standpoints. Processes 2021, 9, 1319. [Google Scholar] [CrossRef]
- Ghoneim, S.S.M.; Kotb, M.F.; Hasanien, H.M.; Alharthi, M.M.; El-Fergany, A.A. Cost Minimizations and Performance Enhancements of Power Systems Using Spherical Prune Differential Evolution Algorithm Including Modal Analysis. Sustainability 2021, 13, 8113. [Google Scholar] [CrossRef]
- Farhat, M.; Kamel, S.; Atallah, A.M.; Khan, B. Optimal power flow solution based on jellyfish search optimization considering uncertainty of renewable energy sources. IEEE Access 2021, 9, 100911–100933. [Google Scholar] [CrossRef]
- Hassan, M.H.; Kamel, S.; Selim, A.; Khurshaid, T.; Domínguez-garcía, J.L. A modified rao-2 algorithm for optimal power flow incorporating renewable energy sources. Mathematics 2021, 9, 1532. [Google Scholar] [CrossRef]
- Al Harthi, M.; Ghoneim, S.; Elsayed, A.; El-Sehiemy, R.; Shaheen, A.; Ginidi, A. A Multi-Objective Marine Predator Optimizer for Optimal Techno-Economic Operation of AC/DC Grids. Stud. Inform. Control 2021, 30, 89–99. [Google Scholar] [CrossRef]
- Shaheen, A.M.; Elsayed, A.M.; El-sehiemy, R.A. Optimal Economic–Environmental Operation for AC-MTDC Grids by Improved Crow Search Algorithm. IEEE Syst. J. 2021, 1–8. [Google Scholar] [CrossRef]
- Buch, H.; Trivedi, I.N.; Jangir, P. Moth flame optimization to solve optimal power flow with non-parametric statistical evaluation validation. Cogent Eng. 2017, 4, 1. [Google Scholar] [CrossRef]
- Abdul-hamied, D.T.; Shaheen, A.M.; Salem, W.A.; Gabr, W.I.; El-sehiemy, R.A. Equilibrium optimizer based multi dimensions operation of hybrid AC/DC grids. Alex. Eng. J. 2020, 59, 4787–4803. [Google Scholar] [CrossRef]
- Montoya, O.D. A convex OPF approximation for selecting the best candidate nodes for optimal location of power sources on DC resistive networks. Eng. Sci. Technol. Int. J. 2020, 23, 527–533. [Google Scholar] [CrossRef]
- Bai, X.; Wei, H. A semidefinite programming method with graph partitioning technique for optimal power flow problems. Int. J. Electr. Power Energy Syst. 2011, 33, 1309–1314. [Google Scholar] [CrossRef]
- Dommel, H.W.; Tinney, W.F. Optimal Power Flow Solutions. IEEE Trans. Power Appar. Syst. 1968, 10, 1866–1876. [Google Scholar] [CrossRef]
- Crisan, O.; Mohtadi, M.A. Efficient identification of binding inequality constraints in the optimal power flow Newton approach. IEE Proc. C Gener. Transm. Distrib. 1992, 139, 365–370. [Google Scholar] [CrossRef]
- Santos, A.; da Costa, G.R.M. Optimal-power-flow solution by Newton’s method applied to an augmented Lagrangian function. IEE Proc. Gener. Transm. Distrib. 1995, 142, 33–36. [Google Scholar] [CrossRef]
- Yan, X.; Quintana, V.H. Improving an interior-point-based off by dynamic adjustments of step sizes and tolerances. IEEE Trans. Power Syst. 1999, 14, 709–716. [Google Scholar] [CrossRef]
- El-Sehiemy, R.A.; El Ela, A.A.A.; Shaheen, A. A multi-objective fuzzy-based procedure for reactive power-based preventive emergency strategy. Int. J. Eng. Res. Africa 2015, 13, 91–102. [Google Scholar] [CrossRef]
- Rahli, M.; Pirotte, P. Optimal load flow using sequential unconstrained minimization technique (SUMT) method under power transmission losses minimization. Electr. Power Syst. Res. 1999, 52, 61–64. [Google Scholar] [CrossRef]
- Yan, W.; Yu, J.; Yu, D.C.; Bhattarai, K. A new optimal reactive power flow model in rectangular form and its solution by predictor corrector primal dual interior point method. IEEE Trans. Power Syst. 2006, 21, 61–67. [Google Scholar] [CrossRef]
- Nguyen, T.T. A high performance social spider optimization algorithm for optimal power flow solution with single objective optimization. Energy 2019, 171, 218–240. [Google Scholar] [CrossRef]
- Zhang, J.; Wang, S.; Tang, Q.; Zhou, Y.; Zeng, T. An improved NSGA-III integrating adaptive elimination strategy to solution of many-objective optimal power flow problems. Energy 2019, 172, 945–957. [Google Scholar] [CrossRef]
- Daqaq, F.; Ouassaid, M.; Ellaia, R. A new meta-heuristic programming for multi-objective optimal power flow. Electr. Eng. 2021, 103, 1217–1237. [Google Scholar] [CrossRef]
- Elattar, E.E.; Shaheen, A.M.; Elsayed, A.M.; El-Sehiemy, R.A. Optimal power flow with emerged technologies of voltage source converter stations in meshed power systems. IEEE Access 2020, 8, 166963–166979. [Google Scholar] [CrossRef]
- Riaz, M.; Hanif, A.; Hussain, S.J.; Memon, M.I.; Ali, M.U.; Zafar, A. An optimization-based strategy for solving optimal power flow problems in a power system integrated with stochastic solar and wind power energy. Appl. Sci. 2021, 11, 6883. [Google Scholar] [CrossRef]
- Shaheen, A.M.; Elattar, E.E.; El-Sehiemy, R.A.; Elsayed, A.M. An Improved Sunflower Optimization Algorithm-Based Monte Carlo Simulation for Efficiency Improvement of Radial Distribution Systems Considering Wind Power Uncertainty. IEEE Access 2021, 9, 2332–2344. [Google Scholar] [CrossRef]
- Ginidi, A.R.; Shaheen, A.M.; El-Sehiemy, R.A.; Elattar, E. Supply demand optimization algorithm for parameter extraction of various solar cell models. Energy Rep. 2021, 7, 5772–5794. [Google Scholar] [CrossRef]
- Said, M.; Shaheen, A.; Ginidi, A.; El-Sehiemy, R.; Mahmoud, K.; Lehtonen, M.; Darwish, M. Estimating Parameters of Photovoltaic Models Using Accurate Turbulent Flow of Water Optimizer. Processes 2021, 9, 627. [Google Scholar] [CrossRef]
- Shaheen, A.M.; Ginidi, A.R.; El-Sehiemy, R.A.; Ghoneim, S.S.M. A Forensic-Based Investigation Algorithm for Parameter Extraction of Solar Cell Models. IEEE Access 2021, 9, 1–20. [Google Scholar] [CrossRef]
- Ginidi, A.; Ghoneim, S.M.; Elsayed, A.; El-Sehiemy, R.; Shaheen, A.; El-Fergany, A. Gorilla Troops Optimizer for Electrically Based Single and Double-Diode Models of Solar Photovoltaic Systems. Sustainability 2021, 13, 9459. [Google Scholar] [CrossRef]
- Larrahondo, D.; Moreno, R.; Chamorro, H.R.; Gonzalez-Longatt, F. Comparative performance of multi-period ACOPF and multi-period DCOPF under high integration of wind power. Energies 2021, 14, 4540. [Google Scholar] [CrossRef]
- Wang, Z.; Anderson, C.L. A progressive period optimal power flow for systems with high penetration of variable renewable energy sources. Energies 2021, 14, 2815. [Google Scholar] [CrossRef]
- Pal, P.; Krishnamoorthy, P.; Rukmani, D.; Antony, S.; Ocheme, S.; Subramanian, U.; Elavarasan, R.; Das, N.; Hasanien, H. Optimal dispatch strategy of virtual power plant for day-ahead market framework. Appl. Sci. 2021, 11, 3814. [Google Scholar] [CrossRef]
- Nusair, K.; Alhmoud, L. Application of Equilibrium Optimizer Algorithm for Optimal Power Flow with High Penetration of Renewable Energy. Energies 2020, 13, 6066. [Google Scholar] [CrossRef]
- Atwa, Y.M.; El-Saadany, E.F.; Salama, M.M.A.; Seethapathy, R. Optimal renewable resources mix for distribution system energy loss minimization. IEEE Trans. Power Syst. 2010, 25, 360–370. [Google Scholar] [CrossRef]
- El-Ela, A.A.A.; El-Seheimy, R.A.; Shaheen, A.M.; Wahbi, W.A.; Mouwafi, M.T. PV and battery energy storage integration in distribution networks using equilibrium algorithm. J. Energy Storage 2021, 42, 103041. [Google Scholar] [CrossRef]
- Talatahari, S.; Bayzidi, H.; Saraee, M. Social Network Search for Global Optimization. IEEE Access 2021, 9, 1. [Google Scholar] [CrossRef]
- Shaheen, A.M.; El-Sehiemy, R.A.; Elattar, E.E.; Abd-Elrazek, A.S. A Modified Crow Search Optimizer for Solving Non-Linear OPF Problem with Emissions. IEEE Access 2021, 9, 43107–43120. [Google Scholar] [CrossRef]
- Zimmerman, M.-S.C.R.D. Matpower [Software]. Available online: https://matpower.org (accessed on 22 October 2021).
- Shabanpour-Haghighi, A.; Seifi, A.R.; Niknam, T. A modified teaching-learning based optimization for multi-objective optimal power flow problem. Energy Convers. Manag. 2014, 77, 597–607. [Google Scholar] [CrossRef]
- Shaheen, A.M.; El-Sehiemy, R.A.; Farrag, S.M. A reactive power planning procedure considering iterative identification of VAR candidate buses. Neural Comput. Appl. 2019, 31, 653–674. [Google Scholar] [CrossRef]
- Shaheen, A.M.; El-Sehiemy, R.A. Application of multi-verse optimizer for transmission network expansion planning in power systems. In Proceedings of the International Conference on Innovative Trends in Computer Engineering ITCE 2019, Aswan, Egypt, 2–4 February 2019; pp. 371–376. [Google Scholar] [CrossRef]
- Kumar, A.R.; Premalatha, L. Optimal power flow for a deregulated power system using adaptive real coded biogeography-based optimization. Int. J. Electr. Power Energy Syst. 2015, 73, 393–399. [Google Scholar] [CrossRef]
- El-Fergany, A.A.; Hasanien, H.M. Salp swarm optimizer to solve optimal power flow comprising voltage stability analysis. Neural Comput. Appl. 2020, 32, 9. [Google Scholar] [CrossRef]
- Gupta, S.; Kumar, N.; Srivastava, L. Bat Search Algorithm for Solving Multi-objective Optimal Power Flow Problem. Lect. Notes Electr. Eng. 2019, 553, 347–362. [Google Scholar] [CrossRef]
- Bouchekara, H. Solution of the optimal power flow problem considering security constraints using an improved chaotic electromagnetic field optimization algorithm. Neural Comput. Appl. 2020, 32, 7. [Google Scholar] [CrossRef]
- Ghasemi, M.; Ghavidel, S.; Ghanbarian, M.M.; Gharibzadeh, M.; Vahed, A.A. Multi-objective optimal power flow considering the cost, emission, voltage deviation and power losses using multi-objective modified imperialist competitive algorithm. Energy 2014, 78, 276–289. [Google Scholar] [CrossRef]
- El-sattar, S.A.; Kamel, S.; Ebeed, M.; Jurado, F. An improved version of salp swarm algorithm for solving optimal power flow problem. Soft Comput. 2021, 25, 5. [Google Scholar] [CrossRef]
- Abaci, K.; Yamacli, V. Differential search algorithm for solving multi-objective optimal power flow problem. Int. J. Electr. Power Energy Syst. 2016, 79, 1–10. [Google Scholar] [CrossRef]
- Khunkitti, S.; Siritaratiwat, A.; Premrudeepreechacharn, S. Multi-objective optimal power flow problems based on slime mould algorithm. Sustainability 2021, 13, 7448. [Google Scholar] [CrossRef]
- Shaheen, A.M.; Farrag, S.M.; El-Sehiemy, R.A. MOPF solution methodology. IET Gener. Transm. Distrib. 2017, 11, 570–581. [Google Scholar] [CrossRef]
- Pulluri, H.; Naresh, R.; Sharma, V. A solution network based on stud krill herd algorithm for optimal power flow problems. Soft Comput. 2018, 22, 159–176. [Google Scholar] [CrossRef]
- El-Ela, A.A.A.; El-Sehiemy, R.A.; Shaheen, A.M.; Eissa, I.A. Optimal coordination of static VAR compensators, fixed capacitors, and distributed energy resources in Egyptian distribution networks. Int. Trans. Electr. Energy Syst. 2020, 30, e12609. [Google Scholar] [CrossRef]
Publisher’s Note: MDPI stays neutral with regard to jurisdictional claims in published maps and institutional affiliations. |
© 2021 by the authors. Licensee MDPI, Basel, Switzerland. This article is an open access article distributed under the terms and conditions of the Creative Commons Attribution (CC BY) license (https://creativecommons.org/licenses/by/4.0/).