Abstract
Based on the panel data of 41 cities in the Yangtze River Delta region from 2006–2018, this paper constructed an index system of measuring green urban land use efficiency (green land use efficiency), including input-expected output-unexpected output (input-expected output-unexpected output) and used the unexpected output-SBM model to calculate the green land use efficiency of the region. The spatial and temporal evolution characteristics of urban land green use efficiency in this area were studied by the Dagum Gini coefficient, decomposition, and exploratory spatial data analysis. The results show that (1) the temporal evolution characteristics of green land use efficiency in the whole region of the Yangtze River Delta, provinces (municipalities directly under the central government), and cities all show an upward trend of fluctuation. Among them, the green land use efficiency of the whole region is between 0.258 and 0.377, the gap in the green land use efficiency of the provinces (municipalities directly under the central government) is accelerating, and the green land use efficiency of the cities is gradually advancing to the middle and high efficiency areas. (2) Spatial evolution: On the one hand, the spatial difference in the green use efficiency of urban land in this region is gradually expanding. On the other hand, the green use efficiency of urban land in this region has a significant positive spatial correlation, the agglomeration pattern is dominated by high agglomeration and low agglomeration, and the low high agglomeration is supplemented.
1. Introduction
China’s economy is in the transition period from “high-speed” development to “high-quality” development. The Fifth Plenary Session of the 19th CPC Central Committee proposed “promoting green development and promoting harmonious coexistence between human and nature”, in which “green development” is an indispensable part of “high-quality development”. The so-called green development refers to sustainable development in line with the requirements of ecological protection and environmental friendliness. It is required to realize low-carbon, environmental protection and the efficient utilization of production factors in each development link. As one of the most important means of production, land is the material basis of all economic and social elements and also the space carrier of economic and social development. It should play an important role in green development. This requires the implementation of the concept of harmonious coexistence and sustainable development between man and nature in the process of land use and the realization of the unity of economic and ecological benefits of land use. This process is defined as green land use [1]. Along with the process of urbanization in China, urban construction land is rapidly expanding. At the same time, it is facing the dilemma of total shortage, disordered utilization planning, high pollution, and low efficiency, which have become the shackles of the comprehensive green transformation of economic society.
The Yangtze River Delta is one of the regions with the most developed economy in China, the highest level of urbanization, the highest concentration of high-end talents, and the strongest innovation ability, but the contradiction between people and land is particularly serious. The shortage of land resources, serious pollution, low utilization efficiency, and multiple other problems restrict the pace of green development in the Yangtze River Delta. In order to change the current situation of development and pollution, the region actively seeks the practice road of coordinated development of ecological environment protection and economic and social progress. In order to improve the efficiency of land use, we should develop the leading area of ecological and green integration in the Yangtze River Delta, promote space sharing, and so on. However, with the development of practice, the traditional method of measuring land use efficiency only from the economic point of view cannot meet the demand, and it is necessary to increase the ecological perspective, including the concept of green development. Therefore, it is necessary to measure the green efficiency of urban land in Yangtze River Delta and explore its change trend. Therefore, we must use a reasonable measurement system to explore the efficiency of urban land green use in the Yangtze River Delta in order to promote the efficient and green use of urban land in the Yangtze River Delta.
Integrating the concept of green development into the process of urban land use and its quantitative analysis is the premise and basis for improving the efficiency of urban land green use and realizing the coordinated development of economic growth and environmental protection. It is also a hot topic in economics, management, and land science. The research of land use efficiency starts from theoretical research and gradually develops to empirical analysis. In the theoretical research stage, scholars mainly focus on the influencing factors of land use efficiency [2,3], index systems [4], path selection [5], and management systems [6]. In the empirical research stage, with the deepening of the research, the calculation method of land use efficiency is more scientific, the connotation is constantly enriched, and the research angle is more extensive. The calculation method of land use efficiency mainly experienced three stages: the single index method, the multi-index method, and the DEA model [7,8,9,10,11]. At present, the improved non-radial, non-angle, and non-expectation SBM model based on the traditional DEA model has become the mainstream method to measure multi-objective land use efficiency. The connotation of land use efficiency is further enriched, and the concept of green land use efficiency emerges as the times require and has become the research focus of relevant scholars [12,13,14]. As the concept of land green use efficiency is put forward and the calculation method is improved, the spatial-temporal differences and the sources of differences of green land use efficiency have become the focus of further research. Scholars use the Dagum Gini coefficient [15], exploratory spatial data analysis [16], the Theil index [17], kernel density estimation [18], and other methods to analyze the spatial-temporal evolution and difference degree of urban land use efficiency at different spatial scales.
At present, some scholars have carried out relevant research on the urban land use efficiency in the Yangtze River Delta [19,20,21], but no research has been carried out on the green land use efficiency of all 41 cities in the Yangtze River Delta, and no scholars have used the Dagum Gini coefficient and decomposition method to analyze the differences and sources of green land use efficiency in the Yangtze River Delta. Therefore, this paper constructs the measurement index system of “input expected output unexpected output” of green urban land use efficiency, calculates the land use efficiency of all cities in the Yangtze River Delta, and studies its spatial-temporal evolution characteristics by using the Dagum Gini coefficient, decomposition, and exploratory spatial data analysis.
2. Research Area, Indices Selection, and Methods
2.1. Research Area
The Yangtze River Delta includes 41 cities in Shanghai, Zhejiang, Jiangsu, and Anhui provinces (municipalities directly under the central government, the same below), according to the 2019 Outline of the Yangtze River Delta Regional Integrated Development Plan, which was recently approved by the State Council.
In order to effectively investigate the green use efficiency of urban land in the Yangtze River Delta, in this paper, the 27 central districts of Shanghai, Nanjing, Hangzhou, Suzhou, Wuxi, Changzhou, Nantong, Yangzhou, Zhenjiang, Yancheng, Taizhou, Ningbo, Wenzhou, Huzhou, Jiaxing, Shaoxing, Jinhua, Zhoushan, Hefei, Taizhou, Wuhu, Ma ‘anshan, Tongling, Chuzhou, Anqing, Chizhou, Xuancheng, as well as Xuzhou, Huai ‘an, Quzhou, Lishui, Lianyungang, Suqian, Bengbu, Huangshan, Huaibei, Huainan, Suzhou, Lu ‘an, Haozhou, Fuyang and 14 non-central city districts as the study area.
2.2. Indices Selection and Data Sources
The term “green development” was first put forward by the British economist David, emphasizing a model of economic development that does not cost the depletion of natural resources. At present, the academic community has reached a basic consensus on the connotation of green development mode, that is, “green development is a sustainable development mode that not only pursues greater economic benefits but also requires the maximum reduction of consumption”. Therefore, according to the connotation of green development and the experience of existing literature, the green efficiency of urban land is calculated, which should not only consider the economic output but also consider the pollution emission. Therefore, this paper takes land, capital, and labor as input indicators. Gross regional product is an indicator of expected output; the discharge of three wastes is an undesired output index; and the measurement index system of “input-expected output-unexpected output” is constructed. This system takes into account the ecological environment capacity and resource carrying capacity while considering the economic development and can measure the green use efficiency of urban land in the Yangtze River Delta more comprehensively and scientifically. Therefore, the following indices were selected for calculation in this paper:
(1) Input index. According to the theory of “three factors of production” put forward by the economist Say, the input of urban production system mainly includes the characteristics of land, capital, and labor. It is of more practical significance to consider the input index from the three aspects of land, capital, and labor [22]. The specific situation of input indicators is as follows: ① Land input (urban construction land area /km2). ② Capital factor investment (fixed investment in municipal districts/CNY 10,000). ③ Labor input factors (total number of employees in urban units and urban private and self-employed employees/person). In addition, in order to eliminate the impact of inflation and increase the comparability of data, this paper uses the GDP deflator based on the year 2000 to treat the fixed investment of municipal districts. Similarly, the “gross regional product of municipal districts”, the expected output index below, is treated in the same way.
(2) Expected output index. This index measures the “benefits” generated in the process of urban land use from the perspective of economic output, and the gross regional product is the most representative and comprehensive economic index. In addition, since the green use efficiency of land within a city is calculated, the “gross regional product of a municipal district” is chosen to represent the expected output.
(3) Unexpected output index. This indicator measures the “load” caused by the use of urban land from the perspective of green development. Industrial pollution is the most important pollution to the city, so the three indicators of “industrial sulfur dioxide emissions/ton, industrial dust emissions/ton, industrial wastewater emissions/ton” are chosen to represent the undesired output.
The data span of this paper is 13 years, which is determined by the degree of practice of the green development concept in China and the speed of data update. The data in this paper are based on China Statistical Yearbook, China Urban Statistical Yearbook, and China Construction Statistical Yearbook from 2007 to 2019. Urban geospatial location information is extracted with GeoDA software. Among them, the missing data of some cities are obtained by deductive calculation. Finally, the 13-year panel data of 41 cities are sorted out.
2.3. Research Methods
2.3.1. Unexpected Output SBM Model
The non-radial and non-angle undesired SBM model was proposed by Tone. The model puts the slack variable directly into the objective function [23,24], on the one hand, it solves the problem of input–output slackness, and on the other hand, it also solves the problem of efficiency evaluation in the presence of undesired output [25]. In the process of land use, there are expected outputs and undesired outputs at the same time. Therefore, this paper adopts the undesired output SBM model to calculate the green use efficiency of urban land in the Yangtze River Delta. In this way, a more comprehensive evaluation of the green land use efficiency of the cities in the region can be achieved.
The unexpected output SBM model assumes that the production system has n decision units, and each unit can calculate the green use efficiency of urban land in a certain region in a certain year. Each decision-making unit has m type input, type expected output and type unexpected output. This unit can be expressed as: . The matrix that defines input, expected output, and non-expected output is expressed as:
So, the production set can be expressed as:
where is a weight vector, and represents constant returns to scale. In this study, the undesired output SBM model of a specific decision unit is expressed as:
In the formula, and represent the relaxation variables of input, expected output, and non-expected output, respectively. The objective function ρ represents the urban land green use efficiency to be calculated, which is strictly decreasing with respect to and , the value is between 0 and 1. When is 1, it is proven that the green use of urban land in this year is efficient, and the rest is lack of efficiency, which still needs to be improved.
2.3.2. Dagum Gini Coefficient and Decomposition Method
The Dagum Gini coefficient and its decomposition are the Gini coefficient proposed by Dagum and its subgroup decomposition method [26]. Using this method, the differences between regions and within regions can be explored, and the overall Gini coefficient can be divided into three types: intra-regional difference contribution , inter-regional difference contribution , and supervariable density contribution . At present, Dagum Gini coefficient and its decomposition method have been used to analyze various differences [27,28]. Therefore, this method is suitable for preliminary exploration of urban land use efficiency differences in the Yangtze River Delta as a whole, between provinces, and within provinces [29,30]. Dagum Gini coefficient and its decomposition formula are as follows:
Formula (3) is the formula for the calculation of the Gini coefficient. is the green urban land use efficiency in province . cities in Yangtze River Delta is the average of the green land use efficiency, n is the number of cities, n is the number of the Yangtze River Delta provinces. is the number of cities in the province of . Formula (4) is the ranking of the provinces according to the mean value of the green use efficiency of urban land in the provinces before the decomposition of the Gini coefficient. Equations (5) and (6) represent the intra-regional Gini index of province and the inter-regional Gini coefficient of , and provinces, respectively. Equations (7)–(9) calculate intra-regional difference contribution, inter-regional difference contribution, and super-variable density contribution, respectively. According to the decomposition method of Gini coefficient, the following formula can be obtained as follows: . The influence of provinces on the relative green use efficiency of urban land is defined as Equation (10), in which the calculation of and are shown in Equations (11) and (12).
2.3.3. Exploratory Spatial Data Analysis
In this paper, the exploratory spatial data analysis (ESDA) method of global spatial autocorrelation and local spatial autocorrelation was used to measure the spatial evolution of urban land green use efficiency in the Yangtze River Delta
(1) Global spatial autocorrelation analysis. Global spatial autocorrelation can describe the global spatial relationship of all units in the study space. In this paper, it is used to analyze the overall spatial change of urban land green use efficiency in the Yangtze River Delta region. At present, Moran’s I(Moran index) statistic is used to analyze the spatial autocorrelation of land green use efficiency. Its calculation formula is as follows:
where represents the observed value of city , n is the number of cities, and w is the spatial weight matrix. Moran’s I is between −1 and 1. When , it indicates a positive correlation between cities, and the closer it is to 1, the stronger the positive correlation is. When , it indicates a positive correlation between cities, and the closer it is to −1, the stronger the negative correlation will be. When , it means that there is no spatial autocorrelation between regions.
(2) Local space autocorrelation analysis. Local spatial autocorrelation can distinguish different correlation patterns that may exist due to spatial location changes. In this way, we can investigate the local unevenness of space and explore the spatial heterogeneity between data. Due to spatial instability, global autocorrelation analysis is difficult to accurately reflect local spatial correlation, so local Moran’s I is used to explore the local characteristics of urban land green use efficiency in the Yangtze River Delta region. Its formula is as follows:
where and are the observed values after standardization, and is the elements of the spatial weight matrix after standardization. The range of local Moran’s I is not limited to −1 to 1. In this study, when is significantly positive and , it means that the green land use efficiency of the city and its neighbors is higher than the average level, which belongs to high agglomeration. When is significantly positive and , it means that the green land use efficiency of and its neighbors is lower than the average level, which belongs to low agglomeration. When is significantly negative and , it means that the green land use efficiency of neighboring cities is much lower than that of cities , which belongs to high agglomeration. When Ii is significantly negative and, it means that the green land use efficiency of neighboring cities is much higher than that of cities i, which belongs to low–high agglomeration.
3. Result Analysis
This part is based on the calculation of the SBM undesirable model for the green use efficiency of urban land in the Yangtze River Delta from 2006–2018 and analyzes its change characteristics from the perspectives of time and space. The time series analysis is carried out from the three dimensions of the region as a whole, the province, and the city; the spatial evolution analysis is divided into two parts: the spatial difference and the correlation of the urban land green use efficiency.
3.1. Analysis of Time Series Change
First of all, on the whole, the average value of green urban land use efficiency in the Yangtze River Delta presents a fluctuating upward trend, with a range from 0.2 to 0.4 (Figure 1). On the one hand, this shows that with the deepening of the green concept, the land green use efficiency within the urban area has been steadily improving; on the other hand, it also reveals the problem that the overall value of land green use efficiency is low and needs to be greatly improved. In addition, the change in urban land green use efficiency in the Yangtze River Delta can be divided into three stages. The first stage was from 2006–2009, when China put forward and vigorously implemented the “energy saving” emission reduction measures for the first time. During this period, due to the rapid reduction of “three wastes” emissions, the overall green use efficiency of urban land in the region rose rapidly. The second stage is from 2010 to 2016. In this stage, the green use efficiency of urban land maintained at about 0.3 after a rapid decline. Due to the prominent problems such as the slowdown of economic growth and the reduction in production benefits of enterprises, the green land use efficiency has returned to a more stable mode. The third stage is from 2017 to 2018. With the improvement of the “energy conservation and emission reduction” system, the market environment and the optimization of the economic development structure, the green use efficiency of urban land increases rapidly once again after energy storage.
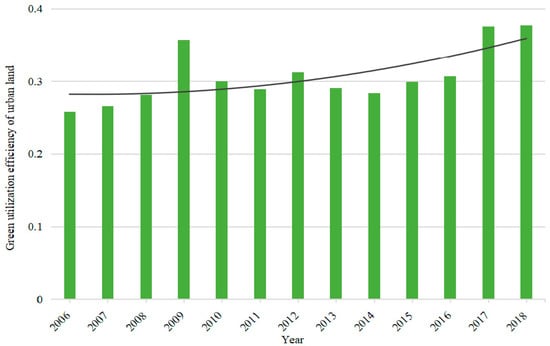
Figure 1.
Urban land green use efficiency in the Yangtze River Delta region from 2006–2018.
Secondly, from the dimension of each province, its change trend follows the change trend of the whole region, showing a fluctuating upward trend (Figure 2). The green use efficiency of urban land in Shanghai has been in the leading position for a long time. Although it declined rapidly from 2010–2011, it rose rapidly in the following years and surpassed the previous level, completely opening up a gap with other provinces in the Yangtze River Delta. In the past three years, the efficiency value has been maintained above 0.7. The green use efficiency of urban land in Anhui Province is the lowest in the Yangtze River Delta region, fluctuating between 0.2 and 0.3 and even decreasing in the recent two years. The change trend of green land use efficiency of cities in Zhejiang Province and Jiangsu Province is roughly the same. Its change trend can be divided into three stages as the whole change trend. The first stage was from 2006–2009. Both provinces grew at a rapid rate and reached a small peak in 2009. The green land use efficiency of Zhejiang Province exceeded 0.45, while that of Jiangsu Province approached 0.43. In the second stage, from 2010–2016, the two provinces experienced a rapid rise after a lack of momentum, resulting in the efficiency growth being reversed and entering a long period of decline. The third stage is from 2017 to 2018. In these two years, the rising channel of green urban land use efficiency in the two provinces was opened, and it quickly recovered to or exceeded the highest state.
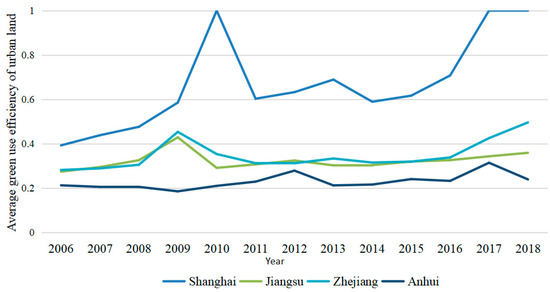
Figure 2.
Average value of urban land green use efficiency of each province in the Yangtze River Delta from 2006–2018.
Finally, the results are analyzed from the perspective of city. Here, this paper presents the urban land green use efficiency of 41 cities in the Yangtze River Delta region in 2006, 2012, and 2018 through tables to analyze the results. In order to facilitate comparison, the natural breakpoint method was adopted to divide the table into a low efficiency zone (0.07–0.326), a medium efficiency zone (0.326–0.632), and a high efficiency zone (0.632–1). It can be seen from the following table (Table 1) that the green land use efficiency of all cities in the Yangtze River Delta region is less and less in the low-efficiency zone, and more and more in the medium-efficiency zone.

Table 1.
Green land use efficiency of cities in Yangtze River Delta in 2006, 2012–2018.
3.2. Analysis of Spatial Evolution
3.2.1. Dagum Gini Index and Decomposition Results
In order to investigate the spatial differences and sources of urban land green use efficiency in the Yangtze River Delta region, a province was first divided into a subgroup. Based on the Dagum Gini coefficient and decomposition method, the Gini coefficient of green urban land use efficiency from 2006–2018 was calculated and decomposed. The results are as follows (Table 2).
Table 2.
The Dagum Gini coefficient and its decomposition results of land green use efficiency in the Yangtze River Delta region from 2006–2018.
1. The overall regional difference and evolution trend of the spatial distribution of urban land green use efficiency in the Yangtze River Delta. As can be seen from Figure 3, the Gini coefficient of urban land use efficiency in the Yangtze River Delta region shows an upward trend, fluctuating between 0.17 and 0.35. Based on 2006 and 2012, the difference of urban land use efficiency increased by 4.98% and 3.21% annually, respectively. At the same time, in the process of the overall rise, local fluctuations are larger.
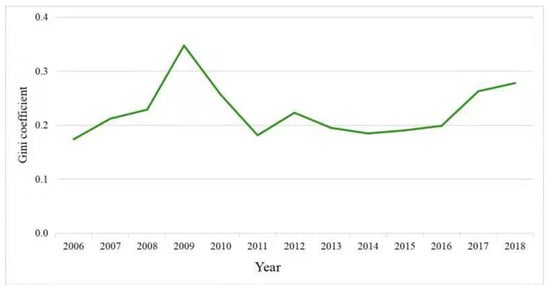
Figure 3.
Overall Gini Coefficient in the Yangtze River Delta Region from 2006–2018.
2. Decomposition of regional differences in green use efficiency of urban land.
(1) Intra-regional differences in green use efficiency of urban land. Figure 4 describes the intra-provincial differences in green urban land use efficiency in the provinces of the Yangtze River Delta (except Shanghai). On the whole, the Gini coefficient within each province is not high, indicating that there is little difference in the green use efficiency of urban land within each province. In terms of subdivision, the fluctuation of regional Gini coefficient in Zhejiang Province is the most severe, showing a pattern of increasing first, decreasing, and then increasing again. The intra-regional Gini coefficient of Jiangsu Province showed a trend of increasing at first and then decreasing. After the increase from 2006–2009, the intra-regional Gini coefficient of Jiangsu Province gradually decreased at an average annual rate of 5.7%. The overall value of Gini coefficient in Anhui Province is the lowest among the three provinces, but the fluctuation is the most frequent, which indicates that the difference in urban land use efficiency among cities in Anhui Province is small and the change range is narrow.
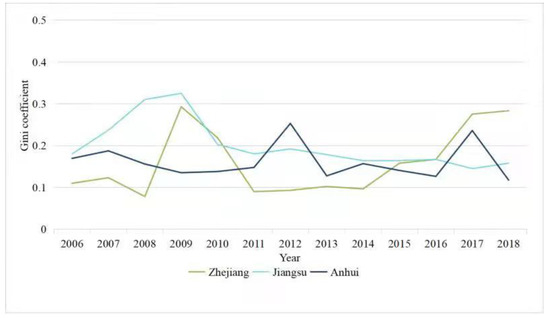
Figure 4.
Intra-Gini Coefficient of Yangtze River Delta Region from 2006–2018.
(2) Regional differences in green use efficiency of urban land. Figure 5 describes the differences of urban land green use efficiency among provinces in the Yangtze River Delta. From the perspective of overall evolution trend, although the values of Gini coefficient in different regions are different, the trends are similar. The first wave peaks between provinces and regions concentrated in 2009 and 2010. After a collective rapid decline, small peaks appeared in 2012 and 2013, and then divergent trends emerged. In addition, compared with 2006, the gap in the green urban land use efficiency in all provinces is widening, in which the gap between Anhui and Jiangsu is the smallest and that between Anhui and Shanghai is the largest. From the point of view of the value, the Gini coefficient between Shanghai and other provinces in the region is high, among which the Gini coefficient between Anhui Province and Shanghai is the highest. Except Shanghai, the Gini coefficient among the other three provinces is relatively small, among which Jiangsu and Zhejiang have the lowest Gini coefficients.
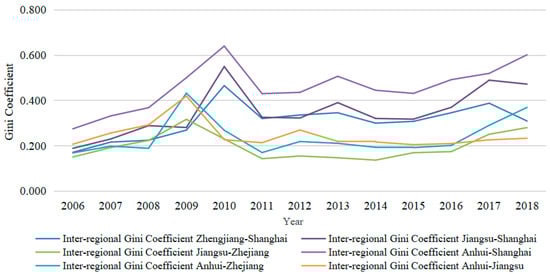
Figure 5.
Inter-regional Gini Coefficient in the Yangtze River Delta from 2006–2018.
(3) Regional differences and contribution rates of green urban land use efficiency. As can be seen from Figure 6, during the research period, the difference in the urban land use efficiency in the Yangtze River Delta region was mainly caused by the differences among provinces, with an average contribution rate of 48.09%. The second is the contribution of superdensity, and the average contribution rate is 27.32%. Finally, the difference between cities within the province, the average contribution rate is 24.59%. Among these three types of contributions, the contribution rate of intra-regional differences is the most stable, while the contribution rate of inter-regional differences and the contribution rate of superdensity fluctuate greatly and tend to run in opposite directions.
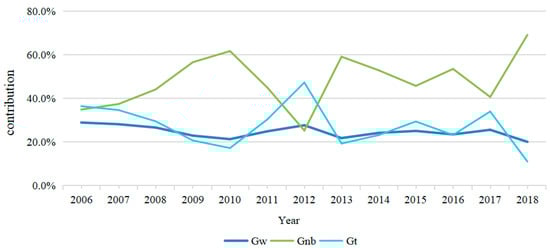
Figure 6.
Contribution rate of green use efficiency difference of urban land in the Yangtze River Delta region from 2006–2018.
3.2.2. Exploratory Spatial Data Analysis Results
Using GeoDA software, the regional and regional Moran’s I of the green use efficiency of urban land in the Yangtze River Delta region from 2006–2018 are calculated and analyzed, and the results are as follows.
(1) Analysis of global spatial evolution. The regional Moran’s I passed the test at the significance level of 5%, and its value ranged from 0.070–0.354, indicating that there was a significant and positive spatial autocorrelation in the green use efficiency of urban land in the Yangtze River Delta. It can be seen from Figure 7 that the change trend of Moran’s I is an overall increase and a local fluctuation, which indicates that there is not only spatial dependence but also spatial heterogeneity among the green use efficiency of land in different regions. During 2006–2009 and 2011–2012, Moran’s I decreased at a relatively fast rate, indicating that the spatial difference and correlation of urban land green use efficiency in the Yangtze River Delta were increasing and weakening in these periods. Moran’s I increased at a fast rate in three periods of 2008–2011, 2012–2013, and 2016–2018, indicating that the spatial correlation of the green urban land use efficiency in the Yangtze River Delta region was continuously enhanced, while the differences were gradually weakened during these periods. In particular, after the release of the “Yangtze River Delta Urban Agglomeration Development Plan” in 2016, Anhui Province was included in the Yangtze River Delta region, and the integration degree of the Yangtze River Delta region continued to deepen. Moran’s I also rose rapidly and continued to break new highs, and the mutual influence of the green land use efficiency between cities was strengthened.
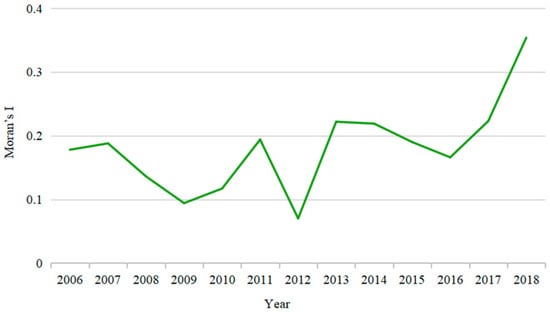
Figure 7.
Moran’s I index of the Yangtze River Delta region from 2006–2018.
(2) Analysis of local spatial evolution. Since global Moran’s I is difficult to reflect the specific characteristics of local space, local Moran’s I is used to study the spatial agglomeration pattern in the Yangtze River Delta. The figure below shows the agglomeration pattern of the Yangtze River Delta in 2006, 2010, 2014, and 2018.
It can be seen from Figure 8 that there are three types of agglomeration in the Yangtze River Delta: high agglomeration, low–low agglomeration, and low–high agglomeration. The specific characteristics are high agglomeration, low agglomeration into block distribution, and low and high agglomeration sporadic distribution. During the study period, the number of high-concentration cities stabilized between 3 and 5, mainly Shanghai, Suzhou, Jiaxing, and other economically developed cities. These cities not only have a high level of green land use efficiency but also have a strong positive influence on the green land use efficiency of the surrounding cities, and the spatial spillover effect is significant. The low–low agglomeration is the most widely distributed among the four agglomeration types and has an upward trend. Low and low agglomerations are mainly distributed in the northwest of the Yangtze River Delta, and most of these cities are marginal cities not included in the Yangtze River Delta urban agglomeration. Although the low–high agglomeration pattern of cities is not fixed, most of them are central cities with higher economic levels. The lack of the ability to receive a diffusion effect is the main reason why these cities cannot catch up with the green land use efficiency of surrounding cities.
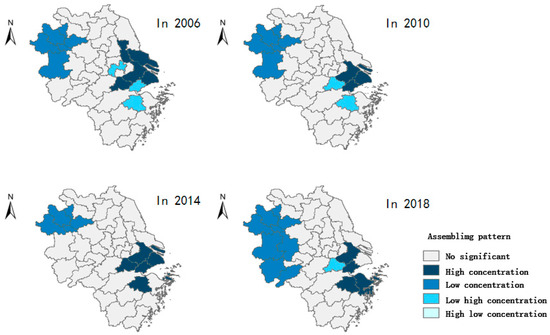
Figure 8.
LISA cluster map in the Yangtze River Delta.
4. Conclusions
Based on the calculated green use efficiency of urban land in the Yangtze River Delta region, this paper analyzes the spatiotemporal evolution characteristics of green use efficiency of urban land in this region by using Dagum Gini coefficient and decomposition method and exploratory spatial data analysis method and comes to the following conclusions:
(1) From the perspective of overall temporal evolution, the overall green use efficiency of urban land in the Yangtze River Delta increased from 0.258 in 2006 to 0.377 in 2018, with a slight fluctuation during the period. As of 2018, it is still at a low level and has great potential for improvement.
(2) From the perspective of local time series evolution, the evolution characteristics of the green urban land use efficiency of all provinces in the Yangtze River Delta region are different. However, the overall trend is consistent with the regional trend. However, the overall trend is consistent with the regional trend.
① The efficiency of green land use in Shanghai increased rapidly and widened the gap with that of other provinces. As a super first-tier city in China, relying on the advantages of its economy, systems, and technology, Shanghai has continuously improved its green urban land use efficiency and has become the “leader” in improving urban land green use efficiency in the Yangtze River Delta region [31,32,33].
② The evolution characteristics of the green land use efficiency in Zhejiang Province and Jiangsu Province are similar, that is, the green land use efficiency in Zhejiang Province fluctuates at a slightly higher level than the overall level, and the increase rate is higher than the overall increase rate. Jiangsu and Zhejiang provinces are both located in the core area of the Yangtze River Delta, and both are representatives of the developed regions in China, with similar industrial structure [34]. The “two wings” of the improvement of the overall green urban land use efficiency in the Yangtze River Delta region dominate the development speed of the green urban land use efficiency in this region.
③ The green use efficiency of urban land in Anhui province increased slightly under the overall growth level. In the short term, this change has become an obstacle to the rapid improvement of urban land green use efficiency in this region. However, in the long term, Anhui Province, on the one hand, has undertaken relatively low-end industries in Jiangsu, Zhejiang, and Shanghai, and optimized the overall industrial layout and resource allocation of the region. On the other hand, it increases the development hinterland of the Yangtze River Delta region, which is the future growth point of the green urban land use efficiency in the Yangtze River Delta region [35,36]. From the inter-city level, more and more cities such as Hefei and Lishui have got rid of the low-efficiency state of urban land green use efficiency and entered the medium-efficient area. The inter-city difference is narrowing continuously, which makes the pattern of land green use efficiency in the Yangtze River Delta region optimize to some extent. From the perspective of inter-city level, more and more cities in the Yangtze River Delta region have gotten rid of the low efficiency of the green urban land use efficiency and entered the medium-high efficiency area. The inter-city differences are narrowing, and the pattern is constantly optimized.
(3) From the perspective of the difference of spatial evolution, the difference of the overall green urban land use efficiency in the Yangtze River Delta region is gradually expanding. The Dagum Gini coefficient and decomposition results show that the gap between developed and relatively backward provinces is getting bigger and bigger, which is the main source of the overall regional differences, while the intra-provincial differences are small and trend, and the contribution is less. Economically developed regions have absolute advantages in “hardware” construction (infrastructure construction, public service facilities, etc.) and “software” construction (institutional environment and public service level, etc.). These advantages are the acceleration of the ability to transform the green development concept into green development, which can enable the cities with advantages to realize the improvement of green land use efficiency more quickly, thus opening a gap with other regions. Cities in the same province are more likely to have the same economic development and policy environment, so the efficiency of green land use is more similar.
(4) From the perspective of correlation of spatial evolution, the green use efficiency of urban land in the Yangtze River Delta region has a significant and positive global spatial autocorrelation, and this correlation increases gradually with the deepening of the integration degree of the Yangtze River Delta. In the Yangtze River Delta, there are two main agglomeration patterns: high agglomeration and low agglomeration, which are respectively distributed in the regions with the strongest comprehensive strength and the weakest comprehensive strength. Developed cities such as Shanghai and Suzhou have worked together to promote industrial upgrading, eliminate backward production capacity, learn from effective policies, protect the ecological environment, bring positive externalities to each other, and form a high concentration of urban land green utilization efficiency. However, less developed areas such as Lu‘an City and Fuyang City in the northwest of the Yangtze River Delta region have attracted a number of enterprises with high energy consumption and high pollution due to relatively loose environmental management policies, which promotes the improvement of local economic development level, but at the same time, leads to the low efficiency of land green use, thus forming a low–low agglomeration pattern. The spatial distribution of low–high agglomeration is not obvious, and these cities often find it difficult to accept the positive benefits of efficient cities and even suffer negative effects.
5. Policy Recommendations
(1) We should actively promote the integration of the Yangtze River Delta and comprehensively improve the green utilization efficiency of urban land. The Yangtze River Delta region is a community of economy, society, and ecological environment. The ecological environments are dependent on each other, and the ecological services are shared. Improving the green urban land use efficiency of the region as a whole will give full play to the “holistic thinking”, together with the concept of “green water castle peak is the jinshan silver” as a guide, planning to break apart, overlapping conflict situation, through the methods of environment pollution co-government, backward infrastructure co-construction and sharing, overall upgrade to industry to promote the efficiency of the whole green urban land use.
(2) It is necessary to fully tap the potential of each region, make up for its strengths, and realize the optimization of the green utilization efficiency of urban land in the region. The development level of the three provinces and one city in the Yangtze River Delta region is different, so it is necessary to effectively tap the potential of each region, give full play to their advantages, and jointly improve the efficiency of green land use in the Yangtze River Delta region. Shanghai is open to the outside world at a high level, is capital and technology intensive, mainly develops high-yield, low-pollution happy technology industries, and its green land utilization efficiency has been at a high level for a long time. Therefore, we should give full play to the leading role and guide the direction of regional development. Both Zhejiang and Jiangsu provinces are big manufacturing provinces with the developed economy. While high-tech industries and strategic emerging industries are developing vigorously, the problem of insufficient development quality is still prominent. Therefore, we should take innovation as the first priority of the manufacturing industry, actively explore a new mode of innovation-driven manufacturing development, give full play to the pulling and lifting role of the two wings, and exchange higher technology for lower pollution. With abundant labor resources and urbanization in Anhui province, there is huge potential to develop land resources are relatively more, should give full play to the advantage of backwardness, actively undertake the industrial transfer of the Jiangsu region but also to strengthen the construction of urban infrastructure and public service facilities and pay attention to improving the management of urban land use and environmental pollution. We must not ignore environmental protection for the sake of pursuing economic benefits, which will lead to the low efficiency of land green benefits.
(3) It is necessary to explore the development mode of high-efficiency areas driving low-efficiency areas and promote the common growth of green urban land use efficiency. At present, there are obvious differences in the efficiency of urban land green use among provinces in the Yangtze River Delta. Therefore, the association among provinces should be strengthened. The efficient provinces can help the inefficient ones improve their efficiency through industrial cooperation, policy sharing, technology, and talent support. On the one hand, this can speed up the efficiency improvement in the low-efficiency areas, solve the “pain point” of the low level of urban land green use efficiency in the Yangtze River Delta, and on the other hand, it can promote the coordinated development of green land use efficiency in the whole region.
Author Contributions
Conceptualization, Q.L. and H.L.; methodology, Q.L. and H.L.; software, Q.L. and H.L.; validation, Q.L., and H.L.; formal analysis, Q.L. and H.L.; investigation, Q.L. and H.L.; resources, Q.L. and H.L.; data curation, Q.L. and H.L.; writing—original draft preparation, Q.L. and H.L.; writing—review and editing, Q.L. and H.L.; visualization, Q.L. and H.L.; supervision, Q.L. and H.L.; project administration, Q.L. and H.L.; funding acquisition, Q.L. and H.L. All authors have read and agreed to the published version of the manuscript.
Funding
The project was supported by the Fundamental Research Funds for the Central Universities, China University of Geosciences (Wuhan) (No. CUG190268).
Institutional Review Board Statement
Not applicable.
Informed Consent Statement
Not applicable.
Data Availability Statement
The datasets used during the current study are available from the corresponding author on reasonable request.
Conflicts of Interest
The authors declare that they have no competing interest.
References
- Tao, L.L.; Jun, Y.Y.; Guang, Y.C. Measurement of urban land green use efficiency and its spatial differentiation characteristics: An Empirical Study Based on 284 cities above prefecture level. China Land Sci. 2019, 33, 80–87. [Google Scholar]
- Verburg, P.H.; Berkel, D.B.V.; Doorn, A.M.V.; van Eupen, M.; van den Heiligenberg, H.A.R.M. Trajectories of land use change in Europe: A model—Base exploration of coral futures. Landsc. Ecol. 2010, 25, 217–232. [Google Scholar] [CrossRef]
- Chen, R. Theory of urban land use efficiency. Urban Plan. Trans. 1995, 4, 28–33+63. [Google Scholar]
- Fang, X. Study on index system and method of land use efficiency measurement. Syst. Eng. 2004, 12, 22–26. [Google Scholar]
- Sun, Y.; Yao, X. Path selection for improving urban land use efficiency. Economist 2002, 12, 50–51. [Google Scholar]
- Ma, Y. Discussion on the efficiency of land use control system. J. Shandong Univ. Technol. (Soc. Sci. Ed.) 2002, 6, 26–31. [Google Scholar]
- Li, Y.; Shu, B.; Wu, Q. Urban land use efficiency in China: Spatial and temporal characteristics, regional disparity and influencing factors. Econ. Geogr. 2014, 34, 133–139. [Google Scholar]
- Wang, Y.; Song, G. Comprehensive benefit evaluation and case study of urban land use. Geogr. Sci. 2006, 6, 743–748. [Google Scholar]
- Bao, X.; Liu, C.; Zhang, J. Comprehensive evaluation of urban land use efficiency. Urban Issues 2009, 4, 46–50. [Google Scholar]
- Yang, K.; Wen, Q.; Zhong, T. Evaluation of urban land use efficiency in the Yangtze river economic belt. Resour. Sci. 2018, 40, 2048–2059. [Google Scholar]
- Zhang, Z. Study on urban land use efficiency in China. J. Quant. Tech. Econ. 2014, 31, 134–149. [Google Scholar]
- Li, C.; Hu, J. Spatial temporal difference of urban land use efficiency and its influencing factors based on DEA: A case study of nine cities in Jilin Province. Resour. Environ. Yangtze River Basin 2020, 29, 678–686. [Google Scholar]
- Wang, W.; Song, Y.; Pang, X. Research on China’s regional land use efficiency based on data envelopment analysis. Explor. Econ. Probl. 2011, 8, 60–65. [Google Scholar]
- Ge, K.; Zou, S.; Lu, X.; Chen, D.; Kuang, B. Spatial convergence analysis of urban land green use efficiency under the background of regional integration: A case study of Yangtze River economic belt. East China Econ. Manag. 2021, 35, 31–41. [Google Scholar]
- Ji, Z.; Zhang, P. Spatial difference and driving mechanism of urban land use efficiency under environmental constraints in China: A study based on 285 cities at prefecture level and above. China Land Sci. 2020, 34, 72–79. [Google Scholar]
- Wang, D.; Pang, X. Study on green land use efficiency of Beijing Tianjin Hebei Urban Agglomeration. China Popul. Resour. Environ. 2019, 29, 68–76. [Google Scholar]
- Li, L.; Dong, J.; Zhang, J. Regional differences and formation mechanism of urban land use efficiency in Yangtze River economic belt. Resour. Environ. Yangtze River Basin 2018, 27, 1665–1675. [Google Scholar]
- Hu, B.; Li, J.; Kuang, B. Evolution characteristics and influencing factors of urban land use efficiency differences under the concept of green development. Econ. Geogr. 2018, 38, 183–189. [Google Scholar]
- Zhang, Y.; Chen, J.; Gao, J.; Jiang, W. Impact mechanism of urban land use efficiency in Yangtze River Delta from the perspective of economic transformation. J. Nat. Resour. 2019, 34, 1157–1170. [Google Scholar]
- Yang, Q.; Duan, X.; Ye, L.; Zhang, W. Evaluation of urban land use efficiency based on SBM undesirable model: A case study of 16 cities in Yangtze River Delta. Resour. Sci. 2014, 36, 712–721. [Google Scholar]
- Yu, Y.; Du, X. Research on threshold effect of economic development, government incentives and constraints and energy conservation and emission reduction efficiency. China Popul. Resour. Environ. 2013, 23, 93–99. [Google Scholar]
- Nie, L.; Guo, Z.; Peng, C. Study on urban construction land use efficiency based on SBM undesirable and meta frontier models. Resour. Sci. 2017, 39, 836–845. [Google Scholar]
- Tone, K. A slacks-based measure of efficiency in data envelopment analysis. Eur. J. Oper. Res. 2001, 130, 498–509. [Google Scholar] [CrossRef] [Green Version]
- Tone, K. A slacks-based measure of super-efficiency in data envelopment analysis. Eur. J. Oper. Res. 2002, 143, 694–697. [Google Scholar] [CrossRef] [Green Version]
- Li, J. Study on the differences and influencing factors of regional environmental efficiency in China. Nanfang Ji 2009, 12, 24–35. [Google Scholar]
- Dagum, C. A new approach to the decomposition of the Gini income inequality ratio. Empir. Econ. 1997, 22, 47–63. [Google Scholar] [CrossRef]
- Liu, H.; Zhao, H. Analysis on regional differences of carbon dioxide emission intensity in China. Stat. Res. 2012, 29, 46–50. [Google Scholar]
- Hong, H.; Xie, D.; Guo, L.; Hu, R.; Liao, H. Characteristics and types of spatial function differentiation of mountainous rural areas from the perspective of multi-function. Acta Ecol. Sin. 2017, 37, 2415–2427. [Google Scholar]
- Li, X.; Zhang, Q. AHP-based resources and environment efficiency evaluation index system construction about the west side of Taiwan Straits. Ann. Oper. Res. 2015, 228, 97–111. [Google Scholar] [CrossRef]
- Irwin, E. New directions for urban economic models of land use change:incorporporating spatial dynamics and heterogeneity. J. Reg. Sci. 2010, 50, 65–91. [Google Scholar] [CrossRef]
- Tan, N.; Zhou, X.; Lin, J. Research on the economic growth effect of Shanghai Free Trade Zone: Counterfactual analysis based on panel data. Int. Trade Issues 2015, 10, 14–24. [Google Scholar]
- Yin, H.; Gao, W. Have pilot free trade zones produced “institutional dividends”? Evidence from Shanghai free trade zone. Financ. Res. 2017, 43, 48–59. [Google Scholar]
- Wang, J.; Yan, Y.; Hu, S. Spatial characteristics and influencing factors of urban technological innovation capacity in China: Based on spatial panel data Model. Sci. Geogr. Sin. 2017, 37, 11–18. [Google Scholar]
- Analysis and Prospect of Economic Development in Yangtze River Delta Region: 2017–2018. Wang, Z. (Ed.) Economic Development Report of Yangtze River Delta Region, Shanghai Academy of Social Sciences Press: Shanghai, China, 2018; pp. 1–7. [Google Scholar]
- Zhong, M.; Li, M.; Du, W. Whether environmental regulation can force industrial structure adjustment: An empirical test based on Chinese provincial panel data. China Popul. Resour. Environ. 2015, 25, 107–115. [Google Scholar]
- Liu, Y.J. Optimization of modern industrial system in undertaking industrial transfer in central and western Regions—Taking Anhui Province undertaking industrial transfer in Yangtze River Delta region as an example. East China Econ. Manag. 2013, 27, 28–32. [Google Scholar]
Publisher’s Note: MDPI stays neutral with regard to jurisdictional claims in published maps and institutional affiliations. |
© 2021 by the authors. Licensee MDPI, Basel, Switzerland. This article is an open access article distributed under the terms and conditions of the Creative Commons Attribution (CC BY) license (https://creativecommons.org/licenses/by/4.0/).