Article

Importance and Performance of Value-Based Maintenance Practices in Hospital Buildings

1
Faculty of Built Environment, Tunku Abdul Rahman University College, Setapak, Kuala Lumpur 53300, Malaysia
2
Department of Construction Management, Universiti Tunku Abdul Rahman, Jalan Universiti, Bandar Barat, Kampar 31900, Malaysia
3
Department of Architecture & Sustainable Design, Lee Kong Chian Faculty of Engineering & Science, Sungai Long Campus, Universiti Tunku Abdul Rahman, Kajang 43000, Malaysia
*
Author to whom correspondence should be addressed.
Sustainability 2021, 13(21), 11908; https://doi.org/10.3390/su132111908
Submission received: 10 September 2021 / Revised: 23 October 2021 / Accepted: 25 October 2021 / Published: 28 October 2021
(This article belongs to the Special Issue Renewable Energy and Energy Saving: Worldwide Research Trends)

Abstract

:
After two decades of privatization of building maintenance service in government hospitals in Malaysia, evidence of under-maintained hospital buildings suggests a need to raise the level of hospital maintenance service delivery. This study identified the critical success factors to enhance the value outcomes of hospital maintenance service. A total of 66 questionnaire survey responses from maintenance personnel in public hospitals were analyzed using the Importance-Performance Matrix Analysis (IPMA) in the SmartPLS3.0 software. The Importance versus the Performance of value-based practices was mapped to identify the critical areas that require greater considerations to improve maintenance service delivery. The findings revealed four critical success factors: Responsive to Needs, Integrated Service Solutions, Innovative Improved Practices, and Value for Money. These practices were found to be the impetus that can bring significant enhancement to hospital building maintenance service delivery. Although the findings are based on data derived from public hospitals in Malaysia, the outcomes are applicable to private hospitals both in and outside of Malaysia.

1. Introduction

Hospitals perform essential functions concerning human lives, health, and well-being. Maintenance of hospital buildings is challenging due to their engineering plants and systems [1,2]. The healthcare industry is subjected to high standards and regulation compliance and has a high operational risk of failure [3]. Besides safety, comfort, and security considerations [4], hospitals are also expected to attain energy efficiency requirements [5]. Failure in healthcare facilities can cause catastrophic impacts [3], and poor service quality affects patient satisfaction [6,7]. It is crucial for hospital buildings to always perform at an optimal state so that the delivery of medical functions is not compromised. Thus, maintenance works are necessary to support the functionality and continuity of hospitals’ healthcare service [8].
There are 144 public hospitals in Malaysia with 42,424 beds and 210 private hospitals with 15,957 beds [9]. The government privatized the maintenance service in 1997 under Facilities Management (FM) to standardize and improve service delivery nationwide [10]. Concession agreements were signed with concession companies to provide various supports including the maintenance of M&E engineering, civil engineering, and architecture works. Despite the privatization of maintenance service, there is still room for improvement. Problems such as fungal attack, building defects, lift breakdown, and moisture problems were frequently reported. Poor maintenance of fire safety was pointed out as a frequent incident [11]. In 2016, a fatal fire incident in a public hospital killed six patients and resulted in the evacuation of 487 patients and staff [12]. The same hospital had seven fire incidents before that fatal incident [13]. Other issues include a woman giving birth in a lift [14], a pre-mature baby trapped in a lift [15], and a collapsed ceiling [16]. Empirical evidence on building condition assessment found that facilities for persons with disabilities in public hospitals were critical [17]. These issues of poor performance in hospitals could be prevented if maintenance service were delivered effectively.
Extant research revealed weaknesses in maintenance management [10,18,19] due to multifaceted causes such as low service level by contractors [19], lack of understanding of user’s needs [20,21], and less focus on collaborative working. The maintenance process involves constant interactions of various systems and different parties, i.e., the maintenance contractors, building users, and maintenance personnel and hospital management. Hence, issues of maintenance should be investigated from the practices of the parties involved and the effect of collaboration among them. Value concepts emphasizing user involvement [22,23], value-adding practices of contractors [24,25,26], and value co-creation through collaborative work [25,27,28,29,30,31] can potentially mitigate the problems in maintenance management.
However, there is a lack of theoretical and empirical justification for implementing a value-based approach in healthcare building maintenance [20,21]. Past research in hospital building maintenance was fragmented and diversified in maintenance efficiency [32], benchmarking [33], cost [34,35], audit assessment [19], defects [36], strategy [37], and effectiveness [2]. Recent research trends focus on energy-saving [38], green hospitals [39], service quality in hospital FM [6,40], lean six sigma [41], performance [42], and fire safety [12]. Research in value-based maintenance is limited to the case study by Okoroh et al. [24] and recent studies by Olanrewaju et al. [21] and Wong et al. [43].
In our previous work on the value-based building maintenance model for hospitals [43], the causal relationships between value factors and value outcomes of building maintenance were established, where value-adding and value co-creation were found to have a positive influence on achieving value outcomes. The previous study provided information about the main factors and their respective sets of practices in general. However, it has limitations where the specific sub-factors or indicators that are critical were not known. Information about the main areas that directly or indirectly impact the performance of maintenance service delivery are crucial for systemic decision-making. Hence, this study continues our previous work to address its limitation [43] by mapping the Importance versus the Performance of value-based indicators of the model with the aim of establishing the critical success factors (CSFs) of value-based building maintenance. CSFs are the set of criteria that facilitate the achievement of the objective of the project or services.

2. Literature Review

Value is referred to as “value-in-use” in the service-dominant (S-D) logic model developed by Vargo and Lusch [28] and Vargo et al. [29]. Under the S-D logic model, value is determined in the usage, rather than “value-in-exchange” in the traditional exchange of goods and money from goods-dominant (G-D) logic [29]. The “value-in-use” is defined as “a customer’s outcome, purpose or objective that is achieved through service” [31]. The term “service” is defined as the application of competences by one party for the benefit of another [29]. In this study, the outsourced maintenance is a form of service, where maintenance contractors offer their competencies in the form of technology, knowledge, resources, and innovation to benefit the hospitals. In such an arrangement, value is determined in use; hence, the S-D logic model is relevant in this study.
Value is perceived and determined by the customer, instead of embedded in goods and determined by the producer [28]. Similarly, Gummerus [44] suggested that the beneficiary determines value. Hence, in this study, value outcomes of hospital maintenance are dictated by the hospitals and their users.

2.1. Value Outcomes

Based on the value-in-use concept, value outcomes for public hospital maintenance can be two-fold, with an emphasis on daily operational outcomes and strategic ones. The operational value outcomes are the daily work processes [30] such as shorter response time by the contractor [27], reduced risk and quality of output [27], and basic maintenance requirements such as health and safety [26]. In the longer term, strategic value outcomes result from parties’ collaborative effort in skill, knowledge, and technology advancement and transfer [27]. Through synergy, contractors are treated as partners and therefore entrusted with more diverse roles [30]. In the long run, corporate image [24] and user satisfaction [24,27,45,46] can be achieved.

2.2. Value-Based Factors

2.2.1. User Involvement

User involvement explores the demand side of the maintenance arrangement in terms of user expectations, user involvement, and user satisfaction. Users are classified as hospital staff who perform day-to-day operations in the hospital to deliver healthcare services. They are the medical or clinical staff, and administrative and supporting staff. A recent survey conducted on doctors and nurses in public hospitals in Malaysia revealed their dissatisfaction over unresolved complaints on maintenance issues [47]. The findings indicated a low attainment of users’ needs even though their roles have shifted from passive recipients to knowledgeable and active participants.
Gathering and knowing the expectations of main stakeholders will facilitate better-informed decision-making and evaluation, as suggested by Jensen and Maslesa [22] in value-based building renovation. By understanding users’ expectations, the gap between users and maintenance providers can be minimized or closed [48]. Organizations should co-opt customer competency to increase their competitiveness [49]. Hence, this study postulated the need for inclusion of users from three aspects. Firstly, organizations must understand user expectations [22,23,50,51]. Secondly, it is beneficial to involve users in the maintenance process [22,23,50]. Thirdly, user satisfaction needs to be measured to gauge the achievement of their expectations [23,40,52].

2.2.2. Value-Adding Practices

The concept of added value explores the supply side of the maintenance arrangement. Maintenance service providers are expected to deliver more than essential transactional maintenance functions. It was propounded that public sector real estate has moved beyond satisfying customers based on the traditional time–cost–quality trilogy [53]. There is an urgency to provide a relationship or partnership with their customers in the value-adding service offering [25,26,54]. On top of that, FM research conducted in Nordic countries [46,50,55] postulated that the focus of value has shifted from a customer focus towards a value-adding notion.
The contracted service providers of hospital support are bound by conditions stipulated in the concession agreement. Contractors may appoint their sub-contractors to carry out these tasks. However, there are areas of concern in terms of the contractor’s efficiency in the outsourced FM [19], heavy reliance on the sub-contractors [10], and a lack of top management support for the contractor [10]. Issues of rising operation costs [34] also indicate the lack of value for money. To mitigate problems faced by maintenance contractors, the concept of added value was explored. Innovative practices, value for money, and cost reduction/cost savings from contractors [24] can potentially add value to the service provider’s provision. Ali-Marttila et al. [26] also identified the service partner’s ability to solve problems and provide a service solution as essential factors in value creation. Besides, responsiveness to needs is also a necessary value that customers look for in their partners [23,25].

2.2.3. Value Co-Creation

The S-D model emphasized the importance of value co-creation, where service systems such as people, information, and technology engage with other service systems for adaptability and survival [29]. Value is co-created jointly or reciprocally among the provider/producer and the consumer or beneficiaries, through physical and tangible resources [29]. Value co-creation is also defined as “the joint, collaborative, concurrent, peer-like process of producing new value, both materially and symbolically” [56]. The business focus should be shifted to co-create unique value with customers rather than the traditional company-centric value creation [57]. Grönroos and Voima [58] suggested a “joint sphere” where value is co-created when service providers and customers interact jointly, directly or indirectly. Malaysian public hospitals currently rely on a fee deduction system to ensure conformance and performance [10], which drains the manpower in contractor supervision and monitoring [10] when hospitals are already reported to be under-staff [59]. Improvement in the collaborative working environment rather than a punitive system could potentially help to enhance service delivery. Previous studies shown that collaborative working improved the construction supply chain [60] and infrastructure asset maintenance [61]. Past literature acknowledged that value co-creation could be achieved through intensive cooperation [51], sharing of information [29], knowledge transfer [29,30] and effective communication [51]. Additionally, openness and honesty; mutual trust and confidence [25] and relationship synergies [26], strategic alignment [30], strategic integration [27], and strong governance [25] were also explored as value co-creation factors. Hence, it is postulated that value co-creation practices can potentially improve the delivery of maintenance service to hospitals, therefore enhancing the value outcomes.
In this study, three causal relationships between the value-based factors and value outcomes are hypothesized as follows:
Hypothesis 1 (H1).
User involvement positively influences value outcomes.
Hypothesis 2 (H2).
Value-adding practices positively influence value outcomes.
Hypothesis 3 (H3).
Value co-creation positively influences value outcomes.
Value-based factors and their indicators are presented in Table 1.

3. Methods

A questionnaire survey was administered from January to July 2019 using the online platform. The target respondents were the engineers of public hospitals in Malaysia who are appointed by the ministry to monitor, supervise, and inspect the privatized support service [18]. They were the most suitable respondents since they represent the maintenance department in tasks involving hospital users and maintenance contractors, and they report to the hospitals’ top management. Only five concession companies were contracted to provide maintenance service to public hospitals in the entire country [9]. Hence, this study attempted to collect data from all 139 public hospitals (excluding medical institutions/centers) listed in the Ministry of Health Malaysia website. The census method was selected due to the well-defined, accessible, and small population [62].
The first section of the questionnaire gathers the background information of respondents and the hospitals, whereas the second section measures the value-based factors (User Involvement, Value-Adding Practices, Value Co-Creation) and value outcomes. The constructs’ measurement items were developed from the literature review based on the synthesis and integration of past studies of value concepts. The constructs and number of items are shown in Table 2. This study employed an even-numbered 6-point Likert scale to measure respondents’ experience of practices and outcomes. The 6-point Likert items were chosen to give a greater discriminant and reliability value [63].
Two parts of the analyses were performed in this study. In Part 1, PLS-SEM SmartPLS 3.0 software [64] was used to perform the structural equation modeling (SEM) to test the three proposed hypotheses; the detailed analysis and outcomes were presented in Wong et al. [43]. PLS-SEM was chosen due to the nature of the study being more exploratory than confirmatory [65,66] and it is recommended for non-parametric data [65].
This paper focuses on Part 2 of the analysis, which applied the same software to perform the Importance-Performance Matrix Analysis (IPMA) at the construct level and indicator level. The IPMA function was used to analyze the importance versus performance of constructs and indicators resulting from Part 1 of the SEM analysis. The IPMA analysis was conducted based on steps outlined by Ringle and Sarstedt [67] and Ramayah et al. [65]. The first step involved a requirement check where latent variable scores were re-scaled from 0 to 100, while all indicator codes must be in the same scale direction. The second step was to compute the performance values, where the average value of the latent variable score represented the average Performance. Next, the Importance value was computed. This represented the total effect of the relationship between two constructs. Lastly, the Importance–Performance map was created. IPMA was conducted at the construct and indicator levels to identify specific areas of improvement required.
To interpret the Importance–Performance map, the revised IPA grid by Abalo et al. (2006), as cited in Abalo et al. [68], is referred to. Any point on the map with an importance rating above its corresponding Performance rating was identified as an area that requires improvement effort (“Concentrate Here” category). Subsequently, the points that were high in both the Importance and Performance ratings were the areas to be maintained (“Keep Up the Good Work”). Using the same principle, points that were low in both the Importance and Performance ratings were considered “Low Priority”. In contrast, those with low Importance but high in the Performance rating were categorized as “Possible Overkill”. In this study, factors that fell in the “Concentrate Here” and “Keep Up the Good Work” categories were established as the CSFs. The IPMA technique has been adopted in numerous studies in various disciplines to obtain detailed insights into factors investigated (for example, Ong and Bahar [69], Su and Cheng [70], Ting et al. [71], Valaei et al. [72], and Tailab [73]).

4. Results

A total of 66 usable responses were collected out of 139 public hospitals. The distribution of respondents comprised 41% engineers and 59% assistant engineers; the average number of years of experience was five years. The profile of the respondents is shown in Table 3.
The sample size was sufficient for PLS-SEM analysis, where only a minimum of 30 cases of observations was required [65]. Based on the rule of thumb of 10 times of structural paths directed to a construct [74], the minimum sample size required was 30. Besides, it also fulfilled the requirement of the minimum R-squared method, whereby for a model with maximum three arrows pointing to a construct and an R2 of 0.423, with a 5% probability of error, the minimum sample size required should be within the range of 16 to 37 [66].

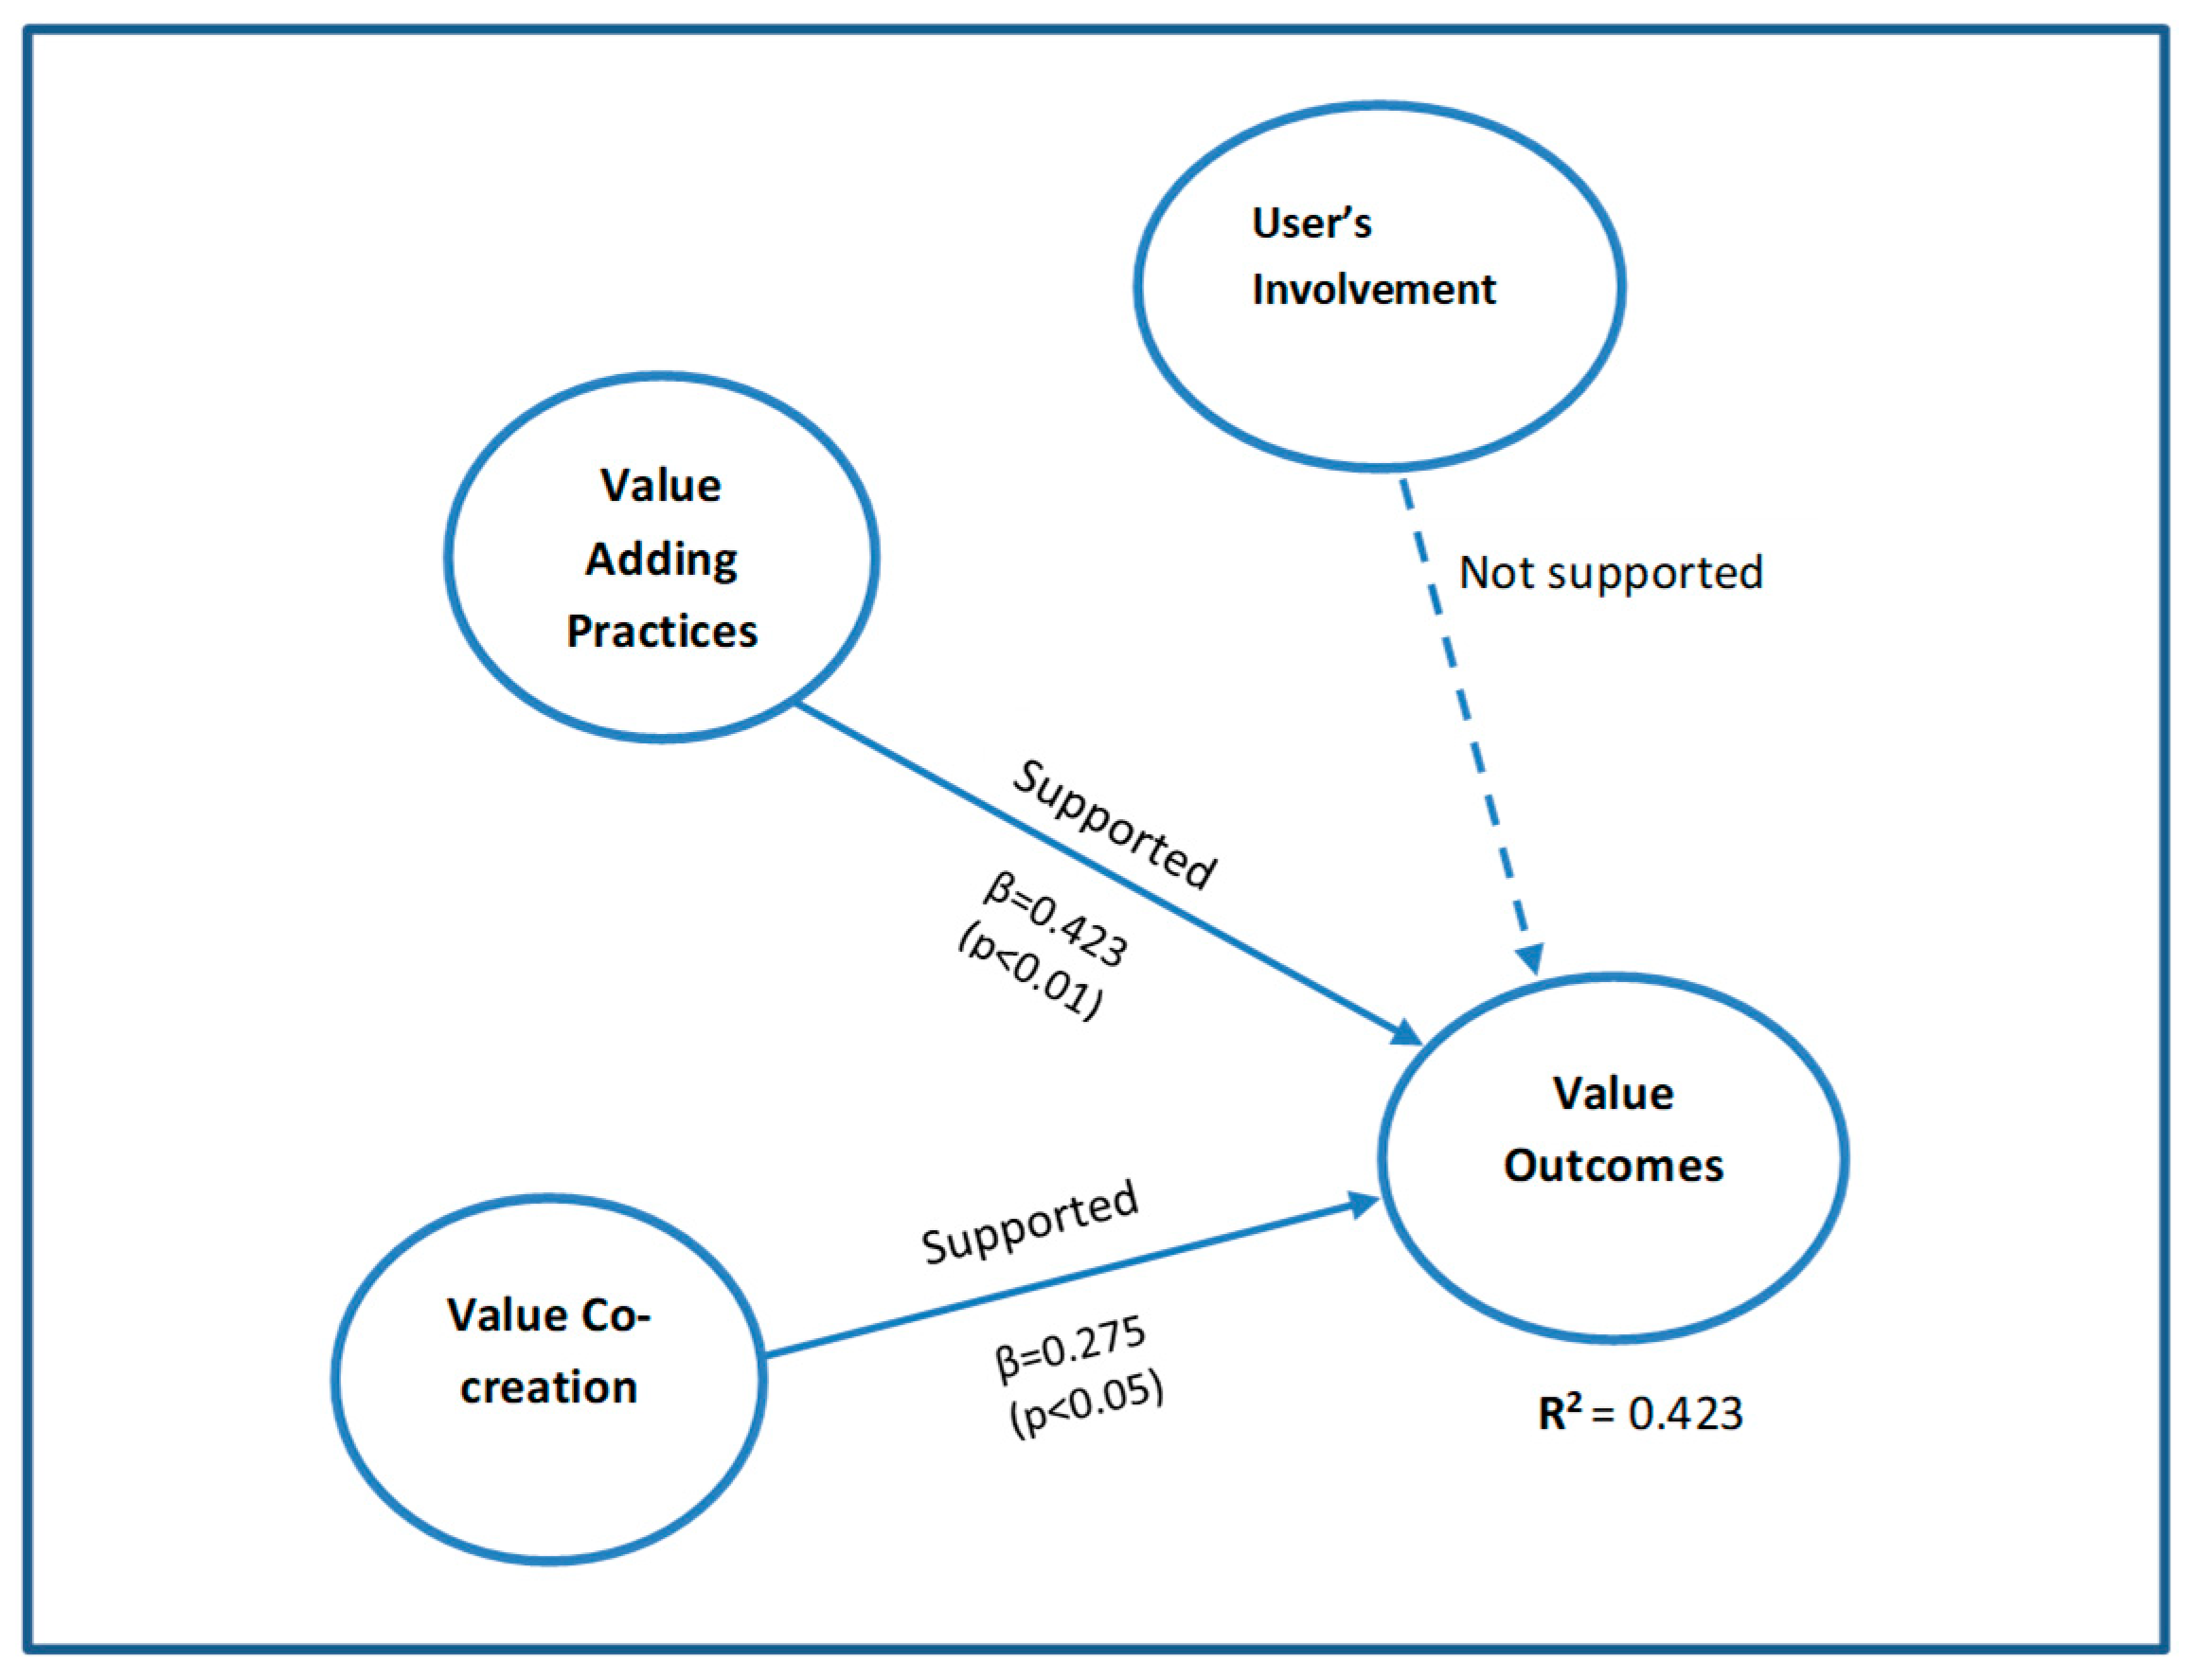
4.1. Part 1: Structural Equation Modeling (SEM)

This section reports the essence of the SEM analysis as previously presented in Wong et al. [43]. The reflective measurement model was assessed in terms of internal consistency reliability, convergent validity, and discriminant validity. Composite reliability (CR) for all constructs in the range of 0.756 to 0.927 met the criteria of above 0.7 [66] and below the maximum CR value of 0.95 to avoid indicator redundancy [75]. Overall, six indicators were deleted due to low factor loading and within the caveat of the 20% limit of overall number indicators [76]. The average variance extracted (AVE) of all constructs was above the minimum acceptable level of 0.5. Both the Fornell–Larcker criterion and the cross-loading pattern confirmed sufficient discriminant value validity [65].
The structural model validation was conducted based on the five essential steps to assess lateral collinearity, the path coefficient, the coefficient of determination, the effect size to R2, and the Stone–Geisser Q2 predictive relevance [65]. All three exogenous latent variables had a variance inflator factor (VIF) value of below 3.3 [77], cited in Ramayah et al. [65], which indicates no collinearity problem. The three hypotheses H1 (User → Value Outcomes), H2 (Val Add → Value Outcomes), and H3 (Co-Creation → Value Outcomes) were tested. The results show that Value Added had a significant influence on the value outcomes (p = 0.000, t = 3.476) with a medium effect size, whereas Value Co-Creation significantly influenced the value outcomes (p = 0.014, t = 2.214) with small effect size. However, Hypothesis 1 is not supported, as the User Involvement construct was not found to have a significant effect on the value outcomes. The result of the SEM is presented in Figure 1.

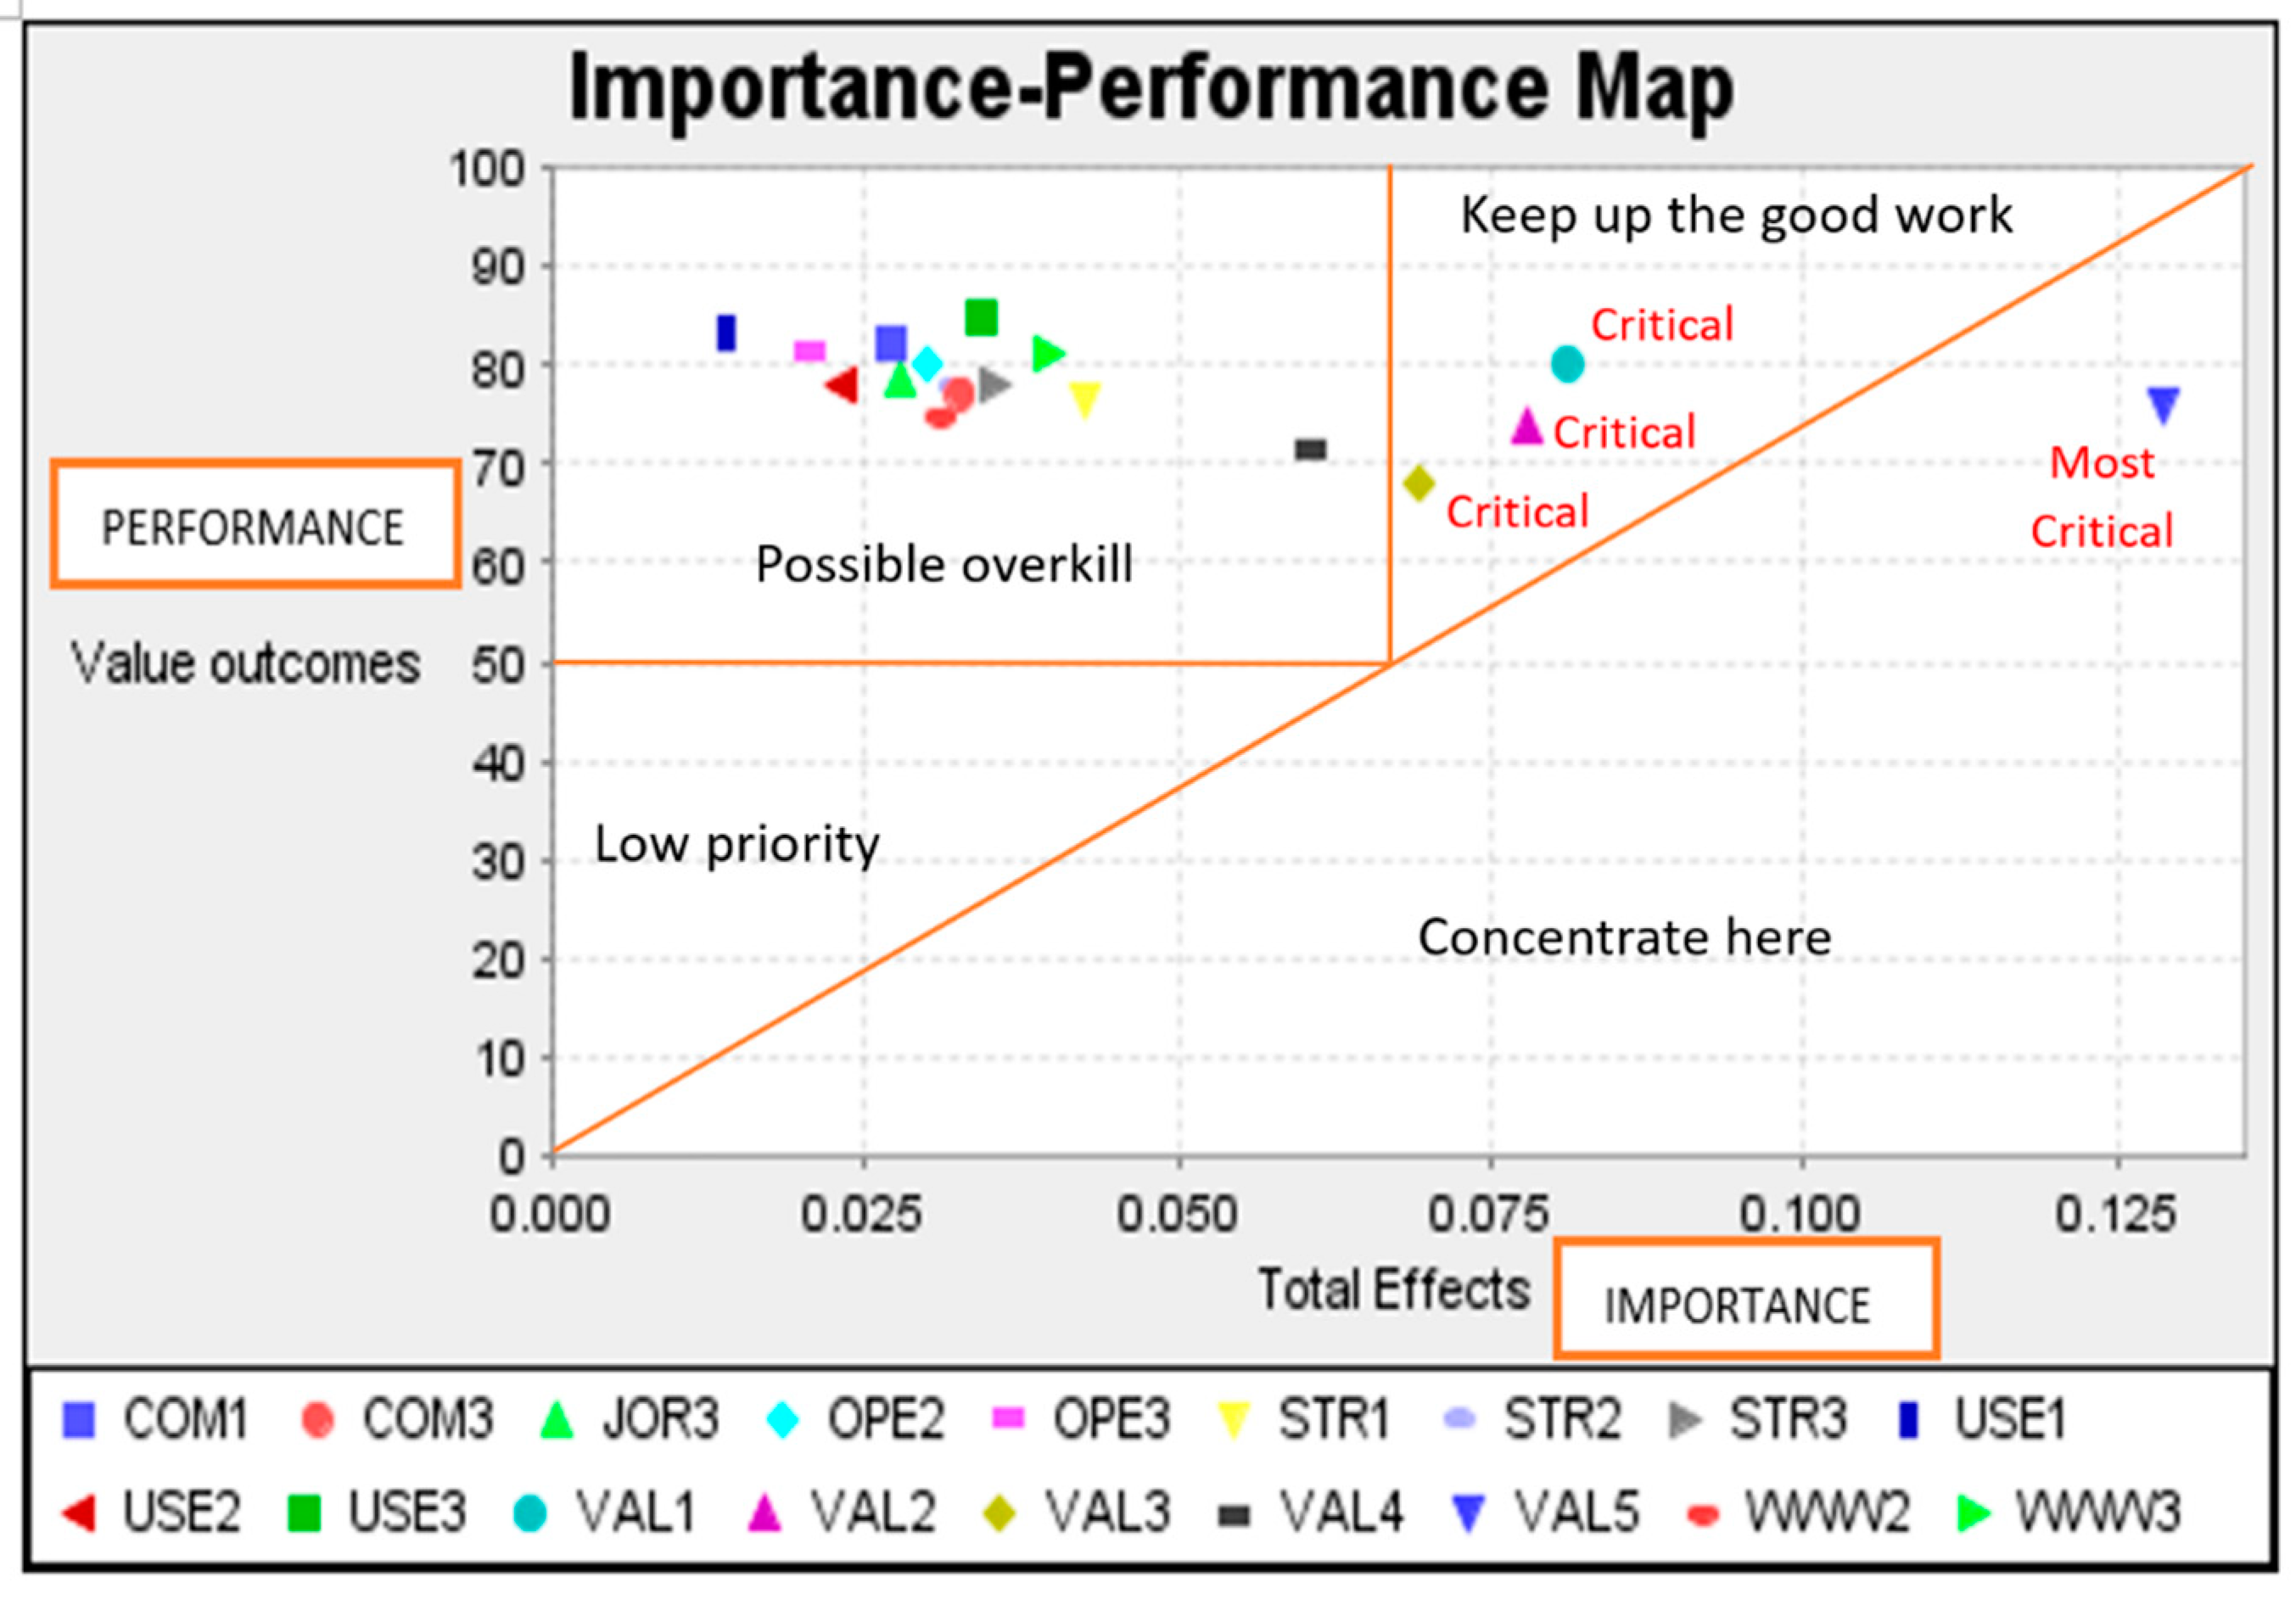
4.2. Part 2: Importance-Performance Matrix Analysis (IPMA)

Based on the outcome of the SEM, further analysis using IPMA function in SmartPLS3.0 was carried out. Table 4 shows that Value Added had the highest Importance but lowest Performance rating. This indicates that even though Value Added is the most important construct, it was given the least attention to achieve the desired performance. Subsequently, the Value Co-Creation construct ranked second in both Importance and Performance ratings, whereas the User Involvement construct was lowest in Importance, but highest in Performance, which means it was the least critical area.
Further analysis was extended on the total 18 indicators. From Table 5, the indicator VAL5 (Responsive to Needs) had the highest Importance rating (0.129) but was relatively lower in terms of its Performance (76.061), which ranked 14th out of 18. Figure 2 depicts VAL5 falling within the “Concentrate Here” category. Subsequently, VAL1 (Integrated Service Solutions), VAL2 (Innovative Improved Practices), and VAL3 (Value for Money), which ranked second, third, and fourth in terms of Importance, all fell in the “Keep Up the Good Work” category. Other indicators fell below the 50% continuum of the Importance axis but above the 50% continuum of the Performance axis, indicating their Performance was higher than their relative Importance, or in the category “Possible Overkill”. Hence, these indicators are not the main focus for hospital maintenance improvement compared to other areas. The four indicators that fell in the “Concentrate Here” and “Keep up the Good Work” categories were established as the CSFs of the value-based building maintenance in this study (see Table 6).

5. Discussions

From the SEM outcomes, Value-Adding Practices and Value Co-Creation were found to positively influence the value outcomes in hospital maintenance. User Involvement was not supported to have influence on value outcomes, which merits further investigation. Further analysis on 18 indicators using IPMA found Responsive to Needs, Integrated Service Solutions, Innovative Improved Practices, and Value for Money were critical, and hence were established as the CSFs for value-based hospital maintenance. Even though there are no direct comparable CSFs on value-based maintenance in past research, comparison with the closest work by Ab Ghani [78] on CSFs for FM in the Malaysian healthcare sector found two related CSFs, which are “value for money” and “integrated process”. However, their research focused on generic FM in the healthcare sector, and not specific to a value-based approach. In comparison, Amaratunga et al.’s [79] case study on CSFs for FM in NHS facilities in the UK found three related CSFs, which are “Timeliness”, “Service Delivery Innovation”, and “Value for Money”. From their study, corresponding measures for Timeliness are patient environment assessment, Service Delivery Innovation measured by the effectiveness of service planning, and Value for Money’ measured using estate returns measures, budget variance, absenteeism, and benchmarking tools. Their research is not value-based; however, the examples of measurement tools can be adapted to develop KPI for CSFs in this study.
In a review on CSFs for healthcare FM by Ahmad Pakrudin et al. [3], top management commitment and support was found to be the top-ranked cited factor. In contrast, our results show that the indicator “Strong Governance” falls under the “Possible Overkill” category, which indicates the Performance rating exceeded the Importance rating, hence it is not as critical in the Malaysian public hospital context.
The identified critical success factors of the value-based building maintenance model are presented in Figure 3.

6. Conclusions

Our previously established value-based building maintenance model [43] identified value-adding practices and value co-creation as main factors having positive impacts on value outcomes in an integrated model. The previous study recommended for maintenance contractors to provide value-adding practices in their delivery and justified the needs for collaborative working in hospital maintenance arrangements. However, the general sets of practices are not sufficient to guide practitioners and policymakers to concentrate explicitly on the key aspects that could give the most impact to the desired outcomes. This study extended analysis on all the indicators from the previous model [43] to evaluate their level of importance and their respective performance to obtain more valuable and specific information. From the evaluation, the importance and performance were weighed so that the important areas that were lacking in terms of performance could be identified. The outcome of this study complemented the previous model with four identified critical success factors. The new findings add value to the model by providing deeper insights for practitioners to concentrate on the vital areas, i.e., Responsive to Needs, Integrated Service Solutions, Innovative Improved Practices, and Value for Money, to heighten the value of maintenance service.
Notably, all four critical success factors identified from this study attributed to value-adding practices, which were derived from the supply side of the maintenance arrangement. The essential finding highlights the crucial role of the maintenance contractors. Hospital management and policymakers could prioritize contractors’ selection based on their track records in the aforesaid critical areas. These criteria can also be extended to develop key performance indicators (KPIs) to monitor their performance for contract renewals.
Specifically, contractors could keep up their good work by providing integrated service solutions such as providing loans of equipment during breakdowns and providing technical advice. Innovative improved practices such as predictive maintenance, technology, and innovation are critical attributes expected from contractors. Value for money through initiatives such as energy-saving can add value to hospitals in terms of sustainability. As more responsibilities are placed on concession companies by the government in achieving sustainability goals [5], it becomes essential for contractors to pro-actively add value to their services in this respect.
Lastly, this study identified Responsive to Needs as the most critical success factor. Further action and research can focus on contractors’ responsiveness to close the gap of Importance and Performance, such as on-site productivity measurement to eliminate non-value-added tasks or further supply chain analysis extended to the subcontractor and suppliers’ level.

Author Contributions

Conceptualization, W.F.W., A.O. and P.I.L.; methodology, W.F.W., A.O. and P.I.L.; software, W.F.W.; validation, W.F.W.; formal analysis, W.F.W.; investigation, W.F.W., A.O. and P.I.L.; resources, W.F.W., A.O. and P.I.L.; data curation, W.F.W.; writing—original draft preparation, W.F.W.; writing—review and editing, W.F.W., A.O. and P.I.L.; visualization, W.F.W., A.O. and P.I.L.; supervision, A.O. and P.I.L.; project administration, W.F.W. All authors have read and agreed to the published version of the manuscript.

Funding

This research received no external funding.

Informed Consent Statement

Informed consent was obtained from all subjects involved in the study.

Data Availability Statement

The data presented in this study are available on request from the corresponding author. The data are not publicly available due to privacy reasons.

Acknowledgments

This research was supported by the Centre for Construction Research, Faculty of Built Environment, Tunku Abdul Rahman University College, Malaysia.

Conflicts of Interest

The authors declare no conflict of interest.

References

  1. Enshassi, A.A.; El Shorafa, F. Key performance indicators for the maintenance of public hospitals buildings in the Gaza Strip. Facilities 2015, 33, 206–228. [Google Scholar] [CrossRef]
  2. Omar, M.F.; Ibrahim, F.A.; Wan Omar, W.M.S. Key performance indicators for maintenance management effectiveness of public hospital building. In MATEC Web of Conferences; EDP Sciences: Les Ulis, France, 2017; Volume 97, pp. 1–6. [Google Scholar] [CrossRef] [Green Version]
  3. Ahmad Pakrudin, N.A.; Abdullah Mohd Asmoni, M.N.; Mei, J.L.Y.; Jaafar, M.N.; Mohammed, A.H. Critical success factors for facilities management implementation in the healthcare industry. Int. J. Real Estate Stud. 2017, 11, 69–83. [Google Scholar]
  4. Lavy, S.; Shohet, I.M. Integrated maintenance management of hospital buildings: A case study. Constr. Manag. Econ. 2004, 22, 25–34. [Google Scholar] [CrossRef]
  5. Abdullah, M.S.I.; Abd Rahman, N.M.; Ahmad Zaidi, T.Z.; Kamaluddin, K.A. Latest development on sustainability programme initiatives in Malaysian healthcare facility management. In Proceedings of the 37th Conference of the ASEAN Federation of Engineering Organisations, Jakarta International Expo, Jakarta, Indonesia, 11–15 September 2019; pp. 1–6. [Google Scholar]
  6. Amankwah, O.; Choong, W.W.; Mohammed, A.H. Modelling the influence of healthcare facilities management service quality on patients satisfaction. J. Facil. Manag. 2019, 17, 267–283. [Google Scholar] [CrossRef]
  7. Boadi, E.B.; Wang, W.; Bentum-micah, G.; Asare, I.K.J.; Bosompem, L.S. Impact of service quality on customer satisfaction in Ghana hospitals: A PLS- SEM approach. Can. J. Appl. Sci. Technol. 2019, 7, 503–511. [Google Scholar]
  8. Yousefli, Z.; Nasiri, F.; Moselhi, O. Healthcare facilities maintenance management: A literature review. J. Facil. Manag. 2017, 15, 352–375. [Google Scholar] [CrossRef]
  9. Ministry of Health Malaysia. Annual Report Ministry of Health Malaysia 2017; Ministry of Health Malaysia: Putrajaya, Malaysia, 2018. [Google Scholar]
  10. Fan, H.P. Privatization of Facility Management in Public Hospitals: A Malaysian Perspective; Patridge Publishing: Singapore, 2016. [Google Scholar]
  11. Ab Ghani, M.Z.; Aripin, S. Comparative review of design requirements for natural smoke ventilation in hospital buildings. J. Malays. Inst. Plan. 2018, 16, 334–344. [Google Scholar] [CrossRef]
  12. Muhamad Salleh, N.; Agus Salim, N.A.; Jaafar, M.; Sulieman, M.Z.; Ebekozien, A. Fire safety management of public buildings: A systematic review of hospital buildings in Asia. Prop. Manag. 2020, 38, 497–511. [Google Scholar] [CrossRef]
  13. Anon. Seven Fires at HSA in past Four Years. Star Online. 2016. Available online: https://www.thestar.com.my/news/nation/2016/10/27/seven-fires-at-hsa-in-past-four-years (accessed on 3 December 2017).
  14. Anon. Woman Gives Birth while Trapped in Sarawak General Hospital’s Lift. Malay. Mail Online. 2016. Available online: https://www.malaymail.com/news/malaysia/2016/10/07/woman-gives-birth-while-trapped-in-sarawak-general-hospitals-lift/1222701 (accessed on 3 December 2017).
  15. Lai, C. Hospital elevators need better maintenance. Star Online. 2012. Available online: https://www.thestar.com.my/news/community/2012/06/07/hospital-elevators-need-better-maintenance (accessed on 3 December 2017).
  16. Anon. Authorities Aware of Problems at Ampang Hospital. Star Online. 2007. Available online: https://www.thestar.com.my/news/nation/2007/03/14/authorities-aware-of-problems-at-ampang-hospital (accessed on 12 March 2017).
  17. Awang, N.A.; Chua, S.J.L.; Ali, A.S. Building condition assessment focusing on persons with disabilities’ facilities at hospital buildings. J. Des. Built Environ. 2017, 17, 73–84. [Google Scholar] [CrossRef]
  18. National Audit Department Malaysia. Auditor General’s Report 2015: Activities of the Federal Ministries Departments and Management of the Government Companies—Series 2; National Audit Department Malaysia: Putrajaya, Malaysia, 2016. [Google Scholar]
  19. Ali, M.; Wan Mohamad, W.M.N.W. Audit assessment of the facilities maintenance management in a public hospital in Malaysia. J. Facil. Manag. 2009, 7, 142–158. [Google Scholar] [CrossRef]
  20. Olanrewaju, A.L.A.; Wong, W.F.; Seong, Y.T. Hospital building maintenance management model. Int. J. Eng. Technol. 2018, 7, 747–753. [Google Scholar] [CrossRef]
  21. Olanrewaju, A.L.A.; Wong, W.F.; Nik Yahya, N.N.H.; Lim, P.I. Proposed research methodology for establishing the critical success factors for maintenance management of hospital buildings. AIP Conf. Proc. 2019, 2157, 020036. [Google Scholar] [CrossRef]
  22. Jensen, P.A.; Maslesa, E. Value based building renovation—A tool for decision-making and evaluation. Build. Environ. 2015, 92, 1–9. [Google Scholar] [CrossRef] [Green Version]
  23. Olanrewaju, A.L.A.; Abdul Aziz, A.R. Building Maintenance Processes and Practices: The Case of a Fast Developing Country; Springer: Singapore, 2015. [Google Scholar] [CrossRef]
  24. Okoroh, M.I.; Gombera, P.P.; John, E.; Wagstaff, M. Adding value to the healthcare sector—A facilities management partnering arrangement case study. Facilities 2001, 19, 157–164. [Google Scholar] [CrossRef]
  25. Dibley, A.; Clark, M. How to Implement Best Practice in Strategic Partnerships: An Outsource Supplier and Client Perspective; The Henley Centre for Customer Management: London, UK, 2011. [Google Scholar]
  26. Ali-Marttila, M.; Marttonen-Arola, S.; Kärri, T.; Pekkarinen, O.; Saunila, M. Understand what your maintenance service partners value. J. Qual. Maint. Eng. 2017, 23, 144–164. [Google Scholar] [CrossRef]
  27. Bititci, U.S.; Martinez, V.; Albores, P.; Parung, J. Creating and managing value in collaborative networks. Int. J. Phys. Distrib. Logist. Manag. 2004, 34, 251–268. [Google Scholar] [CrossRef] [Green Version]
  28. Vargo, S.L.; Lusch, R.F. Evolving to a new dominant logic for marketing. J. Mark. 2004, 68, 1–17. [Google Scholar] [CrossRef] [Green Version]
  29. Vargo, S.L.; Maglio, P.P.; Akaka, M.A. On value and value co-creation: A service systems and service logic perspective. Eur. Manag. J. 2008, 26, 145–152. [Google Scholar] [CrossRef]
  30. Joshi, K.P.; Chebbiyyam, M. Determining value co-creation opportunity in B2B services. In Proceedings of the 2011 Annual SRII Global Conference (SRII 2011), San Jose, CA, USA, 29 March–2 April 2011; pp. 674–684. [Google Scholar] [CrossRef]
  31. Macdonald, E.K.; Wilson, H.; Martinez, V.; Toossi, A. Assessing value-in-use: A conceptual framework and exploratory study. Ind. Mark. Manag. 2011, 40, 671–682. [Google Scholar] [CrossRef] [Green Version]
  32. Lavy, S.; Shohet, I.M. On the effect of service life conditions on the maintenance costs of healthcare facilities. Constr. Manag. Econ. 2007, 25, 1087–1098. [Google Scholar] [CrossRef]
  33. Li, Y.; Cao, L.; Han, Y.; Wei, J. Development of a conceptual benchmarking framework for healthcare facilities management: Case study of Shanghai municipal hospitals. J. Constr. Eng. Manag. 2020, 146, 05019016. [Google Scholar] [CrossRef]
  34. Mustapa, F.D.; Mustapa, M.; Ismail, F.; Ali, K.N. Outsourcing in Malaysian healthcare support services: A study on the causes of increased operational costs. In Proceedings of the International Conference in Construction Industry, Universitas Bung Hatta, Padang, Indonesia, 21–24 June 2006; pp. 1–10. [Google Scholar]
  35. Vanzanella, C.; Fico, G.; Arredondo, M.T.; Delfino, R.; Viggiani, V.; Triassi, M.; Pecchia, L. Interactive management control via analytic hierarchy process: An empirical study in a public university hospital. J. Int. Bus. Entrep. Dev. 2015, 8, 144–159. [Google Scholar] [CrossRef] [Green Version]
  36. Othman, N.L.; Jaafar, M.; Wan Harun, W.M.; Ibrahim, F. A case study on moisture problems and building defects. Procedia Soc. Behav. Sci. 2015, 170, 27–36. [Google Scholar] [CrossRef] [Green Version]
  37. Abd Rani, N.A.; Baharum, M.R.; Nizam Akbar, A.R.; Nawawi, A.H. Perception of maintenance management strategy on healthcare facilities. Procedia Soc. Behav. Sci. 2015, 170, 272–281. [Google Scholar] [CrossRef] [Green Version]
  38. Kamaluddin, K.A.; Abdullah, M.S.I.; Yang, S.S. Development of energy benchmarking of Malaysian government hospitals and analysis of energy savings opportunities. J. Build. Perform. 2016, 7, 72–87. [Google Scholar]
  39. Sahamir, S.R.; Zakaria, R. Green assessment criteria for public hospital building development in Malaysia. Procedia Environ. Sci. 2014, 20, 106–115. [Google Scholar] [CrossRef] [Green Version]
  40. Pheng, L.S.; Rui, Z. Service Quality for Facilities Management in Hospitals; Springer: Singapore, 2016. [Google Scholar] [CrossRef]
  41. Bawab, F.; Baxter, L. The relationships between lean six sigma strategic, operational and tactical factors and organizational performance in hospitals: A proposed model. In Proceedings of the Seventh International Conference on Lean Six Sigma, Dusit Thani Hotel, Dubai, United Arab Emirates, 7–8 May 2018; pp. 38–47. [Google Scholar]
  42. Jandali, D.; Sweis, R. Factors affecting maintenance management in hospital buildings: Perceptions from the public and private sector. Int. J. Build. Pathol. Adapt. 2019, 37, 6–21. [Google Scholar] [CrossRef]
  43. Wong, W.F.; Olanrewaju, A.L.A.; Lim, P.I. Value-based building maintenance practices for public hospitals in Malaysia. Sustainanility 2021, 13, 6200. [Google Scholar] [CrossRef]
  44. Gummerus, J. Value creation processes and value outcomes in marketing theory: Strangers or siblings? Mark. Theory 2013, 13, 19–46. [Google Scholar] [CrossRef]
  45. Olanrewaju, A.L.A. Quantitative analysis of criteria in university building maintenance in Malaysia. Australas. J. Constr. Econ. Build. 2010, 10, 51–61. [Google Scholar] [CrossRef] [Green Version]
  46. Jensen, P.A.; van der Voordt, T.J.M.; Coenen, C.; Sarasoja, A.L. Reflecting on future research concerning the added value of FM. Facilities 2014, 32, 856–870. [Google Scholar] [CrossRef] [Green Version]
  47. CodeBlue. Water, Power Cuts, Collapsing Ceilings: Survey Bemoans State of Malaysia’s Public Hospitals and Clinics. Available online: https://codeblue.galencentre.org/2019/12/20/water-power-cuts-collapsing-ceilings-survey-bemoans-state-of-malaysias-public-hospitals-and-clinics/ (accessed on 3 December 2017).
  48. Olanrewaju, A.L.A.; Khamidi, M.F.; Idrus, A. Validation of building maintenance performance model for Malaysian universities. Int. J. Educ. Pedagog. Sci. 2011, 5, 1031–1035. [Google Scholar] [CrossRef]
  49. Prahalad, C.K.; Ramaswamy, V. Co-opting customer competence. Harv. Bus. Rev. 2000, 78, 79–90. [Google Scholar]
  50. Jensen, P.A. The facilities management value map: A conceptual framework. Facilities 2010, 28, 175–188. [Google Scholar] [CrossRef]
  51. Coenen, C.; Alexander, K.; Kok, H. Facility management value dimensions from a demand perspective. J. Facil. Manag. 2013, 11, 339–353. [Google Scholar] [CrossRef]
  52. Zulkarnain, S.H.; Ahmad Zawawi, E.M.; Rahman, M.Y.A.; Mustafa, N.K.F. A review of critical success factor in building maintenance management practice for university sector. Int. J. Civ. Environ. Struct. Constr. Archit. Eng. 2011, 55, 215–219. [Google Scholar] [CrossRef]
  53. Wilson, C.; Leckman, J.; Cappucino, K.; Pullen, W.; Wilson, C.; Leckman, J.; Cappucino, K.; Pullen, W. Towards customer delight: Added value in public sector corporate real estate. J. Corp. Real Estate 2014, 3, 215–222. [Google Scholar] [CrossRef]
  54. Toossi, A.; Lockett, H.L.; Raja, J.Z.; Martinez, V. Assessing the value dimensions of outsourced maintenance services. J. Qual. Maint. Eng. 2013, 19, 348–363. [Google Scholar] [CrossRef]
  55. Jensen, P.A.; van der Voordt, T.J.M.; Coenen, C. (Eds.) The Added Value of Facilities Management: Concepts, Findings and Perspectives; Polyteknisk Forlag: Lyngby, Denmark, 2012. [Google Scholar]
  56. Galvagno, M.; Dalli, D. Theory of value co-creation: A systematic literature review. Manag. Serv. Qual. 2014, 24, 643–683. [Google Scholar] [CrossRef]
  57. Prahalad, C.K.; Ramaswamy, V. Co-creating unique value with customers. Strateg. Leadersh. 2004, 32, 4–9. [Google Scholar] [CrossRef]
  58. Grönroos, C.; Voima, P. Critical service logic: Making sense of value creation and co-creation. J. Acad. Mark. Sci. 2013, 41, 133–150. [Google Scholar] [CrossRef]
  59. Aliman, K.H. Audit Finds Malaysian Hospitals Understaffed, Underfunded and Overcrowded. Edge Mark. 2019. Available online: https://www.theedgemarkets.com/article/audit-finds-malaysian-hospitals-understaffed-underfunded-and-overcrowded (accessed on 11 October 2019).
  60. Kwofie, T.E.; Aigbavboa, C.O.; Matsane, Z.S.S. Key drivers of effective collaborative working in construction supply chain in South Africa. Int. J. Constr. Supply Chain Manag. 2019, 9, 81–93. [Google Scholar] [CrossRef]
  61. Munro, T.; Childerhouse, P. Construction supply chain integration: Understanding its applicability in infrastructure asset maintenance and renewal programmes. Int. J. Constr. Supply Chain Manag. 2018, 8, 1–18. [Google Scholar] [CrossRef]
  62. Mooi, E.; Sarstedt, M. Concise Guide to Market Research: The Process, Data and Methods Using IBM SPSS Statistics; Springer: Berlin/Heidelberg, Germany, 2011. [Google Scholar] [CrossRef]
  63. Chomeya, R. Quality of psychology test between Likert Scale 5 and 6 points. J. Soc. Sci. 2010, 6, 399–403. [Google Scholar]
  64. Ringle, C.M.; Wende, S.; Becker, J.M. SmartPLS 3; SmartPLS GmbH: Bönningstedt, Germany, 2015. [Google Scholar]
  65. Ramayah, T.; Cheah, J.; Chuah, F.; Ting, H.; Memon, M.A. Partial Least Squares Structural Equation Modeling (PLS-SEM) Using SmartPLS 3.0, 2nd ed.; Pearson Malaysia Sdn. Bhd.: Kuala Lumpur, Malaysia, 2018. [Google Scholar]
  66. Hair, J.F.; Hult, G.T.M.; Ringle, C.M.; Sarstedt, M. A Primer on Partial Least Squares, 2nd ed.; SAGE Publications, Inc.: Los Angeles, CA, USA, 2017. [Google Scholar]
  67. Ringle, C.M.; Sarstedt, M. Gain more insight from your PLS-SEM results: The importance-performance map analysis. Ind. Manag. Data Syst. 2016, 116, 1865–1886. [Google Scholar] [CrossRef]
  68. Abalo, J.; Varela, J.; Manzano, V. Importance values for importance-performance analysis: A formula for spreading out values derived from preference rankings. J. Bus. Res. 2007, 60, 115–121. [Google Scholar] [CrossRef]
  69. Ong, C.H.; Bahar, T. Factors influencing project management effectiveness in the Malaysian local councils. Int. J. Manag. Proj. Bus. 2019, 12, 1146–1164. [Google Scholar] [CrossRef]
  70. Su, C.H.; Cheng, T.W. A sustainability innovation experiential learning model for virtual reality chemistry laboratory: An empirical study with PLS-SEM and IPMA. Sustainability 2019, 11, 1027. [Google Scholar] [CrossRef] [Green Version]
  71. Ting, S.H.; Yahya, S.; Tan, C.L. Importance-performance matrix analysis of the researcher’s competence in the formation of university-industry collaboration using Smart PLS. Public Organ. Rev. 2020, 20, 249–275. [Google Scholar] [CrossRef]
  72. Valaei, N.; Nikhashemi, S.R.; Javan, N. Organizational factors and process capabilities in a KM strategy: Toward a unified theory. J. Manag. Dev. 2017, 36, 560–580. [Google Scholar] [CrossRef] [Green Version]
  73. Tailab, M.M.K. Using importance-performance matrix analysis to evaluate the financial performance of American banks during the financial crisis. Sage Open 2020, 10, 1–17. [Google Scholar] [CrossRef] [Green Version]
  74. Barclay, D.W.; Higgins, C.A.; Tompson, R. The partial least squares approach to causal modeling: Personal computer adoption and use as illustration. Technol. Stud. 1995, 2, 285–309. [Google Scholar]
  75. Hair, J.F.; Risher, J.J.; Sarstedt, M.; Ringle, C.M. When to use and how to report the results of PLS-SEM. Eur. Bus. Rev. 2019, 31, 2–24. [Google Scholar] [CrossRef]
  76. Hair, J.F.; Black, W.C.; Babin, B.J.; Anderson, R.E.; Tatham, R. Multivariate Data Analysis, 7th ed.; Pearson Prentice Hall: Hoboken, NJ, USA, 2010. [Google Scholar]
  77. Diamantopoulos, A.; Siguaw, J.A. Formative versus reflective indicators in organizational measure development: A comparison and empirical illustration. Br. J. Manag. 2006, 17, 263–282. [Google Scholar] [CrossRef]
  78. Ab Ghani, M.Z.; Abd, Z.; Ibrahim, I.; Musa, Z. Defining the critical success factor in FM Malaysian healthcare sector. In Proceedings of the 3rd International Building Control Conference, Hotel Royale Chulan, Kuala Lumpur, Malaysia, 21 November 2013; pp. 1–10. [Google Scholar]
  79. Amaratunga, D.; Haigh, R.; Sarshar, M.; Baldry, D. Application of the balanced scorecard concept to develop a conceptual framework to measure facilities management performance within NHS facilities. Int. J. Health Care Qual. Assur. 2002, 15, 141–151. [Google Scholar] [CrossRef]
Figure 1. Result of structural equation modeling (SEM).
Sustainability 13 11908 g001
Figure 2. Importance versus Performance of value-based maintenance practices.
Sustainability 13 11908 g002
Figure 3. Critical success factors of the value-based building maintenance model.
Sustainability 13 11908 g003
Table 1. Value-based factors and indicators.
Value-Based FactorsIndicators
1User InvolvementUser Expectation
User Involvement
User Satisfaction
2Value AddedIntegrated Service Solutions
Innovative Improved Practices
Value for Money
Cost Reduction/Saving
Responsive to Needs
3Value Co-CreationSharing of Information
Operational Integration
Intensive Cooperation
Knowledge Transfer
Effective Communication
Transparency of Internal Information
Openness and Honesty
Shared Risks
Mutual Trust and Confidence
Relationship Synergies
Strategic Integration
Strategic Alignment
Strong Governance
Sharing of Information
Operational Integration
Table 2. Measurement items.
ConstructsItemsScale
Value Outcomes11 (reflective)6-points Likert scale:
1 = Strongly Disagree
2 = Disagree
3 = Slightly Disagree
4 = Slightly Agree
5 = Agree
6 = Strongly Agree
User Involvement3 (reflective)
Value Add5 (reflective)
Value Co-Creation15 (reflective)
Table 3. Respondent profiles.
DescriptionFrequency
(66 Samples)
%
Years of Experience
Mean5.19
Standard deviation2.593
Range1–14
Position
Engineer2740.9
Assistant engineer3959.1
Total66100
Education (Level)
Diploma3248.5
Bachelor’s degree3147.0
Master’s degree34.5
Others00.0
Total66100
Table 4. Importance and performance (constructs).
ConstructImportancePerformance
Co-Creation0.31878.696
User Involvement0.07182.309
Value Added0.417 (highest)74.413 (lowest)
Table 5. Importance and Performance of indicators.
CodeIndicatorsIndicator
Importance
Ranking of
Importance
Indicator
Performance
Ranking of
Performance
VAL5Responsive to needs0.129176.06114
VAL1Integrated service solutions0.081280.3036
VAL2Innovative improved practices0.078373.63616
VAL3Value for money0.069467.879 18
VAL4Cost reduction/saving0.061571.51517
STR1Strategic integration0.043676.36413
WWW3Relationship synergies0.040781.2125
STR3Strong governance0.035878.1829
USE3Measure user satisfaction0.034984.848 1
COM3Openness and honesty0.0331077.27312
STR2Strategic alignment0.0321177.87910
WWW2Mutual trust and confidence0.0311274.84815
OPE2Intensive cooperation0.0301380.3036
JOR3Sharing of information0.0281478.7888
COM1Effective communication0.0271582.4243
USE2User involvement0.0231677.87910
OPE3Knowledge transfer0.0211781.5154
USE1User expectation0.0141883.3332
Table 6. Critical success factors.
CategoryIndicatorsDecision
Concentrate HereVAL5Critical success factor
Keep Up the Good WorkVAL1, VAL2, VAL3Critical success factor
Possible OverkillCOM1, COM3, JOR3, OPE2, OPE3, STR1, STR2, STR3, WWW2, WWW3, VAL4, USE1, USE2, USE3-
Low Priority--
Publisher’s Note: MDPI stays neutral with regard to jurisdictional claims in published maps and institutional affiliations.

