Abstract
Urban integration, a new concept in urban and regional research, is an inevitable outcome of urban development. Based on accessibility analysis, this study uses urban and road network data to identify urban pairs in Northeast China which meet the distance threshold for urban integration and establishes an index system to evaluate the development potential. The research shows that in Northeast China, the results for urban integration are similar to those for the present urban structure in China, that is, a spatial pattern with provincial capital cities at the core and an urban belt as the axis. According to the evaluation, areas with potential for urban integration may be classified into four categories, namely, dominant areas, key areas, ordinary areas, and alternative areas. The candidate and potential areas for urban integration tend to be concentrated near a provincial capital city or a regional development zone. The results show that the development potential for urban integration varies greatly among the different urban pairs and the main constraining factors are different for each location. Among the constraining factors, the commuting time, costs, and economic conditions for the citizens are the most important.
1. Introduction
Urban integration is a new concept in the context of urban development in China. It is also a mode for promoting urbanization in China [1]. The concept of urban integration was first described in the Shenzhen 2030 Urban Development Strategy published by Shenzhen City in 2005, where the aim was to strengthen the cooperation between Shenzhen and Hong Kong in various fields and unify the development of the two regions. Following the integration of Shenzhen and Hong Kong [2], a number of regions in China have successfully implemented the strategy for urban integration including Guangzhou-Foshan [3], Shenyang-Fushun [4], Xi’an-Xianyang [5], and Xiamen-Zhangzhou-Quanzhou [6], and these regions have become examples of a new paradigm for regional governance and integrated development. Gradually, urban integration has evolved from a development strategy to a process of urbanization and regional development [7,8]. Unlike regional units such as traditional metropolitan circles [9] and urban agglomerations [10], urban integration has a smaller geographical scope, and ordinarily occurs between a few adjacent cities [11]. As a new process of urbanization and regional development, urban integration has become a pragmatic choice to break the shackles of traditional administrative borders and establish a new integrated development pattern [7,12,13]. Although the scope for urban integration is relatively small, the competitiveness associated with urban integration is significant for the area in question and for urban agglomeration [14,15]. Therefore, urban integration attracts much interest from researchers in governance and management, urban planning, and many other related fields.
Urban integration, as a new concept in China, is infrequently quoted by non-Chinese researchers, and instead such research work tends to focus on the topic of regional integration. For instance, Cardoso highlights the barriers between municipalities of second-tier cities in the process of European regional integration [16]. Meijers et al. draws attention to the regional integration of polycentric cities [17]. Puga focuses on regional policies in Europe, such as the role of transport infrastructure improvement on regional integration [18]. Researchers in China tend to focus on systematic studies on urban integration. Xu et al. have carried out in-depth speculation on the concept and connotation of urban integration [14]. Zheng and Hui have analyzed the basic characteristics and manifestation forms of urban integration [5]. Sang et al., Duan and Liu, and Jiao and Sun have given attention to the formation mechanism and organizational mode of urban integration [1,4,13]. Peng and Qu proposed development ideas and countermeasures from the perspective of policy implementation [12]. Zeng highlighted the relationship between urban integration, metropolitan circles, and regional integration [19]. In addition, some researchers have highlighted the scientific problems of urban integration from specific perspectives such as transportation [20], industrial production [21], and tourism [22].
From the perspective of the conditions for urban integration, the parallel development of resources, industry, culture, and many other fields bring positive effect and benefits to communities. However, the preconditions for urban integration are good transport conditions [1,14,23,24], geographical proximity, and accessibility [20]. From the perspective of the analytical unit, cities targeted for urban integration are mainly megacities and large cities, but small and medium-sized cities, county towns and towns can also be included [1]. A difference in the levels of administration also has to be considered if urban integration of different units is to be achieved, such as for the cities of mainland China and Hong Kong and Macao, cities of municipalities directly under the Central Government and provincial capitals, and cities of prefectures and counties. Urban integration is the product of urban development at a certain point in time, and its formation and development are trends [13]. In addition to the current urban areas proposed by government officials and researchers, there is the issue of whether there are other areas with the right conditions for urban integration, how to quantitatively identify and evaluate their development potential, and how to formulate plans for implementation on a spatial basis. These aspects are scientific issues worthy of further study. In recent years, transportation accessibility has been widely used in urban studies [25,26,27], which provides ideas for identification methods of urban identity.
Northeast China is the earliest industrialized region in China. Its urbanization process is earlier and its urban system is mature. It is a representative region of urbanization research. For a long period, Northeast China has formed a spatial development pattern consisting of a polarized core and a polarized axis with the Harbin-Dalian railway being the main axis and together with aggregation of the four main central cities (Harbin, Changchun, Shenyang, Dalian), a high priority was given to the promotion of industry, communities, science and education, and other resource elements within this axis cluster. In Northeast China, there are a large number of small and medium-sized cities and towns adjacent to each other, which have the natural and social basis to develop jointly and thus create a large city; however, in the actual process of urbanization an economic depression can set in. As mentioned, over the long term, the development pattern, consolidated by having the Harbin-Dalian railway line as the axis, is an important reason for recession in this region. How to identify and establish a new growth pole for this region has become a priority. Urban integration, encompassing an urban development strategy of promoting regional integration, resource sharing, overall planning, and cooperation and improving the overall competitiveness of the region, is helpful for exploring new development space in the region. Based on this background, focus is given to an identification method for evaluating the potential for urban integration. A model of transport accessibility is used to identify possible regions for urban integration and an index system is constructed to evaluate the development potential. In so doing, the aim is to provide scientific guidance for optimization of urban construction and development patterns in Northeast China. The urban development experience of northeast China can also be used for reference to other regions in order to provide scientific guidance for urbanization construction.
2. Methodology
2.1. Study Area and Data
The study area of Northeast China covers Heilongjiang, Jilin, the three provinces of Liaoning and eastern Mongolia, including Hulunbuir City, Hinggan League, Chifeng City, Tongliao City, and Xilingol League. The spatial analysis unit is county-level towns and cities, and sample selection is based on the following rules. The built-up areas of prefecture-level cities are merged into independent units; county and county-level cities are independent units; the urban areas, which are independent of the main urban areas, or the new urban areas are divided into districts after the omission of counties and are regarded as independent units. Accordingly, 272 urban units were selected as samples, including 40 prefecture-level main urban areas, 43 isolated urban areas, 96 counties, 62 county-level cities, and 31 banners.
The calculations performed in the study involve the journey times for traffic and the development potential, and they need to be based on future scenarios and accurate data for the traffic network. First, the selection of the data collection time should consider the future transportation network. In this study, the comprehensive transportation network in Northeast China is based on the National Comprehensive Three-dimensional Transportation Network Planning Outline (2021–2050) published by the Ministry of Transport in 2020. The line vector data for various transportation modes were also collected. Second, the map for the status of the transportation network was vectorized and revised on the basis of the China Transportation Atlas published by China Cartographic Publishing House in 2020. There are a large number of indicators for evaluating the development potential of urban integration, each of which has different data sources. Among them, the urban population and economic data came mainly from the Chinese City Statistics Yearbook 2019, Counties in the 2019 China Statistical Yearbook, the regional social and economic statistical bulletins (2018) covering the topography and land use, the medium objects coming mainly from remote sensing images (2019) and the Baidu map; the administrative level data came mainly from the Handbook of Chinese Administrative Divisions, 2019; and traffic times and traffic route data came mainly from the comprehensive transportation network and calculations for Northeast China.
2.2. Description of Model
Urban integration refers to the process in which a city and its neighboring cities possess the conditions for integrated development to occur naturally from the economic, societal, and cultural standpoints, whereby a highly integrated region with compact spatial organization and close economic ties is formed [10]. Urban integration is a spatial process, and a precondition is the distance threshold [7]. Distance can be classified as the spatial physical distance, the distance as determined by the traffic route, the distance as determined by journey time (rail and road), and various other categories. The distance as determined by the journey time by vehicles is the main factor used to determine the direction, strength, fluency, and routes of flow of the resource elements, and is determined by the connection mode, the technical attributes, the running speed, and other comprehensive effects of the different types of transport links between cities. This paper uses the journey time for traffic as a measure of distance and spatial connectivity between cities, identifying the urban pairs that meet the distance threshold as regions that are likely to realize urban integration.
The traffic circle refers to the scope to attract traffic to the central area of a city and is usually measured by the time it takes for vehicles to cover the overall distance for the journey. For example, using a hierarchical structural term, the traffic circle may be 15-min, 30-min, 1-h, etc. Social economic activities differ greatly for the different circles. Among them, the 15-min traffic circle covers the area of most daily activities of the residents and is called the daily circle. A 30-min traffic circle can be taken to represent the area of employment, the school run, and the day to day activities of the residents, and is called a commuting circle. A 1-h traffic circle, also known as the economic circle, encompasses industrial activity and economic cooperation between cities. Given that the core concept of urban integration is commuting, 30 min was selected as the recognition threshold for the traffic time.
The model for the minimum traffic time in this study is now described. The shortest time matrix for all cities is M:
where tij is the shortest traffic time from the starting point i to the end point j, and n is the number of cities. Let the shortest route from the starting point i to the end point j pass through m intersections, denoted as . The starting point i is denoted as and the end point j is denoted as , then tij meets the following conditions:
when i = j,
and when i ≠ j,
where is the distance between intersection i and intersection j, and is the speed of travel.
The setting of the traffic speed should distinguish between the technical speed and the actual operating speed. The former is technically the allowable speed and ordinarily the highest speed. The latter is the actual speed, and the journey time includes not only the running time, but also the stopping time and the elapsed time due to traffic jams. With reference to China Highway Engineering Technical Standard (JTGB01-2003), the railway schedule speed and the Harbin-Dalian high-speed railway schedule, and taking into account waiting times, traffic jams, and other factors, the operating speed was set as 50 km/h for national and provincial highways, 80 km/h for expressways, 60 km/h for conventional railways, and 170 km/h for high-speed railways.
In addition to the condition of spatial proximity, urban integration should also have development potential [4]. The development potential of urban integration is normally evaluated from various aspects, such as population, economy, physical geographical conditions, and connectivity [6,28,29]. To measure the development potential, an index system was established where we quantified the development potential based on indicators that reflected seven significant aspects such as population, economy, land use, administrative relationship, medium object, connectivity, and traffic time (See Table 1). The key elements of the index system may be categorized as follows: (1) According to the topography and landforms, the land use conditions can be divided into five types: plain, valley, hill, mountain, and river. Each land use type has significantly different influences on urban integration, especially the industrial distribution and urban construction in the mid-point area. For example, Plain provides good conditions for urban integration, and is given high value. River cuts off the communication between the two banks, and is given low value. (2) According to the level of administration and the subordinate relationships between the two towns, the administrative relationship can be divided into eight categories and assigned values, respectively. The administrative boundary is the factor restricting urban integration, and categories that cross no administrative boundary are given higher values. (3) The population and economic conditions are measured using the population and GDP statistics. Population is an important index to measure the size of a city, and its size directly determines the potential for urbanization and the size of the new city after urban integration. The local economy is the financial foundation and the key driving force for achieving urban integration, hence the local economy reflects the driving force and intensity of urban interaction and the flow factor. (4) Medium object refers to the existing entities in the mid-point area between the two towns and mainly relates to carriers such as residences of the townships, industrial parks, colleges, and railway stations. These carriers have the function of attracting and agglomerating the elements of urban urbanization, and the number of carriers reflects the foundation and difficulty of achieving urban integration. (5) Connectivity and commuting time. Connectivity refers mainly to the traffic routes between two towns, and includes high-speed railways, conventional railways, intercity railways, expressways, and national and provincial highways. The traffic route provides the traffic capacity and path for the flow and optimal allocation of resource elements between the two towns. The commuting time is not only an indicator to identify the urbanization unit, but also an indicator to reflect the development potential. The shorter the commuting time, the greater is the potential for the two towns to realize urban integration.

Table 1.
Evaluation index for the potential for urban integration in Northeast China.
In this paper, the entropy weight method is used to calculate the weight of each index. The proportion of sample j in the i index is as follows:
is the information entropy of index i:
is the weight of index i:
Before calculating the total score, the seven indicators were first standardized:
According to the above weights and standardized scores, the formula for calculating the development potential of each pair of towns is as follows:
3. Identification of Urban Integration in Northeast China
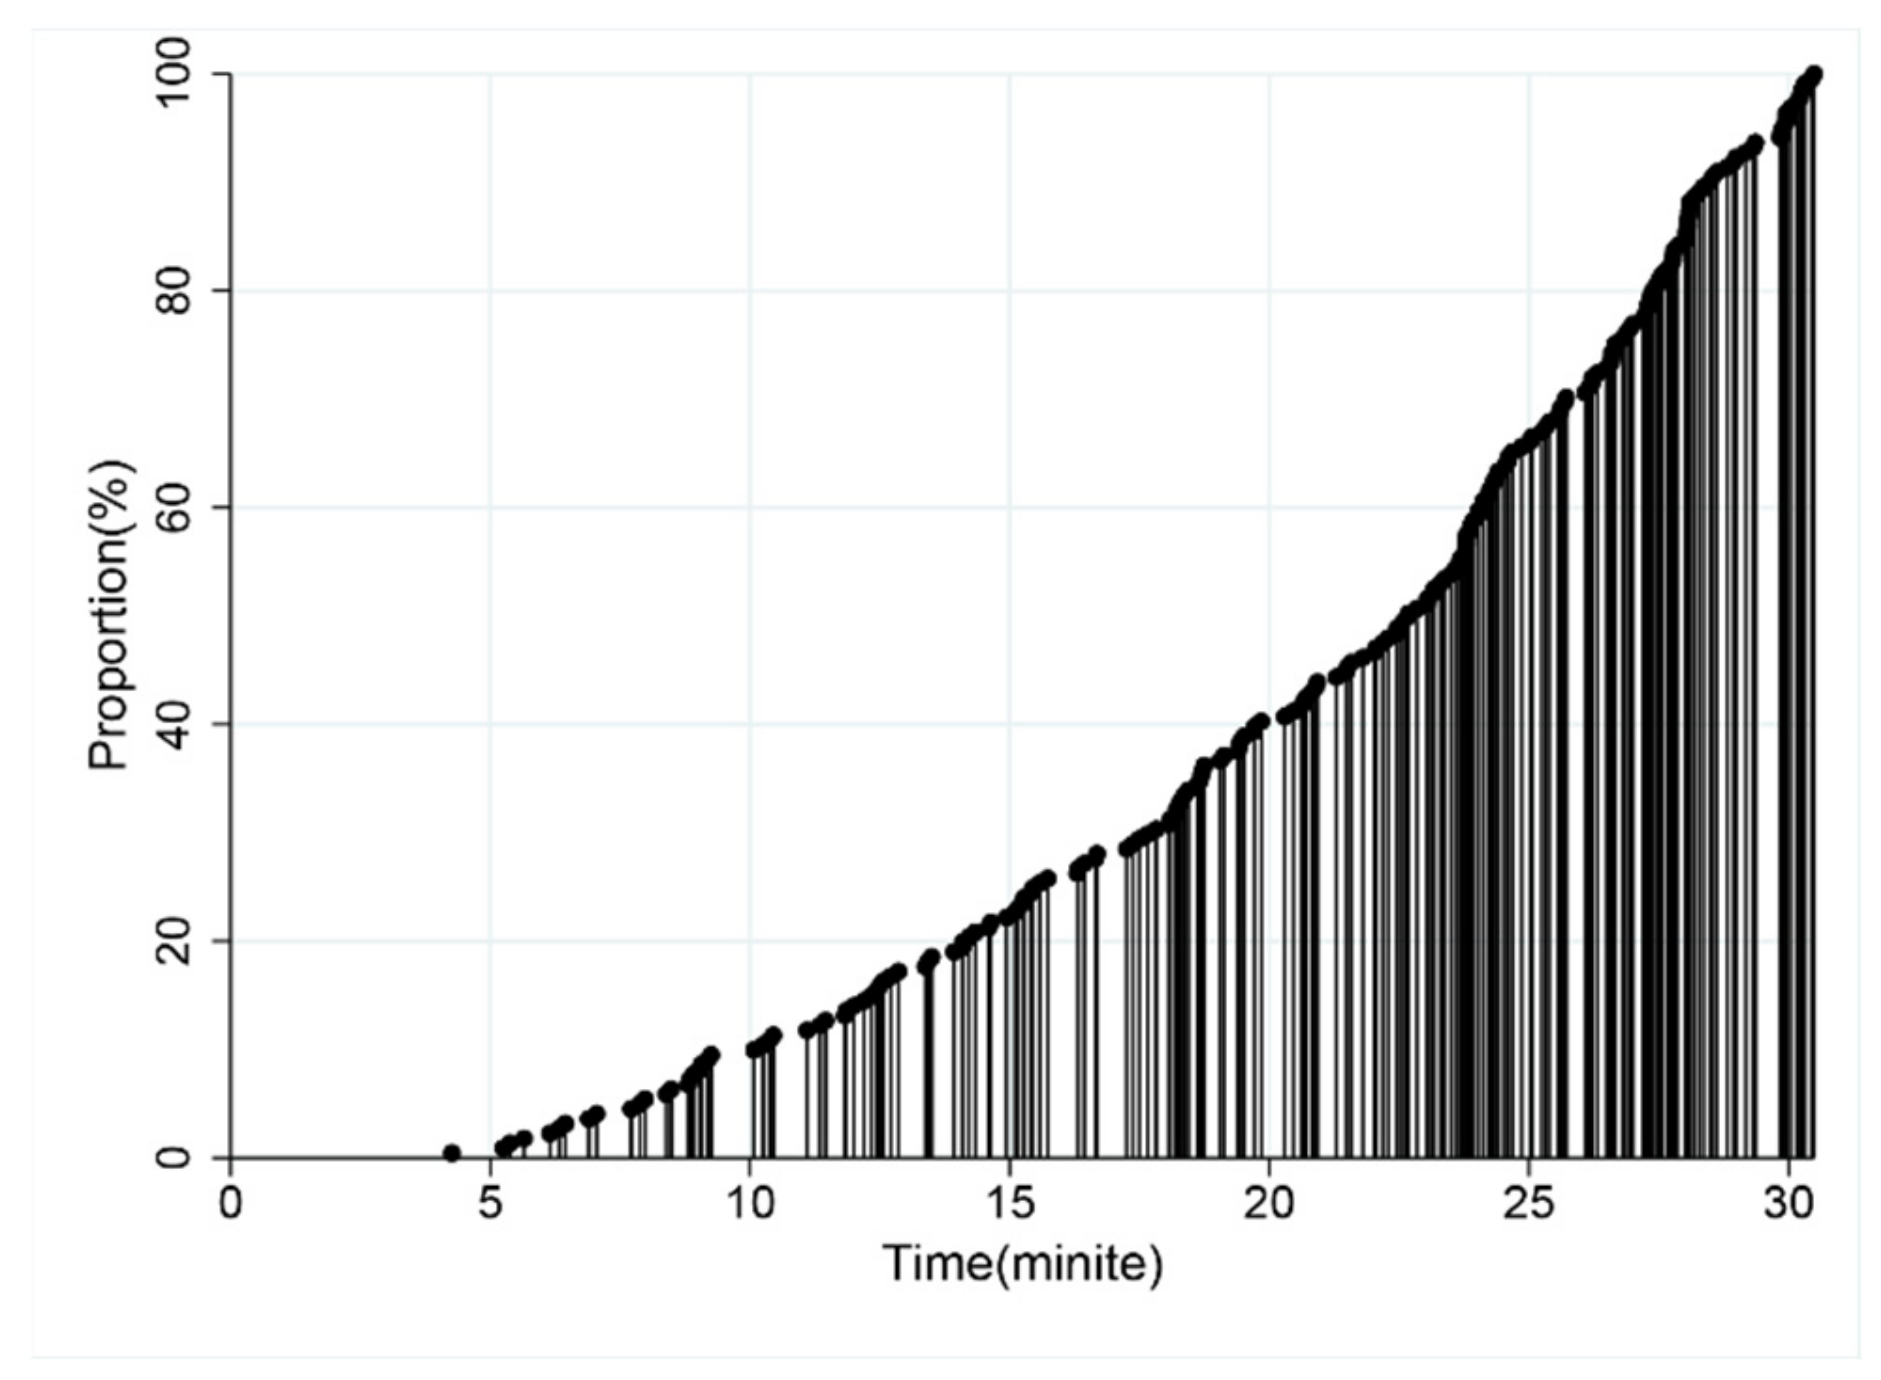
According to the threshold for the traffic time as outlined above, typical times for the traffic circles in Northeast China have been identified. For the 15-min living circle, 55 pairs of cities meet the threshold, accounting for just 0.15% of the total number of cities; this indicates that relatively few cities and towns are able to support the social activities that are necessary to sustain the daily lives of city dwellers. There were 221 pairs of cities and towns satisfying the 30-min commuting circle, representing a relatively low proportion of 0.6% of the total number of cities; this commuting circle is the focus of research. There were 883 pairs of cities and towns that met the 60-min commuting circle, accounting for 2.4% of the total number of cities. The distribution of town pairs meeting the 30-min threshold was uneven. The pairs of towns were more concentrated between 15 and 30 min; especially between 23 and 30 min, the proportion reached the highest value of 46.2%. The proportion of town pairs between 25 and 30 min was also high, reaching 32.1%, and the proportion of town pairs between 20 and 25 min reached 26.7%, accounting for 58.8% of the total. The details are shown in Figure 1.
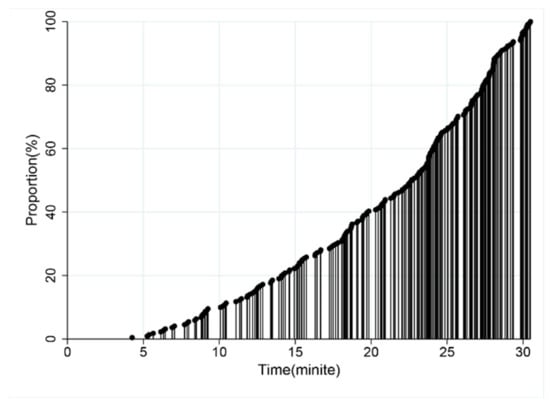
Figure 1.
Relative distribution of urban pairs for a 30 min traffic journey in Northeast China.
As Table 2 suggests, when specifying the town unit, there are 172 cities and towns that meet the 30-min commuting circle, accounting for 63.2% of the total number of towns and cities. These cities and towns are widely distributed throughout Northeast China, including 3 provincial capitals, 34 prefecture-level urban districts, 61 counties, 37 county-level cities, and 37 isolated urban districts. These data reveal that there is scope for implementing widely the urban integration strategy in Northeast China.
Table 2.
Distribution of urban integration units in Northeast China.
As shown in Figure 2, the cities and towns that can realize urban integration have some spatial features. (1) The cities are distributed widely in four provinces. Among them, 65 cities are distributed in Heilongjiang Province, accounting for 37.8% of the total number of cities, this being the highest figure. Sixty-one cities are distributed in Liaoning Province, accounting for 35.5% of the total number of cities. Thirty-five cities are distributed in Jilin Province, accounting for 20.3% of the total. The Inner Mongolia region is mainly a vast grassland sparsely populated and there are only 11 city units scattered throughout the country. (2) The distribution of urban areas throughout Northeast China is uneven and exhibits a pattern of city agglomeration and urban belt concentration. In the plains area, the distribution of urban units is relatively dense, and even forms concentrated contiguous urban areas, such as in the Songnen Plain and the Liaohe Plain, especially the central and southern Liaoning urban agglomeration, the Changchun metropolitan circle and the Harbin metropolitan circle. At the same time, an urban belt has been formed around the high-speed railway, and an urban agglomeration belt has been formed with the Harbin-Dalian Railway as the axis; an agglomeration belt has also been formed in the east and west of Heilongjiang Province and the southeast of Jilin Province. However, there is less distribution of urban towns in the Xing’an Mountains, the Changbai Mountains, the Eastern Mongolia grassland, and the Sanjiang Plain, regions forming a continuous uncovered area. (3) Urban pairs rarely cross provincial boundaries; however, there are a number which cross municipal boundaries. Most of the urban pairs are distributed within the provinces and autonomous regions, with a total of 207 pairs, accounting for 93.7% of the total, which reflects the administrative constraints of urbanization. There are 14 cross-province urban pairs with the Liaoning-Jilin urban pair having the most (7). There were three Liaoning-Mongolia urban pairs, two Heilongjiang-Mongolia urban pairs, one Jilin-Heilongjiang urban pair, and one Jilin-Mongolia urban pair. There are 96 pairs of cities located in the same prefecture-level city, accounting for 43.4% of the total, and 125 pairs of cities across the prefecture-level cities, accounting for 56.6% of the total.
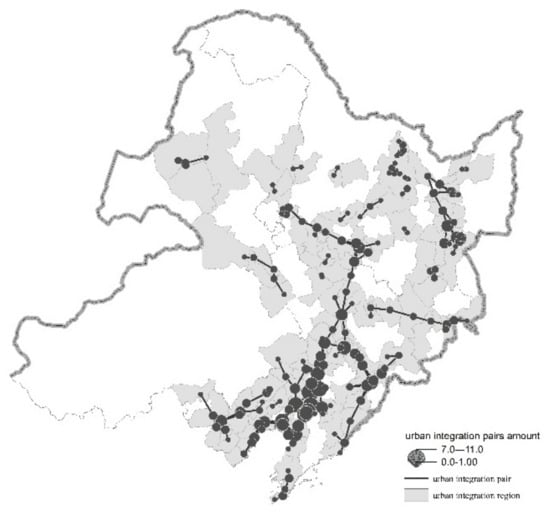
Figure 2.
Distribution of urban integration pairs in Northeast China.
4. Types and Patterns of Urban Integration
The cities and towns of interest in this study each have unique locations and consequently they form different relationships with each other. This leads to the formation of distinct patterns of urban integration which differ significantly in terms of spatial form and organizational mode. According to the spatial pattern, this study categorizes urban integration into five modes, that is, the metropolitan area, urban agglomeration, the sub-central city, the potential new city, and the urban belt. The differences in the respective spatial patterns reflect the great differences in the direction and path of urban construction.
(1) Metropolitan area mode. In this mode, the center of the city is the common object, thus we adopt the concept of ‘multiple to one master’, to describe the structural organization of urban integration which can be likened to a star radiating its energy. The surrounding small and medium-sized towns actively connect and integrate with provincial capitals and cities with separate planning, while the central city spreads and radiates to the former. Evacuation of urban functions, division of labor, and optimization are the directions for achieving urban integration for this mode. This mode covers some urban units, and the central cities are provincial capitals and separately planned cities, but the number is relatively small. In Northeast China, the key point is the integration of the provincial capital cities and the surrounding small and medium-sized cities with respect to areas of industry, population, urban function, etc. This mode relates mainly to the Changchun and Dalian metropolitan areas, with each covering 6 towns and forming 5 town pairs, respectively.
(2) Urban agglomeration mode. This mode is organized in the form ‘multiple to one master’ and ‘secondary to secondary connection’, and it presents as an urban area with a circular or triangular shape, and mutual connectivity is a characteristic feature. This urban agglomeration mode includes two levels. The first level refers to urban agglomeration with large coverage which takes the form of having a metropolitan area as the core and linking to large and medium-sized cities, such as the central and southern Liaoning urban agglomeration and the Harbin urban agglomeration, respectively. The urban agglomeration in central and southern Liaoning has wide coverage extending to 19 towns and 46 town pairs. It is the largest urban agglomeration in Northeast China and is the most prominent example of the phenomenon of urban integration, having the most overlapping and the most complex connectivity.
(3) Urban belt mode. This mode refers mainly to a continuous linear urban belt with linear connectivity and a distribution of urban pairs and at least three urban units in the same extended direction. The important carrier for this mode is the traffic axis. Cities at both ends of the axis are connected to the city at the mid-point along the traffic route. This applies mainly to the Harbin-Dalian belt, the Harbin-Daqing-Qiqihar city belt, the northern Yichun city belt, the Jilin-Yanji city belt, the Siping-Tonghua city belt, the eastern Liaoji-Jilin city belt, the Liaoning coastal city belt, the Liao-Mongolia city belt, the northwest Liaoning city belt, and the Jilin-Mongolia city belt.
(4) Sub-central city model. This model refers mainly to spatial patterns reflecting the jurisdictions of the prefecture-level cities and counties in question. In Northeast China, this model extends and connects prefecture-level urban areas to neighboring counties or isolated urban areas, and is conducive to the expansion of prefecture-level urban areas and the formation of new sub-central cities. This model covers a large number of cities and towns, including Mudanjiang, Hulun Buir, Qiqihar, Daqing, Yanji, Yichun, Tonghua, Liaoyuan, Shuangyashan, Jixi, Siping, Baishan, Fuxin, Chaoyang, and Jinzhou.
(5) Potential new city mode. In this mode, two or more county-level cities and towns are integrated into cities. This mode involves a large number of cities and towns, which are scattered and isolated, and most of them are at the periphery of metropolitan areas, and at the end of the urban belt and in remote areas, especially in grassland areas and hills. There are 13 urban pairs, accounting for 5.8% of the total number of urban pairs.
5. Evaluation of the Development Potential of the Northeast Urban Integration Area
5.1. Results of Evaluation
The above-mentioned survey only identified the urban towns that meet the basic conditions for the 30-min traffic circle, but this does not mean that all these urban pairs can achieve urban integration. The potential for achieving urban integration needs to be assessed comprehensively based on land use conditions, the population, the economy, and other factors. According to the aforementioned index system, the development potential for urban integration was evaluated.
The overall scores for development potential range between 0.07 and 0.82; moreover, there are different numbers of town pairs in each scoring section, showing the structural characteristics of ‘less at both ends, more in the middle’, as shown in Table 3. The number of urban pairs in the top three scoring areas is small, and the number of urban pairs in the 0.81–0.90 scoring area is the least; among the neighboring provincial capitals and prefecture-level cities, there is only one urban pair with a high value (0.819) and that is the Shenyang urban district-Fushun urban district. There are four urban pairs in the range 0.71~0.80. The number of town pairs in the range 0.61 to 0.70 was 14. The proportion of urban pairs in these previous three regions was only 8.6%. The development potential for most urban pairs was between 0.21 and 0.60, amounting to 166 pairs and representing 75.1% of the total. In the 0.31–0.40 and 0.21–0.30 categories, the number of urban pairs were 61 and 50, accounting for 27.6% and 22.62% of the total, respectively. In the 0.41–0.50 and 0.11–0.20 categories, 38 and 34 urban pairs accounted for 17.19% and 15.38% of the total, respectively. There were 17 pairs of urban pairs in the 0.51~0.60 category, and only 2 pairs in the 0.06~0.10 category, which had the lowest score.
Table 3.
Grade and integration potential for urban pairs in Northeast China.
5.2. The Categories of Urban Pairs
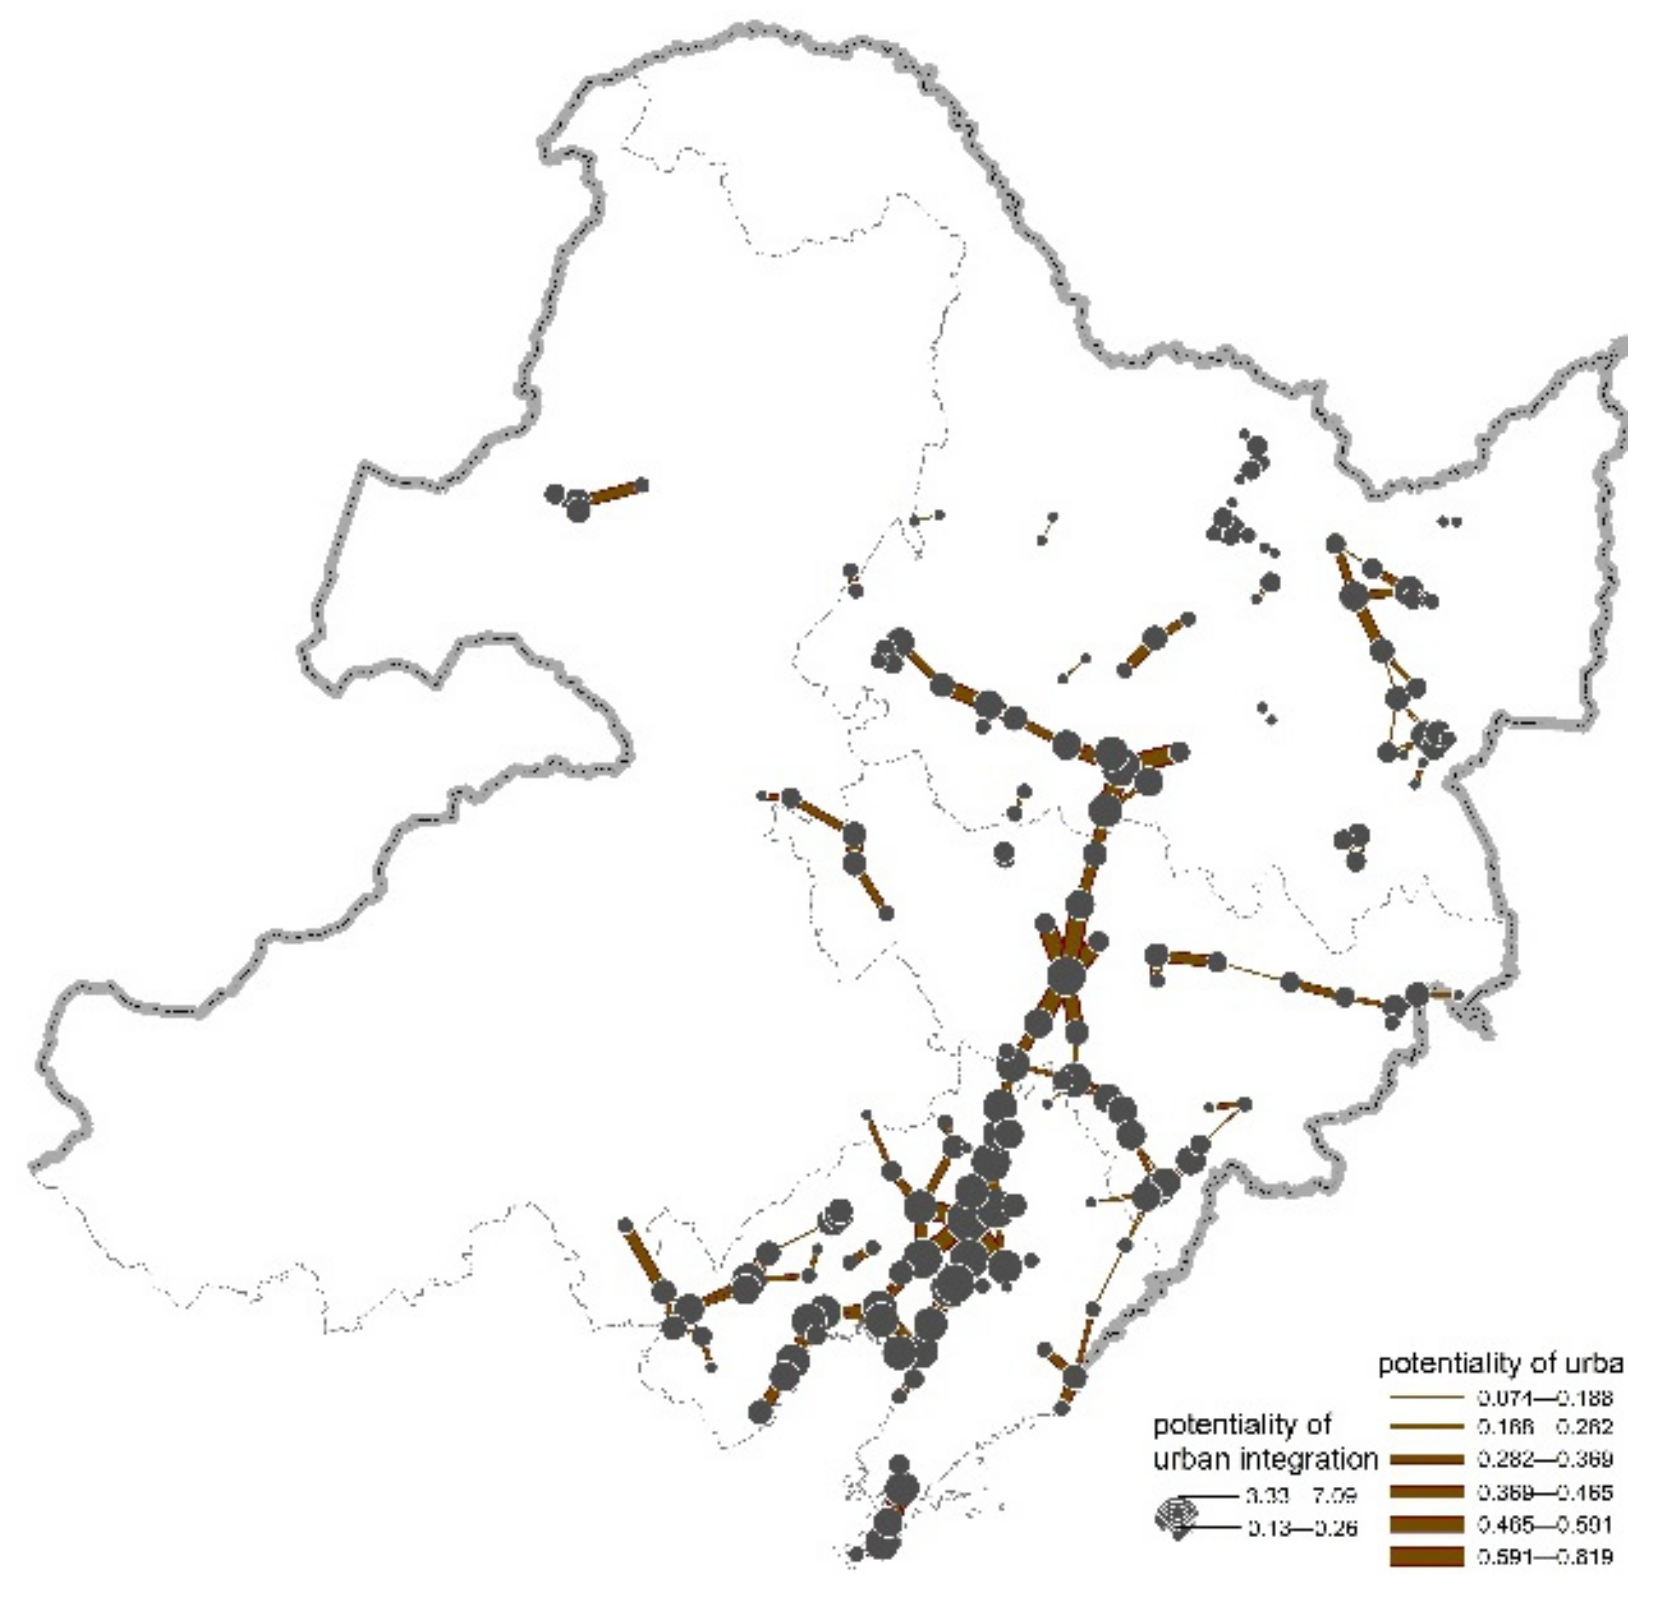
To further evaluate the potential of urban pairs, classification is necessary. Some scholars classify cities into different categories and give policy advice [10,30,31]. According to the above results, the urbanization potential of each urban pair may be categorized broadly into four levels, that is, a dominant region, a key region, an ordinary region, and an alternative region. Among these categories, as illustrated in Figure 3, the dominant regions and the key regions are the focus for urban construction, since they should be promoted first.
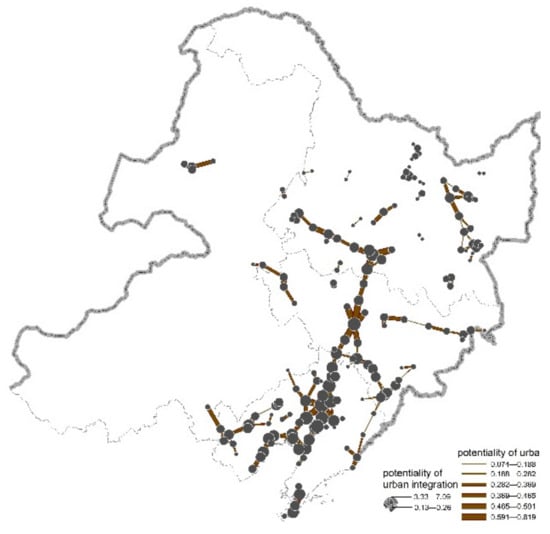
Figure 3.
Spatial patterns illustrating the potential for integration for urban pairs in Northeast China.
- (1)
- Dominant area. This category refers mainly to urban pairs which have a development potential greater than 0.60. This type of urban pair has a good foundation for development having an average development potential of 0.67, large population and economy, short commuting times, more medium objects between cities and towns, and strong transportation capacity, these features being key priority elements for urban construction. There are 19 pairs such urban pairs, accounting for 8.59% of the total, and involving a total of 23 cities and towns with an urban coverage rate of 13.37%, and showing a pattern of ‘low number, high concentration.’ In this category, the cities and towns are connected mainly to central cities, especially Shenyang, Harbin, and Changchun, and all feature a large urban metropolitan area. With the plains as the main terrain, the land use conditions are good, and these conditions contribute to desirable characteristics for a metropolitan area. Among the metropolitan areas, Shenyang has the most urban integration objects (9), which includes the Liaoyang urban area, the Anshan urban area, Dengta County, Shenbei New Area, Liaozhong County, Xinmin County, the Tieling urban area, the Fushun urban area, and the Benxi urban area. These metropolitan areas, which have an average development potential score of 0.672, form a spatial pattern of ‘a central city plus an adjacent prefecture-level urban area and county area.’ Changchun has four urban integration objects, including Dehui City, Gongzhuling City, Jiutai City, and Nong’an County, which constitute the Changchun metropolitan area with an average development potential score of 0.631, and forms a spatial pattern of “a central city plus adjacent counties and districts.” In the case of Harbin, there are four urban integration objects, namely, Shuangcheng city, Acheng City, Bin County and Hulan County, and these form the Harbin metropolitan area which has an average development potential score of 0.692, the formation mode consisting of a “central city plus adjacent counties.” Dalian has two urban integration targets, namely, Jinzhou district and Pulandian City.
- (2)
- Key areas. This category refers mainly to urban pairs with scores between 0.41 and 0.60. There are 55 such urban pairs, accounting for 24.88% of the total. A total of 77 cities and towns were covered, with a coverage rate of 34.8%. Such areas have high potential for urban integration and are also key areas for achieving urban integration, with an average development potential score of 0.476. The urban areas of Anshan, Liaoyang, and Tieling, respectively, each have four urban towns, and with the advantage of having an intermediate location in the central or northwest part of Liaoning. The urban areas of Daqing, Lighthouse, Huludao, Kaiyuan, and Liaoyang, respectively, each have three cities and towns, all distributed in the central and southern parts of Liao. Most cities have few urban integration targets. There are 55 cities with only one target and 14 cities with two targets. Some cities and towns have specific weaknesses with respect to urban integration based on their respective development potential scores. For example, Shuangyashan City and Jixian County scored low in terms of population and the economy. If there is an increase in the population, and/or an improvement in the economy or transportation conditions, the current constraining effect of these towns will be weakened, and the potential for urban integration will be enhanced.
- (3)
- Ordinary area. This category refers mainly to town pairs with development scores between 0.21 and 0.40. There are a total of 111 urban pairs of this type accounting for 50.2% of the total, and involving 124 cities and towns, with a wide coverage of 72.09%. The conditions and foundation of urban integration in these cities and towns are relatively weak, and constrained by multiple conditions, hence resulting in an ordinary development potential with an average score of 0.305. With respect to urban integration, there is a lack of concentration in connectivity. Fifty-nine towns have only one urban integration object, and 43 towns have only two urban integration objects. There are 22 cities and towns with more urban objects; Liaozhong County has the most urban objects (6), and Siping City, Panjin City, and Dashiqiao City each have five objects, respectively, Dawa County, Haicheng City, and Linghai City have four objects, respectively, and there are 15 cities and towns with three objects, respectively. These areas are mainly distributed to the east of Harbin, the east of Jilin, the east of Liaoning, and the east of Mongolia.
- (4)
- Alternative areas. This category refers mainly to the urban pairs with an urban integration development potential score of lower than 0.20. There are 36 pairs of urban pairs of this type, accounting for 16.3% of the total. This number is relatively small, but the coverage is widespread, involving 57 cities and towns, and the coverage rate reaches 33.1%, hence revealing the characteristics of ‘low number and wide distribution’. The average potential development score for these urban pairs is 0.15 because of the small populations, the low level of economic activity, poor land use conditions, long commuting times due to the long distances, and obvious administrative boundary constraints. In particular, the potential development scores for urbanization in Boli County and Dido district are the lowest, being less than 0.1. The typical feature of this type of area is that there is clear dispersion. There are 46 towns with one urban object. Only Boli County has four connecting objects; Linkou and Huanren county each have three urban objects, respectively, and there are eight towns with two urban objects.
6. Conclusions and Discussion
Urban integration is an important means and mode to achieve urbanization. The foundation of urban integration is the distance threshold, and space proximity is the basis for integration of regional industry, the economy, social systems, and other aspects of urban integration. In Northeast China, there are 221 urban pairs that met the 30-min commuting threshold, and 172 cities and towns were involved. Among them, there are many urban pairs that have the potential to realize urban integration, especially in the Songnen plain in Heilongjiang Province and the Liaohe plain in Liaoning Province. These urban pairs seldom cross provincial boundaries (some industries excepted), given that they mostly come under the same local administrative region. Different urban pairs take on different spatial combination forms and organizational modes, such as the urban agglomeration mode, the urban belt mode, the sub-central city mode, and the potential new city mode. Each urban pair has a different development potential, presenting the structural characteristics of ‘less at both ends, and more at the mid-point.’ Cities and towns connected to central cities tend to have a higher development potential, and central cities and prefecture-level cities in central and southern Liaoning have a higher still potential. Different cities and towns may be categorized as having different advantages, key areas, ordinary areas, and alternative areas, but there are fewer cities and towns which enjoy these advantages and key areas.
In general, there are many cities in Northeast China with the ability of integrated development, covering a broad area and not limited to the Harbin-Dalian axis. These cities help to break the development mode centered on Harbin-Dalian Railway and fill the development depression in the process of urbanization. With the advancement of urbanization and upgrading of modern transportation networks, the pattern of land development of urban systems in Northeast China may be characterized as being in evolutionary change. Urban integration plays an important role in the evolution of spatial structure; promotes the formation of metropolitan areas, urban agglomeration, and urban belts; and cultivates a group of secondary city centers. Therefore, the policy guidance of urban integration should be strengthened to promote the evolution of urban system and make urban spatial distribution more reasonable. According to the research results, transportation accessibility is the threshold of urban integration and an important factor affecting development potential. Suitable development strategies should be adopted for the development of urban pairs with lower potential for urban integration, such as infrastructure investment to improve transport accessibility and promote spatial development.
Based on the traffic accessibility and development potential, this study proposed a method to identify and evaluate the urban integration and makes extensive research on the urban integration in northeast China, which provides a basis for further research. The method in the study, from the perspective of traffic perspective, is relatively new for urban integration, and can be improved in further study. In contrast to previous studies, which normally focus on a particular urban pair, this study focused on the macro scale and considered the potential areas within the region from the regional perspective. However, the analysis of key areas and typical cases is relatively simple. The follow-up research can carry out in-depth research on key areas and provide scientific guidance for urban construction and land development in northeast China.
Author Contributions
Conceptualization, Y.G. and C.W.; methodology, Y.G. and C.W.; software, Y.G. and Y.D.; validation, Y.G. and C.W.; formal analysis, Y.G.; investigation, Y.G. and C.W.; resources, C.W.; data curation, Y.G. and Y.D.; writing—original draft preparation, Y.G.; writing—review and editing, Y.G. and C.W.; visualization, Y.G. and Y.D.; supervision, C.W.; project administration, C.W.; funding acquisition, C.W. All authors have read and agreed to the published version of the manuscript.
Funding
This research was funded by National Natural Science Foundation of China, grant number 42071151. This research was also funded by Strategic Priority Science and Technology Project of Chinese Academy of Sciences, grant number XDA20010101.
Acknowledgments
The authors would like to express their deepest gratitude to the editors and reviewers for the valuable suggestions and comments. The authors would also express thanks to Peiran Chen and Yongshun Xie from Institute of Geographic Sciences and Natural Resources Research for their help.
Conflicts of Interest
The authors declare no conflict of interest.
References
- Duan, D.; Liu, L. Reflection on Integrate Development of Neighboring Cities. Plan 2012, 28, 91–94. [Google Scholar]
- Zhu, H.; Li, H. Shenzhen-Hongkong Cross-Border Cooperation Research. Econ. Geogr. 2013, 33, 9–14. [Google Scholar]
- Wei, Z.; Chen, T.; Zhen, F.; Wang, B. Reflections on the Implementation of Urban Integration Planning in China-Taking the Urban Integration Development Planning of Guangzhou and Buddhism as an Example. Urban Plan. Forum 2014, 2, 80–86. [Google Scholar]
- Sang, Q.; Zhang, P.; Luo, Y.F.; Gao, X.N. Formation Mechanism and Countermeasures of Cohesion of Shengyang and Fushun. Hum. Geogr. 2009, 3, 32–36. [Google Scholar]
- Zheng, X.; Hui, Q. Characteristics and Spatial Response of Urban Integration Development Pattern in Xi Xian Region. Planners 2018, 34, 27–32. [Google Scholar]
- He, Z.; Guo, Q.; Yang, Y.; Xiao, L. Evaluation of the Progress of Urban Integration in Xiamen Zhangquan Based on POI data. Planners 2018, 4, 33–37. [Google Scholar]
- Wang, D.; Song, Y. A Review on the Implementation of City Integration Strategy. Urban Plan. Forum 2009, 4, 74–78. [Google Scholar]
- Gao, X.; Wang, H. Analysis on the Problems of Metropolitan Economic Circle and Urban Integration. Enterp. Econ. 2007, 8, 89–91. [Google Scholar]
- Han, G.; Yuan, J. The Geographic Area and Spatial Structure of Changchun Metropolitan Are. Sci. Geogr. Sin. 2014, 34, 1202–1209. [Google Scholar]
- Fang, C. Progress and the Future Direction of Research into Urban Agglomeration in China. Acta Geogr. Sin. 2014, 69, 1130–1144. [Google Scholar]
- Huang, X. A Research on Theory and Practice of Cities’ Synchronization—A Case of Changchun and Jilin; Jilin University: Jilin, China, 2013. [Google Scholar]
- Peng, Z.; Qu, N. Study on Integrative Development and Regional Coordinated Planning Strategies in China. Mod. Urban Res. 2011, 6, 20–24. [Google Scholar]
- Jiao, Z.; Sun, J. Research on China’s Urban Cohesion Mode and System Design. Mod. Urban Res. 2011, 6, 7–10. [Google Scholar]
- Xu, T.; Wei, S.; Wang, Y. Discussion on the Concept of City Integration and Its Definition. Soc. Sci. 2014, 11, 56–60. [Google Scholar]
- Li, X.; Wu, Y.; Wu, R. Research on the Governance of City Integration: A Case Study of Guangzhou-Foshan. Hum. Geogr. 2016, 5, 1–6. [Google Scholar]
- Cardoso, R.V. Overcoming Barriers to Institutional Integration in European Second-tier Urban Regions. Eur. Plan. Stud. 2016, 24, 2197–2216. [Google Scholar] [CrossRef] [Green Version]
- Evert, M.; Marloes, H.; Rodrigo, C. Beyond Polycentricity: Does Stronger Integration Between Cities in Polycentric Urban Regions Improve Performance? Tijdschr. Voor Econ. Soc. Geogr. 2018, 109, 1–21. [Google Scholar]
- Puga, D. European Regional Policies in Light of Recent Location Theories. J. Econ. Geogr. 2002, 2, 373–406. [Google Scholar] [CrossRef]
- Zeng, Q.; Deng, J.; Pan, F. A Research Synthesis on the Synchronization among Regional Cities. Reg. Dev. 2013, 6, 85–95. [Google Scholar]
- Chen, H.; Cao, X.; Liang, F. The Influence of Cross-border Roads on Spatio-temporal Connection in the City Integration Areas: Guangzhou-Foshan Case. Geogr. Res. 2018, 37, 551–563. [Google Scholar]
- Hao, L.; Qiu, B. Research on Hierarchical Urban System Based on the Effect of Urban Integration and Industrial Isomorphism: A Case Study of Urban Agglomeration of the Yangtze Delta Region. J. Chongqing Univ. 2016, 221, 22–32. [Google Scholar]
- Liu, F.; Zhang, J.; Zhang, J.; Chen, D. The Concept, Strategy, and Case Study of Tourism Integration. Inq. Econ. Issues 2010, 3, 168–172. [Google Scholar]
- Ming, X. Thoughts over Integration of Shenyang-Fushun Metropolitan Area. City Plan. Rev. 2007, 10, 52–56. [Google Scholar]
- Lin, J.; Chen, J.; Wu, Y. Research on Transportation Integration and Industrial Layout Evolution. Inq. Econ. Issues 2011, 9, 8–12. [Google Scholar]
- Panagiotopoulos, G.; Kaliampakos, D. Location quotient-based travel costs for determining accessibility changes. J. Transp. Geogr. 2021, 91, 102951. [Google Scholar] [CrossRef]
- Mora, R.; Truffello, R.; Oyarzún, G. Equity and accessibility of cycling infrastructure: An analysis of Santiago de Chile. J. Transp. Geogr. 2021, 91, 102964. [Google Scholar] [CrossRef]
- Jiao, J.; Amin, A. Measuring accessibility to grocery stores using radiation model and survival analysis. J. Transp. Geogr. 2021, 94, 103107. [Google Scholar] [CrossRef]
- Shen, L.; Chen, S.; Wang, X. Development stage segmentation and characteristics of urban integration area in China based on the space of flows. Geogr. Res. 2021, 409, 2558–2571. [Google Scholar]
- Peng, F. Economic spatial connection and spatial Structure of Guangdong-Hong Kong-Macao Greater Bay and the surrounding area cities: An empirical analysis based on improved gravity model and social network analysis. Econ. Geogr. 2017, 37, 57–64. [Google Scholar]
- Sun, T.; Li, M. Grading and classification method and architecture for new smart city. Command. Inf. Syst. Technol. 2016, 76, 66–71. [Google Scholar]
- Huang, W.; Li, S. Study of China’s Urban grade in the era of consumption: Based on the 11 medium and small-sized cities of China. Reg. Econ. Rev. 2015, 2, 136–143. [Google Scholar]

Publisher’s Note: MDPI stays neutral with regard to jurisdictional claims in published maps and institutional affiliations. |
© 2021 by the authors. Licensee MDPI, Basel, Switzerland. This article is an open access article distributed under the terms and conditions of the Creative Commons Attribution (CC BY) license (https://creativecommons.org/licenses/by/4.0/).