Abstract
A global energy consumption reduction is essential to address the many dimensions of the current ecological crisis. In this paper we have compiled the reasons that justify the necessity to start this energy descent process in the countries of the global North, where the annual per capita final energy consumption was 118 GJ in 2017. Based on recent research, we approach the necessary redistribution of energy consumption at the global level and the elements that should be present in energy descent strategies. We establish an approximate threshold of minimum and maximum per capita final energy consumption, between 15.6 GJ and 31.0 GJ for the year 2050, which serves as a reference for evaluating scenarios. We continue with an analysis of two ecological transition scenarios for Spain between 2020 and 2030, Green New Deal and Degrowth. Based on a schematic calculation model defined in “Labor Scenarios in the Ecosocial Transition 2020–2030” report, we evaluate the variations in energy consumption for 86 sectors of economic activity. Results show an annual final energy consumption per capita in 2030 of 44.6 GJ and 36.8 GJ for each scenario. We conclude by analyzing the hypothetical main drivers of this sharp decline in energy consumption.
1. Introduction
As global warming and ecological degradation accentuate their impacts, the ecological and energy transition is gaining momentum. Five decades behind schedule, public policies are focused on achieving fast decarbonization of the economy. This trend is speeding simultaneously as the historical record of 415 ppm CO2 in the atmosphere is surpassed [1]. In 2019, global annual primary and final energy consumption reached 583.9 EJ [2] and 435.0 EJ [3], respectively. Confidence in the possibility of completely replacing fossil fuels with energy production based on renewable sources is the central element on which the transition plans are being developed [4]. However, there are several reasons to be cautious and to point out the limitations of a strategy focused solely on “greening” energy production, without acting simultaneously on energy demand, may encounter [5]. Strategies focused exclusively on the energy–climate dimension often hide many other elements that need to be taken into account to achieve a transition that does not worsen ecological degradation, such as biodiversity loss [6]. Global energy descent appears as a requirement to reduce these risks and increase the feasibility of carrying out an ecological and energy transition within biophysical limits.
The purpose of our research is to contribute to the conceptualization and planning of ecological transition scenarios that include energy descent at their core. We believe that it is of great importance at the present time to identify those sectors and strategies that should play a leading role in this reduction of energy consumption. From this basis of conceptualization, planning, and identification, policies aimed at meeting the energy reduction targets can be designed. Our first objective is to clearly present the dimension, responsibility, and strategies of energy descent for the countries of the global North. Our second objective is to evaluate two specific ecological transition scenarios for Spain between 2020 and 2030: Green New Deal and Degrowth. For this purpose, we will use a methodology based on a schematic calculation model defined in the report “Labor Scenarios in the Ecosocial Transition 2020–2030” [7], from which we will also take the data that define both scenarios. Our calculation can then be understood as a contribution to the results obtained in that report and as a first approximation to quantify the energy consumption reductions that could be achieved from these ecological transition scenarios.
The paper is structured as follows. Section 2 presents a literature review of various research studies which allows us to establish the magnitude of the energy descent at the global level, evaluate the equitable distribution that should be made in the process, and point out strategies that allow us to achieve substantial reductions in energy demand in the countries of the global North. This section establishes a minimum and maximum threshold of final energy consumption per capita that will serve as a framework for analysis and comparison. In Section 3, we briefly introduce both ecological transition scenarios, explain the methodology used for the energy descent analysis, and present the initial energy consumption data. Section 4 shows the main results obtained for both scenarios and evaluates them with a sensitivity analysis. In Section 5, we discuss the obtained results, analyzing the sectors of economic activity and the transformations that promote the most significant reductions in energy consumption. We evaluate how these results relate to the considerations made from the literature review. In Section 6, we conclude the paper with some comments on the influence of these results on ecological transition policies.
2. Conceptualizing Energy Descent
We can explore three different perspectives that impose constraints on global energy consumption. Firstly, greenhouse gas emission reduction targets to limit the worst consequences of global warming. Secondly, the constraints imposed by the minerals required for the manufacture of renewable energy technologies. Lastly, the situation of declining energy availability as a result of peak conventional oil and low EROI for renewable technologies.
The Working Group I contribution to the IPCC Sixth Assessment Report estimated a remaining carbon budget of 400 GtCO2 to limit global warming to 1.5 °C with a 67% probability [8]. As this budget shrinks, and under the imperative to meet economic growth, Integrated Assessment Models (IAMs) give an increasingly central role to Negative Emissions Technologies (NET). However, there is considerable uncertainty about the actual capacity of these technologies to achieve net CO2 reductions on the envisioned scale of several gigatons per year [9]. Climate researchers warn of the risks of a “net zero” strategy and these technologies, as they reinforce the idea of “burn now and pay later” [10]. The way to meet carbon budgets without relying on large-scale deployment of NET necessarily involves a reduction in energy consumption. Grubler et al. defined in 2018 their “Low Energy Demand Scenario” (LED), which meets the 1.5 °C climate goal decreasing global final energy consumption by 40% to 245 EJ in 2050 [11].
Hickel et al. argued in favor of considering post-growth climate mitigation scenarios as those that can minimize feasibility and sustainability risks arising from technologically driven trajectories which are based on a high decoupling between energy and GDP, large-scale carbon dioxide capture, and a high-speed transformation to renewables [12]. Keyßer and Lenzen [13] developed a degrowth climate scenario that introduces the perspective of climate and ecological justice. For this purpose, they consider a redistribution of energy consumption between the global North and the global South. In this scenario, with equitable redistribution, the global North moves from its average final energy consumption per capita of 118 GJ in 2017 to 31 GJ in 2050, while the global South would move from 36 GJ in 2017 to 31 GJ in 2050 [13].
The minerals required to manufacture renewable energy devices represent another limit to global energy consumption [14]. Valero et al. [15] identified that the cumulative demand of 13 raw materials present in a low-carbon transition could exceed their known reserves, cobalt, lithium, tellurium, and nickel being the most critical elements in the coming decades [16]. Dominish et al. [17] studied the mineral demand for renewable energy and storage technologies under an ambitious scenario that limits emissions between 2015 and 2050 to 450 GtCO2, with a final energy consumption of 253 EJ supplied from renewable sources by 2050. It is found that the mineral demand would exceed reserves of cobalt, lithium, and nickel, while it would reach 50% of the reserves of indium, silver, and tellurium. Furthermore, the risk of a major negative impact on biodiversity due to increased extraction of these minerals in specially protected areas must also be considered [18].
Finally, beyond the choice of whether or not to reduce energy consumption at the global level to address the ecological crisis, certain elements lead us to think in terms of unavoidable declining energy availability. After conventional crude oil production peaked between 2005 and 2006 [19], production had slowly fallen from 70 Mb/d to 67 Mb/d in 2018. Subsequently, the International Energy Agency (IEA) certified in the 2020 World Energy Outlook that investment in oil and gas has declined since 2014 [20]. In the case that companies invest only in existing oil wells, IEA estimates that the drop in production would reach 40 Mb/d in 2040 [20]. Given the current global dependence on oil, such a reduction and the rising oil prices that would follow could complicate rather than facilitate the energy transition if it is not adequately planned [21].
On the other hand, the discussion on the EROI of renewable technologies raises some doubts about the amount of energy that can be produced from these technologies. Recent research by de Castro and Capellan argues that a transition from the current fossil to a renewable energy mix will be linked to a reduction in the EROI of the energy system [22]. When the boundaries of the analysis are extended closer to the system level, large hydro shows an extended EROI of 6.5:1, while the rest of the main renewable technologies are below 3:1 [22]. This fact could be accentuated by the decrease in the ore grade of some key minerals for these technologies, as is the case of copper [23]. Likewise, there are other issues that feed this uncertainty, such as the current dependence of renewable technologies on fossil fuels, the difficulties in the electrification of many current energy uses, or the integration of variability in the grid [5]. For these reasons, Floyd et al. call for “knowledge humility” about what the real energy transition scenarios might be [5].
These three perspectives allow us to approach the quantification of the energy descent that would have to be assumed at a global level. We see how even in the case of strong reductions in energy consumption, such as the one described by Dominish et al. [17], the reserves of certain minerals could be exceeded. Therefore, we consider it reasonable and prudent to assume the energy descent reference described by Grubler et al. [11], which establishes a final energy consumption of 245 EJ in 2050. This decrease would reduce the sustainability risks and increase the feasibility of achieving a transition to renewable sources.
Inequalities, Redistribution, and Strategies for Energy Descent
If we adopt the perspective of ecological justice, it will be those countries with the highest energy consumption who will have to undertake the largest energy reductions [24]. Global energy consumption currently shows huge inequalities: while the wealthiest 10% of the world’s population is responsible for 39% of the final energy footprint, the poorest 10% consumes 20 times less, only 2% [25]. It is a small portion of the world’s population that is responsible for an excessive energy footprint, while a large majority in the lower income brackets is responsible for only a small percentage of the world’s energy consumption. This is something that must be carefully considered when thinking about the energy descent that should be achieved in the coming decades.
A significant demand reduction high energy consumption countries should not imply a deterioration in the living conditions of their population. Steinberger and Roberts described in 2010 the decoupling that occurs after a certain saturation point between each country’s primary energy consumption and a set of human development indicators [26]. Akizu-Gardoki et al. [27] quantified this saturation point for annual primary energy consumptions above 100 GJ per capita. Below the saturation point, small increases in energy consumption can lead to a considerable improvement in human development indicators. Vogel et al. [28] point out that factors such as quality of public services, income equity, democracy, and access to electricity are associated with a high satisfaction of human needs with low energy requirements. Research show that current energy consumption is more than enough to ensure a decent living for the entire world population [26,29]. It is the lack of social efficiency in transforming this consumption towards the satisfaction of human needs that prevents this from happening [26]. Millward-Hopkins et al. [29] have pointed out that it would be possible to reduce global final energy consumption in 2050 to 149 EJ while providing a decent living for 10 billion world population. The Decent Living Scenario defines an annual final energy consumption of 13–18.4 GJ per capita, with a global average of 15.3 GJ [29].
Based on the values provided by research, we can define an approximate threshold of minimum and maximum final energy consumption to serve as a reference of analysis. At the lower limit, we place the estimate of Millward-Hopkins et al. [29] with 15.3 GJ of final energy per capita as the global average of the consumption necessary to guarantee a decent living. At the upper limit, we place Keyßer and Lenzen’s [13] estimate, with 31 GJ of final energy per capita, as the maximum energy consumption compatible with meeting the 1.5 °C goal without relying on large-scale NET. Thus, the approximate threshold would be between 15.3 and 31 GJ of final energy consumption per capita by 2050.
Average annual per capita final energy consumption in the global North was 118 GJ in 2017 [13]. In the case of Spain, annual final energy consumption was 78.0 GJ in 2018 [30,31]. Meeting the defined threshold for an equitable energy descent implies achieving energy consumption reductions in the range of 60 to 75% in the countries of the global North within three decades. The strategies and transformations that make it possible to achieve these levels of energy descent must consider energy demand as a dynamic, social, cultural, political and historical issue [32], which is continuously being shaped by “invisible energy policies” [33,34]. Thus, energy descent strategies should be grounded in a proper understanding of the socio-technical systems: those in which energy services are presented through large-scale, capital-intensive, and long-lived infrastructures that co-evolve with technologies, institutions, skills, knowledge, and behaviors [35,36]. It will be though large-scale socio-technical transitions, capable of overcoming the high energy demand lock-in established in the past, that our societies will be able to develop certain infrastructures and social practices that make it possible to satisfy the needs for a decent life while consuming much less energy.
Incremental change and energy efficiency strategies will not be enough to meet these magnitudes of energy demand reduction. Energy efficiency measures focused on technological improvements have proven unable of reaching the levels of energy and emission reductions needed to address the global North’s responsibility for the ecological crisis [37,38,39]. Instead, the energy sufficiency perspective seems to be more appropriate for this task [40,41,42]. This perspective allows us to focus on the ways in which those socially perceived needs can be satisfied through uses that reduce energy consumption, even if the equivalence of service is not maintained with respect to the way this currently occurs.
Therefore, the strategies needed to address a profound reduction in energy demand in global North countries must therefore involve a combination of large-scale socio-technical transitions and an energy sufficiency approach. Given the absence of empirical evidence of an adequate decoupling between energy consumption and GDP growth in the past and the unrealistic possibility of this happening in the future [43], these energy descent strategies will respond to the logic of degrowth: a planned contraction of the economic sphere, a reduction in production and consumption distributed in a socially fair way [44].
The conceptualizing elements of energy descent presented here help us to answer the key questions of how much, who, and how. This theoretical framework is necessary to carry out specific scenarios assessments as the one that follows. The approximate threshold defined here will be compared with the energy consumption results obtained by our calculations. The specific transformations of those economic sectors responsible for the main reduction in energy consumption will be analyzed together with the energy reduction strategies outlined here.
3. Energy Descent Scenarios Analysis for the Case of Ecological Transition in Spain 2020–2030
In our research, we have performed a schematic calculation of the energy descent in two ecological transition scenarios for Spain between 2020 and 2030. This analysis is based on the report “Labor Scenarios in the Ecosocial Transition 2020–2030” by the ecologist organization “Ecologistas en Acción” [7]. The report studied the interconnected evolutions between the working hours of different sectors of economic activity and greenhouse gas emissions. 86 sectors of economic activity grouped into 17 sets are considered. Table A1 of Appendix A shows the denomination and description of the 86 sectors considered.
The starting point is the Statistical Classification of Economic Activities in the European Community (NACE). Special emphasis is placed on accounting the hours worked corresponding to social reproduction work, or care work [45]. The initial values put the figure at 53% of total hours worked across all sectors devoted to unpaid care work and 8% to paid care work.
The objective of this report was to analyze the structural transformations necessary to achieve emission reduction targets that meet Spain’s responsibility according to the principles of climate justice. The report assesses how reducing the activity of those sectors with higher emissions per hour worked and increasing the economic activity of other sectors with lower emissions per hour worked can lead to an overall reduction in emissions.
Three scenarios were defined for this purpose. Two ecological transition scenarios representing two different political approaches and two different economic-institutional paths, and one reference scenario. A detailed description of the transformations included in each scenario can be found in [7]. A brief definition is given below:
- Green New Deal Scenario (GND): Institutional strategy for a high-tech ecological modernization that stimulates economic sectors such as industrial renewable energies, ICT, or energy efficiency. Sectors such as agroecology are also promoted. The political proposal of this scenario is based on a post-neoliberal reform horizon with a post-growth economic paradigm [46].
- Degrowth Scenario (D): Assumes the necessary, desirable, and unavoidable strong reduction of energy and material consumption in contemporary societies. It establishes the development of more rural, local, and de-technologized economies. It is a transformation towards agrarian-based social metabolisms. Its political bet goes through a search for greater social autonomy, with respect to the State and with respect to commodification [47].
- Business as Usual Scenario (BAU): This is a smooth continuation of the dynamics already underway in terms of economic growth and development of specific sectors. It does not represent an ecological transition scenario. Its function is to serve as a reference to evaluate where we are heading if no measures are taken and compare this result with those obtained in the other two scenarios.
The scenarios are defined on the basis of the parameter of hours worked for the 3-digit NACE categories, which represent almost 300 sectors. To model the evolution of this parameter between 2020 and 2030, maximum and minimum limits to its annual variability were established. These constraints are obtained from the year-on-year rates of change of the historical series of the WIOD socioeconomic accounts [48]. In some sectors, the growth or decline limit was extended, considering that it is possible and necessary to force changes that exceed the market trend dynamics due to their strategic nature. For example, the decline limit for the “Food 1: Industrial agriculture and farming” sector was increased due to a process of conversion to “Food 2: Organic agriculture and farming”, for which the growth limit was increased.
Based on these upper and lower limits, the scenarios are defined by 7 degrees of variation in the hours worked in each of the 3-digit NACE categories: 3 degrees of growth, 1 degree of no variation, and 3 degrees of decline. This way, the obtained parameters of annual variation will provide the value of the desired hours worked (xend) for each sector that the calculation model will use. Due to the difficulty of obtaining data on emissions or energy at this level of disaggregation, the 3-digit NACE categories are grouped into 86 sectors of economic activity, most of which correspond directly to the 2-digit NACE categories.
We have decided to use the same calculation method developed in this report to analyze the variations in energy consumption that these two defined ecological transition scenarios would entail. These variations are not obtained as a result of a specific energy policy but as the result of a set of structural transformations over the economic activity of several sectors. Here we present the collection of the initial energy consumption data, the description of the applied calculation model, and a discussion about the limitations of the method.
3.1. Initial Data
To run the defined calculation model, we started from the initial energy consumption data for each 86 sectors. As in the original report, we took the data corresponding to the year 2017 to represent the starting point of 2020. The only currently existing data source with a level of disaggregation according to NACE categories is found in Eurostat’s Physical Energy Flow Accounts (PEFA) [49].
PEFA records the energy flows between the environment and the economic system of a country. It is not an accounting created by obtaining new specific data, but by adapting various existing traditional accounting systems. PEFA is an accounting based on the residential principle, which differs from traditional energy statistics, which are based on the territorial principle. In other words, PEFA accounts for energy flows associated with the activity of economic units that exist in in the territory, regardless of where these flows occur. This difference in the accounting principle has a particular influence on activities such as the transport of goods. This is a limitation when it comes to comparing with the values of traditional energy statistics provided by governmental agencies.
We took from PEFA the data of the net domestic energy use (key indicator 6), which corresponds to primary energy consumption disaggregated by sector [50]. Likewise, we obtained from the information provided by PEFA the data on the percentage distribution of energy products for all sectors, except those in which the transformation of primary energy products into secondary energy products takes place [51]. The sectors affected by this exception are “Manufacture of coke and refined petroleum products” (Energy 1), “Electricity, gas, steam and air conditioning supply” (Energy 2), “Manufacture of chemicals and chemical products” (Industry 4), and “Manufacture of basic metals” (Industry 7). Excluding these four sectors, we will obtain an equivalence with the final energy consumption.
We found a direct match in the source data for 62 of the 86 sectors defined for this analysis. The remaining 24 require adaptation to determine the energy consumption of these sectors. Eight of them were considered to have zero energy consumption, as they are sectors defined in the original report to study the absorption of emissions by crops, forests, grasslands, and wetlands. Thus, in the end, 16 sector data had to be adapted, in most cases by finding a way to disaggregate energy consumption values that contain more than one sector. Table A2 of Appendix A shows the direct correspondence of sectors with NACE categories and the 16 adaptations applied.
Table 1 shows the initial energy consumption data according to the grouped sectors, and the percentage weight that each sector represents in total consumption. We see that the sectors that represent the highest percentage of primary energy consumption are the energy sector, with 30.3%, followed by the unpaid care work sector, with 23.9%. These are followed by the transport sector with 15.4% and industry with 11.2% of total primary energy consumption. The unpaid care work sector represents all household activities. An important part of the energy consumption derived from transport is included in the unpaid care work sector, as it corresponds to the use of private vehicles. There is also energy consumption from transport that is included in other economic activities that require the use of transport to develop their production or services. The values presented under the set of “Transport” are such consumptions specifically related to transport services. Complete initial primary energy data for the 86 sectors is shown in Table A3 of Appendix A.

Table 1.
Initial data of primary energy consumption by grouped sectors.
In Figure 1, we present the distribution of energy products according to the grouped sectors. Those sectors in which the transformation of primary energy products into secondary energy products takes place have been excluded. For example, the “Energy” group is made up of four sectors, but only the one corresponding to the “Fossil fuels extraction” (Energy 4) activity is represented here. The complete initial distribution of energy products for the 86 sectors is presented in Table A4 of Appendix A.
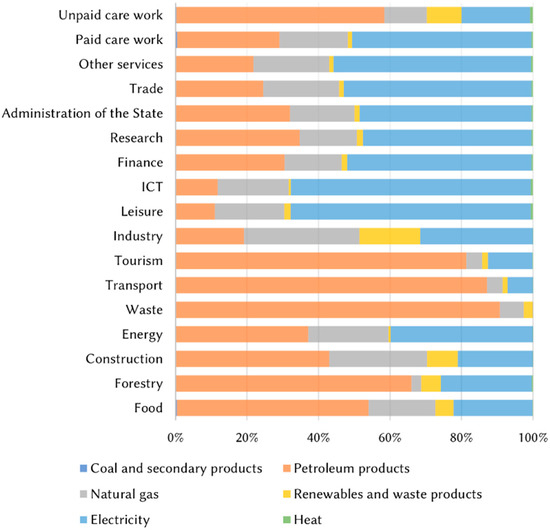
Figure 1.
Initial distribution of energy products consumed by each grouped sector.
3.2. Calculation Method
The schematic calculation method we have used to measure the variations in energy use of the different scenarios is the one developed for the original report [7]. The calculation has been carried out with values equivalent to the use of primary energy. However, by adapting the results we have been able to obtain values equivalent to the use of final energy. The sequence of this schematic calculation method was as follows:
- Obtain the initial energy consumption data for the 86 sectors of economic activity.
- Carry out the calculation model and obtain the energy results defined by the variations in hours worked.
- Apply adjustment factors to certain sectors in a justified way to consider further transformations.
- Obtain and analyze the final energy consumption results for each scenario.
In the case of the “Care Work 8” sector, which represents unpaid care work, a separate simulation is carried out to differentiate between the three factors that make up its energy consumption: transportation, heating/cooling, and other uses. The values obtained from the simulation of “Care Work 8” sector are presented in Table A7 of Appendix A.
Figure 2 shows a graphical description of the applied calculation method. The main variables and equations are presented below.
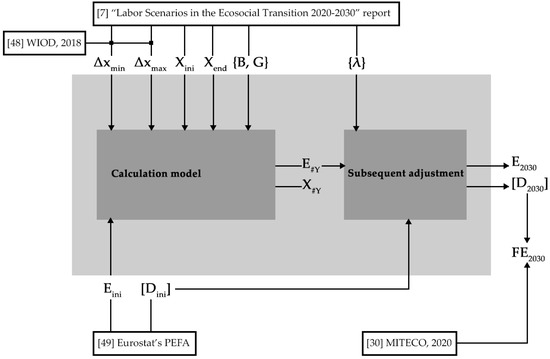
Figure 2.
Graphic description of the applied calculation method.
3.2.1. Initial Variables
- Xini = {xini}, a vector of initial hours worked in each sector. Initial data were obtained by [7] from [52].
- Eini = {eini}, a vector of initial energy consumption in each sector. Initial data were obtained from PEFA [49] for 2017.
- Δxmin and Δxmax, minimum and maximum interannual variation rate in a sector. Obtained and adapted by [7] from the 2000–2014 historical series of the WIOD socioeconomic accounts [48]. A correction using the average interannual cumulative rates for periods of five years was applied to avoid cyclical effects.
3.2.2. Assumptions
The ratio of energy consumption per hours worked (F) remains constant for most sectors over the next decade.
- F, the ratio of energy consumption per hours worked in a sector, was calculated as:
F = eini / xini,
This hypothesis finds its empirical verification in the study by Kovacic et al. [53], who show that the ratio between energy consumption and hours worked has remained practically constant for 14 European Union countries between 1995 and 2013.
3.2.3. Scenarios
Each simulation is guided by a predefined target scenario, which represents the direction of the socio-economical transformations.
- Xend = {xend}, a vector of desired hours worked in each sector in the last year of the simulation (desired scenario).
- The simulation would try to achieve this desired increment/decrement, but it would be limited by Δxmin and Δxmax constraints.
3.2.4. Model Equations
The evolution of each sector of activity is independent of that of the rest, except in a few cases of dependent sectors where there are direct couplings. An important part of the direct couplings defined are linked to a strong correlation between energy availability and the economic activity of high energy consuming sectors. The sectors which have direct couplings are listed in Table A5 in Appendix A.
- Δxdesired, which is the desired interannual variation in each sector.
- In an independent sector, Δxdesired was calculated as:where y is the year of calculation and y − 1 the previous year. #Y is the number of years between the initial data and the expected scenario (10, as we were calculating for the decade).
- Δx, the effective interannual variation in each sector, is constrained by maximum and minimum interannual variation rates
In a dependent sector (A), ΔxAdesired depends on a proportional relationship with another sector B (or by a linear combination of more sectors)
where G represents the relation coefficient between sectors.
ΔxAdesired = G · ΔxB,
3.2.5. Obtained Results from the Model
- , represents a vector of obtained hours worked in each sector in the final year, in our case 2030.
- , represents a vector of the energy consumption of each sector obtained by the model for the final year, in our case 2030.
3.2.6. Adjustment Factor
In some sectors, justified variations in the ratio F are required to reflect efficiency gains, reductions in consumption, deindustrialization processes or reconversions. This is established by the subsequent adjustment factor. We have adapted the values of the adjustment factor applied in [7] to the values of GHG emissions to our energy consumption analysis. We have done that through several parameters, such as the distribution and the emission factor of each energy product. The obtained and applied adjustment factors can be found in Table A6 of the Appendix A.
- , is a vector of the subsequent adjustment factor of each sector. It takes values between 0 and 1.
- , is a vector of the energy consumption of each sector obtained after applying the adjustment factor:
3.2.7. Distribution of Energy Products
We obtain from PEFA the initial percentage distribution of the consumption of energy products for most sectors.
- , is a matrix that describes the initial distribution of percentage consumption of energy products for sector.
- , is a matrix that describes the obtained 2030 distribution of percentage consumption of energy products for sector once the adjustment factors have been applied.
The distribution remains constant for most sectors. There are some exceptions in which the adjustment factor justification implies a redistribution in the energy products. In these cases, the reduction in the energy consumption that imposes the adjustment factor is subtracted from the fossil-fuels energy products. This implies that the percentage of distribution of these products decreases and the percentage of others increases, for example, electricity. These exceptions are shown in Table A9 of Appendix A.
3.2.8. Final Energy Consumption
Final energy consumption results for the different scenarios in 2030 can be calculated by applying the obtained variation 2020–2030 of energy products consumption to official values provided by Spanish governmental agencies [30].
- , describes the obtained final energy consumption.
As described in Section 3.1, for obtaining the final energy consumption equivalent values, sectors “Energy 1”, “Energy 2”, “Industry 4” and “Industry 7” are excluded.
3.3. Method Limitations
The calculation performed in this scenario assessment was based on a schematic method that may lead to inaccuracies. The objective was to provide an approximation that estimates the scale of the energy descent that could be achieved from certain ecological transition transformations. In this sense, the results should not be interpreted by their numerical reference, but as a first approximation of such a reduction in energy consumption. Different factors constitute a limitation to carry out a more precise calculation. We highlight the data availability, the schematic method, and the subsequent adjustment factors.
In first place, Eurostat’s PEFA is the only data source found that provides the energy consumption values disaggregated by two-digit NACE categories. The residential principle on which this accounting is based is a limitation when it comes to complementing and comparing the results obtained for the 2030 scenarios with those provided by other traditional energy statistics based on the territorial principle. Secondly, the schematic method applied allows a first approximation to the interrelationships and dependencies between sectors of economic activity, but a more consistent calculation would require the use of a system dynamics calculation model, such as the MEDEAS model [54].
Lastly, the application of adjustment factors after the calculation is another limitation of the method applied. These factors are included in the original report referring to a more profound reduction of emissions due to structural transformations such as: reflecting the electrification of machinery, an increase in the use of human physical force, efficiency increases, less climatic conditioning of spaces, or the development of more artisanal production. These factors have been translated into terms of energy consumption based on factors such as the emissions factor of different energy products and their percentage distribution for the sector concerned. Although these factors have been established in a reasoned manner, they may cause inaccuracies in the final results of the calculation.
4. Main Results
The main results of the energy consumption calculation for 2030 are presented below. Results of GND and D scenarios are presented individually, while results of the BAU scenario are only shown for comparison purposes. Complete results for the 86 sectors of economic activity can be found in Table A8 of Appendix A.
4.1. Green New Deal Scenario 2030 Results
We observe in Table 2 a 38.0% reduction in primary energy consumption between 2020 and 2030 according to the transformations defined for the GND scenario. In absolute terms, there is a decrease of 50,171.2 ktoe in primary energy consumption. The unpaid care work sector is the one with the greatest importance in the variation, accounting for 33.8% of the reduction. It is followed by the set of energy sectors, which account for 27.5% of the total variation, along with the transport sector, with 17.7% of the total reduction.
Table 2.
Primary energy consumption 2030 results for GND scenario by grouped sectors. Absolute results of primary energy consumption, percentage variations 2020–2030, and weight represented by the variation of each set in the total variation of primary energy consumption.
Regarding the percentage variation of energy consumption (Figure 3), there is a reduction in primary energy consumption for all sets, except for ICT and Forestry, which experience increases. These increases are justified by a significant increase in worked hours in these sectors.
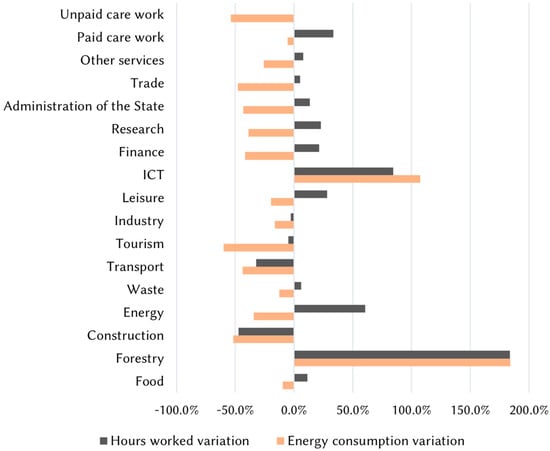
Figure 3.
GND scenario results. Variation 20202030 over energy consumption and worked hours by grouped sectors.
If we evaluate the resulting distribution of energy products for 2030 according to the GND scenario, we find that the share of electricity in the unpaid care work sector increases considerably. There is also an increase in the share of electricity in the transportation sector. According to the change in the consumption of energy products in absolute terms, petroleum products show the largest reduction (−56.0%), followed by natural gas (−39.3%). Although electricity gained greater weight in certain sectors, in overall terms its consumption fell by 6.5%.
4.2. Degrowth Scenario 2030 Results
According to the transformations defined by scenario D (Table 3), there would be a 61.2% reduction in primary energy consumption between 2020 and 2030. In absolute terms, this represents a decrease of 80,774.1 ktoe. The set of sectors with the greatest weight in this decrease is Energy, accounting for 41.0% of the total, followed by unpaid care work, with 23.6%, and transport, with 16.3%.
Table 3.
Primary energy consumption 2030 results for D scenario by grouped sectors. Absolute results of primary energy consumption, percentage variations 2020–2030 and weight represented by the variation of each set in the total variation of primary energy consumption.
All sets of sectors experience a reduction in their energy consumption (Figure 4), except for Forestry, which increases as a result of a sharp increase in the associated hours worked.
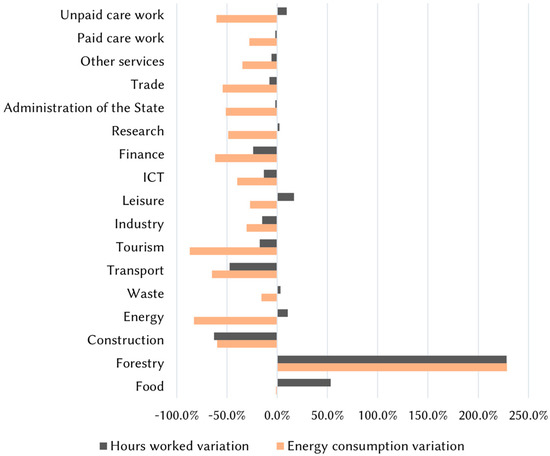
Figure 4.
D scenario results. Variation 2020–2030 over energy consumption and hours worked by grouped sectors.
This scenario presents the greatest variations in the distribution of energy products. In the case of the unpaid care work sector, petroleum products go from ~60% to less than 25%, while electricity goes from 20% to 50%. Similarly, in the tourism sector, petroleum products go from representing more than 80% of consumption to less than 50%. Similar changes can be observed for the transport and food sectors. In terms of total consumption, petroleum products are reduced by 71.7% and natural gas by 44.0%. As in the previous scenario, despite electricity gaining centrality in the distribution of energy products in certain sectors, in total terms, it experiences a reduction in consumption of 12.6%.
4.3. Comparison of Scenario Results
The results obtained show an increase in primary energy consumption of 12.6% for the BAU scenario and a reduction of 38.0% and 61.2% in the GND and D scenarios, respectively. In both cases, the energy decrease is driven by structural transformations in the energy, unpaid care work, and transport sectors. For both ecological transition scenarios, the consumption of petroleum products decreases its centrality in the unpaid care work and transportation sectors. The largest reductions in the consumption of petroleum products occur in scenario D, with a reduction of 71.7%, while in the GND scenario, the reduction is 56.0% (Figure 5). Electricity consumption decreases in both scenarios by 6.5% for GND and 12.6% for D.
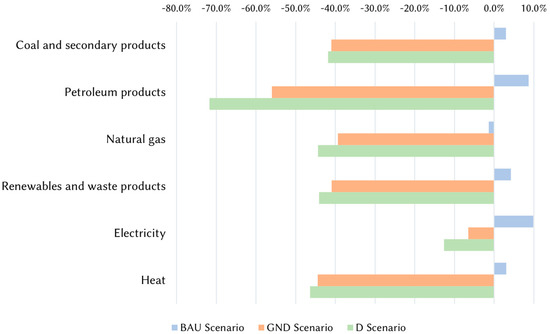
Figure 5.
Variation on the consumption of energy products 2020–2030 according to scenarios.
To analyze the results of energy product consumption in absolute terms for 2030 according to the different scenarios, we have to make a small adjustment. What we have done so far has been to evaluate the percentages of variation obtained on the consumption of energy products, not the absolute values. The initial data from which we started did not provide us with information on final energy consumption directly. Still, we had to derive it from the estimated consumption of energy products, so there are certain discrepancies. In order to translate the percentages of variation obtained for each of the energy products into absolute values, we decided to start from the official values provided by Spanish government agencies [29]. In this way, we obtain an energy product consumption, equivalent to final energy consumption, of 90,825 ktoe, 50,918 ktoe and 41,952 ktoe, respectively, for 2030 according to the BAU, GND, and D scenarios (Figure 6).
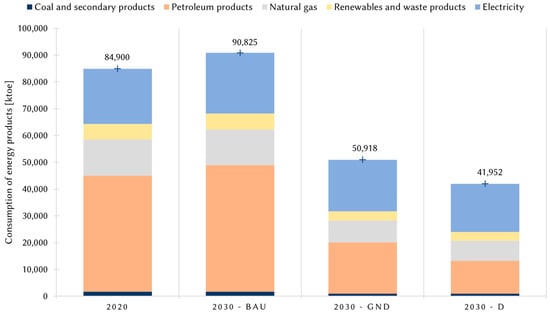
Figure 6.
Comparison between the adjusted consumption of energy products according to the different scenarios.
To compare these results with the considerations made in Section 2, we present the values of primary and final energy consumption per capita (Table 4). We take the demographic projections of the Spanish National Institute of Statistics (INE) for the year 2030 for both scenarios, which consider a population of 47.75 million [30]. No specific consideration or discussion about population growth scenarios has been addressed.
Table 4.
2030 results on primary and final energy consumption per capita according to the different scenarios.
The most recent values for primary and final energy consumption per capita amount to 122.4 and 78.0 GJ for 2019 and 2018, respectively. We remind that these results should be compared with the defined minimum consumption and maximum consumption threshold. In the case of Spain, Millward-Hopkins et al. [29] estimated the minimum consumption necessary to ensure a decent life for the entire population in 2050 at 15.8 GJ of final energy per capita. Maximum consumption would be 31.0 GJ as defined by Keyßer and Lenzen [13] for 2050. Lastly, we present the main 2020–2030 variation results obtained for the three scenarios in Table 5.
Table 5.
Main 2020–2030 variation results of energy consumption, and hours worked according to the different scenarios.
4.4. Sensitivity Analysis
To complete the collection of results, we carried out two sensitivity analyses. First, we evaluated the effect of variations in the adjustment factors applied to represent structural transformations of the sectors regarding the total primary energy consumption result. Second, we evaluated the effect of modifying the annual rate of change applied on the transport attributed to the unpaid care work sector, regarding the total primary energy consumption result.
4.4.1. Sensitivity Analysis on Adjustment Factors
The adjustment factors subsequent to applying the calculation model are applied to 31 and 32 sectors for the GND and D scenarios, respectively. In this sensitivity analysis, we wanted to evaluate the effect of applying a variation on them. To do so, we reduced or increased the value of these factors percentage-wise and studied the effect this has on the total primary energy consumption result. We applied reductions of 5 and 10% and increases of 5, 10, 15, and 20% on the original value of the factors. The results obtained are shown in Figure 7.
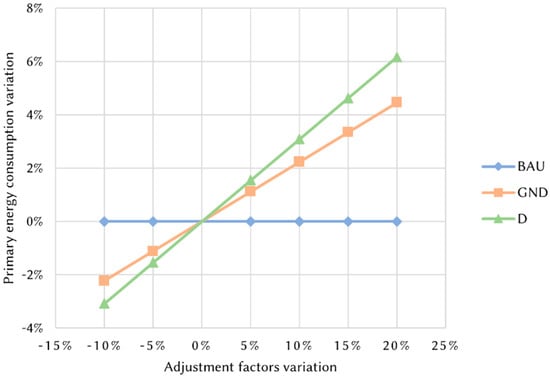
Figure 7.
Sensitivity analysis: Adjustment factors variation over primary energy consumption variation.
Logically, in the BAU scenario there is no variation since no adjustment factors are applied in this case. We observe how the effect of the percentage variations applied on the adjustment factors is greater for scenario D than for GND. For a 10% reduction on the original values of the adjustment factors, the total primary energy consumption is reduced by 2.2 and 3.1% for the GND and D scenarios, respectively. For a 20% increase over the adjustment factors, the total primary energy consumption increases by 4.5 and 6.2% for the GND and D scenarios, respectively. The final result of primary energy consumption obtained after applying the adjustment factors represents a reduction of 25 and 42% with respect to the intermediate result obtained from applying the calculation method for the GND and D scenarios, respectively. Therefore, we can clearly see the greater influence of the adjustment factors on scenario D. This is justified by the transformations represented by this scenario, which are oriented towards achieving an agrarian-based social metabolism. In any case, the percentages of variation that we observed on the final result of primary energy consumption lead us to state that the inaccuracies that the applied adjustment factors may present have a moderate influence. Therefore, we consider that the results obtained using the adjustment factors can be taken as a first approximation of what tendencies and transformations these ecological transition scenarios would represent.
4.4.2. Sensitivity Analysis on Energy Consumption of Private Transport
The energy consumption attributed to the “Care Work 8: Unpaid care work and domestic life” sector is composed of three factors: transportation, heating/cooling, and other uses. In the initial 2017 data, applied for 2020, the percentage distribution of these three factors over the total is 51.4, 29.5, and 19.1%, respectively. It is the energy consumption attributed to the use of private transport that has the greatest weight. Given the weight of the reduction in energy consumption of the Care Work 8 sector with respect to the total reduction in the GND and D scenarios, we consider it important to perform a sensitivity analysis on this factor. As mentioned in Section 3.1, a separate simulation is applied to the Care Work 8 sector, differentiating between these three factors. In the case of transportation, what is applied is an annual rate of variation for each of the three scenarios: 1.5% for BAU, −13.3% for GND, and −20% for D. In this sensitivity analysis, we evaluated the effect of a percentage increase of 5, 10, 15, 20, 25 and 30% on these rates of variation. We compare it with the final result of total primary energy consumption. The results obtained are shown in Figure 8.
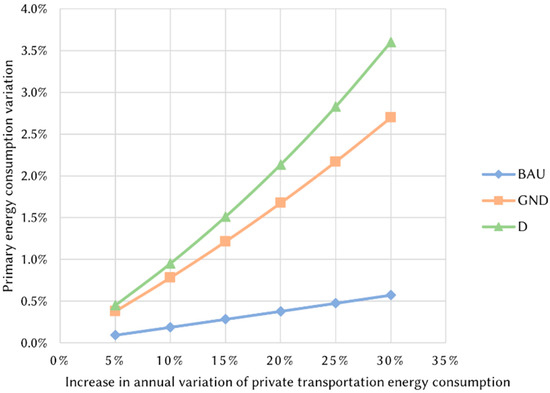
Figure 8.
Sensitivity analysis: Increase in annual variation of transport energy consumption on unpaid care work sector over primary energy consumption variation.
We can clearly see how the influence of these increases on the rate of variation is greater for scenario D, while in the case of the BAU scenario the influence is minimal. In the case of a 30% increase, the annual variation rates applied on private transport energy consumption are 2.0, −9.3, and −14% for the BAU, GND, and D scenarios, respectively. Under this variation, the total primary energy consumption increases by 2.7% and 3.6% for the GND and D scenarios, respectively. This shows the importance of the transformations on the energy consumption attributed to private transport. This consumption represents 12.3% of total primary energy consumption in the case of the initial data considered for 2020. In the results obtained for 2030, it represents 4.7% and 3.4% of primary energy consumption according to scenarios GND and D. This sensitivity analysis verifies the importance of the annual variation rates of private transport energy consumption. As in the previous case, we found that significant variations in the order of 20–30% on this factor have a moderate influence on the final result of total primary energy consumption. Therefore, despite the inaccuracies that may have been committed, we consider that the results obtained can be taken as a first approximation to the energy descent in the private transport sector resulting from the ecological transition scenarios.
5. Discussion
In this paper, we have made a theoretical approach to the framework of analysis of energy descent (Section 2) and a quantitative approach to the energy descent that could be achieved from two different scenarios of ecological transition for the case of Spain between 2020 and 2030 (Section 3 and Section 4). In the first part of the paper, we have studied the magnitude that the global energy descent would have to reach in the coming decades and the importance of a strong redistribution of energy consumption during this process. We have seen how the countries of the global North, and especially the wealthiest people among their populations, will have to assume the major part of the reduction in energy demand. To achieve this purpose, it is important to understand how demand is created and shaped, which is a dynamic, social, cultural, political, and historical issue. Large-scale socio-technical transitions will be necessary to move away from dependencies and inertias that block the possibility of satisfying social needs and desires through reduced energy consumption. The approach under which these transformations should be addressed will be that of energy sufficiency, focusing on how needs are transformed into demand for specific technical and energy services. Based on previous research, this analysis has established an indicative threshold of minimum and maximum consumption to help us evaluate possible energy descent scenarios. The minimum level of final energy consumption per capita corresponds to that necessary to guarantee a decent living, while the maximum level corresponds to climate scenarios that meet the 1.5 °C carbon budget without relying on negative emission technologies. In the case of Spain, this threshold would be defined between 15.8 and 31.0 GJ of final energy per capita by 2050.
Based on the report “Labor Scenarios in the Ecosocial Transition 2020–2030”, carried out by “Ecologistas en Acción”, we have calculated the evolution of energy consumption for two scenarios of ecological transition in Spain between 2020 and 2030. The results obtained show a 38.0% and 61.2% reduction in primary energy consumption for the GND and D scenarios, respectively, in the period under study. We obtain a final energy consumption per capita for 2030 of 44.6 and 36.8 GJ for the GND and D scenarios, respectively. These 2030 results are close to the maximum consumption threshold we have defined for 2050. The reductions experienced by both scenarios are very significant, even more so considering the time frame in which they are implemented. If these transitions were carried out, there would be 20 years left to deepen the energy descent, thus meeting the threshold defined for 2050. Those structural transformations described by scenario D are the ones that would bring us closer to the level of energy consumption reduction that Spain should assume. The fundamental difference between the two scenarios has to do with the considerations on which they are based. While the GND scenario describes a high-tech ecological modernization, the D scenario describes a transformation towards more rural, local, and de-technologized economies.
Regarding how these reductions in energy demand would be achieved, we can distinguish four different approaches based on the results obtained: 1. reduction of fossil fuel consumption, 2. abandoning dependence on globalized supply chains, 3. socio-technical transitions that allow abandoning the need for massive use of road transport, and 4. energy sufficiency measures that reduce energy consumption for heating and cooling.
The transformations carried out in the energy sector represent 27.5% and 41.0% of the reduction in consumption obtained for scenarios GND and D. These reductions are achieved mainly by strong reductions in the sectors “Energy 1: Coke ovens and oil refining” and “Energy 2: Non-renewable electricity supply, steam and air conditioning”. In the case of Energy 1, in both scenarios, consumption drops from 9087.7 ktoe in 2020 to 1559.6 ktoe in 2030. In the case of Energy 2, it goes from 30,774.2 ktoe in 2020 to 24,626.7 ktoe in 2030 according to the GND scenario and 5281.5 ktoe according to scenario D. Thus, the reduction in consumption of the Energy 1 sector accounts for 15.0 and 9.3% of the total decrease in primary energy according to the GND and D scenarios, respectively. While the reduction in consumption of the Energy 2 sector accounts for 12.3% and 31.5% of the total primary energy decrease according to the GND and D scenarios, respectively. Thus, we see how a strong reduction in the use of fossil fuels makes it possible to achieve a significant part of the total energy descent for both scenarios.
Secondly, we evaluated the disaggregated results for the transport sector. This sector accounts for 17.7% and 16.3% of the total primary energy decrease according to the GND and D scenarios. A large part of this decrease is obtained thanks to a reduction in the consumption of the “Transport 9: International navigation” sector, which goes from 6681.9 ktoe in 2020 to 3808.6 and 1135.9 ktoe in 2030 according to the GND and D scenarios. This represents 5.7% and 6.6% of the total primary energy reduction, respectively, for GND and D. This transformation represents a considerable reduction in globalized, energy-intensive supply chains that are also highly dependent on petroleum products that will decrease their availability during this period. We also note a substantial reduction in energy consumption in the “Transport 10: Air transport” sector, from 1359.1 ktoe in 2020 to 174.0 ktoe for both scenarios. However, it should be noted that a significant part of aviation energy consumption is included in the “Tourism 4: International Aviation” sector.
On the other hand, the sector “Transport 7: Road Land Transport” reduces its energy consumption from 8301.1 ktoe in 2020 to 3287.4 and 2037.2 ktoe in 2030 for the GND and D scenarios, respectively. This represents 12.7% and 6.2% of the total primary energy decrease experienced in each scenario. Complementarily, the sector “Transport 5: Land transport by rail with electric motor” experiences an increase that brings its energy consumption from 432.4 ktoe in 2020 to 1420.2 ktoe in 2030 for both scenarios. Therefore, we see how the transformations described by the scenarios concerning the transport sector involve abandoning dependence on globalized supply chains and carrying out large-scale socio-technical transitions to move away from dependence on the massive use of road transport and increase the use of collective public transport based on electric railroads.
Finally, we evaluated the transformations that make possible a sharp decrease in energy consumption in the “Care Work 8: Unpaid care work and domestic life” sector. The variations in this sector represent 33.8% and 23.6% of the energy decrease obtained in the GND and D scenarios, respectively. As already mentioned, the energy consumption of this sector is made up of transport, heating/cooling and other uses. The energy consumption attributed to private transport goes from 16,197.9 ktoe in 2020 to 3873.9 and 1739.2 ktoe in 2030 according to the GND and D scenarios, respectively. This represents 24.5% and 17.9% of the total primary energy decrease obtained for each scenario. The energy consumption attributed to household heating and cooling goes from 9278.2 ktoe in 2020 to 4639.5 ktoe in 2030 for both scenarios. This represents 9.2 and 5.7% of the total primary energy decrease obtained for the GND and D scenarios, respectively. The sharp reductions in energy consumption attributed to private transport should be understood as socio-technical transitions that allow for the development of social environments and practices that require much less mobility. Reductions in household heating and cooling consumption should be understood as the development of energy sufficiency measures to meet the needs of maintaining adequate temperatures with methods that do not necessarily involve the use of energy-intensive devices.
6. Conclusions
The scenarios analyzed in this paper describe a profound structural transformation of the economic sphere, a set of socio-technical transitions away from the lock-in of high energy demand and the development of lifestyles that make it possible to meet the needs of a dignified life through processes that consume much less energy. The analysis of the quantitative results of the GND and D scenarios for Spain in 2030 requires some caution, given the method limitations. These calculations will be further explored and improved in the future with a more detailed data collection and using a system dynamics calculation model. Despite these limitations, the work presented here points to the scenarios and strategies for energy descent that should be considered in the near future, pointing out the quantitative and qualitative challenges of the process. We believe that these results allow us to come closer to analyzing the ecological transition decisions and pathways that are currently being discussed.
These results encompass a societal transformation [55] that would affect almost every sector of economic activity, the country’s international trade relationships, and the social practices woven into everyday life. Most of the current high energy demand of Global North countries has been shaped by non-energy-related decisions and policies. In this sense, the way in which the levels of energy descent described here would be achieved goes far beyond the specific field of energy policies. Therefore, this objective must be placed at the core of ecological transition plans that will transform society as a whole.
The scenarios, understandings and public policy packages that currently dominate the field of ecological transition in the European Union represent an approach that reinforces the strong inequalities existing at the international level, maintains the logic of economic growth and intensifies the extractive processes of mineral resources in the global South [56]. The decades ahead of us are absolutely vital to limit the worst consequences of the ecological crisis and begin to correct the metabolic rift on which today’s societies are founded [57]. To this end, the countries of the global North will have to assume their historical responsibilities for the current situation and undertake severe reductions in their energy consumption. Here we have tried to present an approach to this task.
Author Contributions
Conceptualization, M.L.; methodology, A.A., Á.L. and M.L.; software, Á.L.; validation, A.A. and A.V.; formal analysis, A.V. and A.A.; investigation, M.L.; resources, M.L., A.A. and Á.L.; data curation, M.L.; writing—original draft preparation, M.L.; writing—review and editing, A.V., A.A. and Á.L.; visualization, A.V. and A.A.; supervision, A.V. and A.A. All authors have read and agreed to the published version of the manuscript.
Funding
This research received no external funding.
Data Availability Statement
Energy consumption data analyzed in this paper can be found in Eurostat’s Physical Energy Flow Accounts (https://ec.europa.eu/eurostat/web/environment/energy-accounts accessed on 26 October 2020). The original calculation method applied and quantitative definition of the considered scenarios can be found in the report “Labor Scenarios in the Ecosocial Transition 2020–2030”, carried out by “Ecologistas en Acción” (https://www.ecologistasenaccion.org/132893/informe-escenarios-de-trabajo-en-la-transicion-ecosocial-2020-2030/ accessed on 15 October 2020).
Acknowledgments
This paper has been carried out under the framework of project PID2020-116851RB-I00, financed by the Spanish Ministry of Science and Innovation. We would like to mention those who participated in the preparation of the report “Labor Scenarios in the Ecosocial Transition 2020–2030”. Without their work this research would not have been possible. Therefore, we acknowledge Luis González Reyes, Walter Actis Mazzola, Luis Miguel Bueno Morera, Carmen Madorrán Ayerra, Emilio Santiago Muiño and Cristina de Benito Morán. We thank the reviewers, whose comments and suggestions helped improve and clarify this paper.
Conflicts of Interest
The authors declare no conflict of interest.
Appendix A
Table A1.
Description of sectors of economic activity considered in this research.
Table A1.
Description of sectors of economic activity considered in this research.
| Sector | Description |
|---|---|
| Food 1 | Industrial agriculture and farming |
| Food 2 | Organic agriculture and farming |
| Food 3 | Absorption of industrial crops |
| Food 4 | Absorption of agroecological crops |
| Food 5 | Fishing and aquaculture |
| Food 6 | Manufacture of food products; beverages and tobacco products |
| Food 7 | Water collection, treatment and distribution |
| Forestry 1 | Forestry and logging |
| Forestry 2 | Absorption in the forestry sector |
| Forestry 3 | Absorption of grasslands |
| Forestry 4 | Absorption wetlands |
| Forestry 5 | Absorption of other soils |
| Construction 1 | Manufacture of wood and of products of wood and cork, except furniture; manufacture of articles of straw and plaiting materials |
| Construction 2 | Absorption of wood collection |
| Construction 3 | Manufacture of other non-metallic mineral products except glass |
| Construction 4 | Mineral, stone, sand and clay extraction |
| Construction 5 | Construction |
| Construction 6 | Emission artificialization of soil |
| Construction 7 | Real estate activities |
| Construction 8 | Architectural and engineering activities; technical testing and analysis |
| Care work 1 | Manufacture of basic pharmaceutical products and pharmaceutical preparations |
| Care work 2 | Education |
| Care work 3 | Human health activities |
| Care work 4 | Residential care activities and social work activities without accommodation |
| Care work 5 | Repair of computers and personal and household goods |
| Care work 6 | Other personal service activities |
| Care work 7 | Activities of households as employers; undifferentiated goods- and services-producing activities of households for own use |
| Care work 8 | Unpaid care work and household activities |
| Energy 1 | Manufacture of coke and refined petroleum products |
| Energy 2 | Electricity, gas, steam and air conditioning supply |
| Energy 3 | Renewable electricity supply |
| Energy 4 | Fossil fuel extraction |
| Waste 1 | Water purification |
| Waste 2 | Waste collection and treatment |
| Waste 3 | Waste incineration |
| Waste 4 | Composting and anaerobic digestion |
| Transport 1 | Manufacture of motor vehicles, trailers and semi-trailers |
| Transport 2 | Manufacture of other transport equipment |
| Transport 3 | Wholesale and retail trade and repair of motor vehicles and motorcycles |
| Transport 4 | Land transportation by rail with internal combustion engine |
| Transport 5 | Land transportation by electric motor rail |
| Transport 6 | Pipeline transportation |
| Transport 7 | Land transportation by road |
| Transport 8 | Water transport |
| Transport 9 | International maritime bunkers |
| Transport 10 | Air transport |
| Transport 11 | Warehousing and support activities for transportation |
| Tourism 1 | Accommodation services |
| Tourism 2 | Food and beverage services |
| Tourism 3 | Travel agency, tour operator and other reservation service and related activities |
| Tourism 4 | International Aviation |
| Industry 1 | Manufacture of textiles, wearing apparel, leather and related products |
| Industry 2 | Manufacture of paper and paper products |
| Industry 3 | Printing and reproduction of recorded media |
| Industry 4 | Manufacture of chemicals and chemical products |
| Industry 5 | Manufacture of glass and glass products |
| Industry 6 | Manufacture of rubber and plastic products |
| Industry 7 | Manufacture of basic metals |
| Industry 8 | Manufacture of fabricated metal products, except machinery and equipment |
| Industry 9 | Manufacture of computer, electronic and optical products |
| Industry 10 | Manufacture of electrical equipment |
| Industry 11 | Manufacture of machinery and equipment n.e.c. |
| Industry 12 | Manufacture of furniture; other manufacturing |
| Industry 13 | Repair and installation of machinery and equipment |
| Leisure 1 | Publishing activities |
| Leisure 2 | Motion picture, video, television programme production; programming and broadcasting activities |
| Leisure 3 | Creative, arts and entertainment activities; libraries, archives, museums and other cultural activities; gambling and betting activities |
| Leisure 4 | Sports activities and amusement and recreation activities |
| ICT 1 | Telecommunications |
| ICT 2 | Computer programming, consultancy, and information service activities |
| Finance 1 | Financial service activities, except insurance and pension funding |
| Finance 2 | Insurance, reinsurance and pension funding, except compulsory social security |
| Finance 3 | Activities auxiliary to financial services and insurance activities |
| Research 1 | Scientific research and development |
| State 1 | Public administration and defence; compulsory social security |
| Trade 1 | Wholesale trade, except of motor vehicles and motorcycles |
| Trade 2 | Retail trade, except of motor vehicles and motorcycles |
| Trade 3 | Advertising and market research |
| Others 1 | Postal and courier activities |
| Others 2 | Legal and accounting activities; activities of head offices; management consultancy activities |
| Others 3 | Other professional, scientific and technical activities; veterinary activities |
| Others 4 | Rental and leasing activities |
| Others 5 | Employment activities |
| Others 6 | Security and investigation, service and landscape, office administrative and support activities |
| Others 7 | Activities of membership organisations |
| Others 8 | Activities of extraterritorial organisations and bodies |
Table A2.
Direct correspondence of sectors with NACE categories and adaptation applied for obtaining energy consumption initial data.
Table A2.
Direct correspondence of sectors with NACE categories and adaptation applied for obtaining energy consumption initial data.
| Sector | NACE Category | Adaptation | Reference |
|---|---|---|---|
| Food 1 | Split from A01 | [57] | |
| Food 2 | Split from A01 | [57] | |
| Food 3 | Zero consumption | ||
| Food 4 | Zero consumption | ||
| Food 5 | A03 | ||
| Food 6 | C10-C12 | ||
| Food 7 | E36 | ||
| Forestry 1 | A02 | ||
| Forestry 2 | Zero consumption | ||
| Forestry 3 | Zero consumption | ||
| Forestry 4 | Zero consumption | ||
| Forestry 5 | Zero consumption | ||
| Construction 1 | C16 | ||
| Construction 2 | Zero consumption | ||
| Construction 3 | Split from C23 | [58] | |
| Construction 4 | Split from B | [59] | |
| Construction 5 | F | ||
| Construction 6 | Zero consumption | ||
| Construction 7 | L | ||
| Construction 8 | M71 | ||
| Care work 1 | C21 | ||
| Care work 2 | P | ||
| Care work 3 | Q86 | ||
| Care work 4 | Q87-88 | ||
| Care work 5 | S95 | ||
| Care work 6 | S96 | ||
| Care work 7 | T | ||
| Care work 8 | Total activities by households | Reference | |
| Energy 1 | C19 | [58] | |
| Energy 2 | D | [58] | |
| Energy 3 | Zero consumption | ||
| Energy 4 | Split from B | ||
| Waste 1 | Split from E37-39 | ||
| Waste 2 | Split from E37-39 | ||
| Waste 3 | Split from E37-39 | ||
| Waste 4 | Zero consumption | ||
| Transport 1 | C29 | ||
| Transport 2 | C30 | ||
| Transport 3 | G45 | ||
| Transport 4 | Split from H49 | ||
| Transport 5 | Split from H49 | ||
| Transport 6 | Split from H49 | ||
| Transport 7 | Split from H49 | [59] | |
| Transport 8 | H50 | [60] | |
| Transport 9 | Data from Eurostat | ||
| Transport 10 | Split from H51 | ||
| Transport 11 | H52 | ||
| Tourism 1 | Split from I | ||
| Tourism 2 | Split from I | ||
| Tourism 3 | N79 | ||
| Tourism 4 | Split from H51 | ||
| Industry 1 | C13-15 | ||
| Industry 2 | C17 | ||
| Industry 3 | C18 | ||
| Industry 4 | C20 | ||
| Industry 5 | Split from C23 | ||
| Industry 6 | C22 | ||
| Industry 7 | C24 | ||
| Industry 8 | C25 | ||
| Industry 9 | C26 | [60] | |
| Industry 10 | C27 | [7] | |
| Industry 11 | C28 | [7] | |
| Industry 12 | C31-32 | [7] | |
| Industry 13 | C33 | ||
| Leisure 1 | J58 | ||
| Leisure 2 | J59-60 | ||
| Leisure 3 | R90-92 | ||
| Leisure 4 | R93 | [60] | |
| ICT 1 | J61 | [60] | |
| ICT 2 | J62-63 | [60] | |
| Finance 1 | K64 | [60] | |
| Finance 2 | K65 | ||
| Finance 3 | K66 | [60] | |
| Research 1 | M72 | [60] | |
| State 1 | O | ||
| Trade 1 | G46 | [7] | |
| Trade 2 | G47 | [7] | |
| Trade 3 | M73 | ||
| Others 1 | H53 | [60] | |
| Others 2 | M69-70 | ||
| Others 3 | M74-75 | ||
| Others 4 | N77 | ||
| Others 5 | N78 | ||
| Others 6 | N80-82 | [59] | |
| Others 7 | S94 | ||
| Others 8 | U |
Table A3.
Initial data for 2020. Hours worked and primary energy consumption by sectors of economic activity.
Table A3.
Initial data for 2020. Hours worked and primary energy consumption by sectors of economic activity.
| Sectors | Hours Worked (h) | Primary Energy Consumption (ktoe) |
|---|---|---|
| Food 1 | 1,477,873,085.4 | 2801.8 |
| Food 2 | 17,126,136.7 | 24.6 |
| Food 3 | 0.0 | 0.0 |
| Food 4 | 0.0 | 0.0 |
| Food 5 | 58,541,741.3 | 620.0 |
| Food 6 | 970,805,575.9 | 2679.7 |
| Food 7 | 88,875,884.0 | 34.7 |
| Forestry 1 | 12,549,397.8 | 83.9 |
| Forestry 2 | 0.0 | 0.0 |
| Forestry 3 | 0.0 | 0.0 |
| Forestry 4 | 0.0 | 0.0 |
| Forestry 5 | 0.0 | 0.0 |
| Construction 1 | 113,611,113.8 | 659.0 |
| Construction 2 | 0.0 | 0.0 |
| Construction 3 | 131,221,979.9 | 2806.0 |
| Construction 4 | 12,354,941.9 | 554.1 |
| Construction 5 | 1,987,586,377.8 | 1829.4 |
| Construction 6 | 0.0 | 0.0 |
| Construction 7 | 206,941,024.5 | 417.6 |
| Construction 8 | 428,479,309.8 | 166.5 |
| Care work 1 | 148,396,120.4 | 528.6 |
| Care work 2 | 1,858,279,772.4 | 702.3 |
| Care work 3 | 1,852,823,558.7 | 665.5 |
| Care work 4 | 825,416,683.1 | 348.7 |
| Care work 5 | 112,804,896.1 | 23.2 |
| Care work 6 | 543,223,464.5 | 158.4 |
| Care work 7 | 849,448,416.7 | 0.0 |
| Care work 8 | 42,975,336,528.0 | 31,498.5 |
| Energy 1 | 18,162,804.1 | 9087.7 |
| Energy 2 | 40,990,000.3 | 30,774.2 |
| Energy 3 | 37,719,673.2 | 0.0 |
| Energy 4 | 3,040,971.3 | 123.0 |
| Waste 1 | 7,294,754.0 | 8.3 |
| Waste 2 | 59,310,627.9 | 38.6 |
| Waste 3 | 15,263,974.0 | 8.3 |
| Waste 4 | 3,954,669.1 | 0.0 |
| Transport 1 | 404,515,731.4 | 529.3 |
| Transport 2 | 111,746,433.7 | 110.4 |
| Transport 3 | 598,714,158.9 | 613.4 |
| Transport 4 | 7,851,296.2 | 109.0 |
| Transport 5 | 44,490,678.5 | 432.4 |
| Transport 6 | 814.8 | 656.4 |
| Transport 7 | 1,004,057,540.6 | 8301.1 |
| Transport 8 | 33,960,337.0 | 1130.9 |
| Transport 9 | 21,680.4 | 6681.8 |
| Transport 10 | 67,026,923.2 | 1359.1 |
| Transport 11 | 352,872,031.8 | 419.9 |
| Tourism 1 | 758,166,738.8 | 456.7 |
| Tourism 2 | 2,276,570,466.1 | 456.7 |
| Tourism 3 | 120,433,409.7 | 84.6 |
| Tourism 4 | 17,065.8 | 2874.9 |
| Industry 1 | 293,054,546.6 | 333.4 |
| Industry 2 | 83,962,683.1 | 1659.0 |
| Industry 3 | 134,621,584.9 | 145.1 |
| Industry 4 | 208,802,333.7 | 6170.8 |
| Industry 5 | 32,629,924.1 | 606.3 |
| Industry 6 | 163,961,318.8 | 57.3 |
| Industry 7 | 154,416,248.5 | 4889.6 |
| Industry 8 | 368,534,046.2 | 456.8 |
| Industry 9 | 69,558,882.0 | 24.5 |
| Industry 10 | 124,984,887.1 | 179.2 |
| Industry 11 | 275,408,690.0 | 165.2 |
| Industry 12 | 242,452,632.0 | 9.4 |
| Industry 13 | 187,668,940.5 | 32.5 |
| Leisure 1 | 93,528,789.0 | 83.8 |
| Leisure 2 | 162,170,188.0 | 190.2 |
| Leisure 3 | 292,718,006.1 | 183.4 |
| Leisure 4 | 307,945,423.1 | 153.4 |
| ICT 1 | 179,776,987.4 | 304.1 |
| ICT 2 | 424,687,034.9 | 134.0 |
| Finance 1 | 383,179,804.0 | 217.2 |
| Finance 2 | 201,572,356.5 | 85.6 |
| Finance 3 | 71,727,539.8 | 134.8 |
| Research 1 | 47,691,014.7 | 85.6 |
| State 1 | 2,230,889,587.0 | 1152.1 |
| Trade 1 | 1,483,721,397.8 | 1400.4 |
| Trade 2 | 3,619,238,593.0 | 1310.0 |
| Trade 3 | 192,184,265.4 | 79.5 |
| Others 1 | 195,576,373.6 | 114.3 |
| Others 2 | 899,420,693.2 | 243.5 |
| Others 3 | 255,006,804.2 | 60.9 |
| Others 4 | 84,288,811.2 | 119.9 |
| Others 5 | 123,048,280.2 | 40.3 |
| Others 6 | 1,228,495,771.8 | 202.1 |
| Others 7 | 176,034,141.9 | 147.3 |
| Others 8 | 799,590,699.1 | 0.0 |
Table A4.
Initial data of percentual distribution of energy products consumption by sectors of economic activity.
Table A4.
Initial data of percentual distribution of energy products consumption by sectors of economic activity.
| Sectors | Coal and Secondary Products | Petroleum Products | Natural Gas | Renewables and Waste Products | Electricity | Heat |
|---|---|---|---|---|---|---|
| Food 1 | 0.0 | 77.3 | 2.6 | 3.0 | 16.8 | 0.2 |
| Food 2 | 0.0 | 77.3 | 2.6 | 3.0 | 16.8 | 0.2 |
| Food 3 | 0.0 | 0.0 | 0.0 | 0.0 | 0.0 | 0.0 |
| Food 4 | 0.0 | 0.0 | 0.0 | 0.0 | 0.0 | 0.0 |
| Food 5 | 0.0 | 98.9 | 0.0 | 1.1 | 0.0 | 0.0 |
| Food 6 | 0.8 | 17.6 | 40.4 | 8.0 | 33.2 | 0.0 |
| Food 7 | 0.0 | 94.0 | 2.7 | 3.3 | 0.0 | 0.0 |
| Forestry 1 | 0.0 | 66.0 | 2.7 | 5.5 | 25.5 | 0.3 |
| Forestry 2 | 0.0 | 0.0 | 0.0 | 0.0 | 0.0 | 0.0 |
| Forestry 3 | 0.0 | 0.0 | 0.0 | 0.0 | 0.0 | 0.0 |
| Forestry 4 | 0.0 | 0.0 | 0.0 | 0.0 | 0.0 | 0.0 |
| Forestry 5 | 0.0 | 0.0 | 0.0 | 0.0 | 0.0 | 0.0 |
| Construction 1 | 0.0 | 8.0 | 23.2 | 48.4 | 20.4 | 0.0 |
| Construction 2 | 0.0 | 0.0 | 0.0 | 0.0 | 0.0 | 0.0 |
| Construction 3 | 0.3 | 41.8 | 35.9 | 6.7 | 15.4 | 0.0 |
| Construction 4 | 0.0 | 37.1 | 22.5 | 0.6 | 39.8 | 0.0 |
| Construction 5 | 0.0 | 69.1 | 18.1 | 1.6 | 11.2 | 0.0 |
| Construction 6 | 0.0 | 0.0 | 0.0 | 0.0 | 0.0 | 0.0 |
| Construction 7 | 0.0 | 5.3 | 27.9 | 0.9 | 65.4 | 0.6 |
| Construction 8 | 0.0 | 26.0 | 19.4 | 1.5 | 52.5 | 0.5 |
| Care work 1 | 2.2 | 59.7 | 21.5 | 0.1 | 16.6 | 0.0 |
| Care work 2 | 0.0 | 20.4 | 18.5 | 1.3 | 59.3 | 0.5 |
| Care work 3 | 0.0 | 13.0 | 19.8 | 1.4 | 65.2 | 0.6 |
| Care work 4 | 0.0 | 36.5 | 14.8 | 2.3 | 46.0 | 0.4 |
| Care work 5 | 0.0 | 8.5 | 21.7 | 0.9 | 68.3 | 0.6 |
| Care work 6 | 0.0 | 12.4 | 19.8 | 0.9 | 66.3 | 0.6 |
| Care work 7 | 0.0 | 0.0 | 0.0 | 0.0 | 100.0 | 0.0 |
| Care work 8 | 0.3 | 58.2 | 11.9 | 9.7 | 19.1 | 0.8 |
| Energy 1 | - | - | - | - | - | - |
| Energy 2 | - | - | - | - | - | - |
| Energy 3 | 0.0 | 0.0 | 0.0 | 0.0 | 0.0 | 0.0 |
| Energy 4 | 0.0 | 37.1 | 22.5 | 0.6 | 39.8 | 0.0 |
| Waste 1 | 0.0 | 90.7 | 6.7 | 2.6 | 0.0 | 0.0 |
| Waste 2 | 0.0 | 90.7 | 6.7 | 2.6 | 0.0 | 0.0 |
| Waste 3 | 0.0 | 90.7 | 6.7 | 2.6 | 0.0 | 0.0 |
| Waste 4 | 0.0 | 0.0 | 0.0 | 0.0 | 0.0 | 0.0 |
| Transport 1 | 0.0 | 11.7 | 28.0 | 0.3 | 60.0 | 0.0 |
| Transport 2 | 0.0 | 27.6 | 15.8 | 0.6 | 56.0 | 0.0 |
| Transport 3 | 0.0 | 52.5 | 12.6 | 2.2 | 32.5 | 0.0 |
| Transport 4 | 0.0 | 100.0 | 0.0 | 0.0 | 0.0 | 0.0 |
| Transport 5 | 0.0 | 0.0 | 0.0 | 0.0 | 100.0 | 0.0 |
| Transport 6 | 0.0 | 0.0 | 69.3 | 0.0 | 30.8 | 0.0 |
| Transport 7 | 0.0 | 96.3 | 0.5 | 3.1 | 0.1 | 0.0 |
| Transport 8 | 0.0 | 95.4 | 3.0 | 0.1 | 1.6 | 0.0 |
| Transport 9 | 0.0 | 100.0 | 0.0 | 0.0 | 0.0 | 0.0 |
| Transport 10 | 0.0 | 97.8 | 1.3 | 0.3 | 0.5 | 0.0 |
| Transport 11 | 0.0 | 27.7 | 21.5 | 0.9 | 49.5 | 0.4 |
| Tourism 1 | 0.0 | 25.4 | 17.5 | 6.5 | 50.1 | 0.4 |
| Tourism 2 | 0.0 | 25.4 | 17.5 | 6.5 | 50.1 | 0.4 |
| Tourism 3 | 0.0 | 52.3 | 13.7 | 2.3 | 31.4 | 0.3 |
| Tourism 4 | 0.0 | 100.0 | 0.0 | 0.0 | 0.0 | 0.0 |
| Industry 1 | 0.0 | 18.3 | 38.4 | 0.9 | 42.3 | 0.0 |
| Industry 2 | 0.0 | 5.6 | 33.8 | 34.7 | 25.8 | 0.0 |
| Industry 3 | 0.0 | 16.5 | 31.7 | 0.1 | 51.7 | 0.0 |
| Industry 4 | - | - | - | - | - | - |
| Industry 5 | 0.3 | 41.8 | 35.9 | 6.7 | 15.4 | 0.0 |
| Industry 6 | 0.0 | 95.9 | 0.3 | 3.8 | 0.0 | 0.0 |
| Industry 7 | - | - | - | - | - | - |
| Industry 8 | 0.0 | 19.7 | 30.2 | 0.2 | 49.8 | 0.1 |
| Industry 9 | 0.0 | 21.0 | 7.2 | 0.5 | 71.2 | 0.1 |
| Industry 10 | 0.0 | 22.3 | 22.9 | 0.3 | 54.4 | 0.1 |
| Industry 11 | 0.0 | 31.9 | 22.9 | 0.6 | 44.6 | 0.1 |
| Industry 12 | 0.0 | 95.9 | 0.3 | 3.8 | 0.0 | 0.0 |
| Industry 13 | 0.0 | 51.9 | 42.5 | 3.3 | 0.0 | 2.3 |
| Leisure 1 | 0.0 | 4.5 | 20.3 | 4.6 | 70.1 | 0.6 |
| Leisure 2 | 0.0 | 20.0 | 17.0 | 1.5 | 60.9 | 0.5 |
| Leisure 3 | 0.0 | 8.4 | 20.5 | 0.9 | 69.6 | 0.6 |
| Leisure 4 | 0.0 | 6.5 | 20.8 | 1.2 | 70.9 | 0.6 |
| ICT 1 | 0.0 | 13.0 | 18.3 | 0.7 | 67.4 | 0.6 |
| ICT 2 | 0.0 | 9.0 | 23.5 | 0.6 | 66.3 | 0.6 |
| Finance 1 | 0.0 | 14.3 | 19.5 | 0.9 | 64.7 | 0.6 |
| Finance 2 | 0.0 | 20.1 | 19.6 | 1.2 | 58.6 | 0.5 |
| Finance 3 | 0.0 | 63.4 | 7.8 | 2.7 | 25.8 | 0.2 |
| Research 1 | 0.0 | 34.7 | 16.0 | 1.7 | 47.2 | 0.4 |
| State 1 | 0.0 | 31.9 | 18.1 | 1.5 | 48.0 | 0.4 |
| Trade 1 | 0.0 | 40.2 | 19.2 | 1.8 | 38.4 | 0.3 |
| Trade 2 | 0.0 | 8.0 | 23.6 | 0.8 | 67.1 | 0.6 |
| Trade 3 | 0.0 | 18.0 | 20.0 | 1.5 | 60.0 | 0.5 |
| Others 1 | 0.0 | 29.8 | 16.1 | 1.2 | 52.4 | 0.5 |
| Others 2 | 0.0 | 13.1 | 23.0 | 1.0 | 62.4 | 0.5 |
| Others 3 | 0.0 | 13.8 | 22.5 | 1.3 | 62.0 | 0.5 |
| Others 4 | 0.0 | 35.0 | 21.8 | 1.4 | 41.5 | 0.4 |
| Others 5 | 0.0 | 13.0 | 21.8 | 0.8 | 63.9 | 0.6 |
| Others 6 | 0.0 | 19.7 | 23.8 | 1.8 | 54.1 | 0.5 |
| Others 7 | 0.0 | 27.6 | 17.3 | 1.5 | 53.1 | 0.5 |
| Others 8 | 0.0 | 0.0 | 0.0 | 0.0 | 0.0 | 0.0 |
Table A5.
Considered dependent sectors and factor G of direct coupling used in the calculation model. Values obtained from [7].
Table A5.
Considered dependent sectors and factor G of direct coupling used in the calculation model. Values obtained from [7].
| Sectors | Dependent of | Factor G |
|---|---|---|
| Food 5 | Transport 8 | 1.290 |
| Food 7 | Energy 2 & Energy 3 | 0.987 |
| Care work 5 | Energy 2 & Energy 3 | 0.987 |
| Industry 8 | Construction 5 | 0.878 |
| Industry 9 | Energy 2 & Energy 3 | 0.987 |
| Industry 10 | Energy 2 & Energy 3 | 0.987 |
| Leisure 2 | ICT 1 | 1.010 |
| ICT 1 | Energy 2 & Energy 3 | 0.987 |
| Finance 1 | ICT 1 | 1.155 |
| Research 1 | Care work 2 | 0.727 |
Table A6.
Subsequent adjustment factors applied to each sector and their justification.
Table A6.
Subsequent adjustment factors applied to each sector and their justification.
| Sectors | Subsequent Adjustment Factor | Justification | ||
|---|---|---|---|---|
| BAU | GND | D | ||
| Food 1 | 1 | 1 | 1 | |
| Food 2 | 1 | 1 | 0.75 | Reflect greater use of animal traction |
| Food 3 | 1 | 1 | 1 | |
| Food 4 | 1 | 1 | 1 | |
| Food 5 | 1 | 0.71 | 0.51 | Reflecting the development of small-scale inshore and sailing fisheries |
| Food 6 | 1 | 0.81 | 0.84 | Reflect machine electrification, an increase in the use of human physical power and efficiency gains |
| Food 7 | 1 | 1 | 1 | |
| Forestry 1 | 1 | 1 | 1 | |
| Forestry 2 | 1 | 1 | 1 | |
| Forestry 3 | 1 | 1 | 1 | |
| Forestry 4 | 1 | 1 | 1 | |
| Forestry 5 | 1 | 1 | 1 | |
| Construction 1 | 1 | 0.8 | 0.8 | Reflect machine electrification, an increase in the use of human physical power and efficiency gains |
| Construction 2 | 1 | 1 | 1 | |
| Construction 3 | 1 | 1 | 1 | |
| Construction 4 | 1 | 1 | 1 | |
| Construction 5 | 1 | 1 | 1 | |
| Construction 6 | 1 | 1 | 1 | |
| Construction 7 | 1 | 1 | 1 | |
| Construction 8 | 1 | 0.5 | 0.5 | Reduced air-conditioning of spaces |
| Care work 1 | 1 | 1 | 1 | |
| Care work 2 | 1 | 0.5 | 0.5 | Reduced air-conditioning of spaces |
| Care work 3 | 1 | 0.8 | 0.8 | Reduced air-conditioning of spaces |
| Care work 4 | 1 | 0.5 | 0.5 | Reduced air-conditioning of spaces |
| Care work 5 | 1 | 1 | 1 | |
| Care work 6 | 1 | 1 | 1 | |
| Care work 7 | 1 | 1 | 1 | |
| Care work 8 | - | - | - | |
| Energy 1 | 1 | 1 | 1 | |
| Energy 2 | 1 | 1 | 1 | |
| Energy 3 | 1 | 1 | 1 | |
| Energy 4 | 1 | 1 | 1 | |
| Waste 1 | 1 | 0.72 | 0.72 | |
| Waste 2 | 1 | 0.81 | 0.81 | Use of less polluting means of transport in waste collection |
| Waste 3 | 1 | 1 | 1 | |
| Waste 4 | 1 | 1 | 1 | |
| Transport 1 | 1 | 1 | 1 | |
| Transport 2 | 1 | 1 | 1 | |
| Transport 3 | 1 | 1 | 1 | |
| Transport 4 | 1 | 1 | 1 | |
| Transport 5 | 1 | 1 | 1 | |
| Transport 6 | 1 | 1 | 1 | |
| Transport 7 | 1 | 1 | 1 | |
| Transport 8 | 1 | 1 | 1 | |
| Transport 9 | 1 | 0.57 | 0.17 | Reduction of international trade dependency |
| Transport 10 | 1 | 1 | 1 | |
| Transport 11 | 1 | 1 | 1 | |
| Tourism 1 | 1 | 0.5 | 0.5 | Reduced air-conditioning of spaces |
| Tourism 2 | 1 | 0.5 | 0.5 | Reduced air-conditioning of spaces |
| Tourism 3 | 1 | 0.5 | 0.5 | Reduced air-conditioning of spaces |
| Tourism 4 | 1 | 0.38 | 0.04 | Downscaling of the aviation sector |
| Industry 1 | 1 | 0.8 | 0.8 | Reflect machine electrification, an increase in the use of human physical power and efficiency gains |
| Industry 2 | 1 | 1 | 1 | |
| Industry 3 | 1 | 1 | 1 | |
| Industry 4 | 1 | 0.95 | 0.95 | Development of artisanal production with simple, low-energy-intensive machinery and electrification of the sector |
| Industry 5 | 1 | 1 | 1 | |
| Industry 6 | 1 | 1 | 1 | |
| Industry 7 | 1 | 1 | 1 | |
| Industry 8 | 1 | 1 | 1 | |
| Industry 9 | 1 | 1 | 1 | |
| Industry 10 | 1 | 1 | 1 | |
| Industry 11 | 1 | 1 | 1 | |
| Industry 12 | 1 | 0.83 | 0.83 | Reflect machine electrification, an increase in the use of human physical power and efficiency gains |
| Industry 13 | 1 | 1 | 1 | |
| Leisure 1 | 1 | 0.5 | 0.5 | Reduced air-conditioning of spaces |
| Leisure 2 | 1 | 0.5 | 0.5 | Reduced air-conditioning of spaces |
| Leisure 3 | 1 | 0.5 | 0.5 | Reduced air-conditioning of spaces |
| Leisure 4 | 1 | 1 | 1 | |
| ICT 1 | 1 | 1 | 1 | |
| ICT 2 | 1 | 0.5 | 0.5 | Reduced air-conditioning of spaces |
| Finance 1 | 1 | 0.5 | 0.5 | Reduced air-conditioning of spaces |
| Finance 2 | 1 | 0.5 | 0.5 | Reduced air-conditioning of spaces |
| Finance 3 | 1 | 0.5 | 0.5 | Reduced air-conditioning of spaces |
| Research 1 | 1 | 0.5 | 0.5 | Reduced air-conditioning of spaces |
| State 1 | 1 | 0.5 | 0.5 | Reduced air-conditioning of spaces |
| Trade 1 | 1 | 0.5 | 0.5 | Reduced air-conditioning of spaces |
| Trade 2 | 1 | 0.5 | 0.5 | Reduced air-conditioning of spaces |
| Trade 3 | 1 | 0.5 | 0.5 | Reduced air-conditioning of spaces |
| Others 1 | 1 | 0.5 | 0.5 | Reduced air-conditioning of spaces |
| Others 2 | 1 | 0.5 | 0.5 | Reduced air-conditioning of spaces |
| Others 3 | 1 | 0.5 | 0.5 | Reduced air-conditioning of spaces |
| Others 4 | 1 | 0.5 | 0.5 | Reduced air-conditioning of spaces |
| Others 5 | 1 | 0.5 | 0.5 | Reduced air-conditioning of spaces |
| Others 6 | 1 | 1 | 1 | |
| Others 7 | 1 | 0.5 | 0.5 | Reduced air-conditioning of spaces |
| Others 8 | 1 | 0.5 | 0.5 | Reduced air-conditioning of spaces |
Table A7.
Independent evolution of Care Work 8 sector. The energy consumption of transport activities has an annual percentual variation of 1.5, −13.3 and −20.0 for BAU, GND and D scenarios. And adjustment factor of 0.5 is applied to the heating/cooling activities of GND and D scenarios.
Table A7.
Independent evolution of Care Work 8 sector. The energy consumption of transport activities has an annual percentual variation of 1.5, −13.3 and −20.0 for BAU, GND and D scenarios. And adjustment factor of 0.5 is applied to the heating/cooling activities of GND and D scenarios.
| 2020 | 2030 BAU | 2030 GND | 2030 D | |
|---|---|---|---|---|
| Transport activities by households (ktoe) | 16,197.9 | 18,798.4 | 3873.9 | 1739.2 |
| Heating/cooling activities by households (ktoe) | 9278.9 | 9278.9 | 4639.5 | 4639.5 |
| Transport activities by households (ktoe) | 6021.6 | 6021.6 | 6021.6 | 6021.6 |
| Total primary energy consumption (ktoe) | 31,498.5 | 34,098.9 | 14,535.0 | 12,400.3 |
Table A8.
Primary energy consumption results for 2030 three scenarios by sectors of economic activity. Absolute values in ktoe and percentual variation between 2020 and 2030.
Table A8.
Primary energy consumption results for 2030 three scenarios by sectors of economic activity. Absolute values in ktoe and percentual variation between 2020 and 2030.
| BAU Scenario | GND Scenario | D Scenario | ||||
|---|---|---|---|---|---|---|
| Sectors | Ktoe 2030 | % 2020–2030 | Ktoe 2030 | % 2020–2030 | Ktoe 2030 | % 2020–2030 |
| Food 1 | 2801.8 | 0.0 | 1593.7 | −43.1 | 469.9 | −83.2 |
| Food 2 | 24.6 | 0.0 | 1010.6 | 4007.0 | 2722.2 | 10962.5 |
| Food 3 | 0.0 | 0.0 | 0.0 | 0.0 | 0.0 | 0.0 |
| Food 4 | 0.0 | 0.0 | 0.0 | 0.0 | 0.0 | 0.0 |
| Food 5 | 550.4 | −11.2 | 441.6 | −28.8 | 280.6 | −54.7 |
| Food 6 | 2943.1 | 9.8 | 2447.9 | −8.7 | 2584.5 | −3.6 |
| Food 7 | 70.5 | 103.4 | 82.2 | 137.2 | 25.8 | −25.5 |
| Forestry 1 | 138.6 | 65.2 | 238.3 | 183.9 | 275.7 | 228.5 |
| Forestry 2 | 0.0 | 0.0 | 0.0 | 0.0 | 0.0 | 0.0 |
| Forestry 3 | 0.0 | 0.0 | 0.0 | 0.0 | 0.0 | 0.0 |
| Forestry 4 | 0.0 | 0.0 | 0.0 | 0.0 | 0.0 | 0.0 |
| Forestry 5 | 0.0 | 0.0 | 0.0 | 0.0 | 0.0 | 0.0 |
| Construction 1 | 693.9 | 5.3 | 584.4 | −11.3 | 611.6 | −7.2 |
| Construction 2 | 0.0 | 0.0 | 0.0 | 0.0 | 0.0 | 0.0 |
| Construction 3 | 3069.5 | 9.4 | 1113.1 | −60.3 | 897.2 | −68.0 |
| Construction 4 | 723.1 | 30.5 | 267.8 | −51.7 | 257.3 | −53.6 |
| Construction 5 | 2340.5 | 27.9 | 646.2 | −64.7 | 351.1 | −80.8 |
| Construction 6 | 0.0 | 0.0 | 0.0 | 0.0 | 0.0 | 0.0 |
| Construction 7 | 670.9 | 60.7 | 413.8 | −0.9 | 402.2 | −3.7 |
| Construction 8 | 232.4 | 39.6 | 83.2 | −50.0 | 60.8 | −63.5 |
| Care work 1 | 562.3 | 6.4 | 562.3 | 6.4 | 519.9 | −1.6 |
| Care work 2 | 702.3 | 0.0 | 464.9 | −33.8 | 351.2 | −50.0 |
| Care work 3 | 665.5 | 0.0 | 798.2 | 19.9 | 532.4 | −20.0 |
| Care work 4 | 348.7 | 0.0 | 261.4 | −25.0 | 174.3 | −50.0 |
| Care work 5 | 46.9 | 102.3 | 49.5 | 113.5 | 18.4 | −20.9 |
| Care work 6 | 196.6 | 24.2 | 158.4 | 0.0 | 158.4 | 0.0 |
| Care work 7 | 0.0 | 0.0 | 0.0 | 0.0 | 0.0 | −11.5 |
| Care work 8 | 34,098.9 | 8.3 | 14,535.0 | −53.9 | 12,400.3 | −60.6 |
| Energy 1 | 10,224.5 | 12.5 | 1559.6 | −82.8 | 1559.6 | −82.8 |
| Energy 2 | 38,635.9 | 25.5 | 24,626.7 | −20.0 | 5281.5 | −82.8 |
| Energy 3 | 0.0 | 0.0 | 0.0 | 0.0 | 0.0 | 0.0 |
| Energy 4 | 123.0 | 0.0 | 21.1 | −82.8 | 21.1 | −82.8 |
| Waste 1 | 9.7 | 16.9 | 9.4 | 14.2 | 8.1 | −1.9 |
| Waste 2 | 45.1 | 16.9 | 31.4 | −18.6 | 31.4 | −18.6 |
| Waste 3 | 9.7 | 16.9 | 7.3 | −11.2 | 6.9 | −16.4 |
| Waste 4 | 0.0 | 0.0 | 0.0 | 0.0 | 0.0 | 0.0 |
| Transport 1 | 567.0 | 7.1 | 247.8 | −53.2 | 101.7 | −80.8 |
| Transport 2 | 143.5 | 30.0 | 71.1 | −35.6 | 44.1 | −60.0 |
| Transport 3 | 680.1 | 10.9 | 584.7 | −4.7 | 515.2 | −16.0 |
| Transport 4 | 109.0 | 0.0 | 18.7 | −82.8 | 18.7 | −82.8 |
| Transport 5 | 714.1 | 65.2 | 1420.2 | 228.5 | 1420.2 | 228.5 |
| Transport 6 | 295.7 | −54.9 | 295.7 | −54.9 | 295.7 | −54.9 |
| Transport 7 | 8801.7 | 6.0 | 3287.4 | −60.4 | 2037.2 | −75.5 |
| Transport 8 | 1031.3 | −8.8 | 1133.7 | 0.2 | 1031.0 | −8.8 |
| Transport 9 | 6681.8 | 0.0 | 3808.6 | −43.0 | 1135.9 | −83.0 |
| Transport 10 | 1557.0 | 14.6 | 174.0 | −87.2 | 174.0 | −87.2 |
| Transport 11 | 521.0 | 24.1 | 425.5 | 1.3 | 385.9 | −8.1 |
| Tourism 1 | 574.4 | 25.8 | 185.7 | −59.3 | 163.6 | −64.2 |
| Tourism 2 | 574.4 | 25.8 | 228.4 | −50.0 | 197.9 | −56.7 |
| Tourism 3 | 140.6 | 66.2 | 38.4 | −54.7 | 31.5 | −62.8 |
| Tourism 4 | 2874.9 | 0.0 | 1092.5 | −62.0 | 115.0 | −96.0 |
| Industry 1 | 333.4 | 0.0 | 323.2 | −3.1 | 364.0 | 9.2 |
| Industry 2 | 1659.0 | 0.0 | 1659.0 | 0.0 | 1446.0 | −12.8 |
| Industry 3 | 168.2 | 15.9 | 145.1 | 0.0 | 104.2 | −28.2 |
| Industry 4 | 6540.5 | 6.0 | 4172.8 | −32.4 | 3586.2 | −41.9 |
| Industry 5 | 663.3 | 9.4 | 358.0 | −41.0 | 606.3 | 0.0 |
| Industry 6 | 63.0 | 9.9 | 41.2 | −28.2 | 32.3 | −43.8 |
| Industry 7 | 5456.9 | 11.6 | 4978.6 | 1.8 | 3640.5 | −25.5 |
| Industry 8 | 567.4 | 24.2 | 184.2 | −59.7 | 108.9 | −76.2 |
| Industry 9 | 47.7 | 94.3 | 48.0 | 95.8 | 13.0 | −47.0 |
| Industry 10 | 200.6 | 12.0 | 200.6 | 12.0 | 88.4 | −50.7 |
| Industry 11 | 177.7 | 7.5 | 166.6 | 0.8 | 154.2 | −6.6 |
| Industry 12 | 10.2 | 7.8 | 8.0 | −15.2 | 7.9 | −16.7 |
| Industry 13 | 42.2 | 29.7 | 52.9 | 62.6 | 63.7 | 95.8 |
| Leisure 1 | 117.5 | 40.2 | 108.8 | 29.9 | 103.0 | 22.9 |
| Leisure 2 | 190.2 | 0.0 | 95.1 | −50.0 | 95.1 | −50.0 |
| Leisure 3 | 183.4 | 0.0 | 97.2 | −47.0 | 94.1 | −48.7 |
| Leisure 4 | 153.4 | 0.0 | 190.4 | 24.2 | 153.4 | 0.0 |
| ICT 1 | 618.4 | 103.4 | 807.5 | 165.5 | 199.2 | −34.5 |
| ICT 2 | 165.2 | 23.3 | 100.4 | −25.0 | 64.1 | −52.1 |
| Finance 1 | 300.1 | 38.1 | 150.0 | −30.9 | 79.1 | −63.6 |
| Finance 2 | 85.6 | 0.0 | 42.8 | −50.0 | 34.7 | −59.5 |
| Finance 3 | 134.8 | 0.0 | 62.6 | −53.6 | 53.8 | −60.1 |
| Research 1 | 87.6 | 2.3 | 52.5 | −38.6 | 43.8 | −48.9 |
| State 1 | 1152.1 | 0.0 | 653.5 | −43.3 | 564.3 | −51.0 |
| Trade 1 | 1792.1 | 28.0 | 710.9 | −49.2 | 635.7 | −54.6 |
| Trade 2 | 1508.7 | 15.2 | 700.9 | −46.5 | 620.0 | −52.7 |
| Trade 3 | 88.7 | 11.7 | 39.7 | −50.0 | 23.6 | −70.4 |
| Others 1 | 101.3 | −11.4 | 57.1 | −50.0 | 57.1 | −50.0 |
| Others 2 | 243.5 | 0.0 | 121.8 | −50.0 | 110.8 | −54.5 |
| Others 3 | 60.9 | 0.0 | 33.1 | −45.7 | 25.1 | −58.9 |
| Others 4 | 119.9 | 0.0 | 122.9 | 2.5 | 104.0 | −13.2 |
| Others 5 | 40.3 | 0.0 | 15.2 | −62.3 | 15.0 | −62.8 |
| Others 6 | 202.1 | 0.0 | 220.4 | 9.1 | 186.5 | −7.7 |
| Others 7 | 147.3 | 0.0 | 117.8 | −20.0 | 108.7 | −26.2 |
| Others 8 | 0.0 | 0.0 | 0.0 | 0.0 | 0.0 | 0.0 |
Table A9.
Changes in the distribution of energy products consumption in for 2030 three scenarios.
Table A9.
Changes in the distribution of energy products consumption in for 2030 three scenarios.
| Sectors | Coal and Secondary Products | Petroleum Products | Natural Gas | Renewables and Waste Products | Electricity | Heat |
|---|---|---|---|---|---|---|
| 2030 distribution of energy products in BAU scenario (%) | ||||||
| Care Work 1 | 0.23 | 61.13 | 10.99 | 9.23 | 17.66 | 0.23 |
| 2030 distribution of energy products in GND scenario (%) | ||||||
| Food 5 | 0.0 | 98.4 | 0.0 | 1.5 | 0.0 | 0.0 |
| Food 6 | 0.6 | 14.1 | 32.3 | 8.0 | 44.9 | 0.6 |
| Construction 1 | 0.0 | 6.4 | 18.6 | 48.4 | 26.6 | 0.0 |
| Care Work 8 | 0.3 | 34.9 | 12.9 | 9.6 | 41.4 | 0.3 |
| Waste 1 | 0.0 | 87.1 | 9.3 | 3.6 | 0.0 | 0.0 |
| Waste 2 | 0.0 | 88.5 | 8.3 | 3.2 | 0.0 | 0.0 |
| Industry 1 | 0.0 | 14.6 | 30.7 | 0.9 | 53.7 | 0.0 |
| Industry 12 | 0.0 | 76.7 | 0.2 | 3.8 | 19.3 | 0.0 |
| 2030 distribution of energy products in D scenario (%) | ||||||
| Construction 1 | 0.0 | 69.8 | 3.5 | 4.0 | 22.4 | 0.0 |
| Construction 2 | 0.0 | 97.8 | 0.0 | 2.1 | 0.0 | 0.0 |
| Construction 3 | 0.6 | 13.2 | 30.3 | 8.0 | 47.9 | 0.6 |
| Construction 4 | 0.0 | 6.4 | 18.6 | 48.4 | 26.6 | 0.0 |
| Construction 5 | 0.3 | 24.3 | 15.1 | 10.7 | 48.5 | 0.3 |
| Construction 6 | 0.0 | 87.1 | 9.3 | 3.6 | 0.0 | 0.0 |
| Construction 7 | 0.0 | 88.5 | 8.3 | 3.2 | 0.0 | 0.0 |
| Construction 8 | 0.0 | 14.6 | 30.7 | 0.9 | 53.7 | 0.0 |
| Care work 1 | 0.0 | 76.7 | 0.2 | 3.8 | 19.3 | 0.0 |
References
- Harvey, C. CO2 Levels Just Hit Another Record—Here’s Why It Matters. Scientific American. 16 May 2019. Available online: https://www.scientificamerican.com/article/co2-levels-just-hit-another-record-heres-why-it-matters/ (accessed on 2 August 2021).
- Bp. Statistical Review of World Energy 2020; BP p.l.c.: London, UK, 2020. [Google Scholar]
- IEA. Net Zero by 2050; International Energy Agency: Paris, France, 2021. [Google Scholar]
- Jacobson, M.Z.; Delucchi, M.A.; Bauer, Z.A.F.; Goodman, S.C.; Chapman, W.E.; Cameron, M.A.; Bozonnat, C.; Chobadi, L.; Clonts, H.A.; Enevoldsen, P.; et al. 100% Clean and Renewable Wind, Water, and Sunlight All-Sector Energy Roadmaps for 139 Countries of the World. Joule 2017, 1, 108–121. [Google Scholar] [CrossRef] [Green Version]
- Floyd, J.; Alexander, S.; Lenzen, M.; Moriarty, P.; Palmer, G.; Chandra-Shekeran, S.; Foran, B.; Keyßer, L. Energy descent as a post-carbon transition scenario: How ‘knowledge humility’ reshapes energy futures for post-normal times. Futures 2020, 122, 102565. [Google Scholar] [CrossRef]
- Pörtner, H.O.; Scholes, R.J.; Agard, J.; Archer, E.; Arneth, A.; Bai, X.; Barnes, D.; Burrows, M.; Chan, L.; Cheung, W.L.; et al. Scientific Outcome of the IPBES-IPCC Co-Sponsored Workshop on Biodiversity and Climate Change; IPBES Secretariat: Bonn, Germany, 2021. [Google Scholar] [CrossRef]
- González, L.; Almazán, A.; Lareo, A.; Actis, W.; Bueno, L.M.; Madorrán, C.; Santiago, E.; de Benito, C. Escenarios de Trabajo en la Transición Ecosocial 2020–2030; Ecologistas en Acción: Madrid, Spain, 2019. [Google Scholar]
- IPCC. Climate Change 2021: The Physical Science Basis; Contribution of Working Group I to the Sixth Assessment Report of the Intergovernmental Panel on Climate Change; Masson-Delmotte, V., Zhai, P., Pirani, A., Connors, S.L., Péan, C., Berger, S., Caud, N., Chen, Y., Goldfarb, L., Gomis, M.I., et al., Eds.; Cambridge University Press: Cambridge, UK, 2021. [Google Scholar]
- EASAC. Negative Emission Technologies: What Role in Meeting Paris Agreement Targets? European Academies’ Science Advisory Council: Halle, Germany, 2018. [Google Scholar]
- Dyke, J.; Watson, R.; Knorr, W. Climate Scientists: Concept of Net Zero is a Dangerous Trap. The Conversation. 22 April 2021. Available online: https://theconversation.com/climate-scientists-concept-of-net-zero-is-a-dangerous-trap-157368 (accessed on 15 May 2021).
- Grubler, A.; Wilson, C.; Bento, N.; Boza-Kiss, B.; Krey, V.; Mc-Collum, D.L.; Rao, N.D.; Riahi, K.; Rogelj, J.; De Stercke, S.; et al. A low energy demand scenario for meeting the 1.5 °C target and sustainable development goals without negative emission technologies. Nat. Energy 2018, 3, 515–527. [Google Scholar] [CrossRef]
- Hickel, J.; Brockway, P.; Kallis, G.; Keyßer, L.; Lenzen, M.; Slameršak, A.; Steinberger, J.; Ürge-Vorsatz, D. Urgent need for post-growth climate mitigation scenarios. Nat. Energy 2021, 6, 766–768. [Google Scholar] [CrossRef]
- Keyßer, L.T.; Lenzen, M. 1.5 °C degrowth scenarios suggest the need for new mitigation pathways. Nat. Commun. 2021, 12, 2676. [Google Scholar] [CrossRef]
- IEA. The Role of Critical Minerals in Clean Energy Transitions; International Energy Agency: Paris, France, 2021. [Google Scholar]
- Valero, A.; Valero, A.; Calvo, G.; Ortego, A. Material bottlenecks in the future development of green technologies. Renew. Sustain. Energy Rev. 2018, 93, 178–200. [Google Scholar] [CrossRef]
- Calvo, G.; Valero, A. Strategic mineral resources: Availability and future estimations for the renewable energy sector. Environ. Dev. 2021, 100640. [Google Scholar] [CrossRef]
- Dominish, E.; Florin, N.; Teske, S. Responsible Minerals Sourcing for Renewable Energy; Institute for Sustainable Futures, University of Technology Sydney: Sydney, Australia, 2019. [Google Scholar]
- Sonter, L.J.; Dade, M.C.; Watson, J.E.M.; Valenta, R.K. Renewable energy production will exacerbate mining threats to biodiversity. Nat. Commun. 2020, 11, 4174. [Google Scholar] [CrossRef] [PubMed]
- IEA. World Energy Outlook 2010; International Energy Agency: Paris, France, 2010. [Google Scholar]
- IEA. World Energy Outlook 2020; International Energy Agency: Paris, France, 2020. [Google Scholar]
- Murshed, M.; Tanha, M.M. Oil price shocks and renewable energy transition: Empirical evidence from net oil-importing South Asian economies. Energy Ecol. Environ. 2021, 6, 183–203. [Google Scholar] [CrossRef]
- de Castro, C.; Capellán-Pérez, I. Standard, Point of Use, and Extended Energy Return on Energy Invested (EROI) from Comprehensive Material Requirements of Present Global Wind, Solar, and Hydro Power Technologies. Energies 2020, 13, 3036. [Google Scholar] [CrossRef]
- Calvo, G.; Mudd, G.; Valero, A.; Valero, A. Decreasing Ore Grades in Global Metallic Mining: A Theoretical Issue or a Global Reality? Resources 2016, 5, 36. [Google Scholar] [CrossRef] [Green Version]
- Lynch, M.J.; Long, M.A.; Stretesky, P.B.; Barrett, K.L. Measuring the ecological impact of the wealthy: Excessive consumption, ecological disorganization, green crime, and justice. Soc. Curr. 2019, 6, 377–395. [Google Scholar] [CrossRef]
- Oswald, Y.; Owen, A.; Steinberger, J.K. Large inequality in international and intranational energy footprints between income groups and across consumption categories. Nat. Energy 2020, 5, 231–239. [Google Scholar] [CrossRef]
- Steinberger, J.K.; Roberts, J.T. From constraint to sufficiency: The decoupling of energy and carbon from human needs, 1975–2005. Ecol. Econ. 2010, 70, 425–433. [Google Scholar] [CrossRef]
- Akizu-Gardoki, O.; Bueno, G.; Wiedmann, T.; Lopez-Guede, J.M.; Arto, I.; Hernandez, P.; Moran, D. Decoupling between human development and energy consumption within footprint accounts. J. Clean. Prod. 2018, 202, 1145–1157. [Google Scholar] [CrossRef]
- Vogel, J.; Steinberger, J.K.; O’Neill, D.W.; Lamb, W.F.; Krishnakumar, J. Socio-economic conditions for satisfying human needs at low energy use: An international analysis of social provisioning. Glob. Environ. Chang. 2021, 102287. [Google Scholar] [CrossRef]
- Millward-Hopkins, J.; Steinberger, J.K.; Rao, N.D.; Oswald, Y. Providing decent living with minimum energy: A global scenario. Glob. Environ. Chang. 2020, 65, 102168. [Google Scholar] [CrossRef]
- MITECO. Libro de la Energía en España 2018; Ministerio para la Transición Ecológica y el Reto Demográfico: Madrid, Spain, 2020. [Google Scholar]
- INE. Proyecciones de Población 2020–2070; Instituto Nacional de Estadística: Madrid, Spain, 2020. [Google Scholar]
- Shove, E.; Walker, G. What Is Energy For? Social Practice and Energy Demand. Theory Cult. Soc. 2014, 31, 41–58. [Google Scholar] [CrossRef] [Green Version]
- Royston, S.; Selby, J.; Shove, E. Invisible energy policies: A new agenda for energy demand reduction. Energy Policy 2018, 123, 127–135. [Google Scholar] [CrossRef] [Green Version]
- Walker, G.; Simcock, N.; Day, R. Necessary energy uses and a minimum standard of living in the United Kingdom: Energy justice or escalating expectations? Energy Res. Soc. Sci. 2016, 18, 129–138. [Google Scholar] [CrossRef]
- Geels, F.W.; Schwanen, T.; Sorrell, S.; Jenkins, K.; Sovacool, B.K. Reducing energy demand through low carbon innovation: A sociotechnical transitions perspective and thirteen research debates. Energy Res. Soc. Sci. 2018, 40, 23–35. [Google Scholar] [CrossRef]
- Sorrell, S. Reducing energy demand: A review of issues, challenges and approaches. Renew. Sustain. Energy Rev. 2015, 47, 74–82. [Google Scholar] [CrossRef] [Green Version]
- Freire-González, J. Evidence of direct and indirect rebound effect in households in EU-27 countries. Energy Policy 2017, 102, 270–276. [Google Scholar] [CrossRef]
- Calwell, C. Is Efficient Sufficient? The Case for Shifting our Emphasis in Energy Specifications to Progressive Efficiency and Sufficiency; European Council for an Energy Efficient Economy: Stockholm, Sweden, 2010. [Google Scholar]
- Shove, E. What is wrong with energy efficiency? Build. Res. Inf. 2017, 46, 779–789. [Google Scholar] [CrossRef]
- Alexander, S.; Rutherford, J. A critique of techno-optimism. In Routledge Handbook of Global Sustainability Governance; Kalfagianni, A., Fuchs, D., Hayden, A., Eds.; Routledge: London, UK, 2019; pp. 231–241. [Google Scholar]
- Darby, S. Enough is as good as a feast—Sufficiency as policy. In Proceedings of the ECEEE 2007 Summer Study on Energy Efficiency, Côte d’Azur, France, 4–9 June 2007. [Google Scholar]
- Thomas, S.; Brischke, L.A.; Thema, J.; Kopatz, M. Energy sufficiency policy: An evolution of energy efficiency policy or radically new approaches? In Proceedings of the ECEEE 2015 Summer Study on Energy Efficiency, Hyères, France, 1–6 June 2015.
- Parrique, T.; Barth, J.; Briens, F.; Kerschner, C.; Kraus-Polk, A.; Kuokkanen, A.; Spangenberg, J. Decoupling Debunked: Evidence and Arguments against Green Growth as a Sole Strategy for Sustainability; European Environmental Bureau: Brussels, Belgium, 2019. [Google Scholar]
- Hickel, J.; Kallis, G. Is Green Growth Possible? New Polit. Econ. 2019, 25, 469–486. [Google Scholar] [CrossRef]
- Ferguson, S. Women and Work Feminism, Labour, and Social Reproduction; Pluto Press: London, UK, 2020. [Google Scholar]
- Tejero, H.; Santiago, E. ¿Qué Hacer en Caso de Incendio? Manifiesto por el Green New Deal; Capitan Swing: Madrid, Spain, 2019. [Google Scholar]
- Ecologistas en Acción; La Transicionera. Caminar Sobre el Abismo de los Límites. Políticas ante la Crisis Ecológica, Social y Económica; Ecologistas en Acción: Madrid, Spain, 2019. [Google Scholar]
- WIOD. Socio Economic Accounts Release 2016; World Input-Output Database: Brussels, Belgium, 2018. [Google Scholar]
- Eurostat. Physical Energy Flow Accounts; Eurostat, the Statistical Office of the European Union: Luxembourg, 2021. [Google Scholar]
- Eurostat. Key Indicators of Physical Energy Flow Accounts by NACE Rev. 2 Activity (env_ac_pefa04); Eurostat, the Statistical Office of the European Union: Luxembourg, 2017. [Google Scholar]
- Eurostat. Energy Supply and Use by NACE Rev. 2 Activity (env_ac_pefasu); Eurostat, the Statistical Office of the European Union: Luxembourg, 2017. [Google Scholar]
- INE. Encuesta de Población Activa, Ficheros de Microdatos de los Cuatro Trimestres de 2017 con Desagregación a 3 Dígitos de la Variable “Actividad en la Ocupación Principal”; Instituto Nacional de Estadística: Madrid, Spain, 2019. [Google Scholar]
- Kovacic, Z.; Spanò, M.; Lo Piano, S.; Sorman, A.H. Finance, energy and the decoupling: An empirical study. J. Evol. Econ. 2017, 28, 565–590. [Google Scholar] [CrossRef]
- Capellán-Pérez, I.; de Blas, I.; Nieto, J.; de Castro, C.; Miguel, L.J.; Carpintero, O.; Mediavilla, M.; Lobejón, L.F.; Ferreras-Alonso, N.; Rodrigo, P.; et al. MEDEAS: A new modeling framework integrating global biophysical and socioeconomic constraints. Energy Environ. Sci. 2020, 13, 986. [Google Scholar] [CrossRef]
- Kuhnhenn, K.; Costa, L.; Mahnke, E.; Schneider, L.; Lange, S. A Societal Transformation Scenario for Staying Below 1.5 °C; Volume 23 of the Publication Series Economic & Social Issues; Heinrich Böll Foundation and Konzeptwerk Neue Ökonomie: Berlin, Germany, 2020. [Google Scholar]
- Pérez, A. Green Deals in a Time of Pandemics. The Future will be Contested Now; Libros en Acción, Observatori del Deute en la Globalització, Icaria Editorial: Barcelona, Spain, 2021. [Google Scholar]
- Foster, J.B.; Clark, B.; York, R. The Ecological Rift: Capitalism’s War on the Earth; Monthly Review Press: New York, NY, USA, 2010. [Google Scholar]
- Alonso, A.M.; Guzmán, G.J. Comparison of the efficiency and use of energy in organic and conventional farming in spanish agricultural systems. J. Sustain. Agric. 2010, 34, 312–338. [Google Scholar] [CrossRef]
- Vidrio España. Contribución Económica, Ambiental y Social del Sector del Vidrio en España; Vidio España: Madrid, Spain, 2017. [Google Scholar]
- Eurostat. Complete Energy Balances (nrg _bal_c); Eurostat, the Statistical Office of the European Union: Luxembourg, 2017. [Google Scholar]
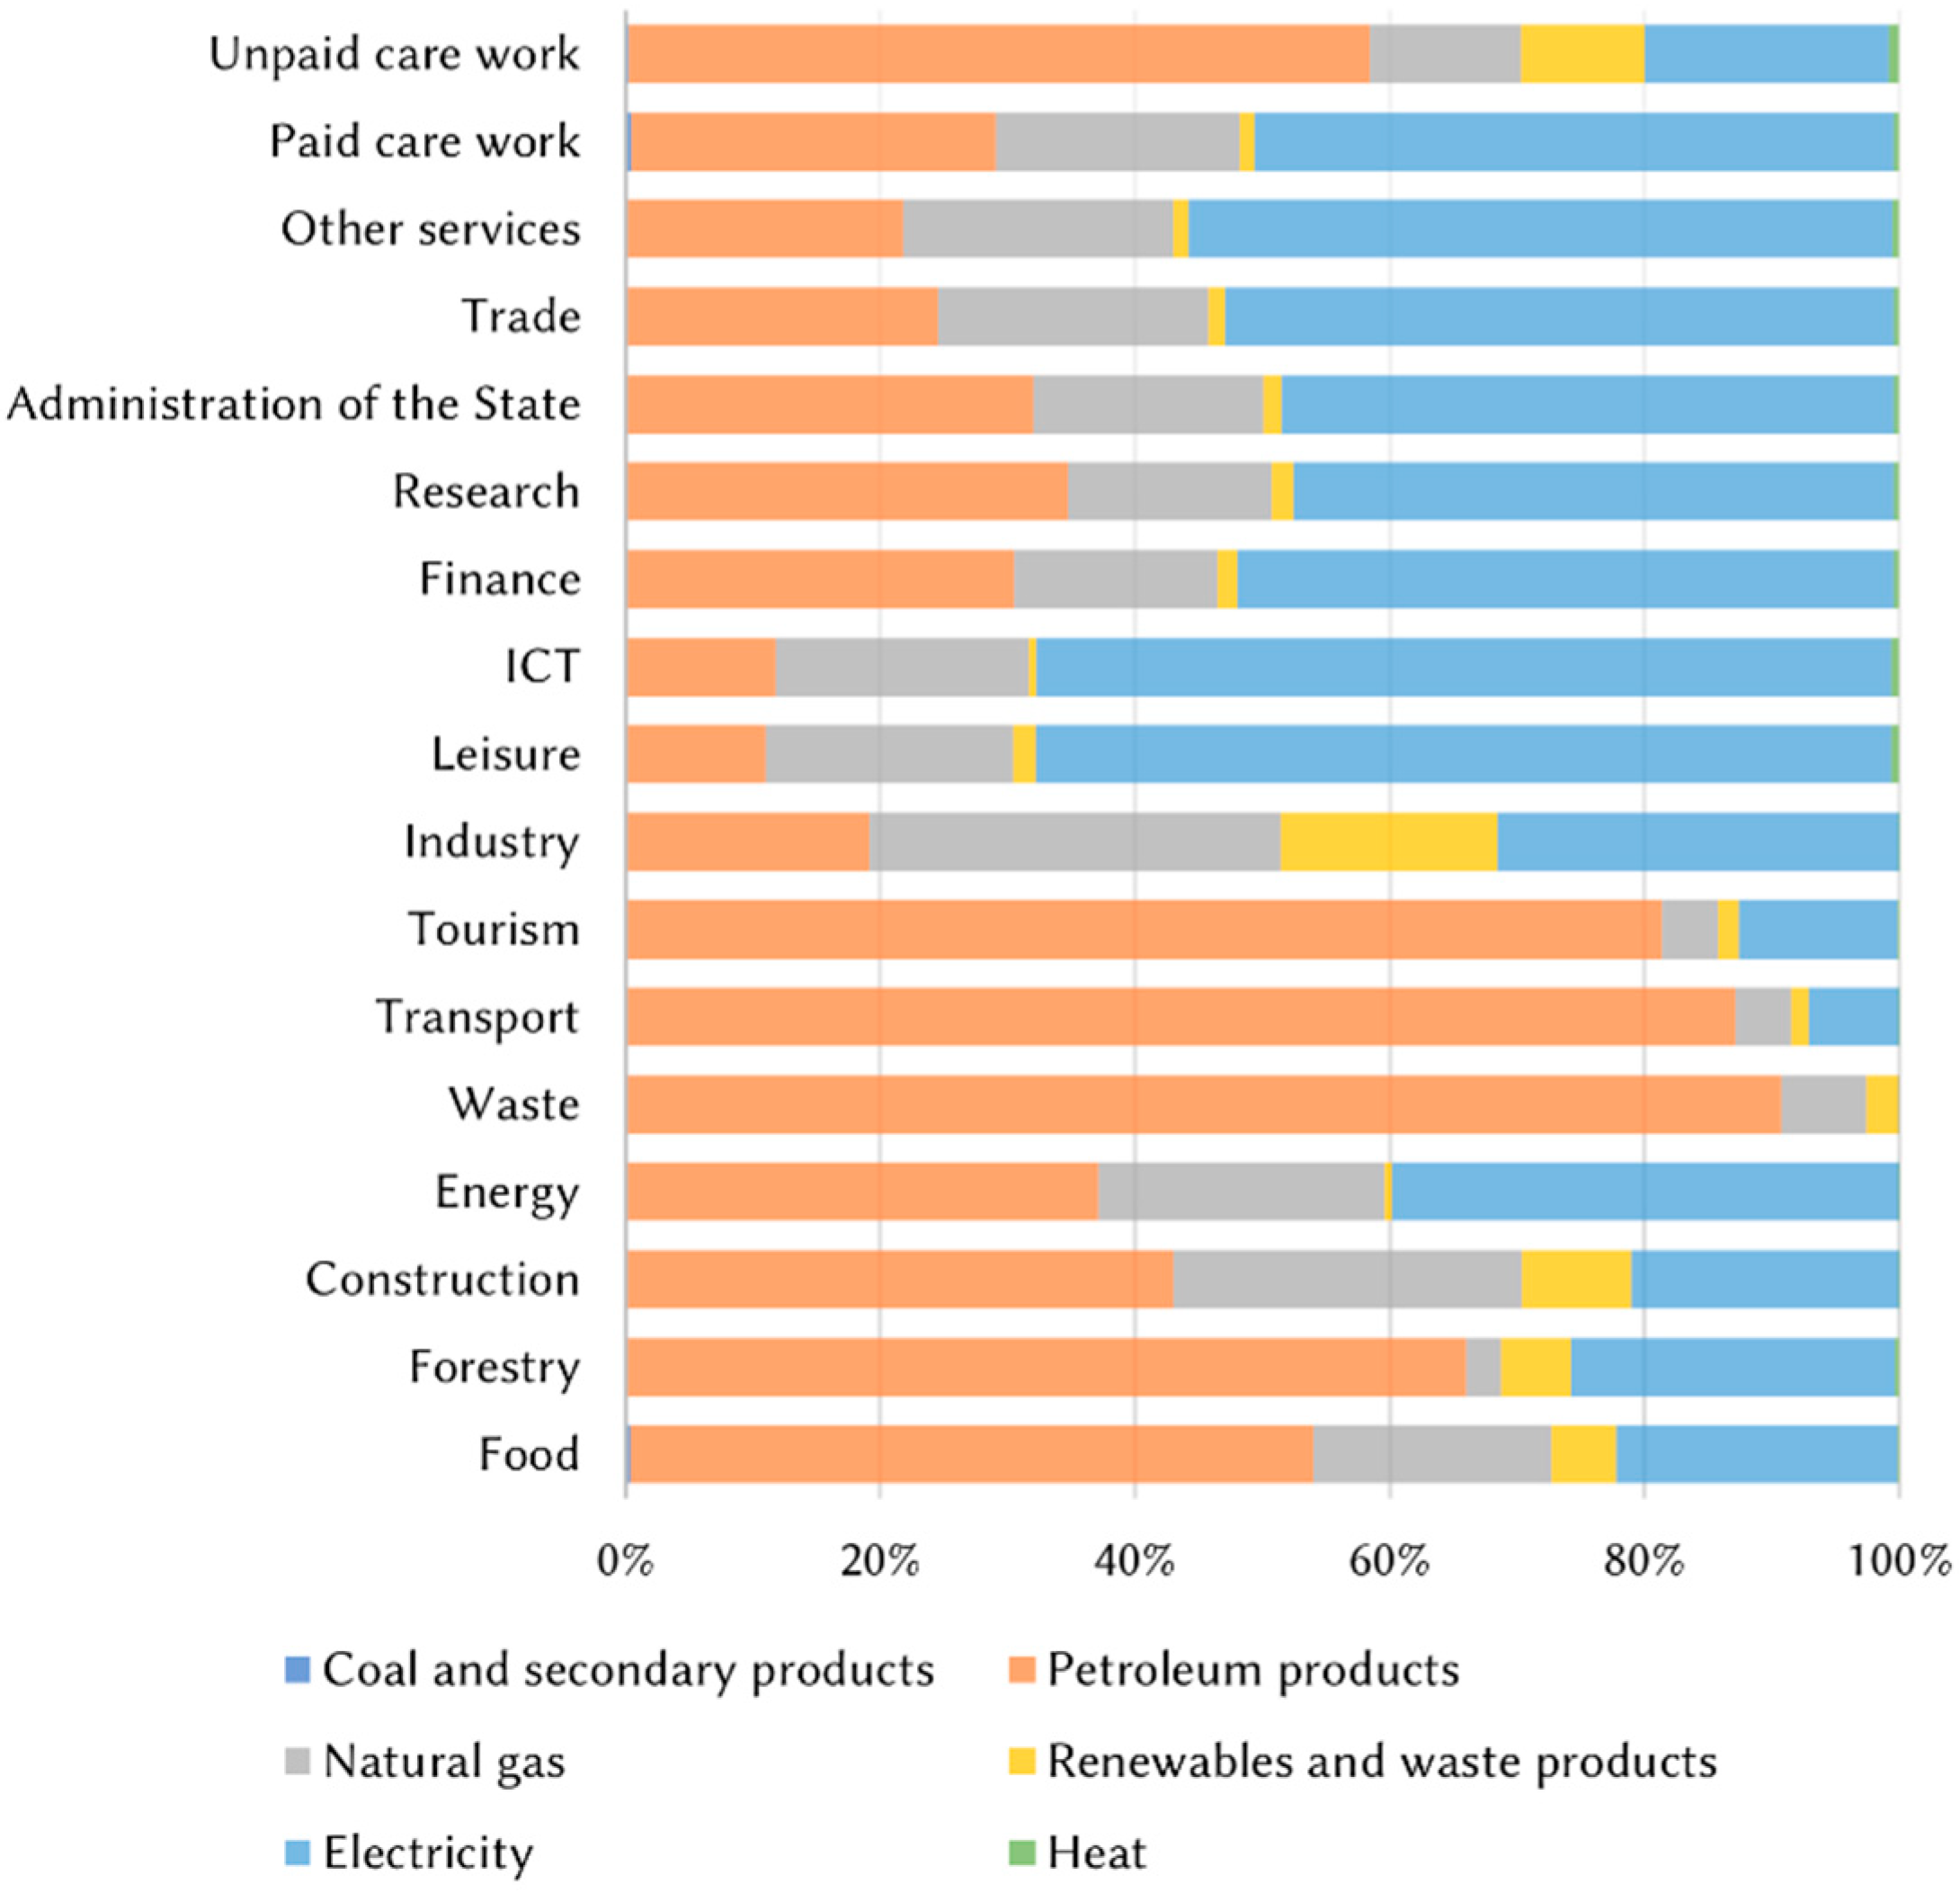

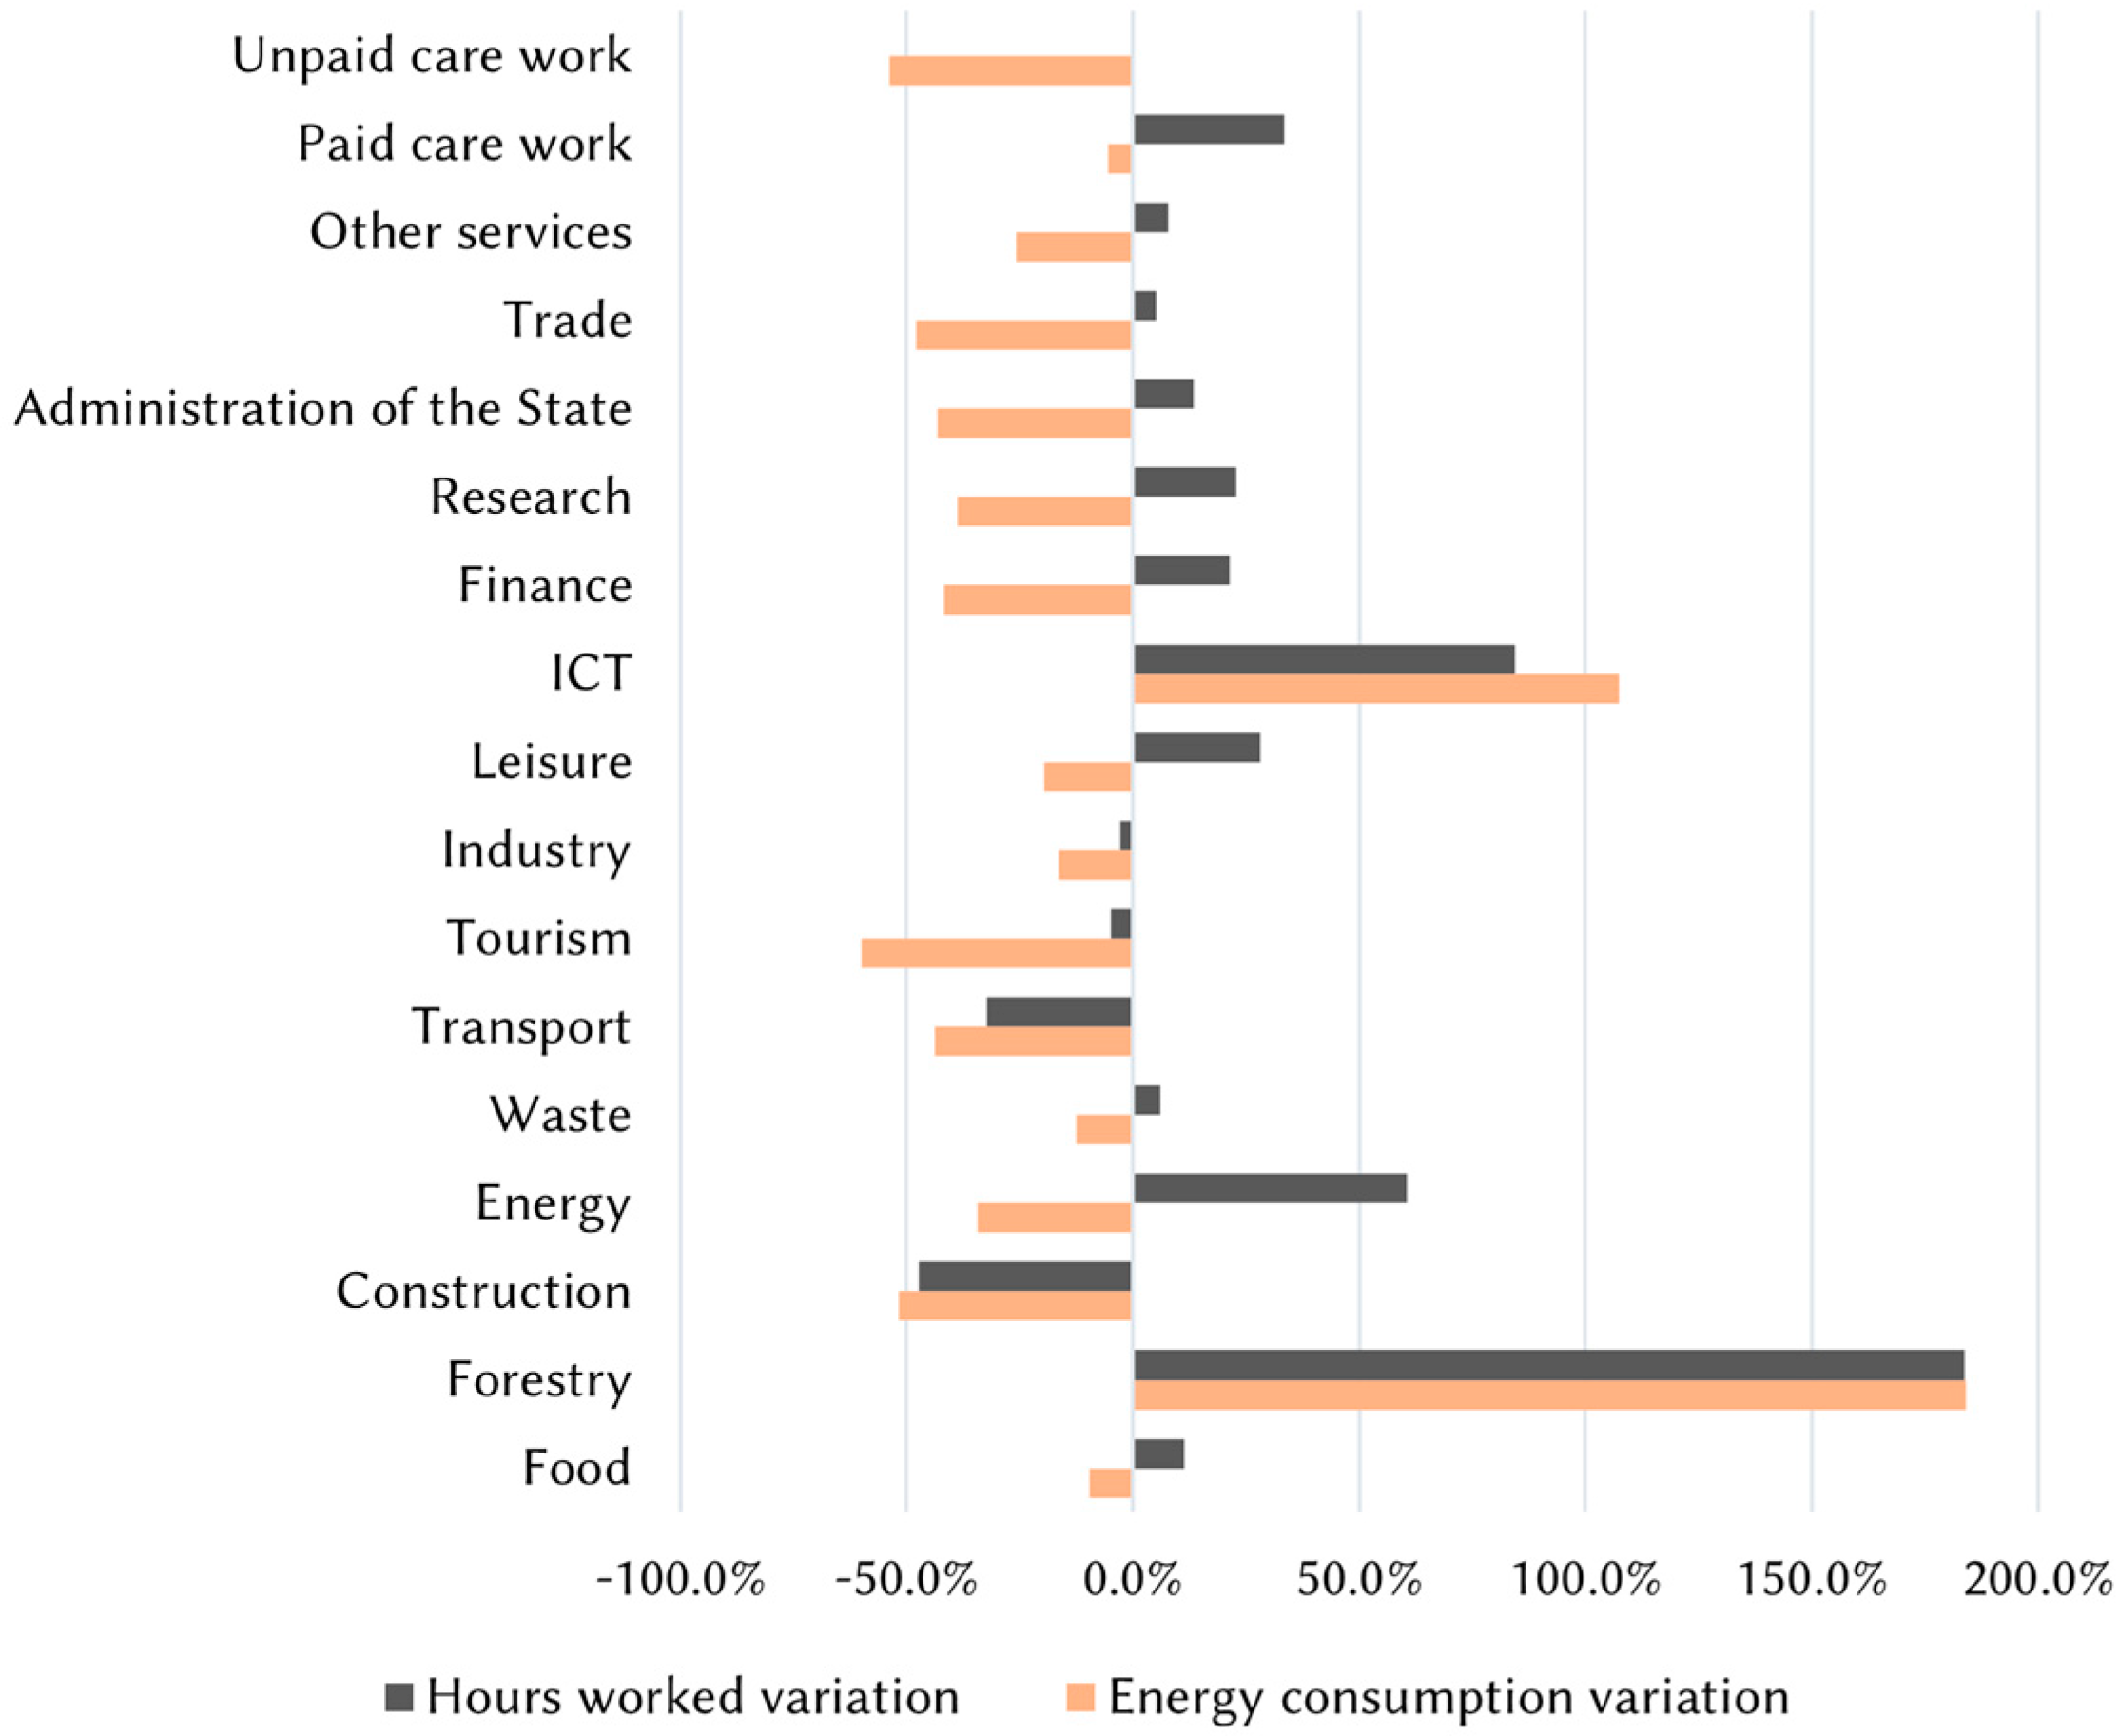
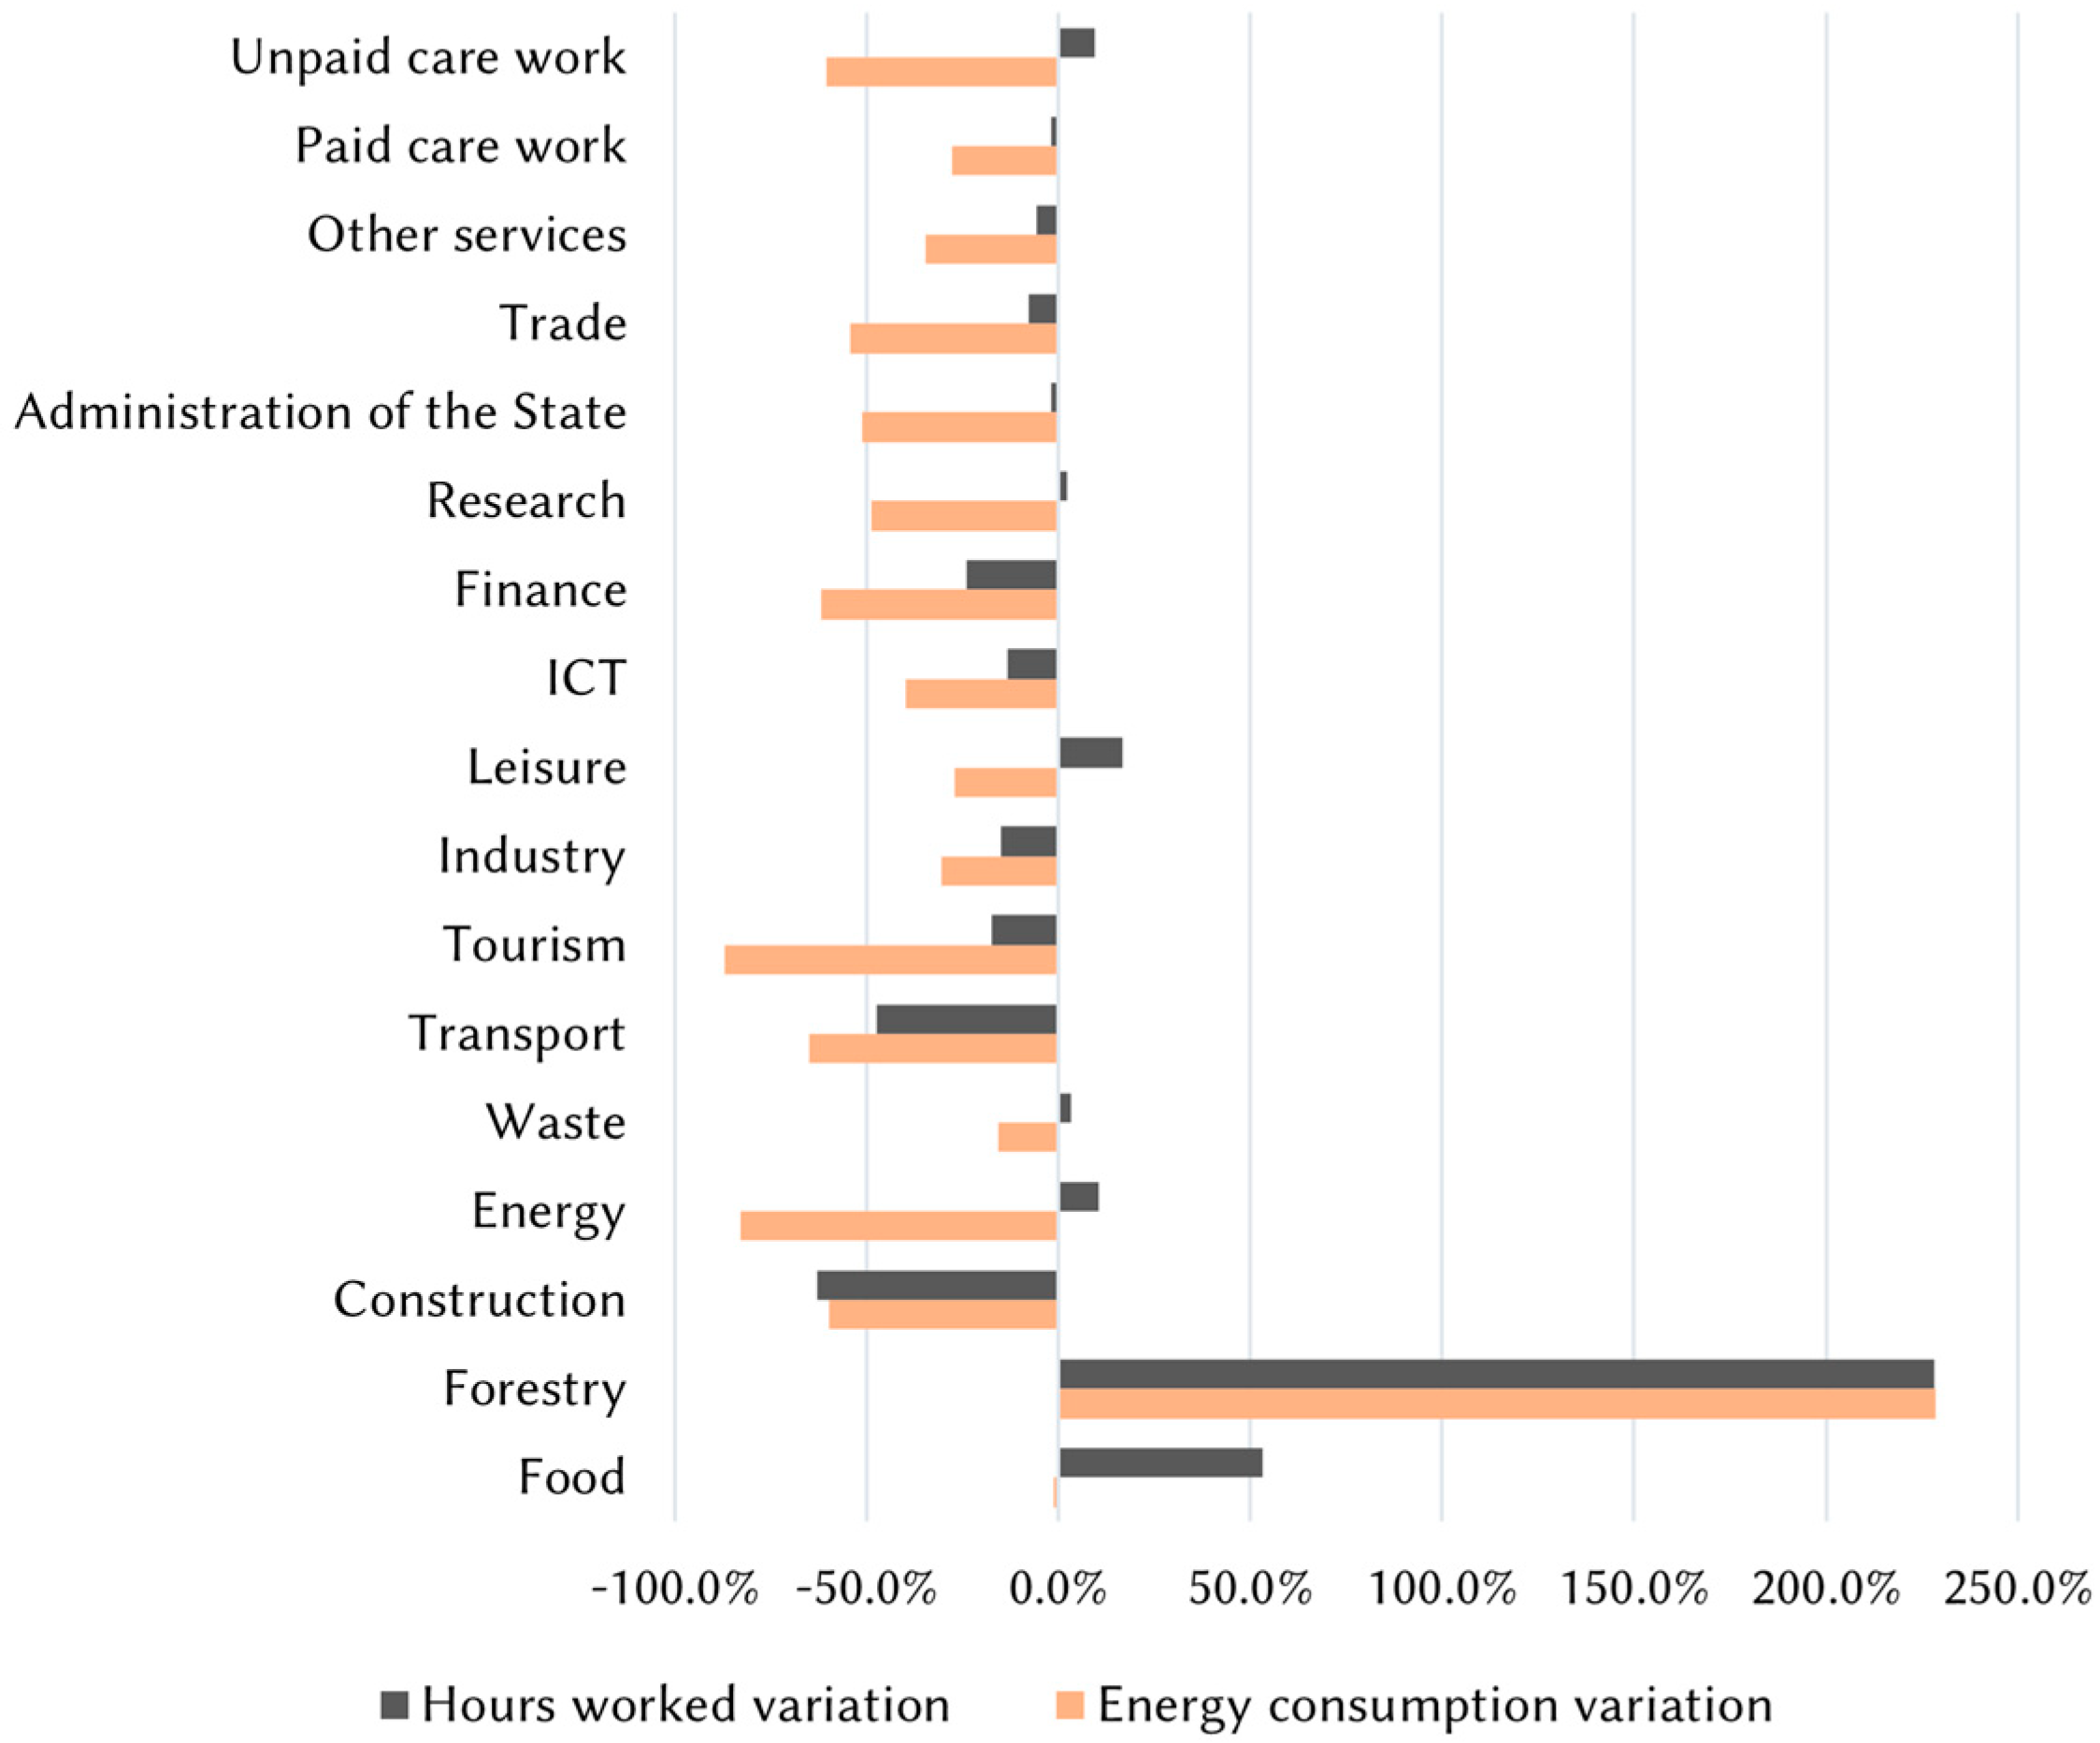

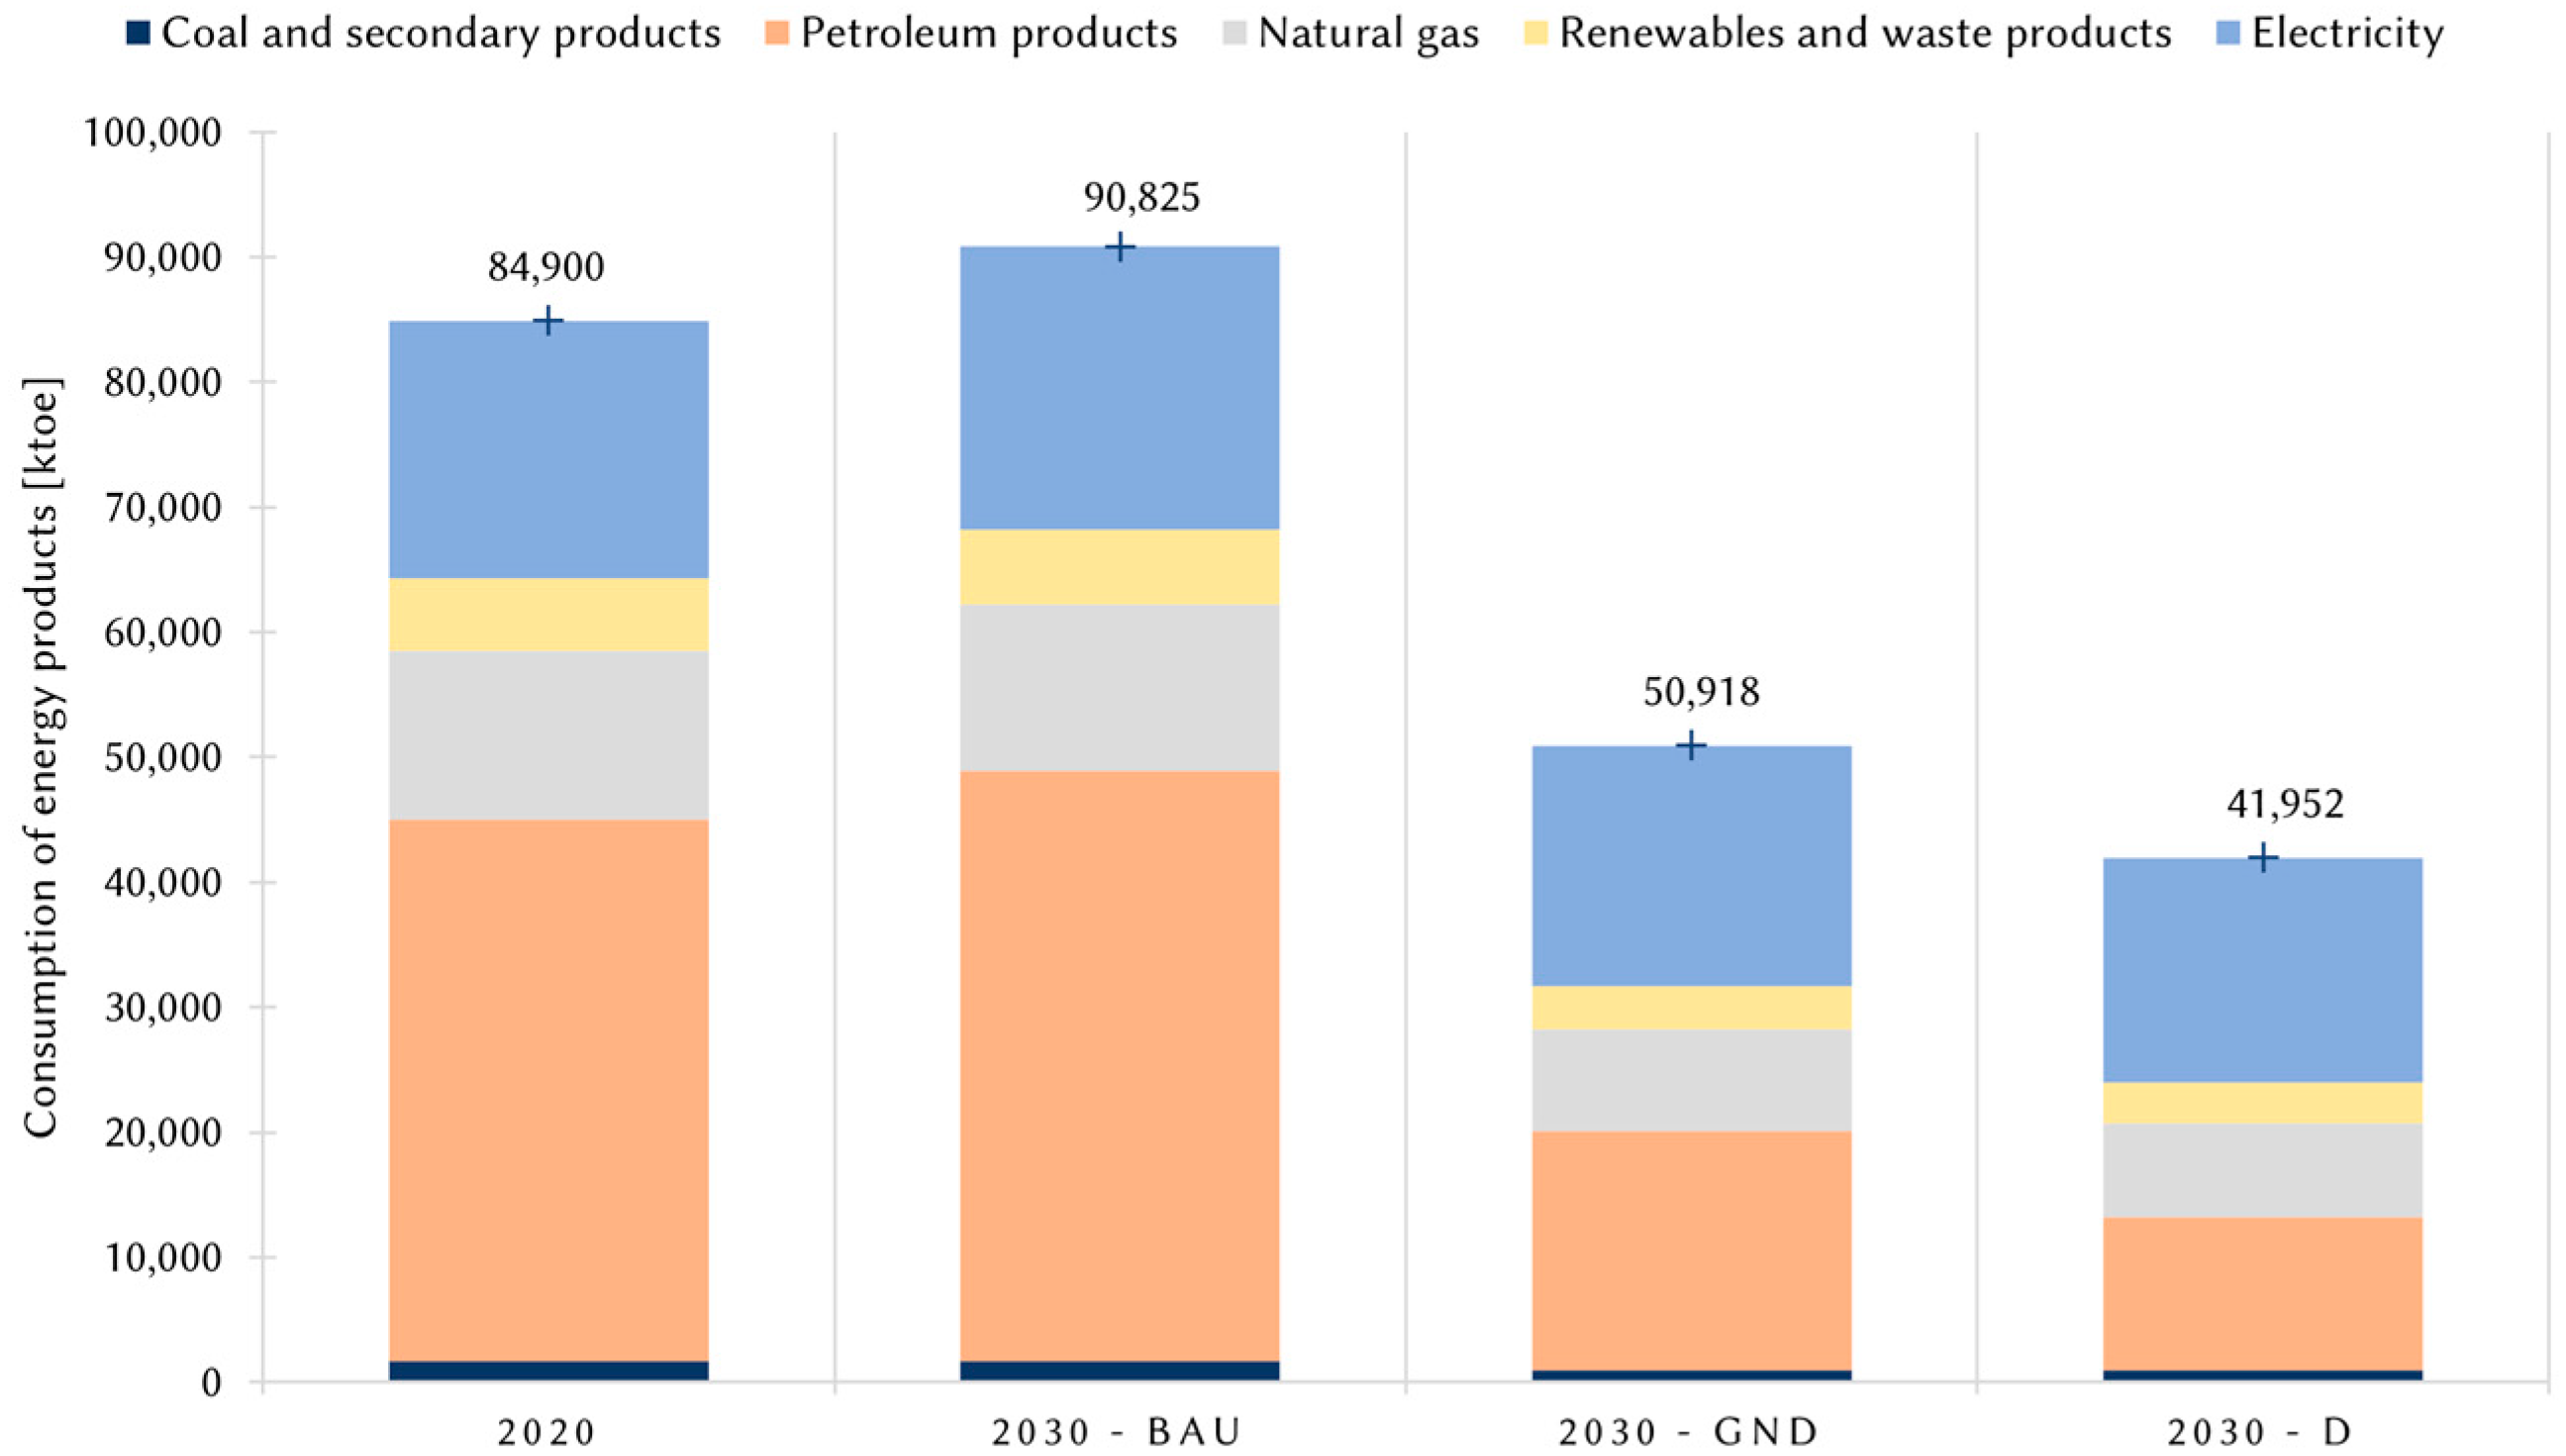
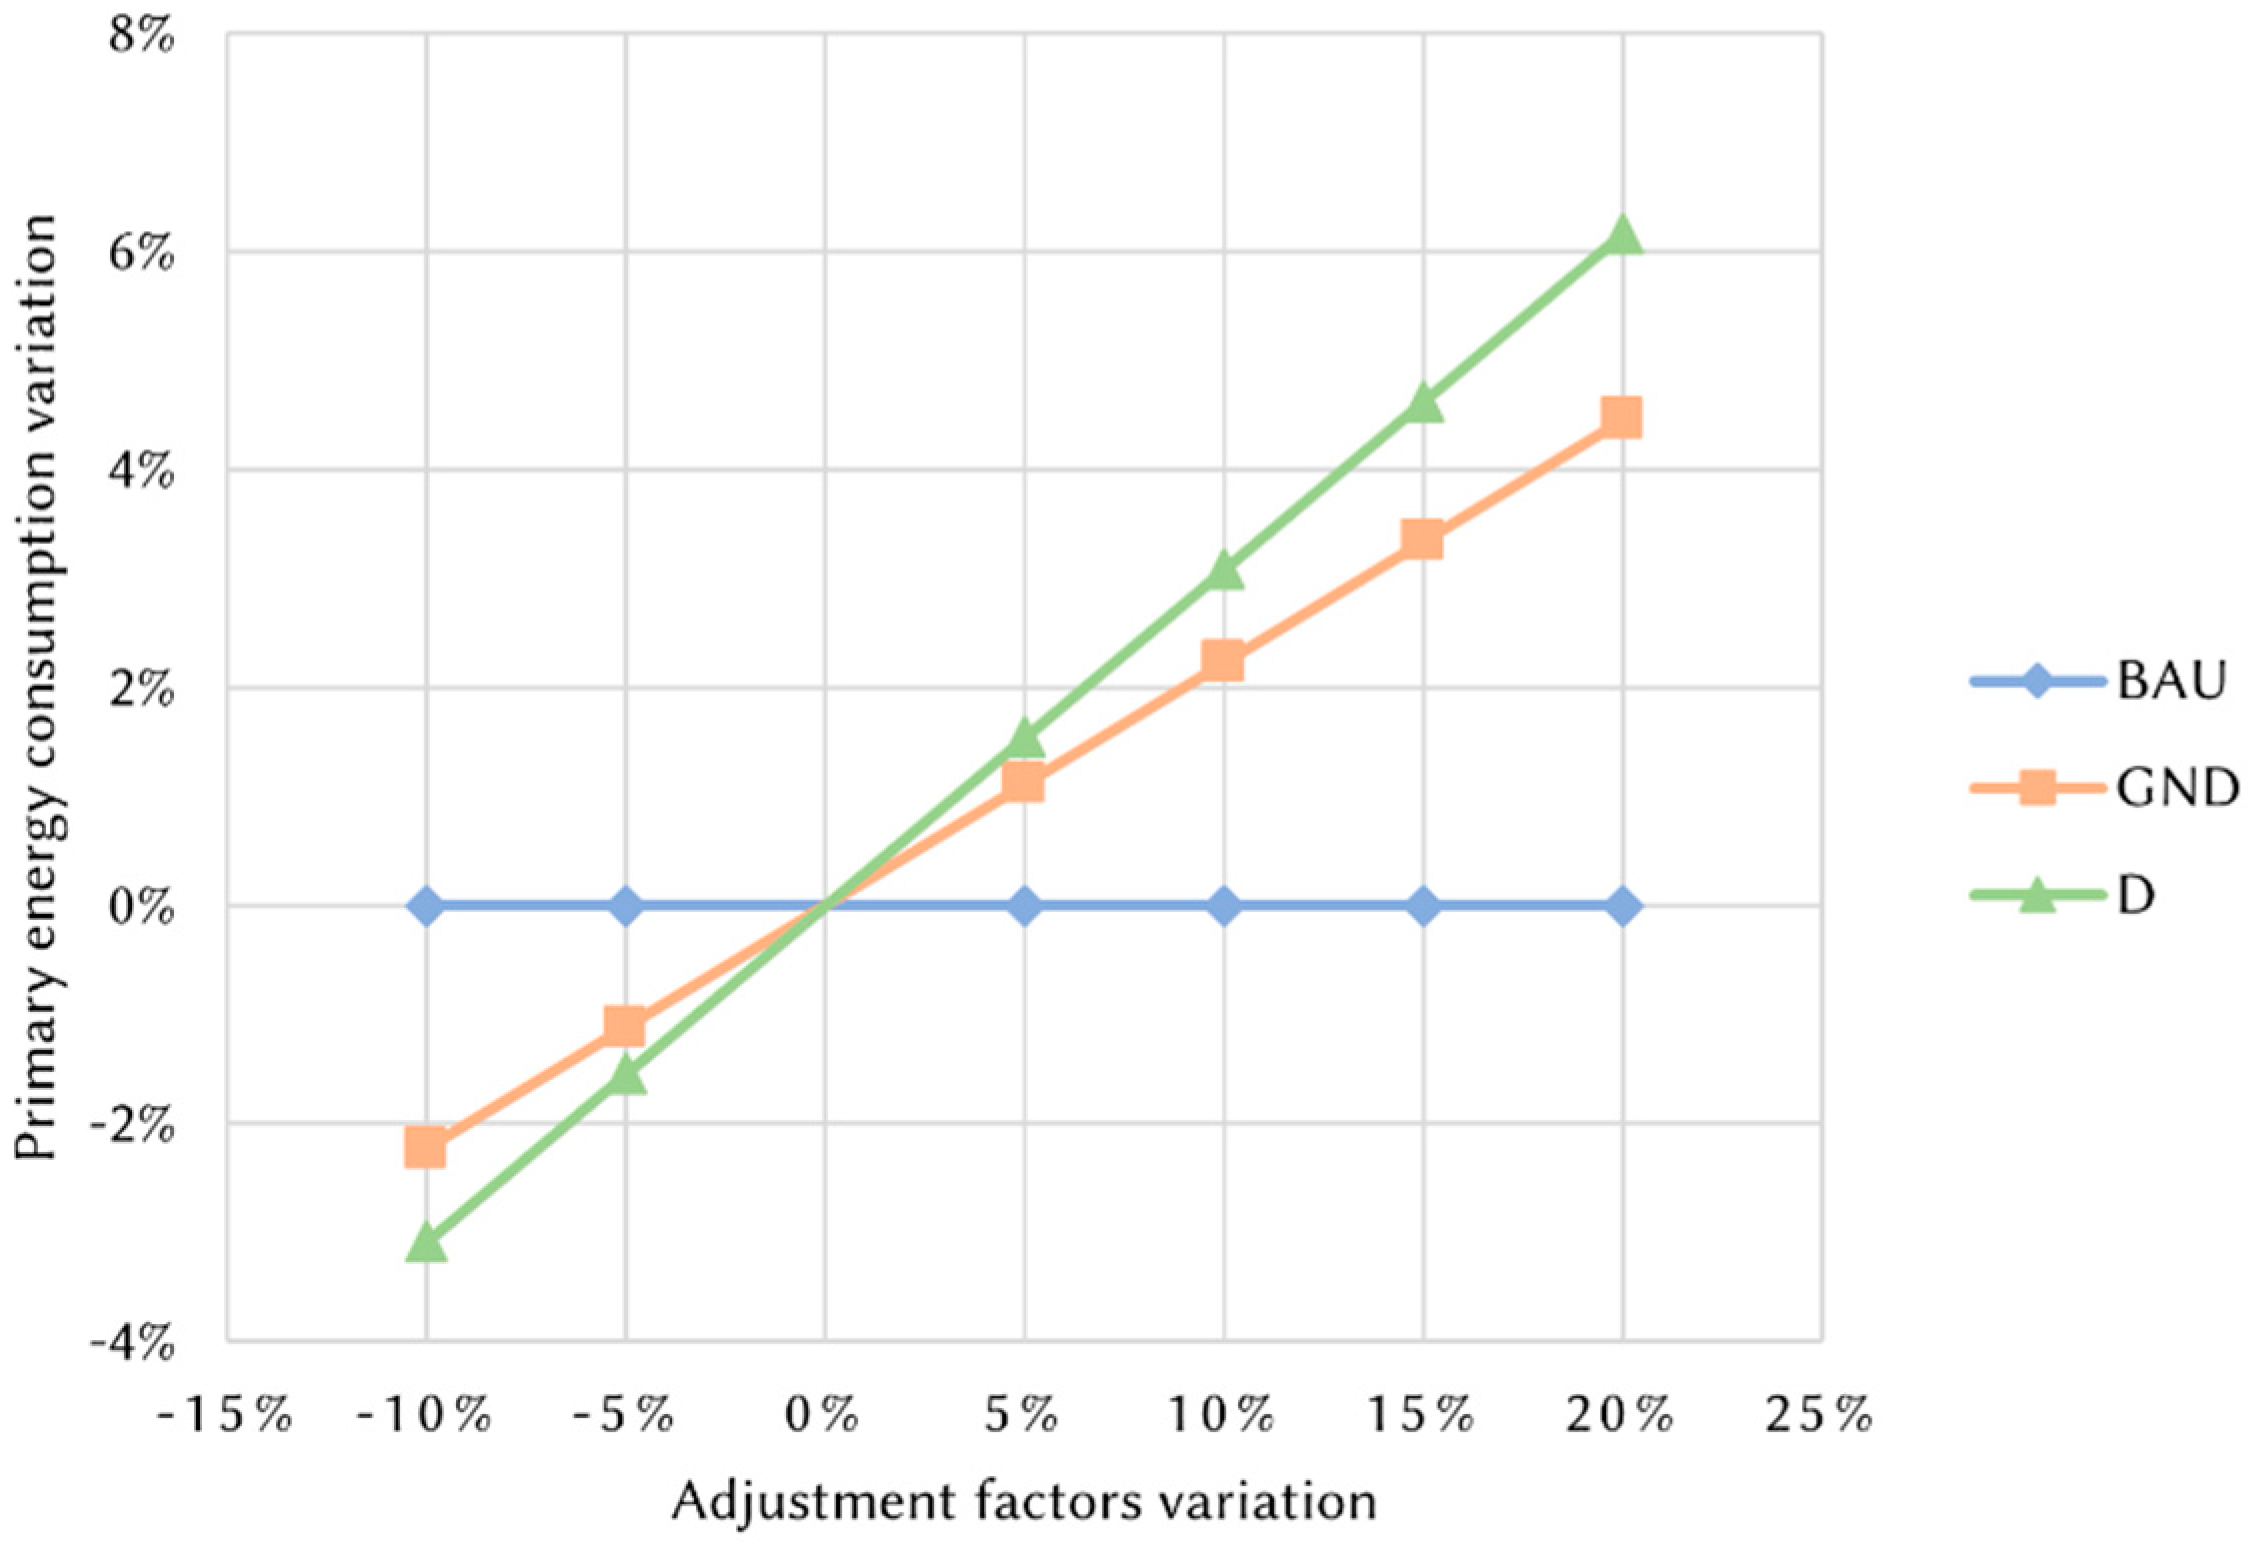
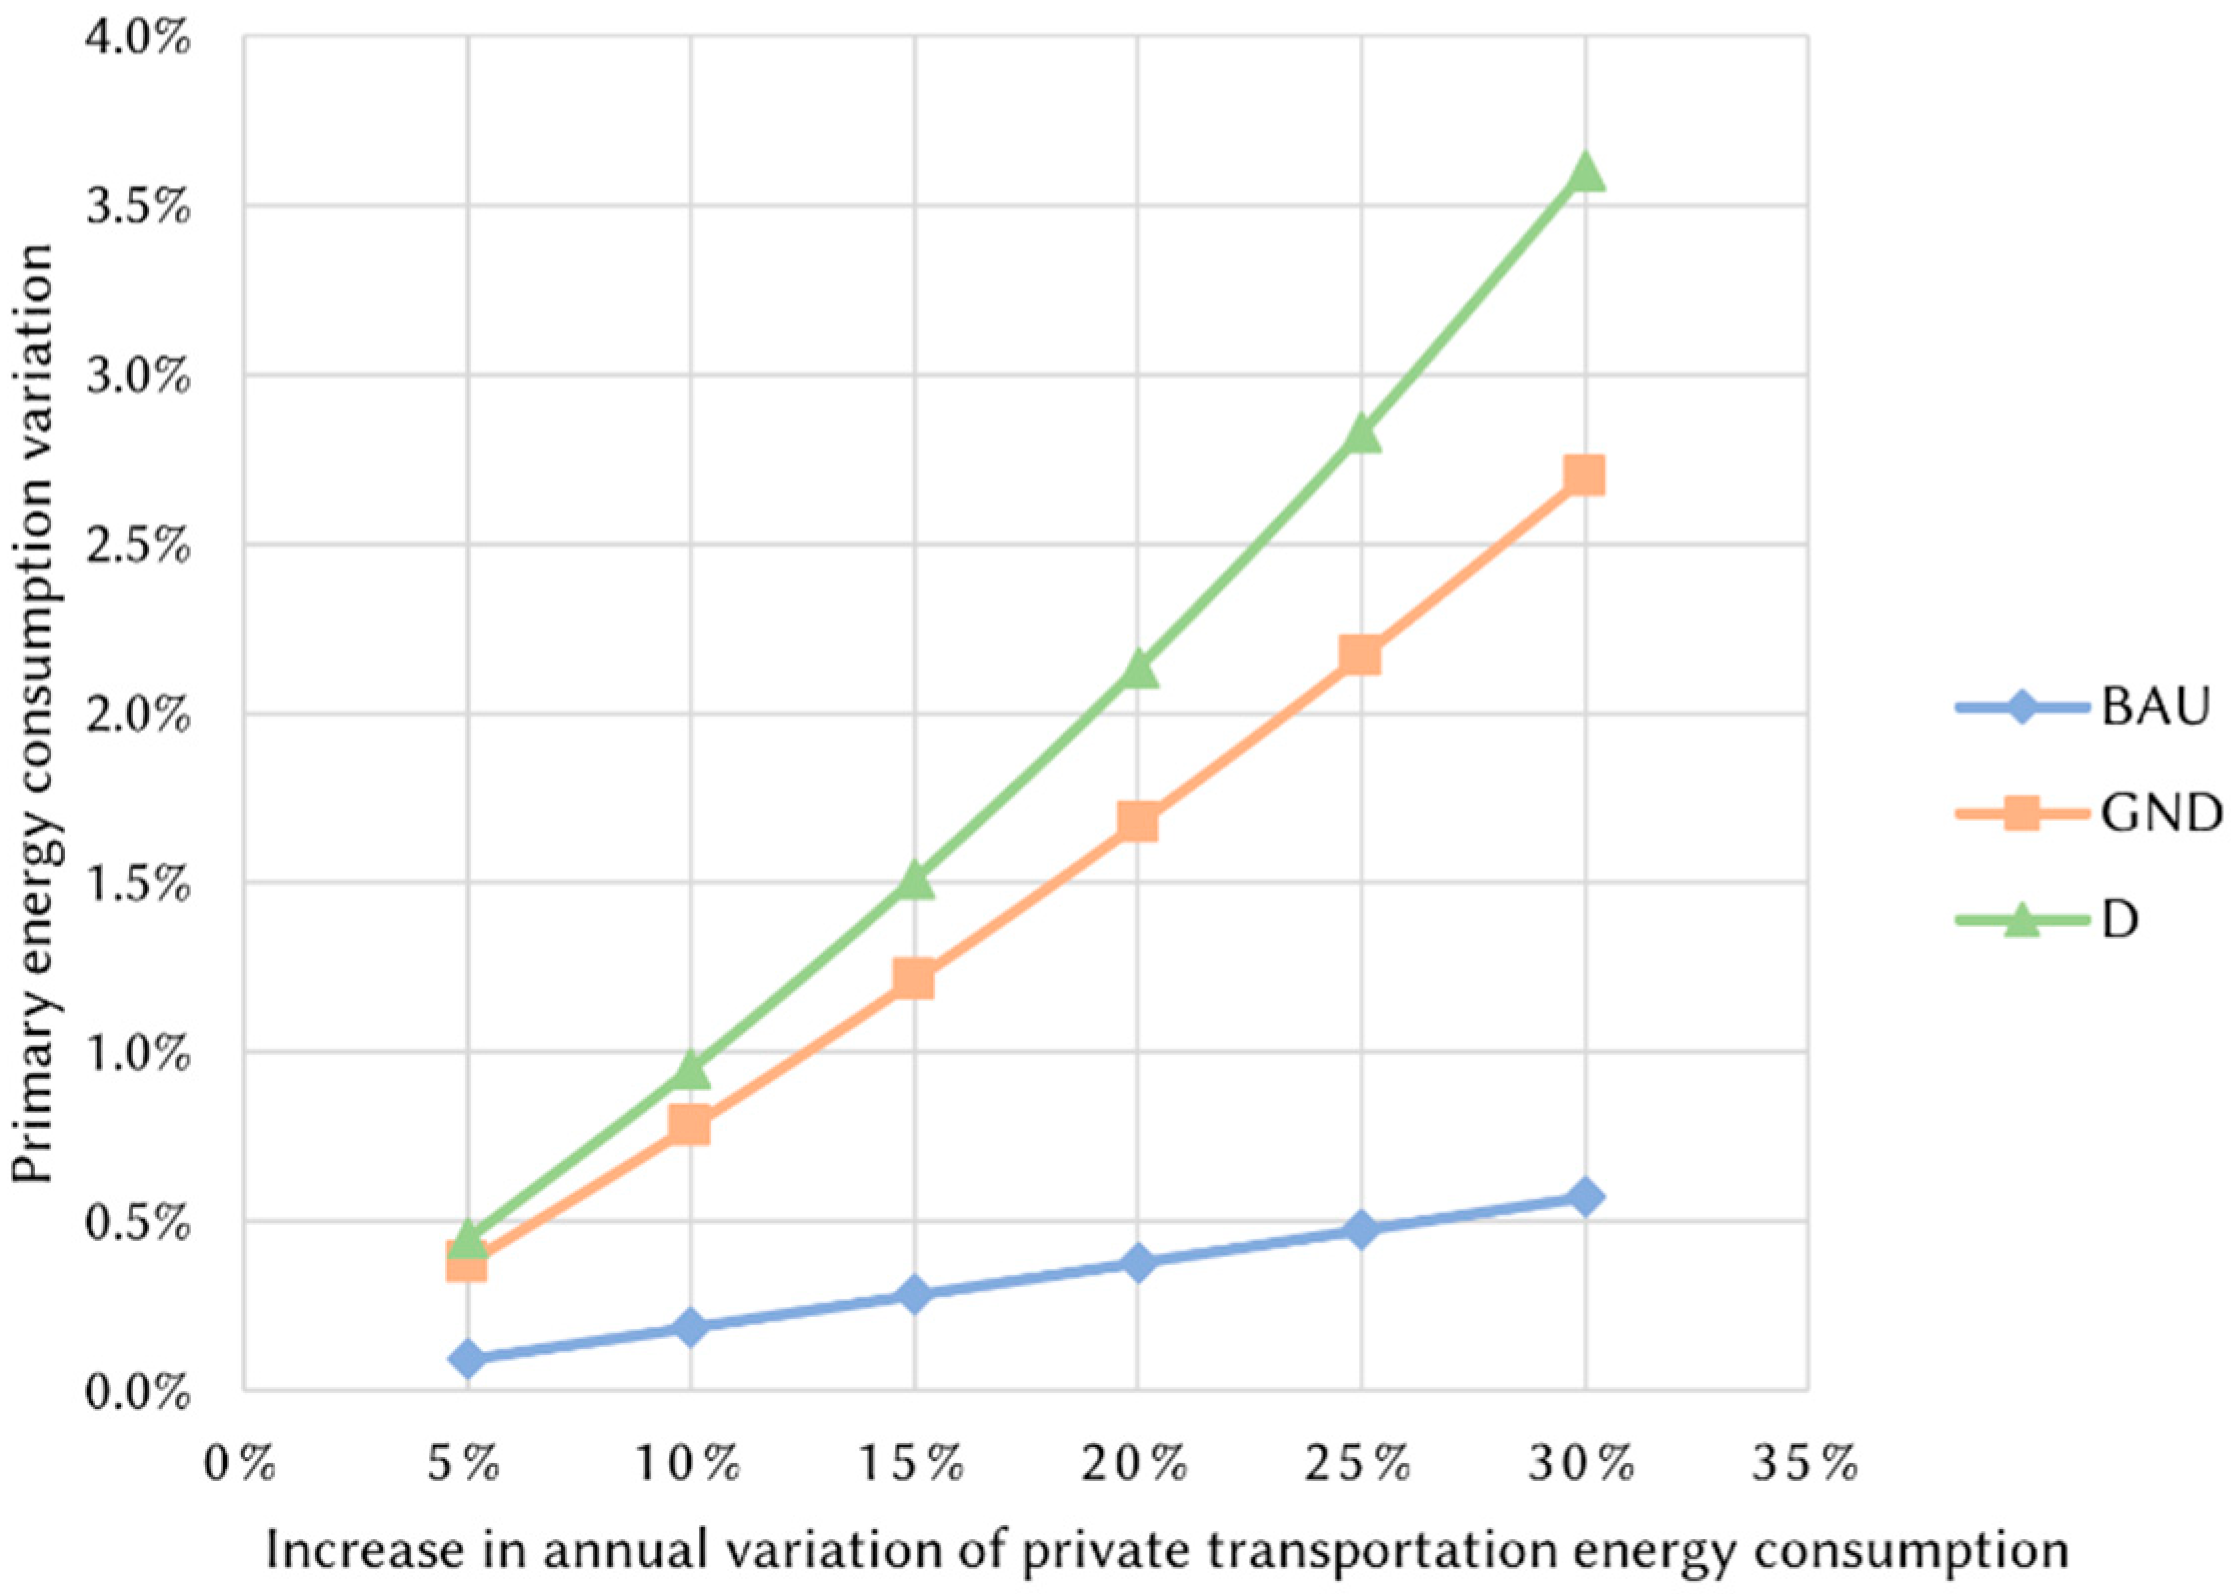
Publisher’s Note: MDPI stays neutral with regard to jurisdictional claims in published maps and institutional affiliations. |
© 2021 by the authors. Licensee MDPI, Basel, Switzerland. This article is an open access article distributed under the terms and conditions of the Creative Commons Attribution (CC BY) license (https://creativecommons.org/licenses/by/4.0/).