Abstract
Both developed and developing countries face energy poverty issues today. The growing interest over the last few years at the scientific level demonstrates the importance of the problem. It was a practice for many years to measure energy poverty by calculating the economic single indicators. In recent years, this practice was increasingly criticized and new, more comprehensive indices were developed. Review and analysis of indices developed can help scholars to dig deep into the specific aspects of the problem. The paper aims to review the indices for energy poverty assessment from households’ perspectives and to provide the main insights into the indicators selection process by providing the set of indicators for sustainable energy poverty assessment. The literature search and analysis follows the SALSA (Search, Appraisal, Synthesis and Analysis) and the PRISMA (Preferred Reporting Items for Systematic Reviews and Meta-Analyses) methodologies. The literature search was carried out in the Web of Science (WoS) Core Collection database. The search covered the period 1994–2020. Thirty-four developed indexes for energy poverty were identified for assessment. In order to measure the most important dimensions and to reflect the modern concept of the energy poverty, the paper proposes a set of indicators for sustainable energy poverty assessment.
1. Introduction
The problem of energy poverty affects both developed and developing countries. Although, there is no single and widely accepted concept of energy poverty. Depending on the development of the country, the concept varies. The comprehension about the problem in developing countries focuses on energy access, while in developed countries it is associated with a big share of the households’ income spent on energy [1]. A modern concept of energy poverty was proposed by the United Nations [2], which describes energy poverty as the inability to acquire a necessary amount of reliable and high-quality energy that is not only affordable, but also environmentally friendly and safe.
Energy efficient technologies and the high energy efficiency of buildings is a significant aspect in the fight against climate change [3]. There are many studies, which show the relationships between energy poverty and the state of the environment. According to Biernat-Jarka et al. [4], investments in renewable energy technologies have a positive impact on reducing energy poverty in Poland. The results of the research by Masron and Subramaniam [5] show that the development of renewable energy sources has a positive impact on the level of energy poverty among households and state of the environment in developing countries. The study by Zhao et al. [6] shows that energy poverty accelerates the growth of greenhouse gas (GHG) emissions in China. The connections between energy poverty and low carbon energy transition are provided in a study by Streimikiene at al. [7].
The complexity of the problem reflects in European Union (EU) regulations. One of the main priorities of the EU is the renovation of buildings. The Renovation Wave Strategy [8] seeks to double renovated buildings until 2030 and to reach a higher energy efficiency and significant reduction in GHG emissions in buildings. The Energy Performance of Buildings Directive (2018/844) aims that renovated and new buildings will become zero-energy buildings and that the main source of energy will be fulfilled by renewables [9]. Additionally, the problem reflects in other documents such as Europe 2020 Strategy [10] and the Energy 2020 Strategy [11].
The modern concept of energy poverty indicates connections between modern and affordable energy and its impact on the environment. However, for many years, only economic single indicators were selected as the key measures of the problem. As the most popular single indicators can be identified such as: a 10% indicator, Low Income High Cost (LIHC) indicator, an After Fuel Cost Poverty (AFCP) Indicator, a Minimum Income Standard (MIS) Indicator, Twice the National Median Indicators (2M) and three subjective EU Statistics on Income and Living Conditions (EU-SILC) indicators (Inability to keep the home warm (or cool), the building has leakages, arrears on utility bills) [12,13]. In recent years, this practice was increasingly criticized and new, more comprehensive indices were developed. In order to measure the most important dimensions and to reflect modern concept of the energy poverty, the set of indicators for the energy poverty assessment should reflect all the dimensions of sustainable development. Siksnelyte-Butkiene et al. [14] applied the Bellagio Sustainability Assessment and Measurement principles for the assessment of the composite indices for the energy poverty assessment. Lowans et al. [15] overviewed the metrics for the transport poverty evaluation. Pelz et al. [16] analyzed several frameworks for multidimensional energy poverty measurement for global level comparisons. Herrero [17] provided a critical review of the widely used composite indicators and identified key methodological and conceptual challenges. However, the studies dealing with the comprehensive review of indicators to measure energy poverty from a household perspective were not found in the literature.
This paper aims to review the indices for an energy poverty assessment from households’ perspectives and to provide the main insights into the indicators selection process by providing the set of indicators for sustainable energy poverty assessment. The literature search and analysis follows the SALSA (Search, Appraisal, Synthesis and Analysis) [18] and PRISMA (Preferred Reporting Items for Systematic Reviews and Meta-Analyses) [19] methodologies. The literature search was carried out in the Web of Science (WoS) Core Collection database. The search covered the period 1994–2020. Thirty-four developed indexes for energy poverty were identified for assessment. In order to measure the most important dimensions and to reflect the modern concept of the energy poverty, the paper proposes a set of indicators for sustainable energy poverty assessment.
Section 2 presents the methodology of the systematic literature review. The detailed analysis of the indices and composite indicators for the energy poverty assessment are presented in Section 3 of the paper. All the publications selected for further analysis are analyzed according to the selected categories. General and specific information was examined during the content analysis. All the studies and indices were grouped into three subcategories: energy access, energy poverty and poverty vulnerability. The set of indicators for a sustainable energy poverty assessment is presented in Section 4.
2. Methodology
In order to minimize a possible element of subjectivity [20] the literature search and analysis was performed on the basis of SALSA framework. The scientific literature distinguishes the SALSA methodology as one of the most suitable tools for the identification, evaluation and systematization of the literature, which ensures the methodological precision and completeness of the literature review [18]. Additionally, the PRISMA statement was followed in order to guarantee the completeness and consistency of the research process. The PRISMA statement was composed of four phases (identification, screening, eligibility and included documents) and twenty-seven checkpoints [19]. Mengista et al. [21,22] proposed a combined version of these two methodologies; the authors integrated PRISMA statement into the SALSA framework. The integrated approach consisted of six phases and was abbreviated as PSALSAR (Protocol-Search-Appraisal-Synthesis-Analysis-Report). The framework of systematic literature search and review for the analysis of indicators for energy poverty assessment is provided in Table 1:

Table 1.
Methodological framework.
The literature search was carried out in the Web of Science (WoS) Core Collection database with two combinations of topics: “indicators” and “energy poverty”; “indicators” and “fuel poverty”. The search covered the period 1994–2020. The publication was included for further analysis if it met the inclusion criteria. The inclusion criteria were as follows: combination of keywords were in title, keywords section or abstract of the paper; the assessment was oriented at the household level; paper was published in a scientific peer-reviewed journal, and the paper was published in economics or energy fuels WoS database category. Exclusion criteria were as follows: review articles, editorial letters, conference proceedings papers, papers that were not written in English, not primary research papers. Figure 1 presents flow of information of the literature review
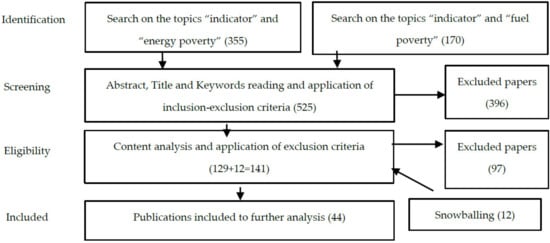
Figure 1.
Flow of information of the literature review on the PRISMA basis.
A total of forty-three publications after content analysis were selected, where different indices and methodologies for energy poverty assessment were proposed or applied. Some indices were applied in several different studies. The detailed analyses of the publications’ indices are presented based on their application area. Classification of reviewed publications is presented in Table 2:
Table 2.
Classification of reviewed publications.
3. Detailed Analysis of Indices for Energy Poverty Assessment
All the publications selected for further analysis were analyzed according to the selected categories. General and specific information were examined during the content analysis. The general information included: name of index, number of indicators, case study location, maturity of the country, and evaluation level. The specific information was as follows: the aim of the study and main contribution of the study, process of criteria selection, method of weighting, and supporting methods used. All the studies were grouped into three subcategories: energy access-oriented studies, energy poverty assessment studies and poverty vulnerability assessment studies. This ensured a more detailed analysis of the indices and the use of the data in future research.
During the systematic literature search, 34 developed indexes for energy poverty assessment were identified. The distribution of indexes in the subcategories selected are presented in Figure 2. The indexes in energy poverty and poverty vulnerability subcategories were designed for developed countries, while the indexes in the energy access category were suitable for energy poverty assessment of developing countries.
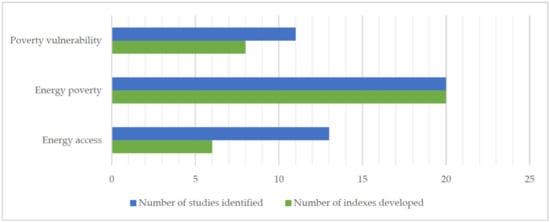
Figure 2.
The developed indexes in different subcategories.
3.1. Energy Access Subcategory
Energy poverty assessments in developing countries were based on indicators which reflect energy access issues. All the assessments in the energy access subcategory were in developing countries. The indicators were used for indices construction focus on energy access issues (Table 3).
Table 3.
Indices in energy access subcategory.
The most popular tool in the energy access category is the MEPI proposed by Nussbaumer et al. [37]. The basis of the proposed index is provided by the Oxford Poverty and Human Development Initiative [38,39]. The MEPI is one of the most well-known indexes and is widely used for the energy poverty assessment in developing countries. The index concentrates on the scarcity of access to modern energy services. In another study by Nussbaumer et al. [36], the MEPI was applied for a number of developing countries in the world. Santillan et al. [26] applied the MEPI for the assessment of energy poverty and the results comparison of seven countries of Latin America (Colombia, Mexico, Dominican Republic, Honduras, Haiti, Guatemala, Peru). Additionally, a correlation was found between HDI and the MEPI. Ahmed and Gasparatos [27] explored the connections between energy poverty and rural development in Ghana. For the energy poverty assessment, the authors used the MEPI index. In order to explore rural development strategies, a household survey was carried out; however, clear connections were not identified. In order to measure the extent and level of energy poverty in the Philippines provinces, Mendoza et al. [29] calculated the MEPI index. Additionally, the study aimed to find connections between the MEPI and the socioeconomic characteristics of households. It was found that income poverty was strongly related to energy poverty in the country. Olang et al. [32] applied the MEPI for the analysis of fuel choices for lighting and cooking in a city of Kenya (Kisumu). The authors sought to identify connections between the energy poverty of low-income households and fuel choice. Sadath and Acharya [35] calculated the MEPI for the analysis of the intensity and extent of energy poverty in India. The results showed that the problem is widespread in the country. Additionally, connections between energy poverty and the economic poverty of people were found. In order to measure energy poverty among low-income households in South Africa, Israel-Akinbo [33] calculated the MEPI. The study analyzed the differences between low-income households living in rural and urban areas. The largest instances of poverty were found among households, who lived in rural areas. Despite the geographical condition, mostly low-income households were deprived of heating fuel.
Additionally, several other indices were created. Seuret-Jimenez et al. [25] introduced a model for energy access assessment. The proposed tool used fuzzy logic and was applied for the ranking of 32 regions of Mexico. The authors created an index, which consisted of three expenditures (transport, electricity and fuel for cooking)-based indicators. Gupta et al. [28] created an index for energy poverty measurement in different states of India. The set of fifteen indicators were used for the index construction, mainly the indicators reflecting energy access. According to the results, two thirds of India’s population suffered from energy poverty. Pablo and Paloma [30] constructed an index for the measurement of energy poverty in Ecuador. The evaluation approach followed by the authors considered the economic conditions of households, energy expenses and the issue of hidden energy poverty. Khanna et al. [31] introduced an index, which measured affordability, accessibility and availability aspects for the micro-level energy poverty measurement in five countries in south and southeast Asian. The main solution to this problem was the development of renewable energy technologies, which allowed the consumption of affordable and sustainable energy. Tait [34] presented a framework, which allowed to the examination of the energy access level in the country. The proposed tool represented four aspects of energy access, these were: affordability of energy, fuel use, reliability and safety. The study showed an application of methodology for two low-income urban communities in the Republic of South Africa (Cape Town). According to the study, the methodology was developed for the South African context, but could easily be applied to the measurement of energy access in the other developing countries.
Six indices were identified during the systematic literature search for the energy poverty assessment in developing countries. All of these indices focused on the energy access problem. The selection of indicators and the determination of their weights was mostly based on literature sources or the opinion of the authors. The most popular index is MEPI, which was applied in more than half of studies selected for further analysis in the subcategory. Studies showed that there was a significant difference in energy poverty between people who lived in urban and suburban areas. A relationship between the overall poverty rate and energy poverty was also found. Therefore, problem-solving measures should to be applied at a regional or local level. The development of renewable energy generation technologies in households’ energy poverty levels could be one of the main solutions for decreasing energy poverty in developing countries.
3.2. Energy Poverty Subcategory
The largest number of studies focused on the energy poverty assessment subcategory and 20 indices were found (Table 4).
Table 4.
Indices in energy poverty subcategory.
Several indices were created by combining popular single indicators. Sokolowski et al. [40] created an index that included five single indicators widely used for energy poverty measurement. The author calculated three subjective indicators of EU-SILC, and two objective indicators (Higher Income Low Costs and High Actual Costs). Households were considered to suffer from energy poverty if at least two indicators indicated deprivation. The study showed an example of Poland, where, according to the results, 10% of the population suffered from energy poverty in 2017. Additionally, it was found that people who were living in old, unrenovated apartments and rural areas suffered from a higher risk of energy poverty. Additionally, people dependent on pensions were included in this category. Thus, the efficiency of buildings and the energy dependency of financially vulnerable people are challenges in the fight against energy poverty. In another study presented by Aguilar et al. [48], the authors used a similar methodology for the creation of compound indicators for energy poverty assessments in Spain and the Canary Islands. The indicator combined five well-known single indicators (10%, 2M, LIHC, AFCP and MIS). The authors emphasized the importance of regional or local level measurements, because this allowed for the purposeful design and implementation of energy policy initiatives. Primc and Slave-Erker [41] performed the fuzzy-set qualitative analysis for the identification of macro-level drivers of energy poverty in the EU countries. Three EU-SILC indicators were used for the index construction. The drivers analyzed in the study were: household income, energy prices and policy framework in the country. It was found that countries with a low energy poverty focused on energy and social policy. It was also concluded that countries facing a high energy poverty were in an energy poverty trap. According to the results, countries with the highest energy poverty focused on energy policy, but this focus was insufficient. Social policy played a key role in decreasing energy poverty, but it was very expensive to implement. Bouzarovski and Herrero [56] proposed an index, which was based on three EU-SILC indicators. The authors sought to provide a basis for the theoretical interpretations of questions related to the unequal development and material deprivation of energy transitions. It was found that the classic economic development distinction between the periphery and core also existed in the case of energy poverty. Maxim et al. [57] sought to present a compound indicator for the nationwide energy poverty evaluation. In essence, the improved index proposed by the authors only changed the weights of the indicators used in the study by Bouzarovski and Herrero [56]. Maxim et al. [57] included the index in an econometric model in order to determine factors that tended to put pressure on the problem.
Spiliotis et al. [42] introduced a tool for utility companies which identified energy poor clients. The proposed framework combined the well-known 10% indicator and socioeconomic characteristics of the clients. The study gave an example of the application of the framework for the identification of energy poor households in the region of Greece (Attica).
Betto et al. [43] introduced an indicator for the measurement of hidden energy poverty. The framework identified households who were unable to afford enough energy services and were restricting their energy consumption. The study emphasized the poverty situation in a country, the energy efficiency of buildings, the low consumption of energy and the sensitivity to the climate as the most important factors for hidden energy poverty.
Kelly et al. [44] developed a composite energy poverty risk indicator of home heating. The proposed index measured for a households’ general characteristics, building characteristics, and heating system characteristics. The study presented a case study of small-area clusters in Ireland.
Perez-Fargallo et al. [45] introduced an index which payed attention to the thermal comfort level. The presented methodology evaluated different regions of the country despite different climate conditions. The authors assessed energy poverty among households in the municipalities of Chile and identified the most vulnerable cities in the country.
Martin-Consuegra et al. [46] stressed the importance of thermal quality in buildings affected by energy poverty and vulnerability, especially in the poor neighborhoods. The authors proposed a methodology which was designed to analyze these deprived neighborhoods. The proposed index was applied for the case study of Madrid (Spain).
Okushima [47] presented an approach, which basically consisted of indicators measuring the usage of energy services in households. For the application of the model, a case study of Japan was provided and the prevalence of energy poverty throughout the regions of Japan was detected. The study highlighted the importance of the concept of determining the poverty line (threshold). The author brought up the question of not only the universally accepted thresholds, e.g., 10%, but also the application of the same threshold in a whole country, because regions often differed. In a previous study by Okushima [55], the author presented an energy poverty index, which included three characteristics: energy costs, income, and energy efficiency of housing. In his previous study, the author used a 10% threshold.
The study by Sanchez-Guevara et al. [49] was different from other research. The authors explored energy poverty from the angle of the environment as the main cause of energy poverty. Sanchez-Guevara et al. [49] analyzed the connections between the urban heat island effect and the characteristics of dwellings, and heat vulnerability due to socioeconomic characteristics of households (age and income) in order to identify areas where people may be affected by energy poverty in summer.
Charlier and Legendre [50] sought to create an index, which could help to optimize a policy. The authors analyzed the relationships between residential energy efficiency, monetary poverty and heating restriction. The proposed index was constructed of three indicators, which reflected the living standards, energy efficiency of dwellings and the potential restriction of heating. Additionally, the results were compared with three popular energy poverty indicators (10%, AFCP, LIHC). It was found that the value of the index created was quite similar compared with other measures of energy poverty. However, as mentioned earlier, the use of individual indicators became increasingly criticized in the scientific literature.
In order to compare the energy poverty in Germany and China, Bonatz et al. [51] developed an index, which reflected the access and affordability dimensions of the problem. It was found that energy-poor households existed in both countries: China faced the problem of affordability and the access of energy, while in Germany the problem was only energy affordability. The proposed index was a useful tool for a national energy poverty evaluation. The study stressed the importance of low carbon development for the increase in energy efficiency and the share of renewable energy, and the connections to the reduction in energy poverty.
Pysar et al. [52] introduced and applied an index for the examination of energy-poor households in Ukraine regions. The proposed index was based on two compound indicators (monetary poverty index and energy inefficiency indicator). Additionally, the results were compared with with AFC, 10% and LIHC indicators.
Papada and Kaliampakos [53] presented a stochastic model for energy poverty measurements. The presented methodology also proposed an energy poverty index, which was based on the required cost and was designed to the national energy poverty assessment. The authors applied the index for the case study of Greece. According to the results, energy poverty in Greece reached 70.4%. A sensitivity analysis was carried out to identify the determinants of the problem. It was found that income was the main factor affecting the extent of the problem.
Karasek and Pojar [54] designed an indicator, which measured socioeconomic household characteristics for the measurement of the energy poverty level in the country. The study addressed the situation of the Czech Republic and provided the main policy directions for the improvement. According to the results of the assessment, 16% of households in the country were energy-poor. The authors indicated the problem of inefficient housing in the country and the necessity of increasing the scope of the problem at the political level. Additionally, the authors highlighted the importance of the national monitoring indicators, which allowed to set the goals and to track the progress of the problem.
Fabbri [58] proposed an index for the evaluation of fuel poverty, which correlated to the energy efficiency of buildings. According to the authors, the building energy performance was the main cause of fuel poverty. The proposed index was applied for a case study of Italy. The authors proposed using this index for the identification of subjects that could afford to renovate buildings.
Wang et al. [59] created an index for the energy poverty assessment in the regions of China. The indicators for index construction could be grouped into four categories: availability of energy service, cleanliness of energy consumption; completeness of energy management; and energy affordability and efficiency. According to the results, regions differed in their level of energy poverty. It was determined that energy poverty had no clear links to the level of economic development in the region and this problem also existed in the well economically developed regions of China. Additionally, the authors proposed policy implications for the alleviation of the problem. According to the authors, clean energy generation technologies, increasing energy efficiency, the generation of renewable energy at household level, an increase in investments on energy infrastructure and energy management were the main solutions to decrease energy poverty.
Twenty indices were assigned to the energy poverty assessment subcategory. All the created indexes were applied for the case studies in developed countries, except one, which was performed for the energy poverty assessment in Chile. The indicators selection and their weighting processes were mostly based on previous studies or the opinion of the authors. It should be noted that, in the energy poverty subcategory, only one study by Bonatz et al. [51] involved experts in the indicators evaluation process. During the group discussions the weights of indicators were assigned. However, the number of experts was not indicated. Instead, it was indicated that the experts were from the various areas of the topic analyzed. It was quite popular to integrate single indicators for index construction. Additionally, it was popular to compare the results of the evaluation with well-known and widely used single indicators. The studies in this subcategory emphasized the importance of energy efficiency in buildings; therefore, it was common to analyze the types and conditions of the dwellings. Additionally, there was a focus on the characteristics of households.
3.3. Poverty Vulnerability Subcategory
During the systematic literature search, eight indices for the poverty vulnerability assessment were found (Table 5). As with the energy poverty subcategory, all the indexes developed were applied for the measurement of developed countries, except one, which was performed for the energy poverty assessment in Chile.
Table 5.
Indices in poverty vulnerability subcategory.
Castano-Rosa et al. [60] presented an index for the measurement of energy vulnerability according to the energy, thermal comfort, financial stability, and health and quality of life factors. The proposed index identified households, who were in fuel poverty or had a potential risk of poverty. The proposed index payed attention not only to the economical aspects, but also to the social aspects of households and technical characteristics of the dwelling. The study by Castano-Rosa et al. [61] applied the same index for the measurement of vulnerability to fuel poverty in the local-scale of England. The results were compared with a well-known 10% indicator and the LIHC indicator. The comparative analysis revealed the limitations of the 10% and the LIHC indicators and showed that they could provide misleading results. The study results showed the connections between the household type and size and household vulnerability to fuel poverty. Mostly, the biggest challenges to reduce fuel poverty faced large households. Another study by Castano-Rosa et al. [62] provided a validation of the of the index. The authors carried out a households’ survey for the validation of the proposed method and compared the results. The survey was conducted in a local-scale study in Salford (United Kingdom).
Gouveia et al. [63] presented an index for the energy poverty vulnerability measurement. The proposed vulnerability measure considered socioeconomic households’ characteristics, the state of buildings, and energy performance indicators. The index was constructed of seven indicators (two of them were related to the age characteristics of the households) and covered not only the economic dimensions but also the social and the environmental dimensions somewhat. The experts were involved in assigning the indicator weights. The proposed index was applied to the case study of Portugal.
Recalde et al. [64] presented an index for energy poverty vulnerability measurement in the EU member states (list of EU members for 2013). The study aimed to explore connections between the index created and the winter mortality in different countries. Additionally, the authors compared the results of the energy poverty vulnerability and EU-SILC indicator (affordability of keeping the home heated). According to the analysis performed, the most vulnerable EU member states were located in southern and eastern Europe. Additionally, the connections between vulnerability and winter mortality were proven. It was necessary to emphasize that the index considered the significant factors of energy poverty across the EU and the data of indicators were available to the public, so that the results between all member states could be assessed and compared. Additionally, the assessment can be repeated in the future in order to track the progress.
The study by Mattioli et al. [66] presented an evaluation model for the identification of fuel vulnerability at the household level. The authors calculated four single indicators (LIHC, Low Income Low Costs, Higher Income Low Costs, Higher Income High Costs). The econometric analysis was performed in order to identify the relationship between the indicators selected and socioeconomic characteristics of households. It was found that 9% of households in the United Kingdom suffered from disproportionate transport expenses. Transport expenses were stressed across various types of household and social groups. In another study by Mattioli et al. [65], the authors evaluated the vulnerability to increases in fuel prices. The evaluation model measured such indicators as: income, accessibility and cost burden of a vehicle. The model was applied for the case study of regions in England (United Kingdom). It was proved, that vulnerability to increases in fuel prices was higher in suburban areas. Additionally, the results showed that the fuel efficiency of the vehicle was not the main contributing factor to vulnerability.
Llera-Sastresa et al. [70] presented an index evaluation of energy vulnerability in households. The index was oriented to assess households who were part of social housing. The indicators for the index construction could be grouped into four key categories as follows: the dwelling characteristics, performance of the energy installations, cost of energy, and habits and characteristics of households. The case study of social houses in Spain (Zaragoza city) was presented in the study. Additionally, the problem of energy vulnerability in social housing was analyzed by Perez-Fargallo et al. [69]. The study presented an index measurement for energy vulnerability in social housing and applied it to the analysis of housing allocation in social dwellings in a micro-scale assessment of Chile. The proposed index focused on the thermal comfort level, urban context and characteristics of building; the ability to pay utility bills and energy use were also considered. In the study by Pino-Mejias et al. [67], the authors calculated the same index, which was presented in the previous study and sought to examine two different statistical and predictive models. For the prediction of the probability of low-income households affected by energy poverty, multiple linear l regression and artificial neural networks were applied.
Marz [68] presented an index, which measured three energy vulnerability aspects: socio-economic, heating and building efficiency vulnerability. The proposed index was applied for the case study of Germany. The framework of the assessment was based on the multi-criteria technique (AHP) and GIS. This study was distinguished from the others and did not measure such indicators as income or energy expenditure. The presented approach did not evaluate the number of households in fuel poverty but measured the poverty vulnerability of the selected area.
Although eleven studies were included in this category, some of them used the same indices. A total of eight different poverty vulnerability assessment indices were identified. Half of the studies involved experts for the selection (or evaluation) of the criteria and (or) the determination of their weights. Involving experts in the indicators selection and evaluation process provided an opportunity to examine the problem from different perspectives. Additionally, it gave a solid logical and methodological background for the selection and weights of indicators. It should be noted that poverty vulnerability indices payed attention to the comfort level of households. However, there were no significant differences between energy poverty and the poverty vulnerability studies and indices developed.
4. The Set of Indicators for Sustainable Energy Poverty Assessment
A lot of studies used composite indicators for the creation of indices. The most commonly used were well-known single indicators, especially 10%, LIHC, AFC and three EU-SILC indicators. All the identified indicators could be categorized into several groups:
- income indicators;
- expenditure indicators;
- energy price indicators;
- energy consumption indicators;
- households’ characteristics indicators (age, social class, ownership);
- dwelling characteristics indicators (type, efficiency);
- comfort indicators;
- access to the energy indicators.
The assignment of the indicators used in the studies to each category was conditional. In order to identify general trends, indicators were assigned to the three sustainability dimensions (economic, social and environmental) according to the context of the study. Figure 3 shows the distribution of the indicators according to the sustainability dimensions in different subcategories.
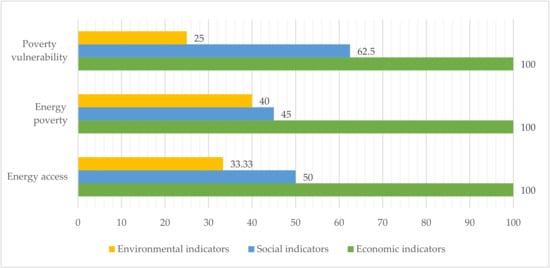
Figure 3.
The distribution of indicators in different subcategories, %.
The main focus on the construction of energy poverty indexes was seen for the indicators which reflected the economical factors of energy poverty. Almost half of the studies included indicators that could be attributed to the social dimension of the assessment. What is distinctive and surprising is that, environmental factors were taken into account in only one third of the studies (mostly energy efficiency of building). Even macro-scale research tended to focus on the economic determinants of energy poverty, while environmental indicators, such as energy efficiency, renewable energy production, and import independence, etc., were factors that fundamentally addressed the problem of energy poverty. Additionally, the priority objectives of different national policies focused on environmental aspects, so their inclusion in the construction of energy poverty indices was particularly important.
A modern concept of energy poverty was proposed by the United Nations [2], which described energy poverty as the inability to acquire the necessary amount of reliable and high-quality energy which is not only affordable, but also environmentally friendly and safe. In order to measure the most important dimensions and to reflect the modern concept of the problem, the set of indicators for a sustainable energy poverty assessment are proposed in Table 6.
Table 6.
The set of indicators for sustainable energy poverty assessment (households’ perspective).
By their nature, economic aspects such as the high level of energy consumption, high energy expenditures, low income of a household and high energy prices, can be the main aspects of the problem of energy poverty. These indicators were used for the calculation of popular and widely used single indicators for energy poverty assessment for many years (10%, LIHC, AFC, 2M, etc.). Their popularity and wide application proves the importance of these indicators, but such a strictly economic approach is increasingly criticized at the scientific level [71,72,73,74]. The necessity to include indicators that reflect other dimensions is a new approach which is becoming more and more popular.
The socio-economic and demographic characteristics of a household can evaluate the risk of a descent into energy poverty. The research shows that people, who are over 65, single people, or households with three or more children have a higher risk of facing this problem. The indicator shows whether households can afford to heat or cool their homes enough or whether they are forced to save energy. The indicator of indoor and outdoor pollution can reflect not only the social dimensions, but also the environmental dimensions too. However, the use of fossil fuels and old technologies for home and water heating are harmful, not only for the environment as a whole, but also for people’s health [75].
The characteristics of a building, such as age, year of renovation and the technologies used for heating, cooling, and hot water preparation can be used to measure the problem of energy efficiency. The determination of these characteristics is very important in order to reduce this problem. The policy of building renovation and the policy of energy requirements for new buildings have a significant impact on reducing energy poverty. Various policy actions can be the drivers to use more efficient technologies and to change people’s consumption habits [76,77,78]. These actions can be expressed through price policy, revenue policy or requirements for energy efficiency [79]. The accessibility of renewable energy sources is one of the most important indicators in measuring energy poverty, and directly relates to this problem (Selcuk et al., 2019). It is necessary to highlight, that the development of renewable energy at a household level ensures not only energy security [80,81], but also a better quality of life for people in such areas, as renewable energy can improve air quality [82]. Additionally, the development of sustainable technologies helps to seek energy justice [83] and provides long-term results [84]. The relationships between renewable energy and the issues of energy poverty are widely discussed in the literature. Different studies justify that renewable technologies can reduce energy costs in combination with traditional energy sources [85,86] or by replacing fuel-based technologies with renewable-based ones [4,5,87,88]. Additionally, renewable energy has a huge potential for the electrification of off-grid zones and in improving energy access and reducing energy poverty in developing countries [89,90,91]. However, the implementation of low-carbon technologies requires carefully considered political action.
It is necessary to highlight, that the selection of the appropriate methods and determination of indicator weights are the other main steps in the evaluation process. One of the most suitable ways to determine the weights of indicators is with help of experts. The calculation and inclusion of the results of the expert survey in the evaluation process should be based on scientific methods. The determination of the threshold of energy poverty can also be supported by experts.
5. Conclusions
The modern concept of energy poverty indicates connections between modern and affordable energy and its impact on the environment. However, for many years, only economic single indicators were selected as the key measures of the problem. In recent years, this practice was criticized and new, more comprehensive indices were developed.
After the systematic literature search and content analysis according to the SALSA and PRISMA methodologies, 43 publications were selected, where different indices and methodologies for energy poverty assessments were proposed or applied. In order to ensure a more detailed analysis, all the studies were grouped into three subcategories: energy access-oriented studies, energy poverty assessment studies and poverty vulnerability assessment studies. Thirty-four indexes for the assessment of energy poverty in developing (six indices) and developed (twenty-eight indices) countries were found.
Energy poverty assessments in developing countries were based on indicators which reflected energy access issues. The selection of the indicators and the determination of their weights were mostly based on literature sources or the opinion of the authors. The most popular index was the MEPI, which was applied in more than half of studies selected for further analysis in the subcategory. Twenty indices were assigned to the energy poverty assessment subcategory. It was quite common to integrate single indicators (10%, LIHC, AFC, etc.) for index construction or to compare the results of the evaluation with them. The studies in this subcategory emphasized the importance of energy efficiency in buildings; therefore, it was popular to analyze the types and conditions of houses. Additionally, there was a focus on the characteristics of households. Eight indices were assigned to the poverty vulnerability assessment subcategory. Half of the studies involved experts for the criteria selection (or evaluation) and (or) the determination of their weights. It should be noted that poverty vulnerability indices pay attention to the comfort level of households. However, there were no significant differences between energy poverty and poverty vulnerability indices.
Energy poverty is a multidimensional problem, which is caused by a number of different factors, related not only with economical, but also with social and environmental aspects. The analysis of the indicators showed that most scholars evaluated four groups of indicators: energy price, income, energy demand and energy efficiency of the building. However, according to the latest concept of energy poverty, this set of indicators should be more sustainability-oriented. The proposed set of indicators for a sustainable energy poverty assessment can measure the most important dimensions and reflect the modern concept of the problem.
The current study has some limitations. Although the set of indicators for the sustainable energy poverty assessment from the perspective of households was provided, the importance of each indicator was not determined. Additionally, the study did not provide a methodology for the energy poverty calculation. Therefore, further research is necessary in the field. Further research could consider the methodology for the sustainable energy poverty assessment, including the determination of the criteria weights and suitable methods selection. Additionally, the assessment of the indicators in terms of their suitability for socio-economic practice can be explored in future studies.
Funding
This research received no external funding.
Institutional Review Board Statement
Not applicable.
Informed Consent Statement
Not applicable.
Acknowledgments
The author is thankful for the reviewers’ comments and suggestions.
Conflicts of Interest
The author declares no conflict of interest.
Abbreviations
| 2M | Twice the National Median Indicators |
| AFC | After Fuel Cost |
| AHP | Analytic Hierarchy Process |
| EU | European Union |
| EU-SILC | EU Statistics on Income and Living Conditions |
| GHG | greenhouse gas |
| GIS | Geographical Information System |
| HDI | Human Development Index |
| LIHC | Low Income High Cost |
| MEPI | Multidimensional Energy Poverty Index |
| MIS | Minimum Income Standard |
| PICOC | Population, Intervention, Comparison, Outcome, and Context |
| PRISMA | Preferred Reporting Items for Systematic Reviews and Meta-Analyses |
| PSALSAR | Protocol-Search-Appraisal-Synthesis-Analysis-Report |
| SALSA | Search, Appraisal, Synthesis and Analysis |
| WoS | Web of Science |
References
- Primc, K.; Dominko, M.; Slabe-Erker, R. 30 years of energy and fuel poverty research: A retrospective analysis and future trends. J. Clean. Prod. 2021, 301, 127003. [Google Scholar] [CrossRef]
- United Nations Development Programme. World Energy Assessment Energy and the Challenge of Sustainability, 1st ed.; UNDP: New York, NY, USA, 2000; p. 44. [Google Scholar]
- Santamouris, M. Innovating to zero the building sector in Europe: Minimising the energy consumption, eradication of the energy poverty and mitigating the local climate change. Sol. Energy 2016, 128, 61–94. [Google Scholar] [CrossRef]
- Biernat-Jarka, A.; Trebska, P.; Jarka, S. The Role of Renewable Energy Sources in Alleviating Energy Poverty in Households in Poland. Energies 2021, 14, 2957. [Google Scholar] [CrossRef]
- Masron, T.A.; Subramaniam, Y. Renewable energy and poverty–environment nexus in developing countries. GeoJournal 2021, 86, 303–315. [Google Scholar] [CrossRef]
- Zhao, J.; Jiang, Q.Z.; Dong, X.C.; Dong, K.Y. Assessing energy poverty and its effect on CO2 emissions: The case of China. Energy Econ. 2021, 97, 105191. [Google Scholar] [CrossRef]
- Streimikiene, D.; Kyriakopoulos, G.; Lekavicius, V.; Siksnelyte-Butkiene, I. Energy Poverty and Low Carbon Just Energy Transition: Comparative Study in Lithuania and Greece. Soc. Indic. Res. 2021, 1–53. [Google Scholar]
- European Commission. A Renovation Wave for Europe-Greening Our Buildings, Creating Jobs, Improving Lives. Communication from the Commission to the European Parliament, the Council, the European Economic and Social Committee and the Committee of the Region: Brussels, Belgium, p. 27. 2020. Available online: https://eur-lex.europa.eu/resource.html?uri=cellar:0638aa1d-0f02-11eb-bc07-01aa75ed71a1.0003.02/DOC_1&format=PDF (accessed on 10 July 2021).
- EU Commission and Parliament. Directive 2018/844 of the European Parliament and the Council of the 30 May 2018 Amending Directive 2010/31/EU on the Energy Performance of Buildings and Directive 2012/27/EU on Energy Efficiency. O. J. Eur. Union 2018, 156, 75–91. [Google Scholar]
- European Commission. Communication from the Commission. Europe 2020. A European Strategy for Smart, Sustainable and Inclusive Growth: Brussels, Belgium, p. 35. 2020. Available online: https://eur-lex.europa.eu/legal-content/EN/TXT/PDF/?uri=CELEX:52010DC2020&from=EN (accessed on 10 July 2021).
- European Commission. Energy 2020. A Strategy for Competitive, Sustainable and Secure Energy: Brussels, Belgium, p. 21. 2010. Available online: https://eur-lex.europa.eu/LexUriServ/LexUriServ.do?uri=COM:2010:0639:FIN:En:PDF (accessed on 10 July 2021).
- Castano-Rosa, R.; Solis-Guzman, J.; Rubio-Bellido, C.; Marrero, M. Towards a multiple-indicator approach to energy poverty in the European Union: A review. Energy Build. 2019, 193, 36–48. [Google Scholar] [CrossRef]
- European Commission. European Union Statistics on Income and Living Conditions (EU-SILC). Eurostat, Brussels. 2014. Available online: https://ec.europa.eu/eurostat/web/income-and-living-conditions/data/database (accessed on 10 July 2021).
- Siksnelyte-Butkiene, I.; Streimikiene, D.; Lekavicius, V.; Balezentis, T. Energy poverty indicators: A systematic literature review and comprehensive analysis of integrity. Sustain. Cities Soc. 2021, 67, 102756. [Google Scholar] [CrossRef]
- Lowans, C.; Del Rio, D.F.; Sovacool, B.K.; Rooney, D.; Foley, A.M. What is the state of the art in energy and transport poverty metrics? A critical and comprehensive review. Energy Econ. 2021, 101, 105360. [Google Scholar] [CrossRef]
- Pelz, S.; Pachauri, S.; Groh, S. A critical review of modern approaches for multidimensional energy poverty measurement. Wiley Interdiscip. Rev. Energy Environ. 2018, 7, e304. [Google Scholar] [CrossRef] [Green Version]
- Herrero, S.T. Energy poverty indicators: A critical review of methods. Indoor Built Environ. 2017, 26, 1018–1031. [Google Scholar] [CrossRef]
- Grant, M.J.; Booth, A. A typology of reviews: An analysis of 14 review types and associated methodologies. Health Info. Libr. J. 2009, 26, 91–108. [Google Scholar] [CrossRef]
- Moher, D.; Liberati, A.; Tetzlaff, J.; Altman, D.G. Preferred reporting items for systematic reviews and meta-analyses: The PRISMA statement. Int. J. Surg. 2010, 8, 336–341. [Google Scholar] [CrossRef] [Green Version]
- Amo, I.F.; Erkoyuncu, J.A.; Roy, R.; Palmarini, R.; Onoufriou, D. A systematic review of Augmented Reality content-related techniques for knowledge transfer in maintenance applications. Comput. Ind. 2018, 103, 47–71. [Google Scholar]
- Mengista, W.; Soromessab, T.; Legeseb, G. Method for conducting systematic literature review and meta-analysis for environmental science research. MethodsX 2020, 7, 100777. [Google Scholar] [CrossRef]
- Mengista, W.; Soromessab, T.; Legeseb, G. Ecosystem services research in mountainous regions: A systematic literature review on current knowledge and research gaps. Sci. Total Environ. 2020, 702, 134581. [Google Scholar] [CrossRef]
- Booth, A.; Sutton, A.; Papaioannou, D. Systematic Approaches to a Successful Literature Review; Sage Publications Ltd.: Thousand Oaks, CA, USA, 2016; p. 336. ISBN 1473952808. [Google Scholar]
- Malinauskaite, L.; Cook, D.; Daviosdottir, B.; Ogmundardottir, H.; Roman, J. Ecosystem services in the Arctic: A thematic review. Ecosyst. Serv. 2019, 36, 100898. [Google Scholar] [CrossRef]
- Seuret-Jimenez, D.; Robles-Bonilla, T.; Cedano, K.G. Measurement of Energy Access Using Fuzzy Logic. Energies 2020, 13, 3266. [Google Scholar] [CrossRef]
- Santillan, O.S.; Cedano, K.G.; Martinez, M. Analysis of Energy Poverty in 7 Latin American Countries Using Multidimensional Energy Poverty Index. Energies 2020, 13, 1608. [Google Scholar] [CrossRef] [Green Version]
- Ahmed, A.; Gasparatos, A. Multi-dimensional energy poverty patterns around industrial crop projects in Ghana: Enhancing the energy poverty alleviation potential of rural development strategies. Energy Policy 2020, 137, 111123. [Google Scholar] [CrossRef]
- Gupta, S.; Gupta, E.; Sarangi, G.K. Household Energy Poverty Index for India: An analysis of inter-state differences. Energy Policy 2020, 144, 111592. [Google Scholar] [CrossRef]
- Mendoza, C.B.; Cayonte, D.D.D.; Leabres, M.S.; Manaligod, L.R.A. Understanding multidimensional energy poverty in the Philippines. Energy Policy 2019, 133, 110886. [Google Scholar] [CrossRef]
- Pablo, Q.S.; Paloma, T.D.; Francisco, J.T. Energy Poverty in Ecuador. Sustainability 2019, 11, 6320. [Google Scholar] [CrossRef] [Green Version]
- Khanna, R.A.; Li, Y.; Mhaisalkar, S.; Kumar, M.; Liang, L.J. Comprehensive energy poverty index: Measuring energy poverty and identifying micro-level solutions in South and Southeast Asia. Energy Policy 2019, 132, 379–391. [Google Scholar] [CrossRef]
- Olang, T.A.; Esteban, M.; Gasparatos, A. Lighting and cooking fuel choices of households in Kisumu City, Kenya: A multidimensional energy poverty perspective. Energy Sustain. Dev. 2018, 42, 1–13. [Google Scholar] [CrossRef]
- Israel-Akinbo, S.O.; Snowball, J.; Fraser, G. An Investigation of Multidimensional Energy Poverty Among South African Low-Income Households. S. Afr. J. Econ. 2018, 86, 468–487. [Google Scholar] [CrossRef]
- Tait, L. Towards a multidimensional framework for measuring household energy access: Application to South Africa. Energy Sustain. Dev. 2017, 38, 1–9. [Google Scholar] [CrossRef]
- Sadath, A.C.; Acharya, R.H. Assessing the extent and intensity of energy poverty using Multidimensional Energy Poverty Index: Empirical evidence from households in India. Energy Policy 2017, 102, 540–548. [Google Scholar] [CrossRef]
- Nussbaumer, P.; Nerini, F.F.; Onyeji, I.; Howells, M. Global Insights Based on the Multidimensional Energy Poverty Index (MEPI). Sustainability 2013, 5, 2060–2076. [Google Scholar] [CrossRef] [Green Version]
- Nussbaumer, P.; Bazilian, M.; Modi, V. Measuring energy poverty: Focusing on what matters. Renew. Sustain. Energy Rev. 2012, 16, 231–243. [Google Scholar] [CrossRef] [Green Version]
- Alkire, S.; Santos, M.E. Acute Multidimensional Poverty: A New Index for Developing Countries; OPHI Working Paper 38, Oxford Poverty and Human Development Initiative; University of Oxford: Oxford, UK, 2010; 139p. [Google Scholar]
- Alkire, S.; Foster, J. Counting and multidimensional poverty measurement. J. Public Econ. 2011, 95, 476–487. [Google Scholar] [CrossRef] [Green Version]
- Sokolowski, J.; Lewandowski, P.; Kielczewska, A.; Bouzarovski, S. A multidimensional index to measure energy poverty: The Polish case. Energy Sources Part B-Econ. Plan. Policy 2020, 15, 92–112. [Google Scholar] [CrossRef]
- Primc, K.; Slabe-Erker, R. Social policy or energy policy? Time to reconsider energy poverty policies. Energy Sustain. Dev. 2020, 55, 32–36. [Google Scholar] [CrossRef]
- Spiliotis, E.; Arsenopoulos, A.; Kanellou, E.; Psarras, J.; Kontogiorgos, P. A multi-sourced data based framework for assisting utilities identify energy poor households: A case-study in Greece. Energy Sources Part B-Econ. Plan. Policy 2020, 15, 49–71. [Google Scholar] [CrossRef]
- Betto, F.; Garengo, P.; Lorenzoni, A. A new measure of Italian hidden energy poverty. Energy Policy 2020, 138, 111237. [Google Scholar] [CrossRef]
- Kelly, J.A.; Clinch, J.P.; Kelleher, L.; Shahab, S. Enabling a just transition: A composite indicator for assessing home-heating energy-poverty risk and the impact of environmental policy measures. Energy Policy 2020, 146, 111791. [Google Scholar] [CrossRef]
- Perez-Fargallo, A.; Bienvenido-Huertas, D.; Rubio-Bellido, C.; Trebilcock, M. Energy poverty risk mapping methodology considering the user’s thermal adaptability: The case of Chile. Energy Sustain. Dev. 2020, 58, 63–77. [Google Scholar] [CrossRef]
- Martin-Consuegra, F.; Gimenez, J.M.G.; Alonso, C.; Hernandez, R.C.; Aja, A.H.; Oteiza, I. Multidimensional index of fuel poverty in deprived neighbourhoods. Case study of Madrid. Energy Build. 2020, 224, 110205. [Google Scholar] [CrossRef]
- Okushima, S. Understanding regional energy poverty in Japan: A direct measurement approach. Energy Build. 2019, 193, 174–184. [Google Scholar] [CrossRef]
- Aguilar, J.M.; Ramos-Real, F.J.; Ramirez-Diaz, A.J. Improving Indicators for Comparing Energy Poverty in the Canary Islands and Spain. Energies 2019, 12, 2135. [Google Scholar] [CrossRef] [Green Version]
- Sanchez-Guevara, C.; Peiro, M.N.; Taylor, J.; Mavrogianni, A.; Gonzalez, J.N. Assessing population vulnerability towards summer energy poverty: Case studies of Madrid and London. Energy Build. 2019, 190, 132–143. [Google Scholar] [CrossRef] [Green Version]
- Charlier, D.; Legendre, B. A Multidimensional Approach to Measuring Fuel Poverty. Energy J. 2019, 40, 27–53. [Google Scholar] [CrossRef]
- Bonatz, N.; Guo, R.; Wu, W.; Liu, L. A comparative study of the interlinkages between energy poverty and low carbon development in China and Germany by developing an energy poverty index. Energy Build. 2019, 183, 817–831. [Google Scholar] [CrossRef]
- Pysar, N.; Dergacheva, V.; Bandura, A.; Pasztorova, J. Composite fuel poverty index as a means to assess energy security of the country. Econ. Ann. XXI 2018, 169, 50–56. [Google Scholar] [CrossRef] [Green Version]
- Papada, L.; Kaliampakos, D. A Stochastic Model for energy poverty analysis. Energy Policy 2018, 116, 153–164. [Google Scholar] [CrossRef]
- Karasek, J.; Pojar, J. Programme to reduce energy poverty in the Czech Republic. Energy Policy 2018, 115, 131–137. [Google Scholar] [CrossRef]
- Okushima, S. Gauging energy poverty: A multidimensional approach. Energy 2017, 137, 1159–1166. [Google Scholar] [CrossRef] [Green Version]
- Bouzarovski, S.; Herrero, S.T. Geographies of injustice: The socio-spatial determinants of EP in Poland, the Czech Republic and Hungary. POST-Communist Econ. 2017, 29, 27–50. [Google Scholar] [CrossRef] [Green Version]
- Maxim, A.; Mihai, C.; Apostoaie, C.M.; Popescu, C.; Istrate, C.; Bostan, I. Implications and Measurement of Energy Poverty across the European Union. Sustainability 2016, 8, 483. [Google Scholar] [CrossRef] [Green Version]
- Fabbri, K. Building and fuel poverty, an index to measure fuel poverty: An Italian case study. Energy 2015, 89, 244–258. [Google Scholar] [CrossRef]
- Wang, K.; Wang, Y.X.; Li, K.; Wei, Y.M. Energy poverty in China: An index based comprehensive evaluation. Renew. Sustain. Energy Rev. 2015, 47, 308–323. [Google Scholar] [CrossRef]
- Castano-Rosa, R.; Solís-Guzman, J.; Marrero, M. A novel index of vulnerable homes: Findings from application in Spain. Indoor Built Environ. 2020, 29, 311–330. [Google Scholar] [CrossRef]
- Castano-Rosa, R.; Sherriff, G.; Thomson, H.; Guzman, J.S.; Marrero, M. Transferring the index of vulnerable homes: Application at the local-scale in England to assess fuel poverty vulnerability. Energy Build. 2019, 203, 109458. [Google Scholar] [CrossRef]
- Castano-Rosa, R.; Sherriff, G.; Solis-Guzman, J.; Marrero, M. The validity of the index of vulnerable homes: Evidence from consumers vulnerable to energy poverty in the UK. Energy Sources Part B-Econ. Plan. Policy 2020, 15, 72–91. [Google Scholar] [CrossRef]
- Gouveia, J.P.; Palma, P.; Simoes, S.G. Energy poverty vulnerability index: A multidimensional tool to identify hotspots for local action. Energy Rep. 2019, 5, 187–201. [Google Scholar] [CrossRef]
- Recalde, M.; Peralta, A.; Oliveras, L.; Tirado-Herrero, S.; Borrell, C.; Palencia, L.; Gotsens, M.; Artazcoz, L.; Mari-Dell’Olmo, M. Structural energy poverty vulnerability and excess winter mortality in the European Union: Exploring the association between structural determinants and health. Energy Policy 2019, 133, 110869. [Google Scholar] [CrossRef]
- Mattioli, G.; Philips, I.; Anable, J.; Chatterton, T. Vulnerability to motor fuel price increases: Socio-spatial patterns in England. J. Transp. Geogr. 2019, 78, 98–114. [Google Scholar] [CrossRef]
- Mattioli, G.; Wadud, Z.; Lucas, K. Vulnerability to fuel price increases in the UK: A household level analysis. Transp. Res. Part A-Policy Pract. 2018, 113, 227–242. [Google Scholar] [CrossRef]
- Pino-Mejias, R.; Perez-Fargallo, A.; Rubio-Bellido, C.; Pulido-Arcas, J.A. Artificial neural networks and linear regression prediction models for social housing allocation: Fuel Poverty Potential Risk Index. Energy 2018, 164, 627–641. [Google Scholar] [CrossRef]
- Marz, S. Assessing the fuel poverty vulnerability of urban neighbourhoods using a spatial multi-criteria decision analysis for the German city of Oberhausen. Renew. Sustain. Energy Rev. 2018, 82, 1701–1711. [Google Scholar] [CrossRef] [Green Version]
- Perez-Fargallo, A.; Rubio-Bellido, C.; Pulido-Arcas, J.A.; Trebilcock, M. Development policy in social housing allocation: Fuel poverty potential risk index. Indoor Built Environ. 2017, 26, 980–998. [Google Scholar] [CrossRef]
- Llera-Sastresa, E.; Scarpellini, S.; Rivera-Torres, P.; Aranda, J.; Zabalza-Bribian, I.; Aranda-Uson, A. Energy Vulnerability Composite Index in Social Housing, from a Household Energy Poverty Perspective. Sustainability 2017, 9, 691. [Google Scholar] [CrossRef] [Green Version]
- Fizaine, F.; Kahouli, S. On the power of indicators: How the choice of fuel poverty indicator affects the identification of the target population. Appl. Econ. 2019, 51, 1081–1110. [Google Scholar] [CrossRef]
- Legendre, B.; Ricci, O. Measuring fuel poverty in France: Which households are the most fuel vulnerable? Energy Econ. 2015, 49, 620–628. [Google Scholar] [CrossRef] [Green Version]
- Heindl, P.; Schuessler, R. Dynamic properties of energy affordability measures. Energy Policy 2015, 86, 123–132. [Google Scholar] [CrossRef] [Green Version]
- Bouzarovski, S. EP in the European Union: Landscapes of vulnerability. Wiley Interdiscip. Rev. Energy Environ. 2014, 3, 276–289. [Google Scholar] [CrossRef]
- Su, C.; Madani, H.; Palm, B. Heating Solutions for Residential Buildings in China: Current Status and Future Outlook. Energy Convers. Manag. 2018, 177, 493–510. [Google Scholar] [CrossRef]
- Rodriguez-Alvarez, A.; Orea, L.; Jamasb, T. Fuel poverty and Well-Being: A consumer theory and stochastic frontier approach. Energy Policy 2019, 131, 22–32. [Google Scholar] [CrossRef] [Green Version]
- Kyprianou, I.; Serghides, D.K.; Varo, A.; Gouveia, J.P.; Kopeva, D.; Murauskaite, L. EP policies and measures in 5 EU countries: A comparative study. Energy Build. 2019, 196, 46–60. [Google Scholar] [CrossRef]
- Zhang, T.; Shi, X.P.; Zhang, D.Y.; Xiao, J.J. Socio-economic development and electricity access in developing economies: A long-run model averaging approach. Energy Policy 2019, 132, 223–231. [Google Scholar] [CrossRef]
- Mattioli, G.; Lucas, K.; Marsden, G. Transport poverty and fuel poverty in the UK: From analogy to comparison. Transp. Policy 2017, 59, 93–105. [Google Scholar] [CrossRef]
- Sovacool, B.K.; Mukherjee, I. Conceptualizing and measuring energy security: A synthesized approach. Energy 2011, 36, 5343–5355. [Google Scholar] [CrossRef]
- Sovacool, B.K. Evaluating energy security in the Asia pacific: Towards a more comprehensive approach. Energy Policy 2011, 39, 7472–7479. [Google Scholar] [CrossRef]
- Yadoo, A.; Cruickshank, H. The role for low carbon electrification technologies in poverty reduction and climate change strategies: A focus on renewable energy mini-grids with case studies in Nepal, Peru and Kenya. Energy Policy 2012, 42, 591–602. [Google Scholar] [CrossRef]
- Chapman, A.J.; McLellan, B.C.; Tezuka, T. Prioritizing mitigation efforts considering co-benefits, equity and energy justice: Fossil fuel to renewable energy transition pathways. Appl. Energy 2018, 219, 187–198. [Google Scholar] [CrossRef]
- Terrapon-Pfaff, J.; Dienst, C.; Konig, J.; Ortiz, W. How effective are small-scale energy interventions in developing countries? Results from a post-evaluation on project-level. Appl. Energy 2015, 135, 809–814. [Google Scholar] [CrossRef] [Green Version]
- Rzetelska, D.; Combrinck, M. Fuel poverty and low carbon emissions: A comparative study of the feasibility of the hybrid renewable energy systems incorporating combined heat and power technology. Front. Energy 2021. [Google Scholar] [CrossRef]
- Akinyele, D.; Olatomiwa, L.; Ighravwe, D.E.; Babatunde, M.O.; Monyei, C.; Aikhuele, D. Optimal planning and electricity sharing strategy of hybrid energy system for remote communities in Nigeria. Sci. Afr. 2020, 10, e00589. [Google Scholar] [CrossRef]
- Adom, P.K.; Amuakwa-Mensah, F.; Agradi, M.P.; Nsabimana, A. Energy poverty, development outcomes, and transition to green energy. Renew. Energy 2021, 178, 1337–1352. [Google Scholar] [CrossRef]
- Pagliaro, M.; Meneguzzo, F. Distributed Generation from Renewable Energy Sources: Ending Energy Poverty across the World. Energy Technol. 2020, 8, 2000126. [Google Scholar] [CrossRef]
- Wirawan, H.; Gultom, Y.M.L. The effects of renewable energy-based village grid electrification on poverty reduction in remote areas: The case of Indonesia star. Energy Sustain. Dev. 2021, 62, 186–194. [Google Scholar] [CrossRef]
- Kizilcec, V.; Parikh, P.; Bisaga, I. Examining the Journey of a Pay-as-You-Go Solar Home System Customer: A Case Study of Rwanda. Energies 2021, 14, 330. [Google Scholar] [CrossRef]
- Carr-Wilson, S.; Pai, S. Pay-As-You-Go: How a Business Model Is Helping Light Millions of Rural Kenyan Homes with Solar. Case Stud. Environ. 2018, 2. [Google Scholar] [CrossRef]
Publisher’s Note: MDPI stays neutral with regard to jurisdictional claims in published maps and institutional affiliations. |
© 2021 by the author. Licensee MDPI, Basel, Switzerland. This article is an open access article distributed under the terms and conditions of the Creative Commons Attribution (CC BY) license (https://creativecommons.org/licenses/by/4.0/).