Abstract
The paper studies the optimum panel horizontal orientation angle toward the Sun and the optimum time interval of the panel’s movement. The optimum time intervals or panel movement can change the rate of input energy to the panel surface in Iran. For this purpose, a neural network has been trained to estimate the intensity of solar radiation in Iran. After model validation, the intensity of solar radiation has been estimated by selecting adequate geographical regions. Based on the intensity of sunlight, Iran has been divided into ten regions. In these regions, 40 cities have been randomly selected to study the effect of the panel’s angle variations within appropriate time intervals, as well as equal time intervals. The results show that the choice of the mounting system with the possibility of five angles’ implementation can increase the amount of solar energy between 3.9% and 7.4%. Compared to this number of angles at the equal time intervals, the amount of incoming solar energy has increased by 3% to 7%. In the first and second cases, the area of the power plant increases by about 12% to 24% compared to the yearly optimum tilt angle. Moreover, the amount of radiation incoming to the panel with the optimum operating angle is in alignment with the results of PVsyst software.
1. Introduction
Renewable energy resources meet about 40% of the increase in primary demand, and their explosive growth in the power sector marks the end of the coal pinnacle. The rapid deployment of solar photovoltaic (PV), led by China and India, is helping solar to become the largest source of low-carbon generation capacity by 2040 [1]. The annual global market for solar PV was up slightly to exceed 100 GW (direct current) for the first time, with a year-end (2019) total of 505.5 GW. Finally, at least 32 countries, representing every region, had a cumulative capacity of 1 Gigawatt or more. Solar PV played a significant and growing role in electricity generation in several countries, including Honduras (12.1%), Italy, and Greece (both about 8.2%), and by late 2018, one in five Australian households generated a quota of their electricity with solar energy [2]. Global concentrating solar thermal power (CSP) capacity increased by 11% to roughly 5.5 GW in 2018. An estimated 550 MW came online, representing the most significant gain since 2014. At the end of 2018, around 2 Gigawatts of new plants were under construction in 10 countries, with most of this capacity being built in the United Arab Emirates (0.7 GW) and China (over 0.5 GW). All but three out of the twenty-three plants under construction have planned to include thermal energy storage (TES). Operational TES capacity has reached almost 17 gigawatt-hours by the end of 2018 [2]. The conversion of solar energy into electricity is a viable response to address most of the world’s energy problems. Among the parameters affecting the performance of both photovoltaic (PV) cells and concentrating solar power (CSP) systems, orientation and tilt angle could be brought under the spotlight. Solar trackers (ST) are ideal devices for efficiency improvement [3]. In the solar system, optimum performance can be achievable by considering the environmental and geographical parameters in PV system design [4]. The performance improvement obtained from the use of trackers in a PV system cannot be separated from the higher requirement of land due to the overlapping shadows between the panels. Thus, the optimum distance between trackers is able to navigate most solar energy researchers toward making a tradeoff between productivity and land-use changes during PV lifetime [5].
The existing methods of solar radiation estimation can be summarized into four general categories: metering at meteorological stations, the use of physical and computational models (experimental and semi-experimental), satellite measurements, and the use of neural network models. In neural network predictive models, a variety of meteorological parameters such as air temperature, sunshine, and relative humidity are easily combined for solar radiation calculation [6].
The ground measurements of solar radiation are commonly used to produce continuous maps as input for internal detection models. Due to the high diversity of interpolation methods and the current significant differences in the results, it is important to choose a proper interpolation method. The reverse distance weighting methods, normal Kriging, and general co-Kriging are the most common methods for the natural phenomena extension [7]. The study of six synoptic stations showed that some experimental techniques for the estimation of solar radiation intensity showed that a better performance is obtained through using Richardson’s model in the studied stations [8]. Moreover, based on the station’s statistics and using ANN methods, the amount of solar radiation intensity was predicted. The results showed that the neural network could predict the radiation in this area [9]. On the other hand, the results of many types of research studies in other regions of the world have shown that the ANN method has outperformed the experimental models. In Saudi Arabia, for example, six ANN-based models were evaluated to estimate solar radiation. Different combinations of input variables were used, and the results showed that the accuracy of the model depends on the duration of radiation and air temperature [10]. In India, the model was used to model the ANN method based on multilayer perceptron (MLP) solar radiation intensity, and the best model with a MAPE statistical index was reported to be 89.6%. Comparison between ANN-based methods and linear regression for the estimation of the solar radiation intensity in countries such as Argentina [11], Morocco [12], and Malaysia [13] has shown the superiority of ANN method performance in these countries.
Ant system method optimization and Fuzzy model are the ways to optimize the maximum power point tracking (MPPT). Using a controller is an effective tool to enhance the MPPT [14]. In the Alentejo region (southern Portugal), the optimum tilt angle for soiled PV systems is calculated based on irradiance instead of using solely an optimum tilt angle. An economic analysis is also carried out to choose the best design, taking into account the trade-off between the increase in energy production and the costs of changing the tilt angle [15]. In order to improve the tracking efficiency, artificial intelligence approaches such as fuzzy logic methods [16] and neural networks [17] have been proposed to adjust the duty cycle of the converter for MPPT. Although neural network control methods can provide better MPPT performance than traditional and fuzzy logic control (FLC) methods, neural network control methods require the measurements of solar radiation and cell temperature [18].
In order to minimize the costs of these systems and achieve the best levels of solar energy collection, some suggestions and recommendations were made and documented in the literature. Regarding the technical issues, Huang and Sun [19] suggest that PV modules should be connected in series or parallel on the same tracker and that the equipment used should be customized to save money. Alexandru and Tatu [20] decreased the running energy consumption by up to 20%. It was achievable by using a technique for cost optimization. For economic reasons, Dakkak and Babeli [21] suggested a large PV system, which has the same tracking unit. It saves energy consumption [22]; materials resisting excessive heat should be given priority if these systems are to be installed in deserts or other high-temperature regions.
So far, many studies have been undertaken to reduce the cost of solar power plant components. According to the published statistics, from 2010 to 2018, the construction costs of each power plant at residential and utility scales have decreased by 77% and 63%, respectively [23]. In addition, these investment costs are expected to decrease from 60% in 2018 to 86% by 2050 [24].
In contrast, some studies have been conducted to reduce investment costs and upgrade photovoltaic panels and inverter technologies to reduce structural investment costs. A review of different companies’ solar power plant costs shows that the cost of construction is 20% of the total cost of equipment required. This share increases to 45–55% with solar trackers [23]. This increase is caused because of the price of a movable structure compared to a fixed structure and the cost of endurance against wind and snow loads. Provided the panel is oriented toward the sun manually along the horizon, the cost of adding a tracker to the main structure compared to the fixed structure can be ignored. It is worth noting that it is not possible to use this structure for large power plants. In general, the performance of a solar power plant can be selected in four ways: panel cooling (Fakourian et al. [25]), solar tracking (Shiva Kumar and Sudhakar [26], Singh et al. [27] and Barai et al. [28]), selection of the optimum ratio between panel capacity to inverter capacity (Wang et al. [29]), and the use of higher efficiency equipment.
Generally, solar trackers increase the structure cost due to the need for a control system and a flexible structure compared to a fixed structure. Awasthi et al. [30] reviewed solar tracking systems. As reported, a solar tracker can enhance efficiency by up to around 40%. The cooling system increases the cost of the structure and control system. Using structures that have the ability to place the panel at several fixed angles per year to the horizon in residential areas not only increases solar energy incoming to the solar panel but also provides the possibility to install the cooling system. Shiva Kumar and Sudhakar [26] suggest that seasonal tilts increase the energy generated by the 110 MW PV power plant in India. Roof-mounted panels can be angled manually, reducing investment and operating costs and increasing reliability.
Due to the high potential of solar radiation and the vast area of Iran, several studies have prepared a radiation atlas and determined the optimum installation angle and also the effect of using the stated strategies to increase the efficiency of solar power plants in Iran totally or a specific point of Iran.
In 2013, Besarati et al. [31] prepared a solar atlas of Iran in five different modes, three of which are suitable for PV systems. These three modes are solar radiation on a tilted surface with a latitude angle, solar radiation on a slope with a latitude angle that orients towards the sun from east to west, and sunlight on a sloping surface with a latitude angle that follows Azimuth. The calculations of the solar radiation model are based on the studies of Guaymard [32] and Liu and Jordan [33].
In 2014, Haghparast et al. [34] used the Niroo Research Institute (NRI) model based on studies of Lari 2009 and Daneshyar 1978 [35] to prepare a solar atlas for Iran.
In 2017, Moron et al. designed a two-axis solar tracker. The used control system is a closed-loop. In practice, it has been shown that the amount of energy obtained has been increased by 18% compared to a fixed system (New Prototype of Photovoltaic Solar Tracker Based on Arduino).
In 2018, Hoffmann et al. studied a solar tracker to increase the amount of irradiation received to the surface of the photovoltaic panel by 23.4% from June to November. Following the solar energy in this work has been researched through the use of LDR. This study is based on a practical study, and there is no reference to the development of a simulated model.
In 2018, Hammoumi et al. introduced an inexpensive dual-axis solar tracker. The control system was online, and the method of solar tracking was by using LDR. By adjusting the resistors in the circuit, they have improved the performance of the control system. Comparison of solar tracker performance with the fixed system has shown that the solar tracker system has improved productivity by 36.25% compared to a fixed panel during the study period (a simple and low-cost active dual-axis solar tracker).
In 2020, Kuttybay et al. examined the solar tracker in two modes, using LDR to find the solar position and the planned offline system in weather conditions, showing that the performance of the solar tracker based on the offline system is about 4.2%. It was from the online system. Moreover, the efficiency of the solar tracking system is 57.4% better than placing the panel at the optimal angle (Optimized Single-Axis Schedule Solar Tracker in Different Weather Conditions).
Previous studies have not investigated the cost impact of different angular values of solar structures in different climate zones. Regarding Barai et al. [28], this study intends to examine three issues:
- Looking into the spatial effects of annual radiation intensity that reaches the panel surface concerning the optimum angle at optimum time intervals compared to the optimum constant angle installation.
- Assessing the effect of the optimum time intervals (OTIs) of each optimum angle on the choice of the angle at the equal time intervals (ETIs). However, in both cases, the number of angular changes is the same, and the optimum angle is selected at each time interval, whereas in the first case, the time intervals can be different from each other.
- Studying the capacity of the power plant for the movable and fixed structure in two cases of the equal time intervals and the variable time intervals.
In a limited period, most studies in the field of solar trackers have compared the performance of the solar tracker system with the use of panels at a fixed angle; therefore, the amount of improvement achieved during a year will not necessarily be the same. The use of solar trackers increases the land allocated to the power plant. Moreover, the performance of solar trackers in different climates has not been evaluated. The purpose of this study is to provide a method to investigate the placement of the panel at the optimal angle in the optimal time period in different climates and the rate of increase the input energy to the level of energy conversion technology and the required allocated land to the power plant during one year.
The difference in investment cost of the required structure to install the panel compared to the fixed structure can be neglected in practice. The limited number of angle shifts makes it possible for home power plants to not require a control system. Hence, the cost of the control system is also waived.
Due to the vast area and different climate zones of Iran, it is necessary to examine a and b issues in each climate in terms of radiation intensity. Therefore, Iran’s solar atlas has been prepared to evaluate the country. In terms of radiation intensity, the country is divided into 10 equal regions. In this paper, the effect of using the optimum angle for the movable structure at optimum time intervals has been compared with the optimum fixed structure with the optimum angle at equal time intervals.
2. Materials and Methods
In this study, the effect of the angle variations of the structure toward the horizon on the received energy and the variation of power plant capacity in different regions of Iran in two different scenarios have been investigated. The first scenario examines the optimum (variable) time intervals to change the angle, and the second scenario considers the fixed time intervals. For this purpose, the studied area must be classified into different regions in terms of solar radiation intensity. Next, studies related to the variation of solar energy intensity reached to the panel surface and the power plant capacity have been conducted. Figure 1 shows the conceptual structure of the study.
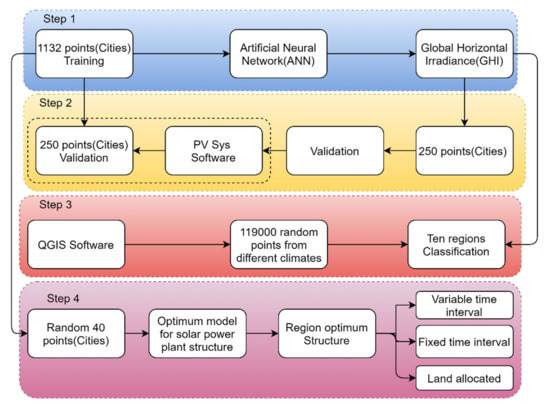
Figure 1.
Conceptual model of this project.
In the first step, Iran’s solar radiation atlas is considered based on different geographical coordinates. Since urban areas are the target of this study, all 1132 cities of Iran have been trained as input to the neural network model. In the second step, 250 points have been randomly selected for the validation of the neural network model. In the third step, the intensity of solar radiation reaching the surface has been estimated based on a sufficient number of points. Hence, the country is divided into ten regions with the same area. Afterward, 40 cities among all the 1132 cities in Iran have been randomly chosen. The performance of the optimum angle in two modes of optimum time intervals and equal time intervals has been assessed. Finally, the effects of this change of angle on the power plant capacity has been evaluated.
Although several studies have been published on the Iranian Solar Atlas, the results or input data are hard to extract. Therefore, in this study, an attempt has been made to introduce a model that has the minimum need for input data to estimate the solar radiation intensity in any part of Iran, and the results of the study are available to continue the research more easily. Solar radiation is a function of air pollution, cloudiness percentage, location, shadows, and so forth. Studies have shown that these parameters are a function of the geographical location. Additionally, the uncertainty of different parameters in the available data can cause errors. Therefore, a neural network model with three inputs (latitude, longitude, and altitude) has been applied. It is challenging to access this data for solar radiation map preparation. Since different variables affect the intensity of solar radiation in each location, it can be concluded that a suitable neural network (only three inputs (longitude, latitude, and altitude) needs to develop a training model for the solar radiation map preparation. This paper intends to divide the country into different regions in terms of the intensity of radiation. Thereafter, the number of optimum angle variations is estimated in each region over one year.
Due to the limited training points, it is expected that the model will not be accurate enough in the geographical boundary regions where the radiation intensity changes abruptly; however, due to the limited geographical area of these border regions compared to the whole country area, it will not affect energy estimations for the whole country. The selected neural network is of the feedforward type. Examining the different training methods shows that training with the trainscg method is converged sooner than the other training methods.
The selection of the optimum angle in the optimum time intervals has been performed using the model proposed by Barai et al. [28] The general form of this model is expressed using Equation (1). The studied time intervals have been chosen to be one hour in duration, and it has been assumed that the annual radiation intensity has not been changed. For this purpose, the average radiation intensity of the last 20 years has been used to estimate the radiation intensity for one-hour long time intervals. Therefore, considering the beginning and end of a year, for the first category, the number of decision variables is n, whereas for the second category, it will be n − 1.
where is hourly solar radiation intensity () on a south-facing surface in the northern hemisphere with the angle of θ relative to the horizon at hour t, α is latitude, β is longitude, and γ is albedo. In order to estimate this value, different models such as the isotropic diffuse model [36] can be used.
In the development of this relationship, it is assumed that the intensity of radiation reaching the panel surface at a certain time of year is equal in all years, but this issue, despite changes in weather and air pollution, reduces the impact of these changes compared to the average radiation intensity of the last 20 years. The objective function of this problem is to maximize the intensity of radiation reaching the panel surface during one year. Hence, the number of sentences on the right side of the objective function is equal to the number of allowed angles. Each sentence shows the amount of radiation reaching the panel surface during the optimal placement of the panel at the optimal angle. This mathematical programming problem consists of a total of two categories of constraints. The first general constraint represents the time sequence of the angle change (this constraint consists of 8759 constraints), and the time intervals studied are one hour. The second general constraint indicates that the decision variables are non-negative and that they are integers.
Trackers are entitled to more land-use than the fixed tilt angle mounting systems when the fixed mounting system is adjusted on the angle that receives the highest global tilted irradiation. In other words, the land-use requirement for power plants with trackers causes the installed power plant capacity per area to shrink. Since the suggested adjustable tilt mounting system does not have any effect on the number of the panels located in the rows extended in the east–west direction, the distance between a pair of rows is required to be increased. Equation (2) is to estimate the distancing among the rows.
In Equation (2), is the optimum fixed tilt angle when the angle leads to receiving the highest global tilted irradiation at the panel during a year, and is the highest panel angle when the model stated by Equation (1) is applied to receive the highest global tilted irradiation at the panel during a year.
As shown in Figure 2, although distancing among the rows is increased for greater angles concerning the horizon, the solar panels are placed in a smaller area. By increasing the distance between the rows of the panels extended in the east to the west direction and reducing the area occupied by the rows of the panels, it is possible to increase the land-use requirement for the power plant compared to the panel at an optimum fixed angle (Equation (3)). Equation (3) is written in a general form. This mathematical programming aims to find the optimum tilt angle that causes the longest distancing.
where ξ is the Ratio of North–Shadow length to module height for winter, which is assumed to be 2.31 based on Soteris studies [36].
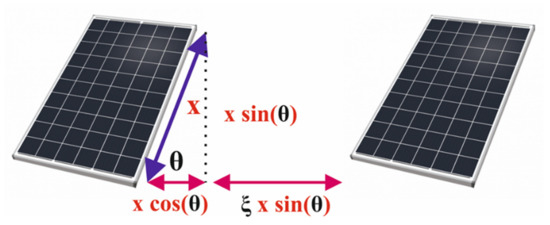
Figure 2.
The distance between the rows of panels from each other due to the lack of shadows (as well as transit).
Equation (3) is developed on the assumption that the width of the power plant (extending east-west) is the same in both modes, but the length of the power plant (extending south-north) is different. Therefore, the first two sentences in the numerator of a fraction represent the land allocated to each row for a fixed structure, and the second two sentences in the numerator of a fraction represent the land allocated to each row in the case of the possibility of changing the angle of the panel. The first and third sentences, if subtracted, indicate the distance under the panels.
Additionally, the second and fourth sentences in the numerator of subtraction indicate the distance between the rows of panels from each other due to the lack of shadows (as well as transit). The items expressed are shown using Figure 2.
3. Discussion
The results are reported in the form of three sections, the atlas of radiation of Iran, the effect of the number of structural angle changes on the increment of input energy in different radiation regions, and the effect of the number of structural angle changes on the power plant capacity.
3.1. Solar Energy Atlas in Iran
Figure 3 shows the global horizontal irradiance points in this study. In the first step, all 1132 Iranian cities were selected as the training data set (Figure 4) for a three-layer neural network, and 250 arbitrary points were considered for the validation process, as shown in Figure 4. In the following, 119,765 random locations were selected to provide the solar energy atlas in Iran based on the global horizontal irradiance (Figure 3).
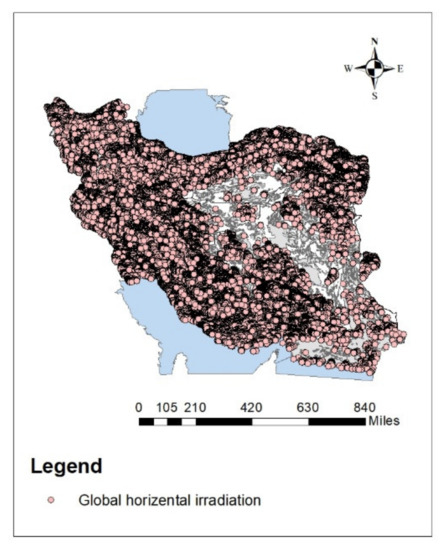
Figure 3.
The global horizontal irradiance points in this study.
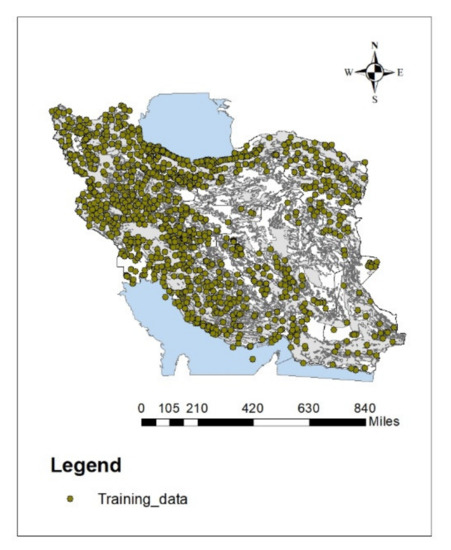
Figure 4.
The training points in this study.
In order to train the neural network, all 1132 locations werechosen. The proposed neural network consists of three layers and 70, 100, and 50 neurons in each layer. Finally, 250 random geographical locations were selected by QGIS. Then, the trained neural network accuracy was evaluated.
There is little difference between the sea levels of these locations and the software. However, the sea levels of these locations were replaced by those of the software in order to increase the accuracy of the model.
In the next step, the error of trained data was computed. As shown in Figure 5, the average error was lower than 2.2 percent, and a large part of these errors were due to the topological condition. Regions between different climates cannot be predicted well. This is because of the low amount of training datasets for those regions. Those regions’ areas are small compared to the whole area of Iran; hence, this error can be ignored (Figure 6).
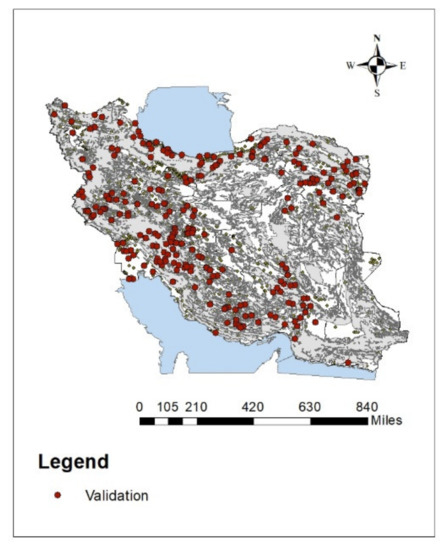
Figure 5.
The validation points in this study.
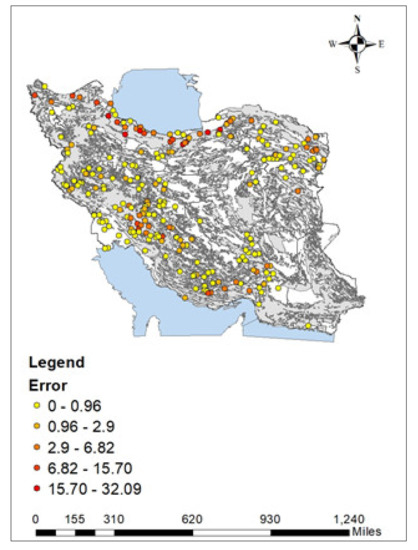
Figure 6.
The percentage of errors in selective neural network training points.
According to the amount of solar energy potential, the share of solar radiation in each decile has been devised. This decile classification is based on global horizontal irradiance (Figure 7).
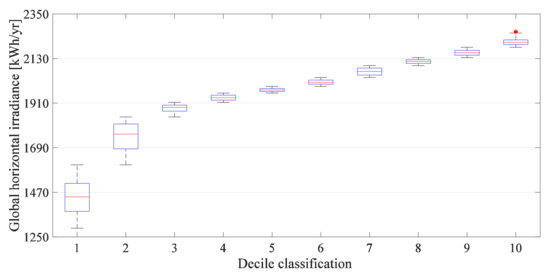
Figure 7.
The decile classification of Iran’s different regions based on the access to high radiation potential and economic profitability.
As shown in Figure 7, Iran’s solar radiation does not have very severe gradients. Only in the first three deciles, this value is different, but from the third decile onwards, the same conditions are observed. The first three deciles belong to the northern regions, where the majority of regions are either allocated to agricultural activities or are, in fact, protected green area. Moreover, the solar radiation potential of these deciles does not justify having a solar farm in these regions. Consequently, it is undeniable that about 30 percent of Iran’s land is not recommended for building solar power plants.
In order to investigate the effect of panel placement on the optimum angle and optimum time intervals for increasing the input energy to the photovoltaic panel surface, 40 cities in Iran were selected in different deciles. The reason for selecting 40 cities is the availability of complete meteorological information. Table 1 shows the decile of each of these 40 cities

Table 1.
The decile of each of these 40 selected cities to evaluate the use of the proposed structure.
The solar model validation was performed by the PVsyst software. In this regard, the fixed solar angle per year and the optimum solar angle were compared to the output of PVsyst software. Table 2 shows the difference between the estimated annual solar radiation on the panel surface in percent. Additionally, the difference between the fixed optimum angles of the proposed model and PVsyst commercial software is enlisted in degrees in Table 2. It should be mentioned that, for comparison, all the environmental conditions (Albedo coefficient, radiation intensity, etc.) were taken to be the same for the model and PVsyst software.
Table 2.
The difference between the annual solar radiation on the panel surface along with the difference between fixed optimum angles of the proposed model and PVsyst commercial software.
As can be seen from Table 2, the results of the model are in agreement with the results of PVsyst software 3.2.
3.2. Effect of the Angle Variation and Solar Radiation Decile on the Amount of Input Energy Increment
Since the mounting system can be adjusted manually, the number of angle changes is expected to be limited. Figure 8 shows the effect of the number of angle changes per year on increasing the amount of global tilted irradiance (GTI) or input energy.
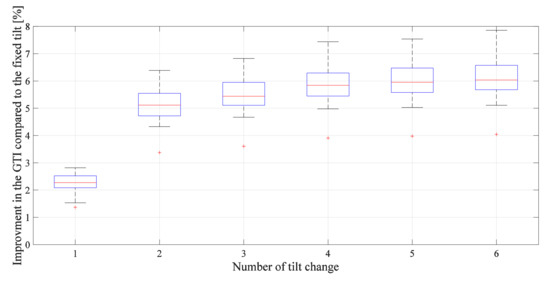
Figure 8.
The effect of the number of angles changing per year on increasing the input energy to the panel surface.
As can be seen in Figure 8, changing the panel angle more than four times a year (in other words, a mounting system with the possibility of placing the panel at five different angles per year) has a trifling effect on the efficiency improvement. Moreover, manually changing the tilt angles impedes increasing the number of tilt angle changes per year; hence, a mounting system allows manually placing photovoltaic panels on five different tilt angles per year, which could be deemed a reasonable load of drudgery.
Figure 9, Figure 10, Figure 11, Figure 12, Figure 13, Figure 14, Figure 15, Figure 16, Figure 17 and Figure 18 show the effect of the number of angle changes on the input energy to the panel surface increment in each decile.
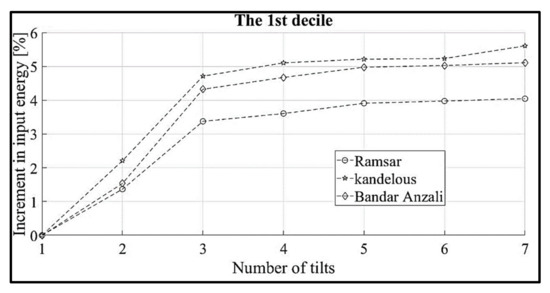
Figure 9.
The effect of the number of angle changes on the percentage of input energy increment to the panel surface in the first decile.
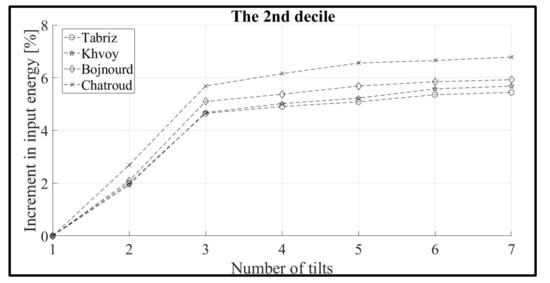
Figure 10.
The effect of the number of angle changes on the percentage of input energy increment to the panel surface in the second decile.
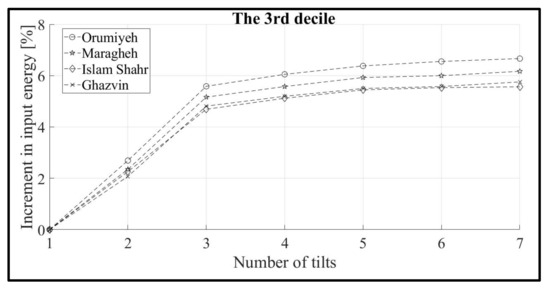
Figure 11.
The effect of the number of angle changes on the percentage of input energy increment to the panel surface in the third decile.
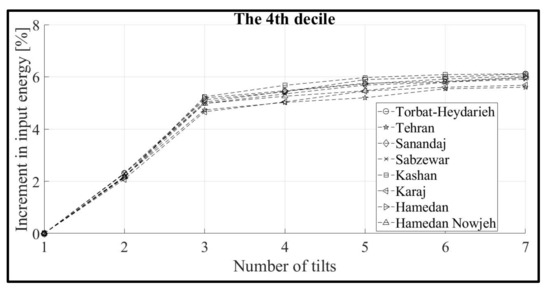
Figure 12.
The effect of the number of angle changes on the percentage of input energy increment to the panel surface in the fourth decile.
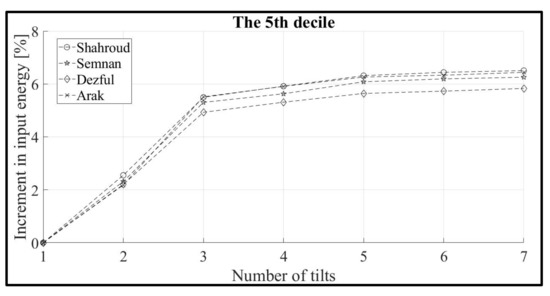
Figure 13.
The effect of the number of angle changes on the percentage of input energy increment to the panel surface in the fifth decile.
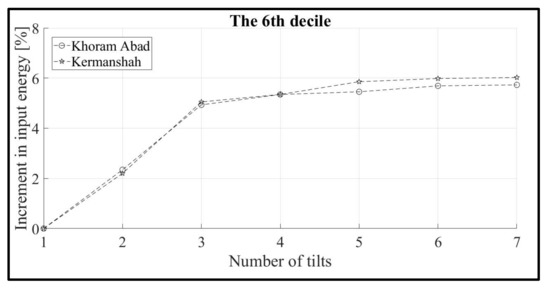
Figure 14.
The effect of the number of angle changes on the percentage of input energy increment to the panel surface in the sixth decile.
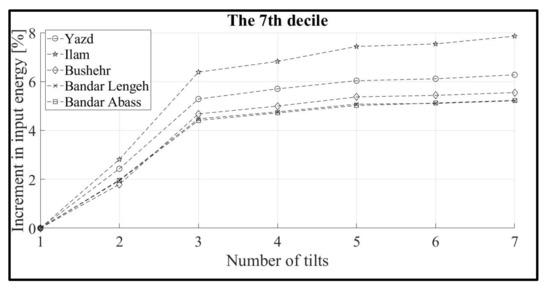
Figure 15.
The effect of the number of angle changes on the percentage of input energy increment to the panel surface in the seventh decile.
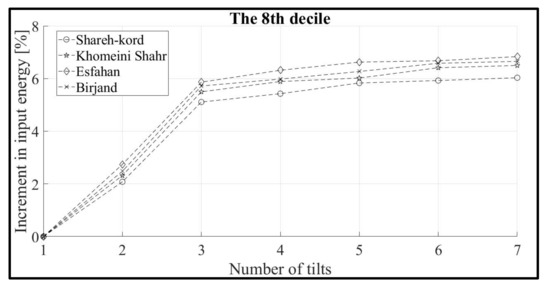
Figure 16.
The effect of the number of angle changes on the percentage of input energy increment to the panel surface in the eighth decile.
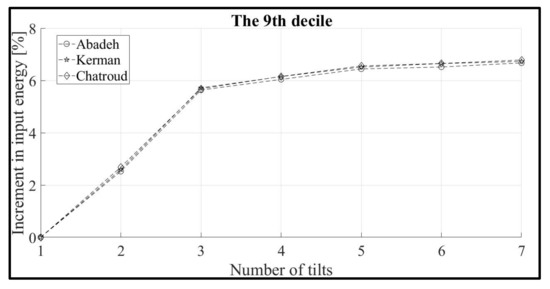
Figure 17.
The effect of the number of angle changes on the percentage of input energy increment to the panel surface in the ninth decile.
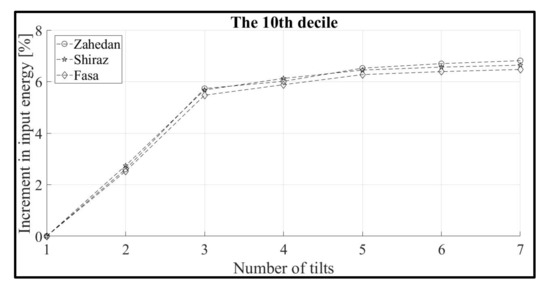
Figure 18.
The effect of the number of angle changes on the percentage of input energy increment to the panel surface in the tenth decile.
As seen in Figure 9, Figure 10, Figure 11, Figure 12, Figure 13, Figure 14, Figure 15, Figure 16, Figure 17 and Figure 18, the adjustable mounting system on five angles is the optimum option in all regions.
The main advantage of the used model in comparison to commercial software is the choice of optimum angles and their optimum time interval. In commercial software, one year is divided into equal or specified time intervals, and finally, the optimum angles are calculated in each given time interval. Figure 19 shows that when the title angle change time interval is variable and not equal, the GTI will consequently increase.
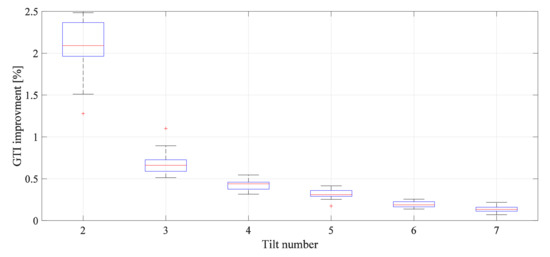
Figure 19.
GTI improvement under varying tilt angle change time interval.
As the number of angle changes increases, the energy reached on the surface increases in both equal and variable time intervals. The difference between global tilted irradiation on the solar panel in Case 1 and global tilted irradiation on the solar panel in Case 2 reduces when the number of tilt angle changes is increased. The importance of the variable time interval is emboldened when it is opted to change the tilt angle from twice to three times.
3.3. Effect of Changing the Tilt Angle on the Land-Use Requirement
As mentioned in Section 2, the tilt angle has two direct effects on the land use requirement; the first is due to the area that is covered by the photovoltaic panels ( as shown in Figure 2), and the second is due to the shortest distance among the rows ( as shown in Figure 2). As expected, to gain the highest GTI, the optimum tilt angle in autumn and winter is higher than the optimum tilt angle in spring and summer, which causes the second term in land use requirement in autumn and winter to be higher than the other two seasons but the first term to be reduced. In the following, the effect of changing the tilt angle on the land use requirement is studied.
Although the use of a solar tracker increases the input energy to the energy conversion technology, it causes the distance among the rows of the solar panels to increase, which reduces the capacity of the solar panel per unit area. Therefore, the use of this solution will be only in cases where the shortage of land is no problem. Figure 20 and Figure 21 show the increase in the distance between the rows of the solar panels as a function of the number of angle changes per year for the 40 case studies.
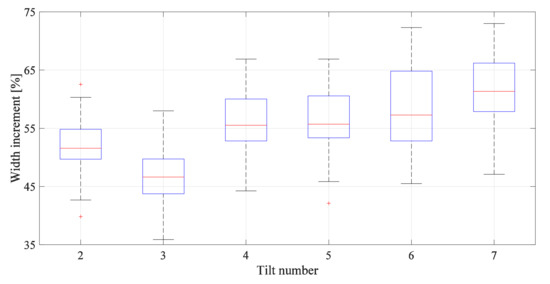
Figure 20.
Percentage increase in distance between rows of the solar panels versus the number of angle changes per year for 40 case studies under varying tilt change time intervals.
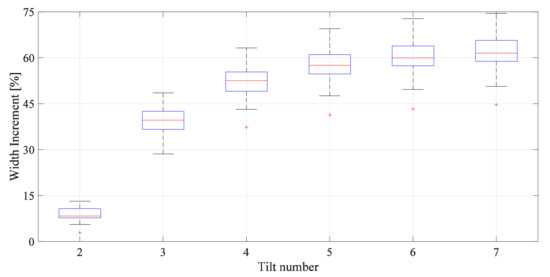
Figure 21.
Percentage increase in distance between rows of solar panels versus the number of angle changes per year for 40 case studies under equal tilt change time intervals.
As can be seen from Figure 20 and Figure 21, when the time intervals are equal, in the case of limited numbers of angle changes, the distance among the rows is shorter than the variable time interval. Although the distance among the rows of panels extending east–west increases because of the increase in the angle of the panel, the solar panels will take up less horizontal space. This is shown in Figure 21 and Figure 22. The number of angle changes does not have a significant effect on the land-use requirements.
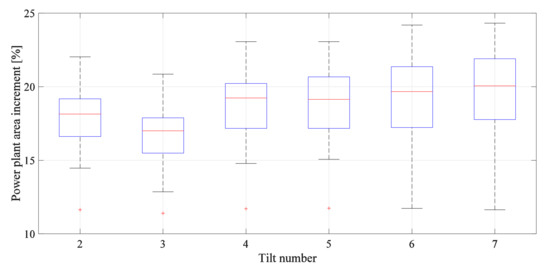
Figure 22.
Percentage increase of solar power plant area in case of the variation of the angle at optimum time intervals.
As can be seen from Figure 22 and Figure 23, the land-use requirement for the solar power plant increases by 12% to 24% for the two mentioned cases in comparison to a fixed-tilt mounting system.
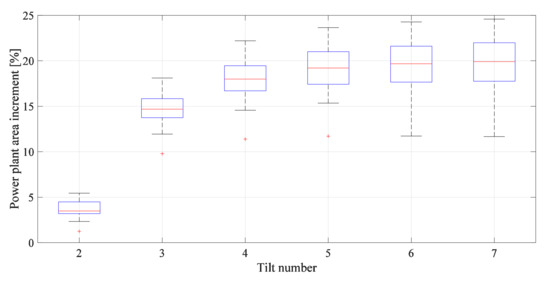
Figure 23.
Percentage increase of solar power plant area in case of the variation of the angle of the panel at the equal time intervals.
Figure 24 shows the effect of constant and varying time intervals on the percentage increase rate of solar power plant land use for 10 selected studied cities.
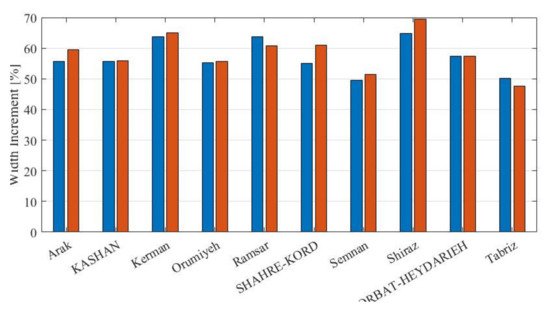
Figure 24.
Effect of the variable and constant time interval for changing the angle of 10 studied cities in Iran on the increase of solar power plant area.
As shown in Figure 24, the increase in the power plant area in some cities can be reduced compared to the constant time intervals between the angle changes.
Utilizing the adjustable tilt angle mounting system on five angles along with the optimum schedule in Iran leads to a 3.9% to 7.4% increase in global tilted irradiation on the solar panels.
4. Conclusions
In this study, the effect of the number of optimum angle changes and their optimum time intervals on the global tilted irradiance (GTI) and land-use requirement is studied. For the first step, it was necessary to study the distribution of solar radiation. To estimate the intensity of solar radiation on the horizontal surface (Global horizontal irradiance), a three-layer feedforward neural network model was suggested with three inputs (longitude, latitude, and altitude) with 70, 100, and 50 neurons per layer based on the trainscg method. All 1132 Iranian cities were used to train the neural network. The evaluation of the trained neural network was conducted through 250 randomly generated points using the QGIS software. Comparison of the geographical map results shows the regions where sudden and significant climate change occurs; the model does not have high accuracy due to the limited network training points. Moreover, about 119,765 points were selected in this method to quantify the intensity of radiation. The territory under investigation was divided into ten deciles in terms of radiation intensity. The impact of movable structures in 40 studied cities in Iran was examined. The study shows that increasing the number of tilt angle changes leads to an increase in the energy input to the panel surface. Since the change of angle is performed manually and increasing this number by more than five angles does not improve the efficiency any further, it is suggested to select a structure with the ability to place the panel at five different tilt angles. It is predicted that if the angle is applied at the proper time, the entering solar energy to the panel’s surface will increase by 3.9% to 7.4%. However, if the angle changes are applied at equal intervals, the entering solar energy will be by 3% to 7%. It should be noted that the distance between the rows of panels extending from east to west, in the first (variable tilt change time interval) and second (equal tilt change time interval) cases is increased by 44% to 67% and 41% to 70%, respectively. On the other hand, the allocated power plant land increases in movable angles. It means the area required for the construction of power plants will be 12% to 24% more than photovoltaic power plants with constant angles in Iran.
According to the study, the following have been identified as future research directions:
- One of the problems of widespread use of the proposed structure is the design of the structure for different geographical locations. Therefore, by modifying the introduced structural model, it is possible to deploy a solar energy conversion technology on several pre-defined angles; however, it is possible to use this structure for a wide range. Only for each geographical point, the time and interval of deployment at each angle are different. Therefore, there is a possibility of industrial production of structures.
- The effect of increasing the input energy to the level of energy conversion technology on the change of efficiency and effectiveness has been studied
Author Contributions
All authors contributed equally to finalize the research. All authors have read and agreed to the published version of the manuscript.
Funding
This research received no external funding.
Institutional Review Board Statement
Not applicable.
Informed Consent Statement
Not applicable.
Data Availability Statement
The presented data and the model are available; if it is applicable, please request them from the corresponding author.
Conflicts of Interest
The authors declare no conflict of interest.
References
- Valancius, R.; Mutiari, A.; Singh, A.; Alexander, C.; De La Cruz, D.A.; del Pozo, F.E., Jr. Solar Photovoltaic Systems in the Built Environment: Today Trends and Future Challenges. J. Sustain. Arch. Civ. Eng. 2018, 23, 25–38. [Google Scholar] [CrossRef] [Green Version]
- Kusch-Brandt, S. Urban Renewable Energy on the Upswing: A Spotlight on Renewable Energy in Cities in REN21’s “Renewables 2019 Global Status Report”. Resources 2019, 8, 139. [Google Scholar] [CrossRef] [Green Version]
- Nsengiyumva, W.; Chen, S.G.; Hu, L.; Chen, X. Recent advancements and challenges in Solar Tracking Systems (STS): A review. Renew. Sustain. Energy Rev. 2018, 81, 250–279. [Google Scholar] [CrossRef]
- Zandi, Z.; Mazinan, A.H. Maximum power point tracking of the solar power plants in shadow mode through artificial neural network. Complex Intell. Syst. 2019, 5, 315–330. [Google Scholar] [CrossRef] [Green Version]
- Perpiñán, O. Cost of energy and mutual shadows in a two-axis tracking PV system. Renew. Energy 2012, 43, 331–342. [Google Scholar] [CrossRef] [Green Version]
- Pillot, B.; Muselli, M.; Poggi, P.; Haurant, P.; Hared, I. The first disaggregated solar atlas of Djibouti: A decision-making tool for solar systems integration in the energy scheme. Renew. Energy 2013, 57, 57–69. [Google Scholar] [CrossRef] [Green Version]
- Li, J.; Heap, A.D. A Review of Spatial Interpolation Methods for Environmental Scientists. Aust. Geol. Surv. Organ. 2008, 68, 154. Available online: http://www.ga.gov.au/image_cache/GA12526.pdf (accessed on 1 July 2021).
- Ghahreman, N.; Bakhtiari, B. Solar Radiation Estimation from Rainfall and Temperature Data in Arid and Semi-arid Climates of Iran. Desert 2009, 14, 141–150. [Google Scholar] [CrossRef]
- Ramedani, Z.; Omid, M.; Keyhani, A. Modeling solar energy potential in a tehran province using artificial neural networks. Int. J. Green Energy 2013, 10, 427–441. [Google Scholar] [CrossRef]
- Benghanem, M.; Mellit, A.; Alamri, S.N. ANN-based modelling and estimation of daily global solar radiation data: A case study. Energy Convers. Manag. 2009, 50, 1644–1655. [Google Scholar] [CrossRef]
- Jimenez, V.A.; Barrionuevo, A.; Will, A.; Rodríguez, S. Neural Network for Estimating Daily Global Solar Radiation Using Temperature, Humidity and Pressure as Unique Climatic Input Variables. Smart Grid Renew. Energy 2016, 7, 94–103. [Google Scholar] [CrossRef] [Green Version]
- Mensour, O.N.; El Ghazzani, B.; Hlimi, B.; Ihlal, A. Modeling of solar energy potential in Souss-Massa area-Morocco, using intelligence Artificial Neural Networks (ANNs). Energy Procedia 2017, 139, 778–784. [Google Scholar] [CrossRef]
- Olalekan, S.; Abdullahi, M.I.; Olabisi, A. Modeling of solar radiation using artificial neural network for renewable energy application Modeling of Solar Radiation Using Artificial Neural Network for Renewable Energy Application. IOSR J. Appl. Phys. 2018, 10, 6–12. [Google Scholar] [CrossRef]
- Adly, M. An Optimized Fuzzy Maximum Power Point Tracker for Stand Alone Photovoltaic Systems: Ant Colony Approach. In Proceedings of the 7th IEEE Conference on Industrial Electronics and Applications (ICIEA), Singapore, 18–20 July 2012; pp. 113–119. [Google Scholar]
- Conceição, R.; Silva, H.G.; Fialho, L.; Lopes, F.M.; Collares-Pereira, M. PV system design with the effect of soiling on the optimum tilt angle. Renew. Energy 2019, 133, 787–796. [Google Scholar] [CrossRef]
- Lalouni, S.; Rekioua, D.; Rekioua, T.; Matagne, E. Fuzzy logic control of stand-alone photovoltaic system with battery storage. J. Power Sources 2009, 193, 899–907. [Google Scholar] [CrossRef]
- Taherbaneh, M.; Faez, K. Maximum power point estimation for photovoltaic systems using neural networks. In Proceedings of the 2007 IEEE International Conference on Control and Automation (ICCA), Guangzhou, China, 30 May–1 June 2007; pp. 1614–1619. [Google Scholar] [CrossRef]
- Algazar, M.M.; Al-Monier, H.; El-Halim, H.A.; Salem, M.E.E.K. Maximum power point tracking using fuzzy logic control. Int. J. Electr. Power Energy Syst. 2012, 39, 21–28. [Google Scholar] [CrossRef]
- Huang, B.J.; Sun, F.S. Feasibility study of one axis three positions tracking solar PV with low concentration ratio reflector. Energy Convers. Manag. 2007, 48, 1273–1280. [Google Scholar] [CrossRef]
- Alexandru, C.; Irina Tatu, N. Optimal design of the solar tracker used for a photovoltaic string. J. Renew. Sustain. Energy 2013, 5, 023133. [Google Scholar] [CrossRef]
- Dakkak, M.; Babelli, A. Design and performance study of a PV tracking system (100W-24Vdc/220Vac). Energy Procedia 2012, 19, 91–95. [Google Scholar] [CrossRef] [Green Version]
- Mattei, M.; Notton, G.; Cristofari, C.; Muselli, M.; Poggi, P. Calculation of the polycrystalline PV module temperature using a simple method of energy balance. Renew. Energy 2006, 31, 553–567. [Google Scholar] [CrossRef]
- Fu, R.; Feldman, D.; Margolis, R. U.S. Solar Photovoltaic System Cost Benchmark: Q1 2018; Technical Report NREL/TP-6A20-72399; National Renewable Energy Laboratory: Golden, CO, USA, 2018. Available online: https://www.nrel.gov/docs/fy19osti/72399.pdf (accessed on 1 July 2021).
- International Renewable Energy Agency—IRENA. Future of Solar Photovoltaic; IRENA: Abu Dhabi, United Arab Emirates, 2019; ISBN 9789292601553. Available online: https://www.irena.org/publications/2019/Nov/Future-of-Solar-Photovoltaic (accessed on 1 July 2021).
- Fakouriyan, S.; Saboohi, Y.; Fathi, A. Experimental analysis of a cooling system effect on photovoltaic panels’ efficiency and its preheating water production. Renew. Energy 2019, 134, 1362–1368. [Google Scholar] [CrossRef]
- Kumar, B.S.; Sudhakar, K. Performance evaluation of 10 MW grid connected solar photovoltaic power plant in India. Energy Rep. 2015, 1, 184–192. [Google Scholar] [CrossRef] [Green Version]
- Singh, R.; Kumar, S.; Gehlot, A.; Pachauri, R. An imperative role of sun trackers in photovoltaic technology: A review. Renew. Sustain. Energy Rev. 2018, 82, 3263–3278. [Google Scholar] [CrossRef]
- Sadeghi, S.; Mehranfar, S.; Ghandehariun, S. Analysis and Optimization of a Hybrid Solar-Ocean Powered Trigeneration System for Kish Island. In Proceedings of the 28th Annual International Conference of the Iranian Association of Mechanical Engineers, Tehran, Iran, 27 May 2020. [Google Scholar]
- Wang, H.X.; Muñoz-García, M.A.; Moreda, G.P.; Alonso-García, M.C. Optimum inverter sizing of grid-connected photovoltaic systems based on energetic and economic considerations. Renew. Energy 2018, 118, 709–717. [Google Scholar] [CrossRef]
- Awasthi, A.; Shukla, A.K.; Manohar, S.R.M.; Dondariya, C.; Shukla, K.N.; Porwal, D.; Richhariya, G. Review on sun tracking technology in solar PV system. Energy Rep. 2020, 6, 392–405. [Google Scholar] [CrossRef]
- Besarati, S.M.; Padilla, R.V.; Goswami, D.Y.; Stefanakos, E. The potential of harnessing solar radiation in Iran: Generating solar maps and viability study of PV power plants. Renew. Energy 2013, 53, 193–199. [Google Scholar] [CrossRef]
- Gueymard, C. Prediction and performance assessment of mean hourly global radiation. Sol. Energy 2000, 68, 285–303. [Google Scholar] [CrossRef]
- Liu, B.Y.H.; Jordan, R.C. The interrelationship and characteristic distribution of direct, diffuse and total solar radiation. Sol. Energy 1960, 4, 1–19. [Google Scholar] [CrossRef]
- Haghparast-Kashani, A.; Saleh-Izadkhast, P.; Lari, H.R. Development of optimum solar irradiation energy model for Iran. Int. J. Glob. Energy Issues 2009, 31, 132–149. [Google Scholar] [CrossRef]
- Daneshyar, M. Solar radiation statistics for Iran. Sol. Energy 1978, 21, 345–349. [Google Scholar] [CrossRef]
- Kalogirou, S.A. Solar Energy Engineering: Processes and Systems; Academic Press: Amsterdam, The Netherlands, 2013. [Google Scholar]
Publisher’s Note: MDPI stays neutral with regard to jurisdictional claims in published maps and institutional affiliations. |
© 2021 by the authors. Licensee MDPI, Basel, Switzerland. This article is an open access article distributed under the terms and conditions of the Creative Commons Attribution (CC BY) license (https://creativecommons.org/licenses/by/4.0/).