
The Impact of COVID-19 Lockdowns on Air Quality—A Global Review


Abstract
:1. Introduction
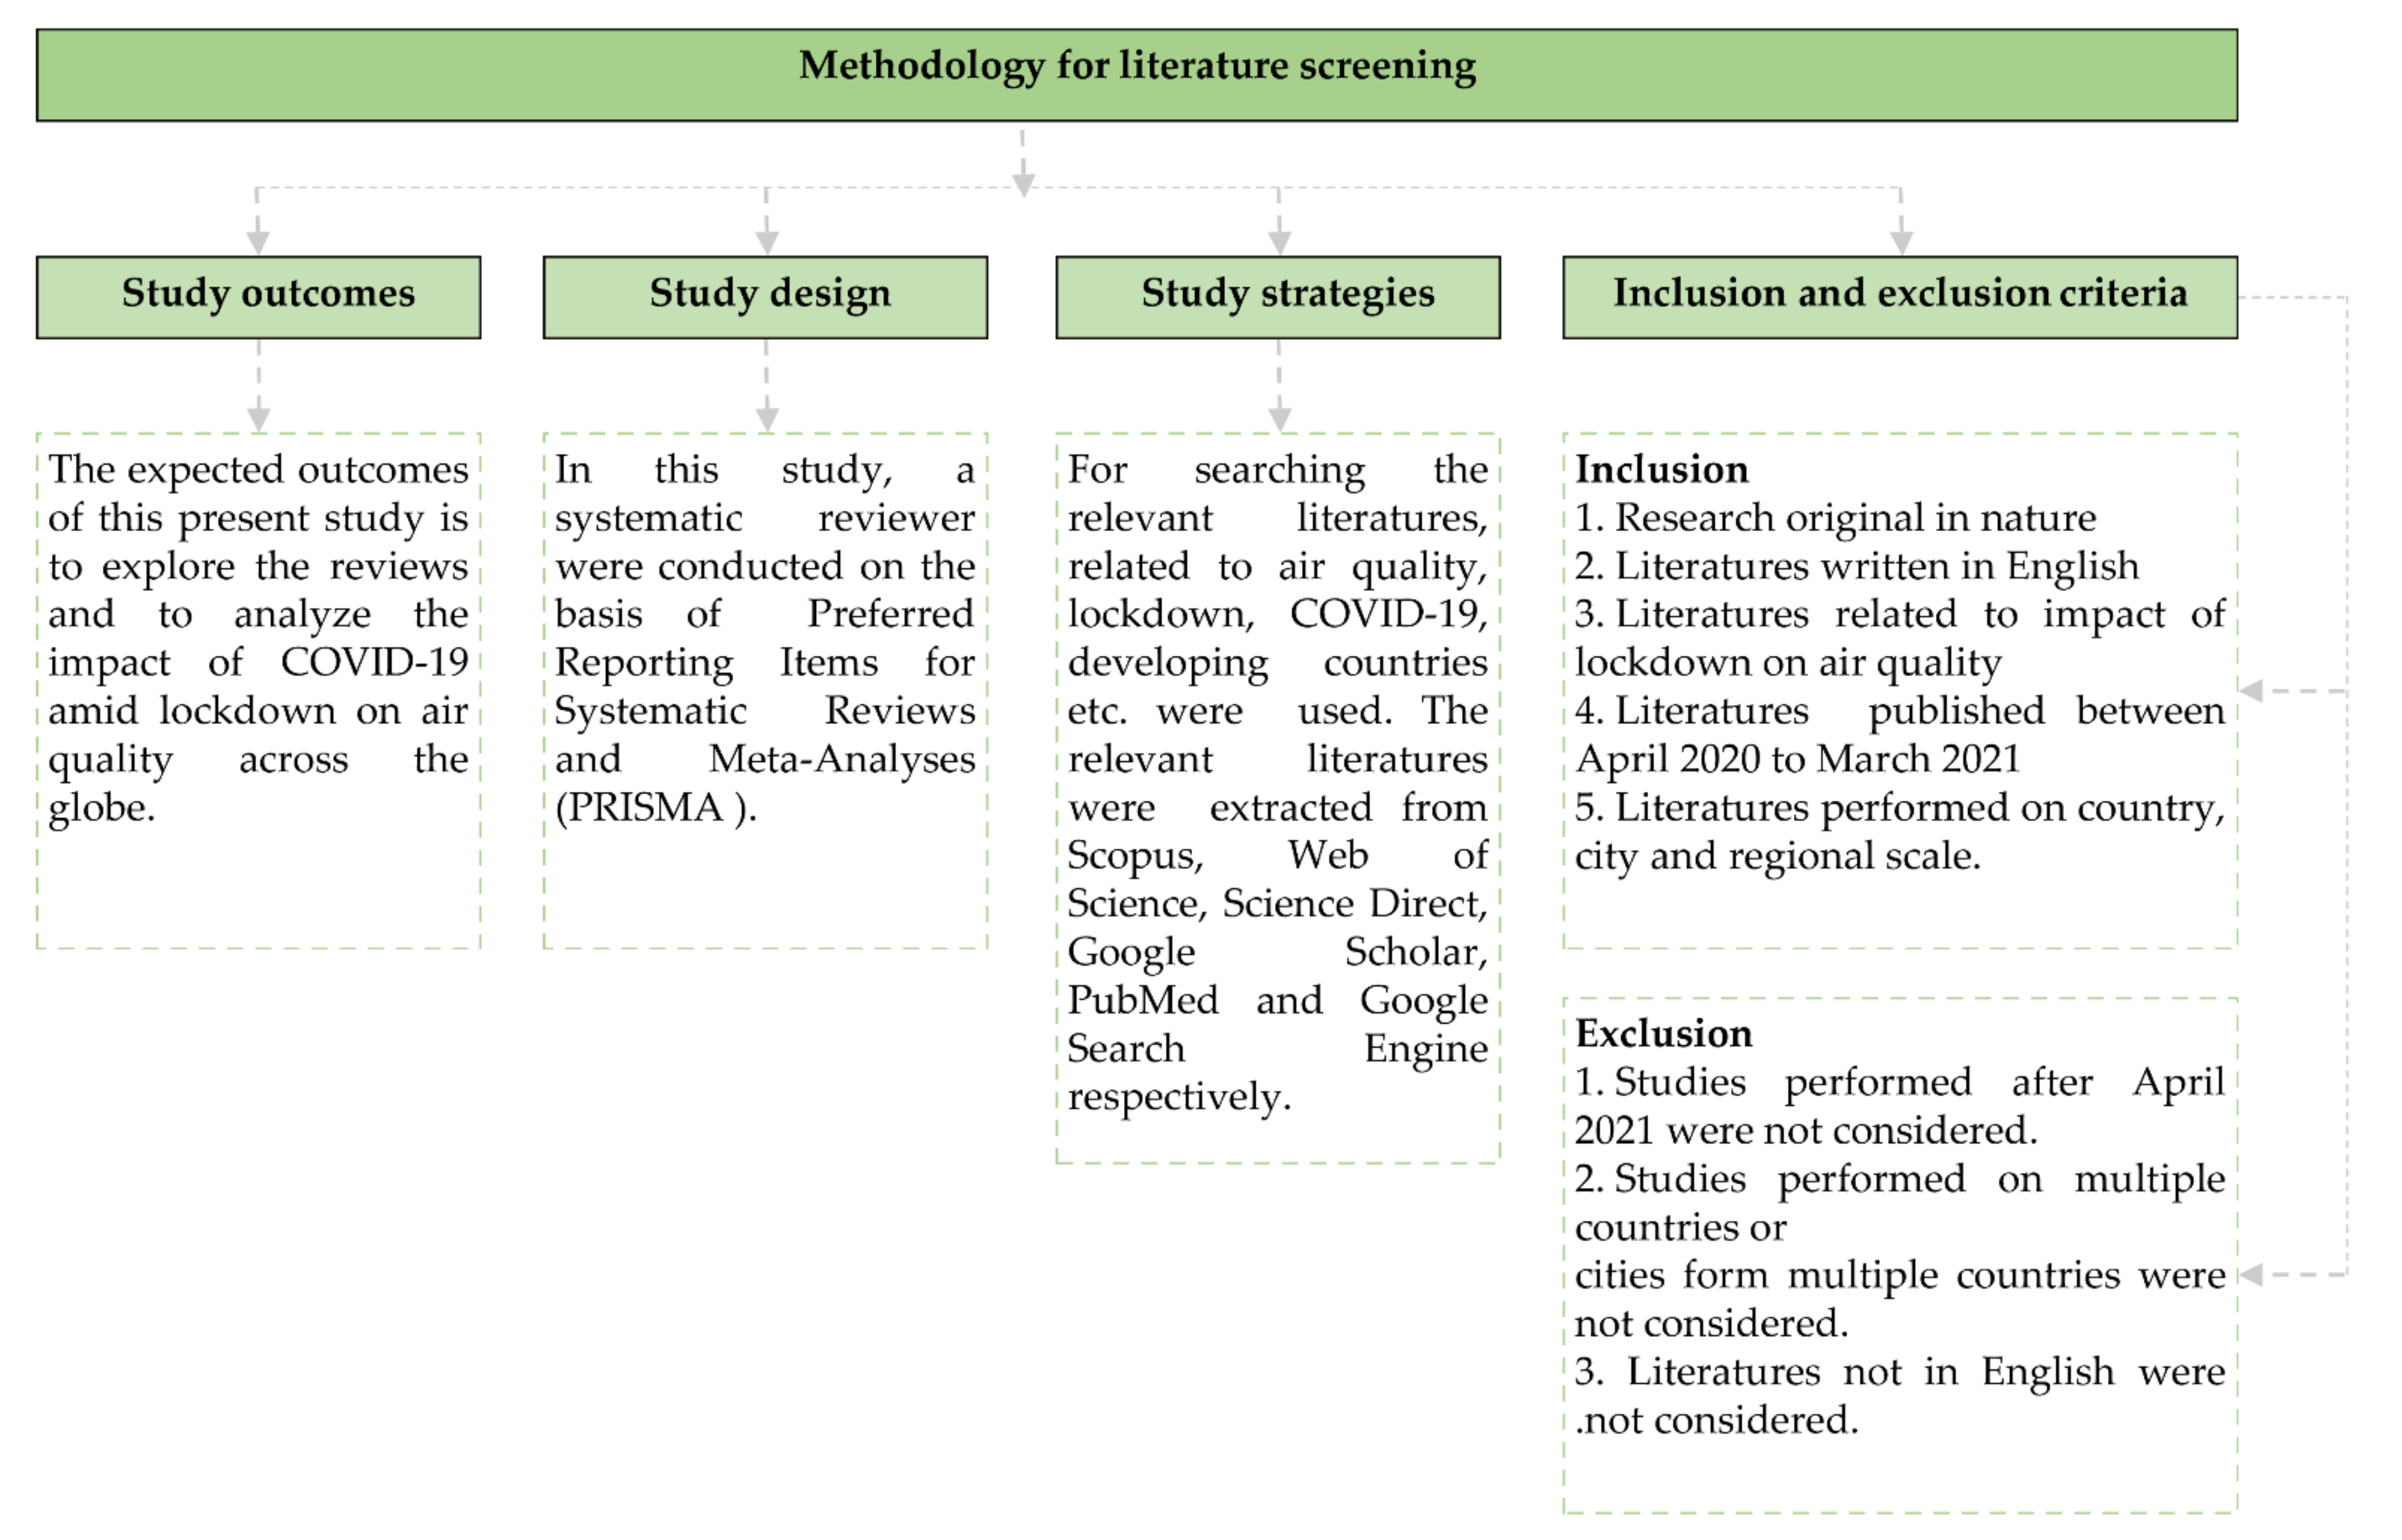
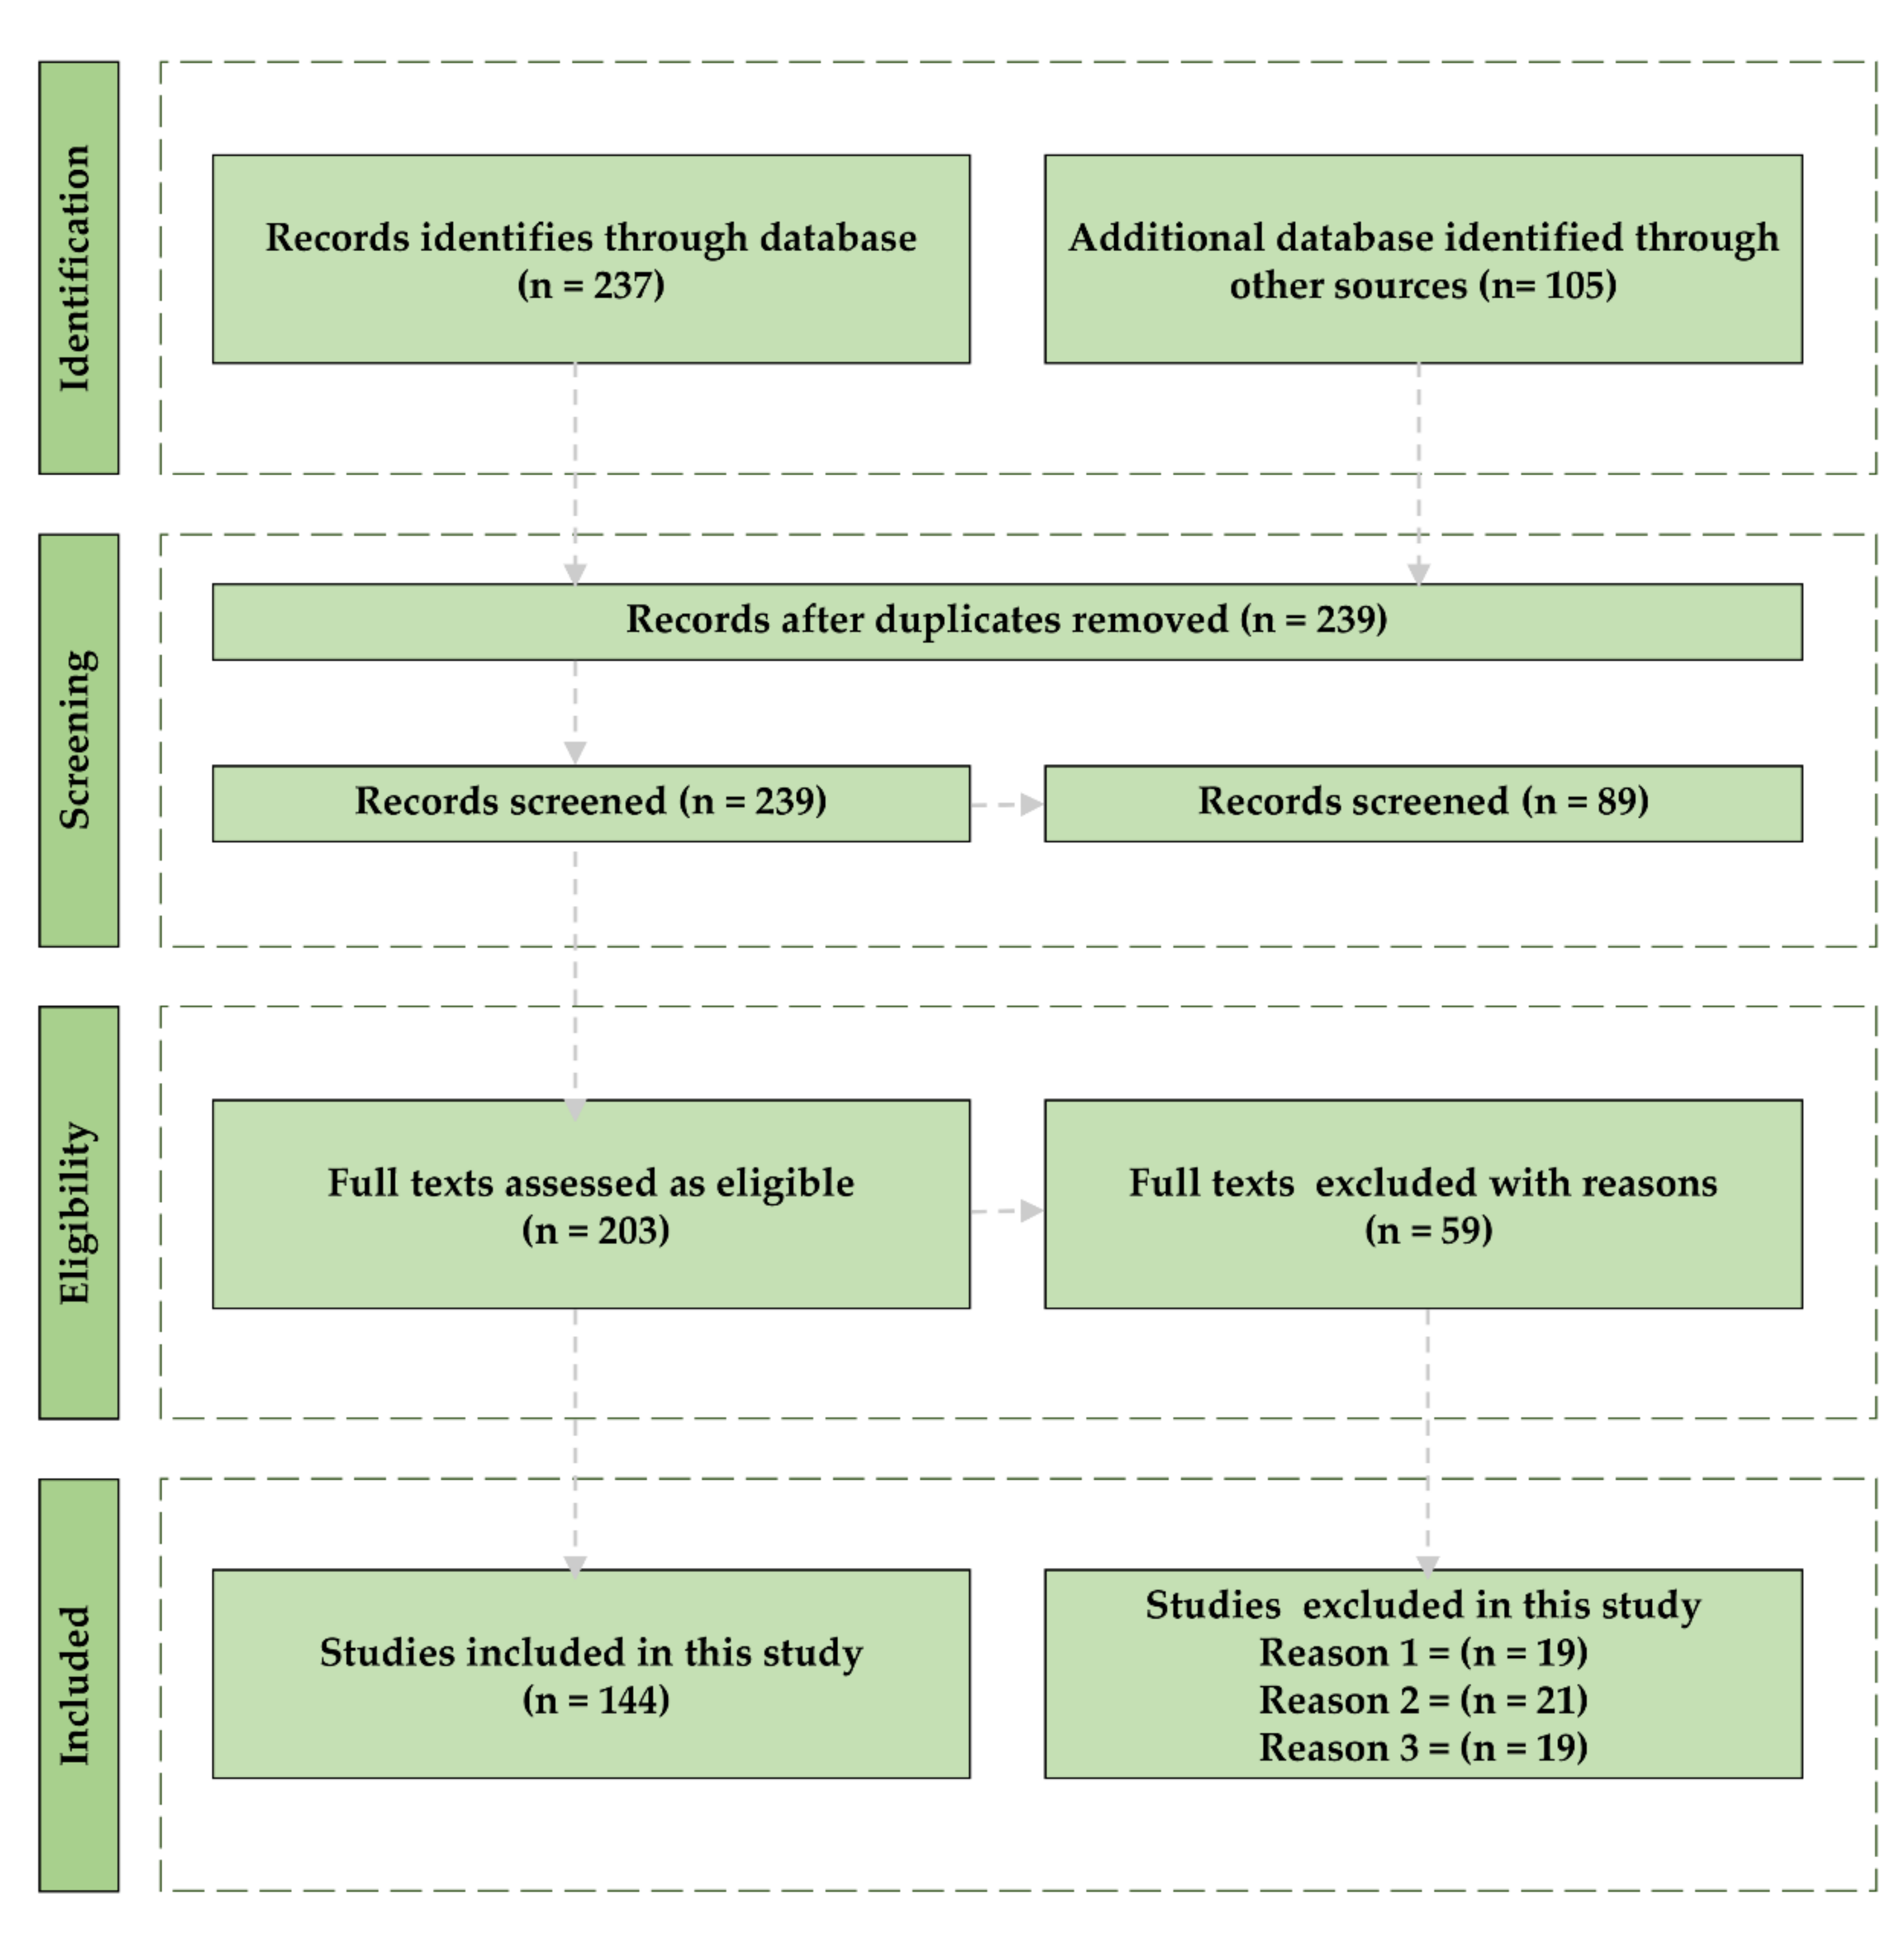
2. Materials and Methods
Keywords for Search of Academic Databases
3. Results
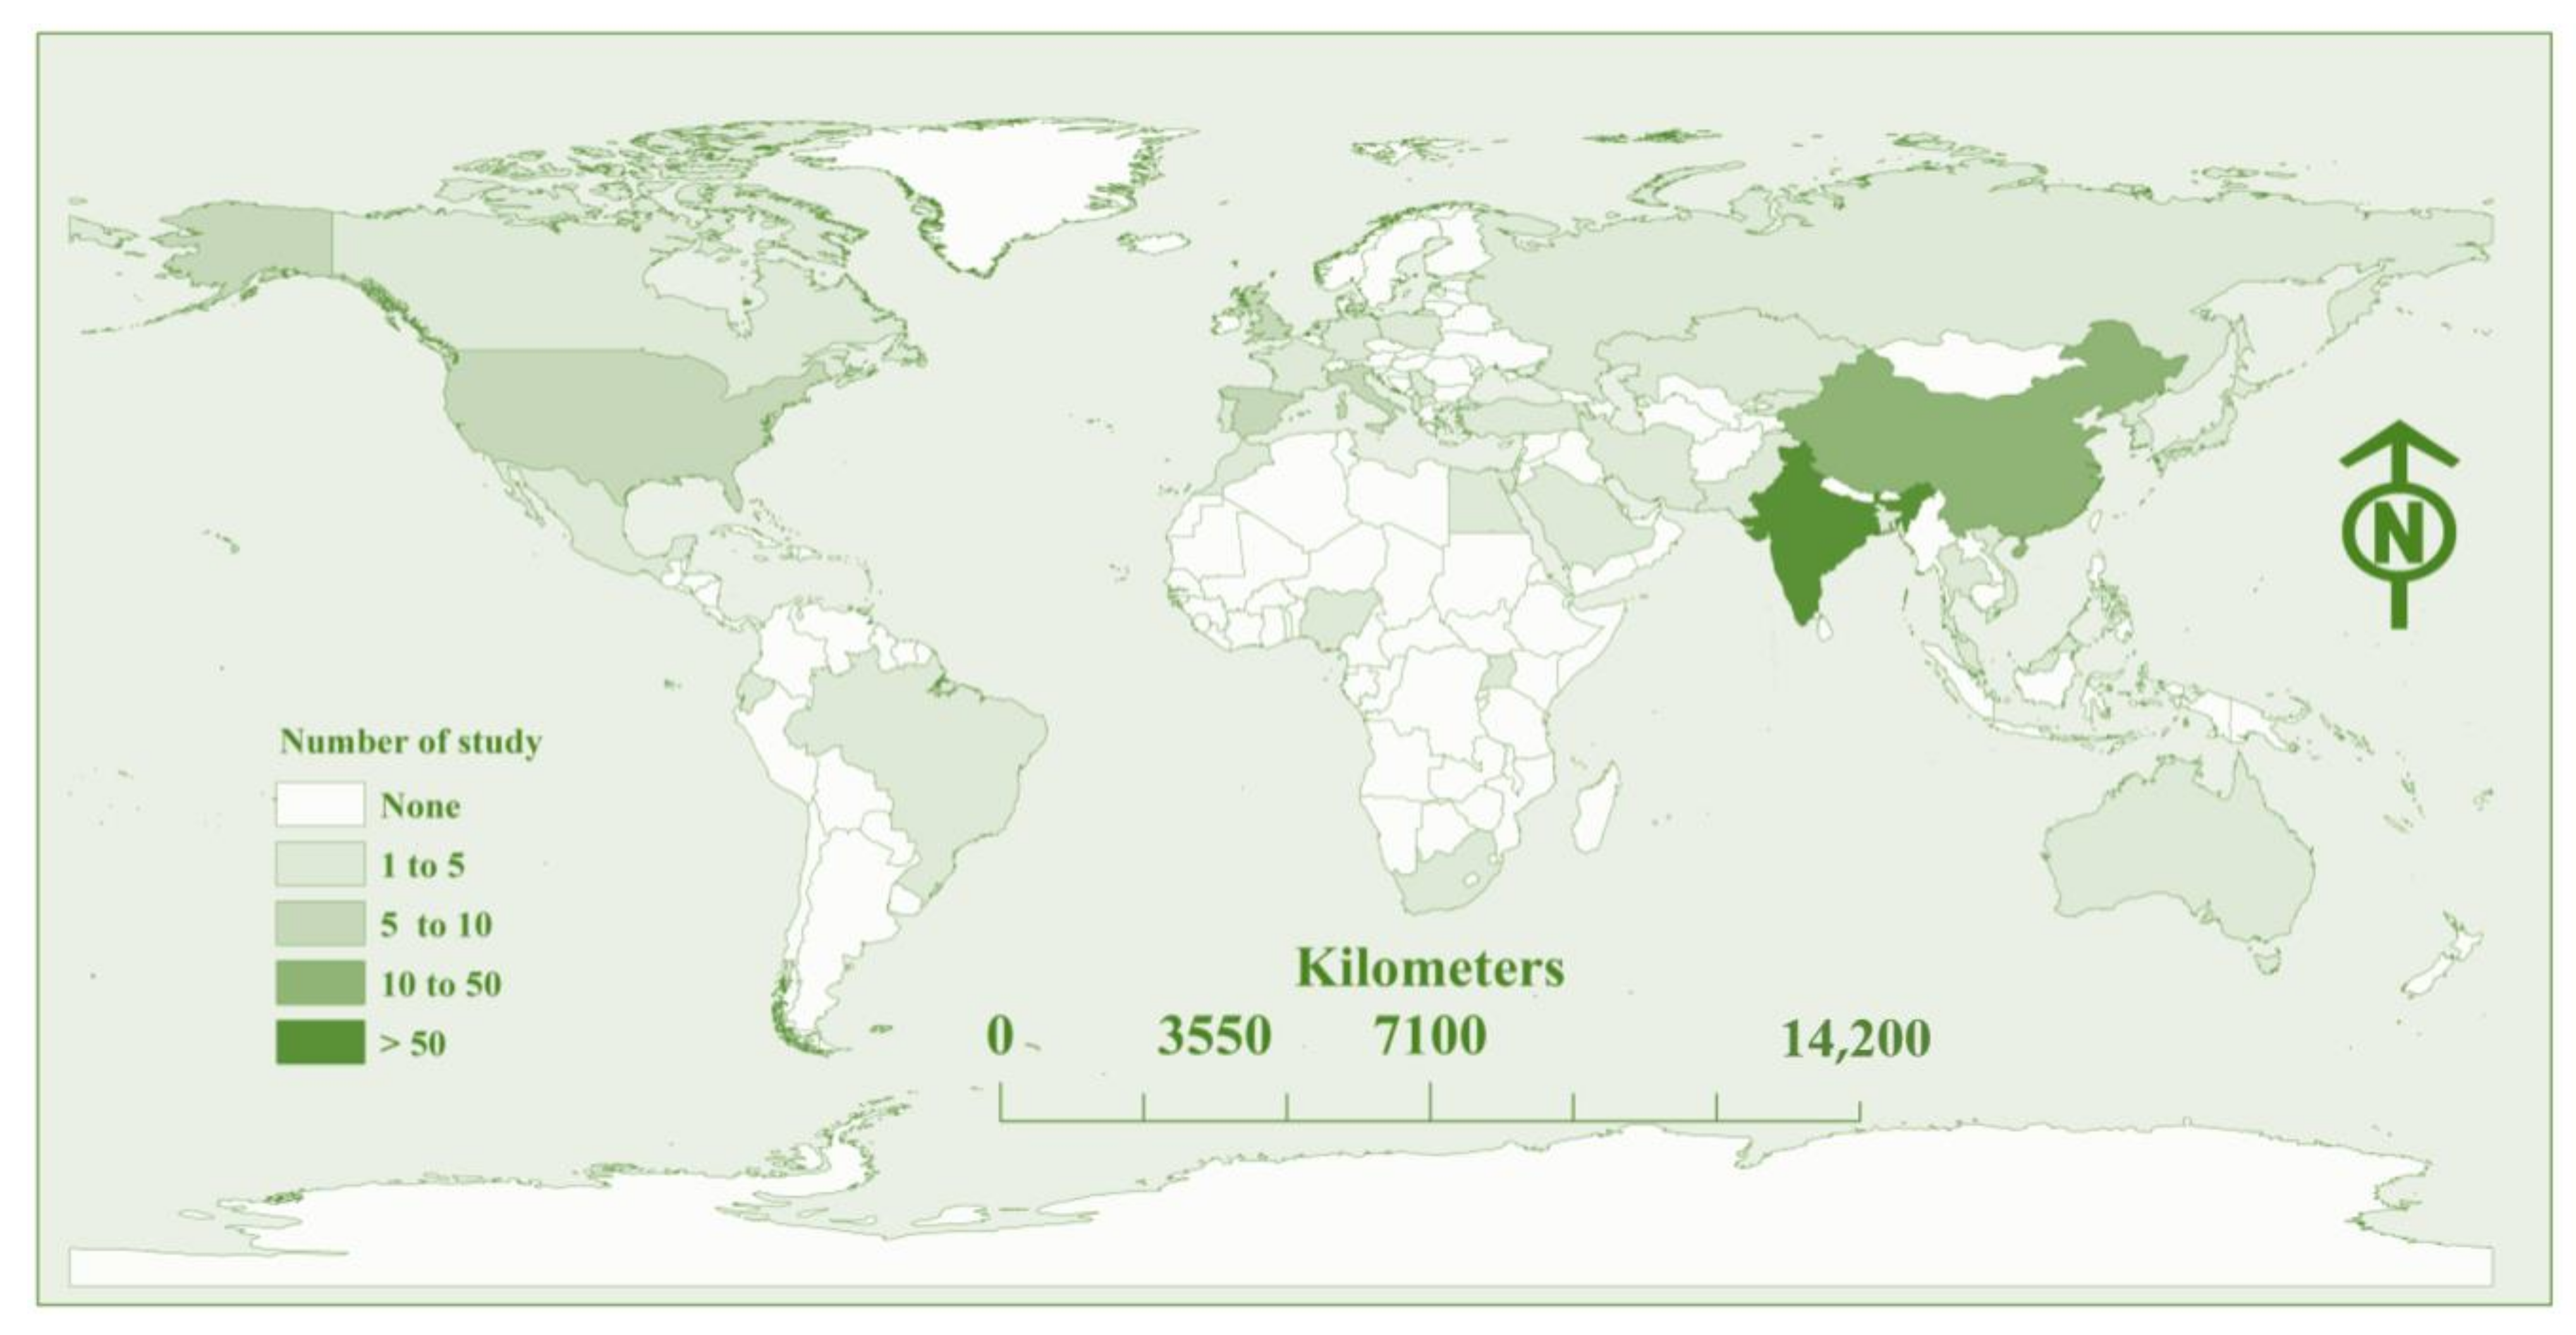
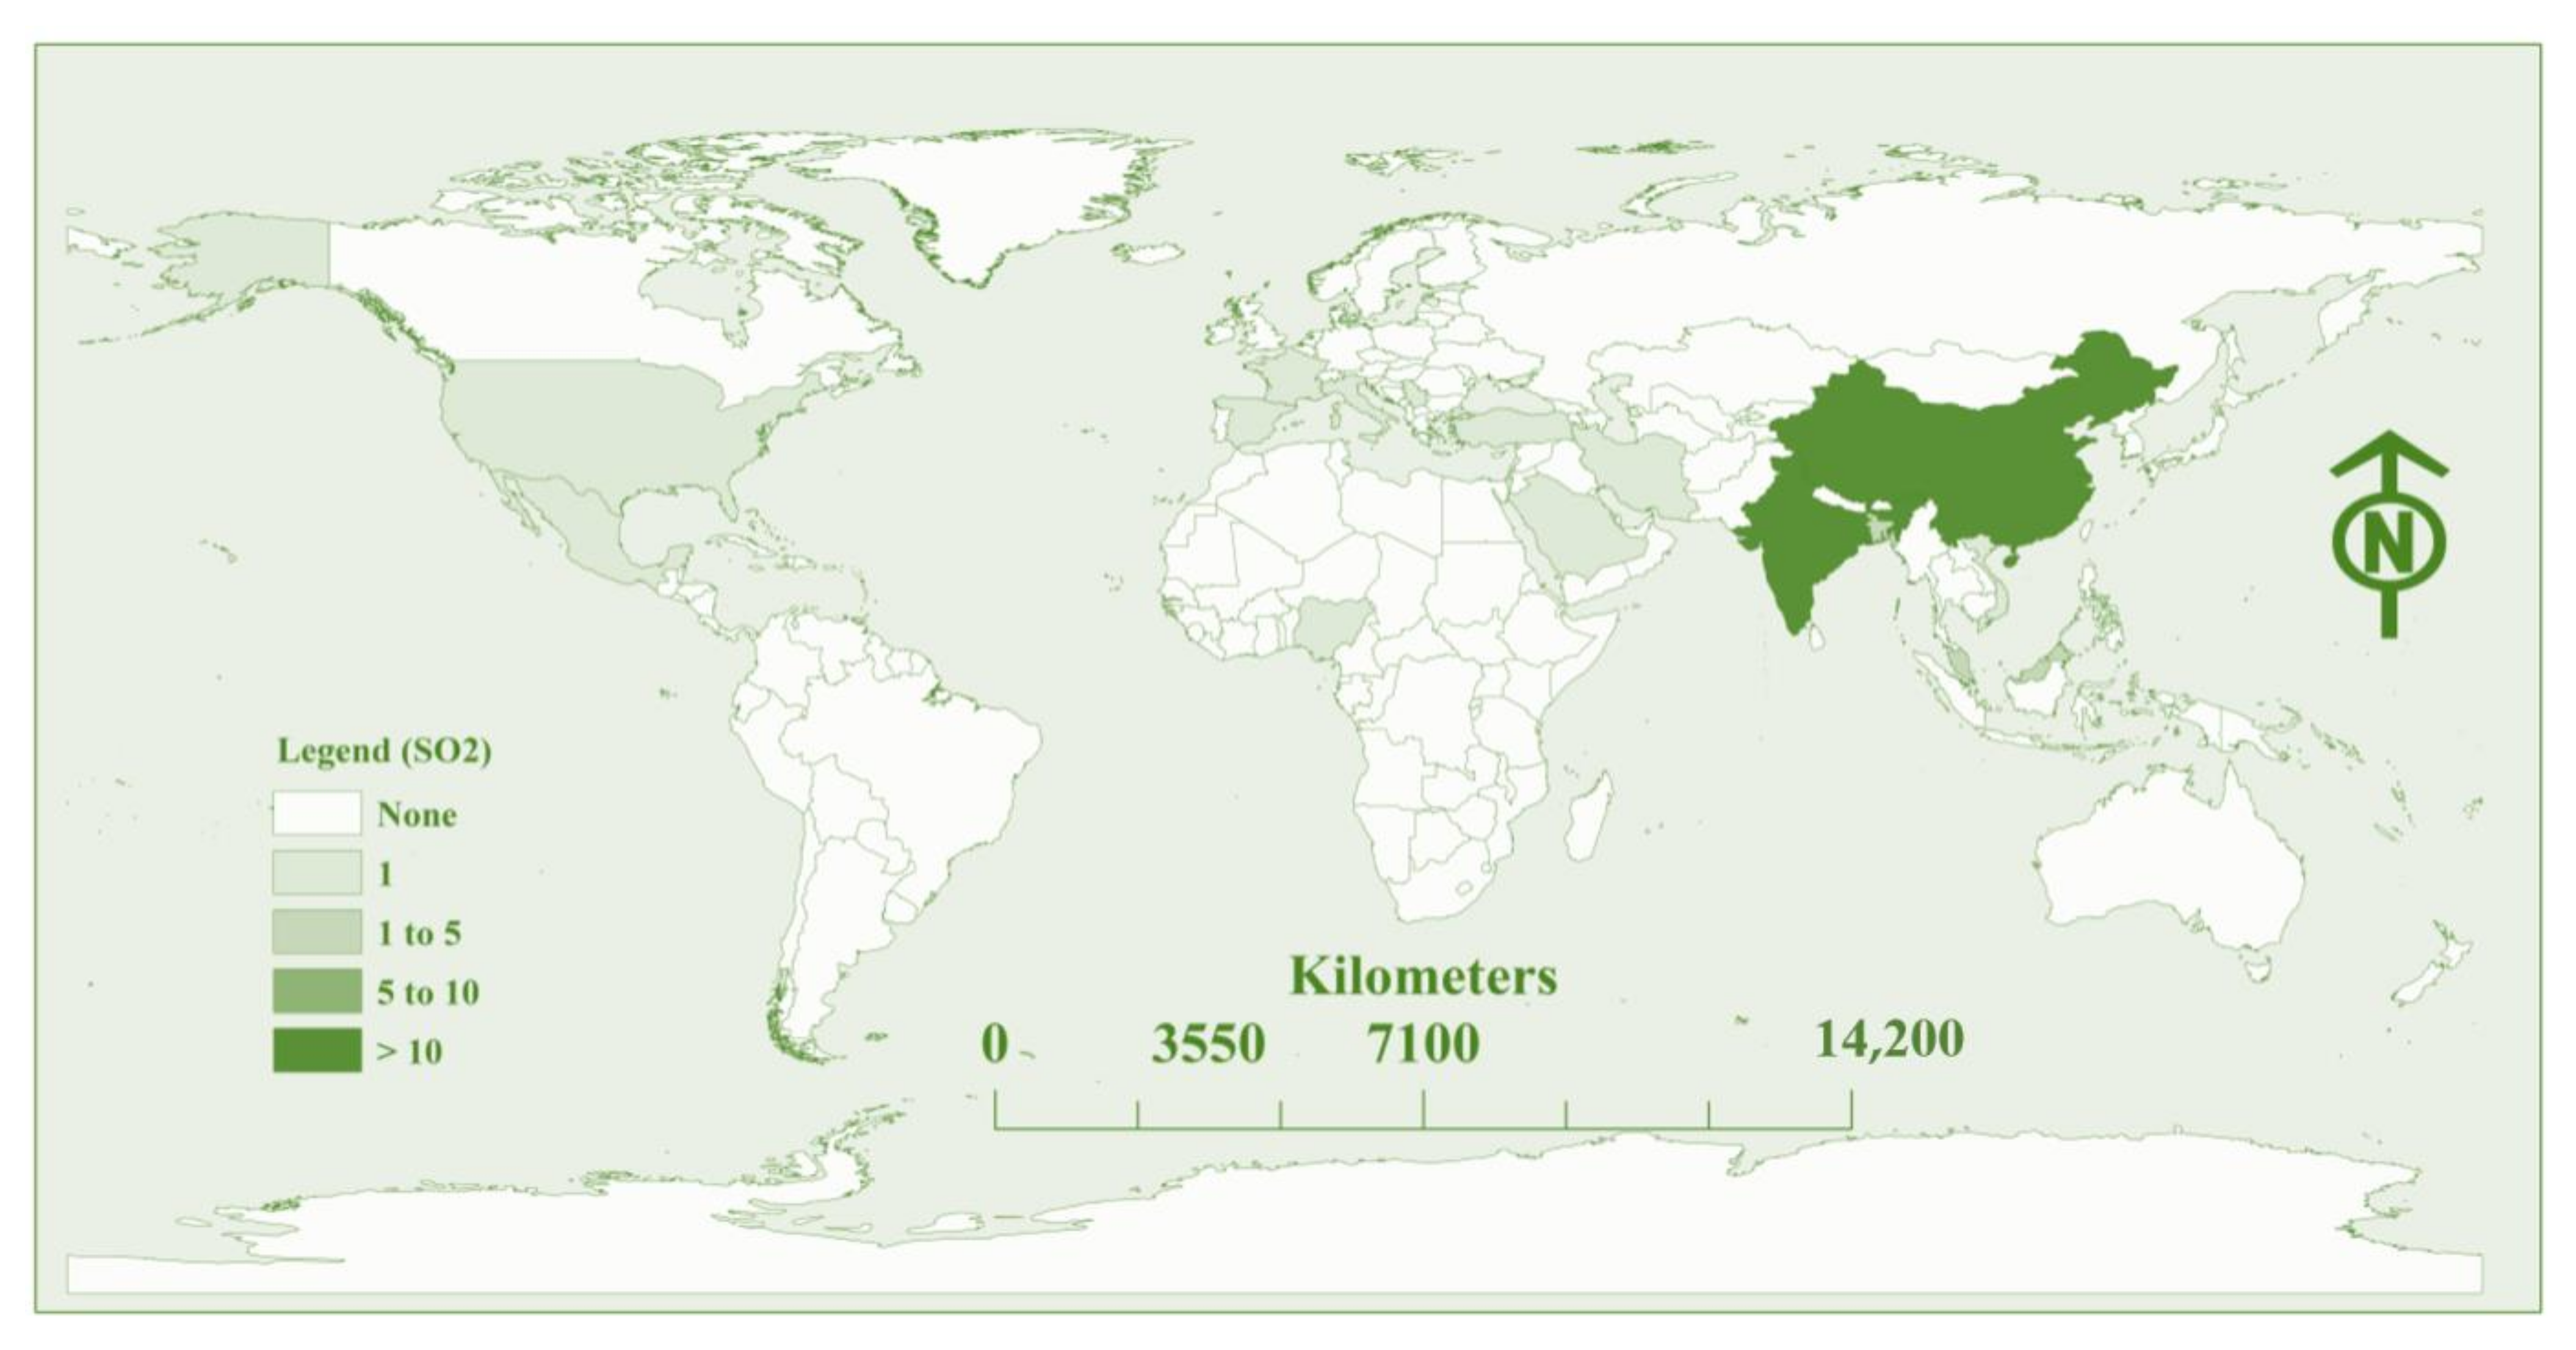
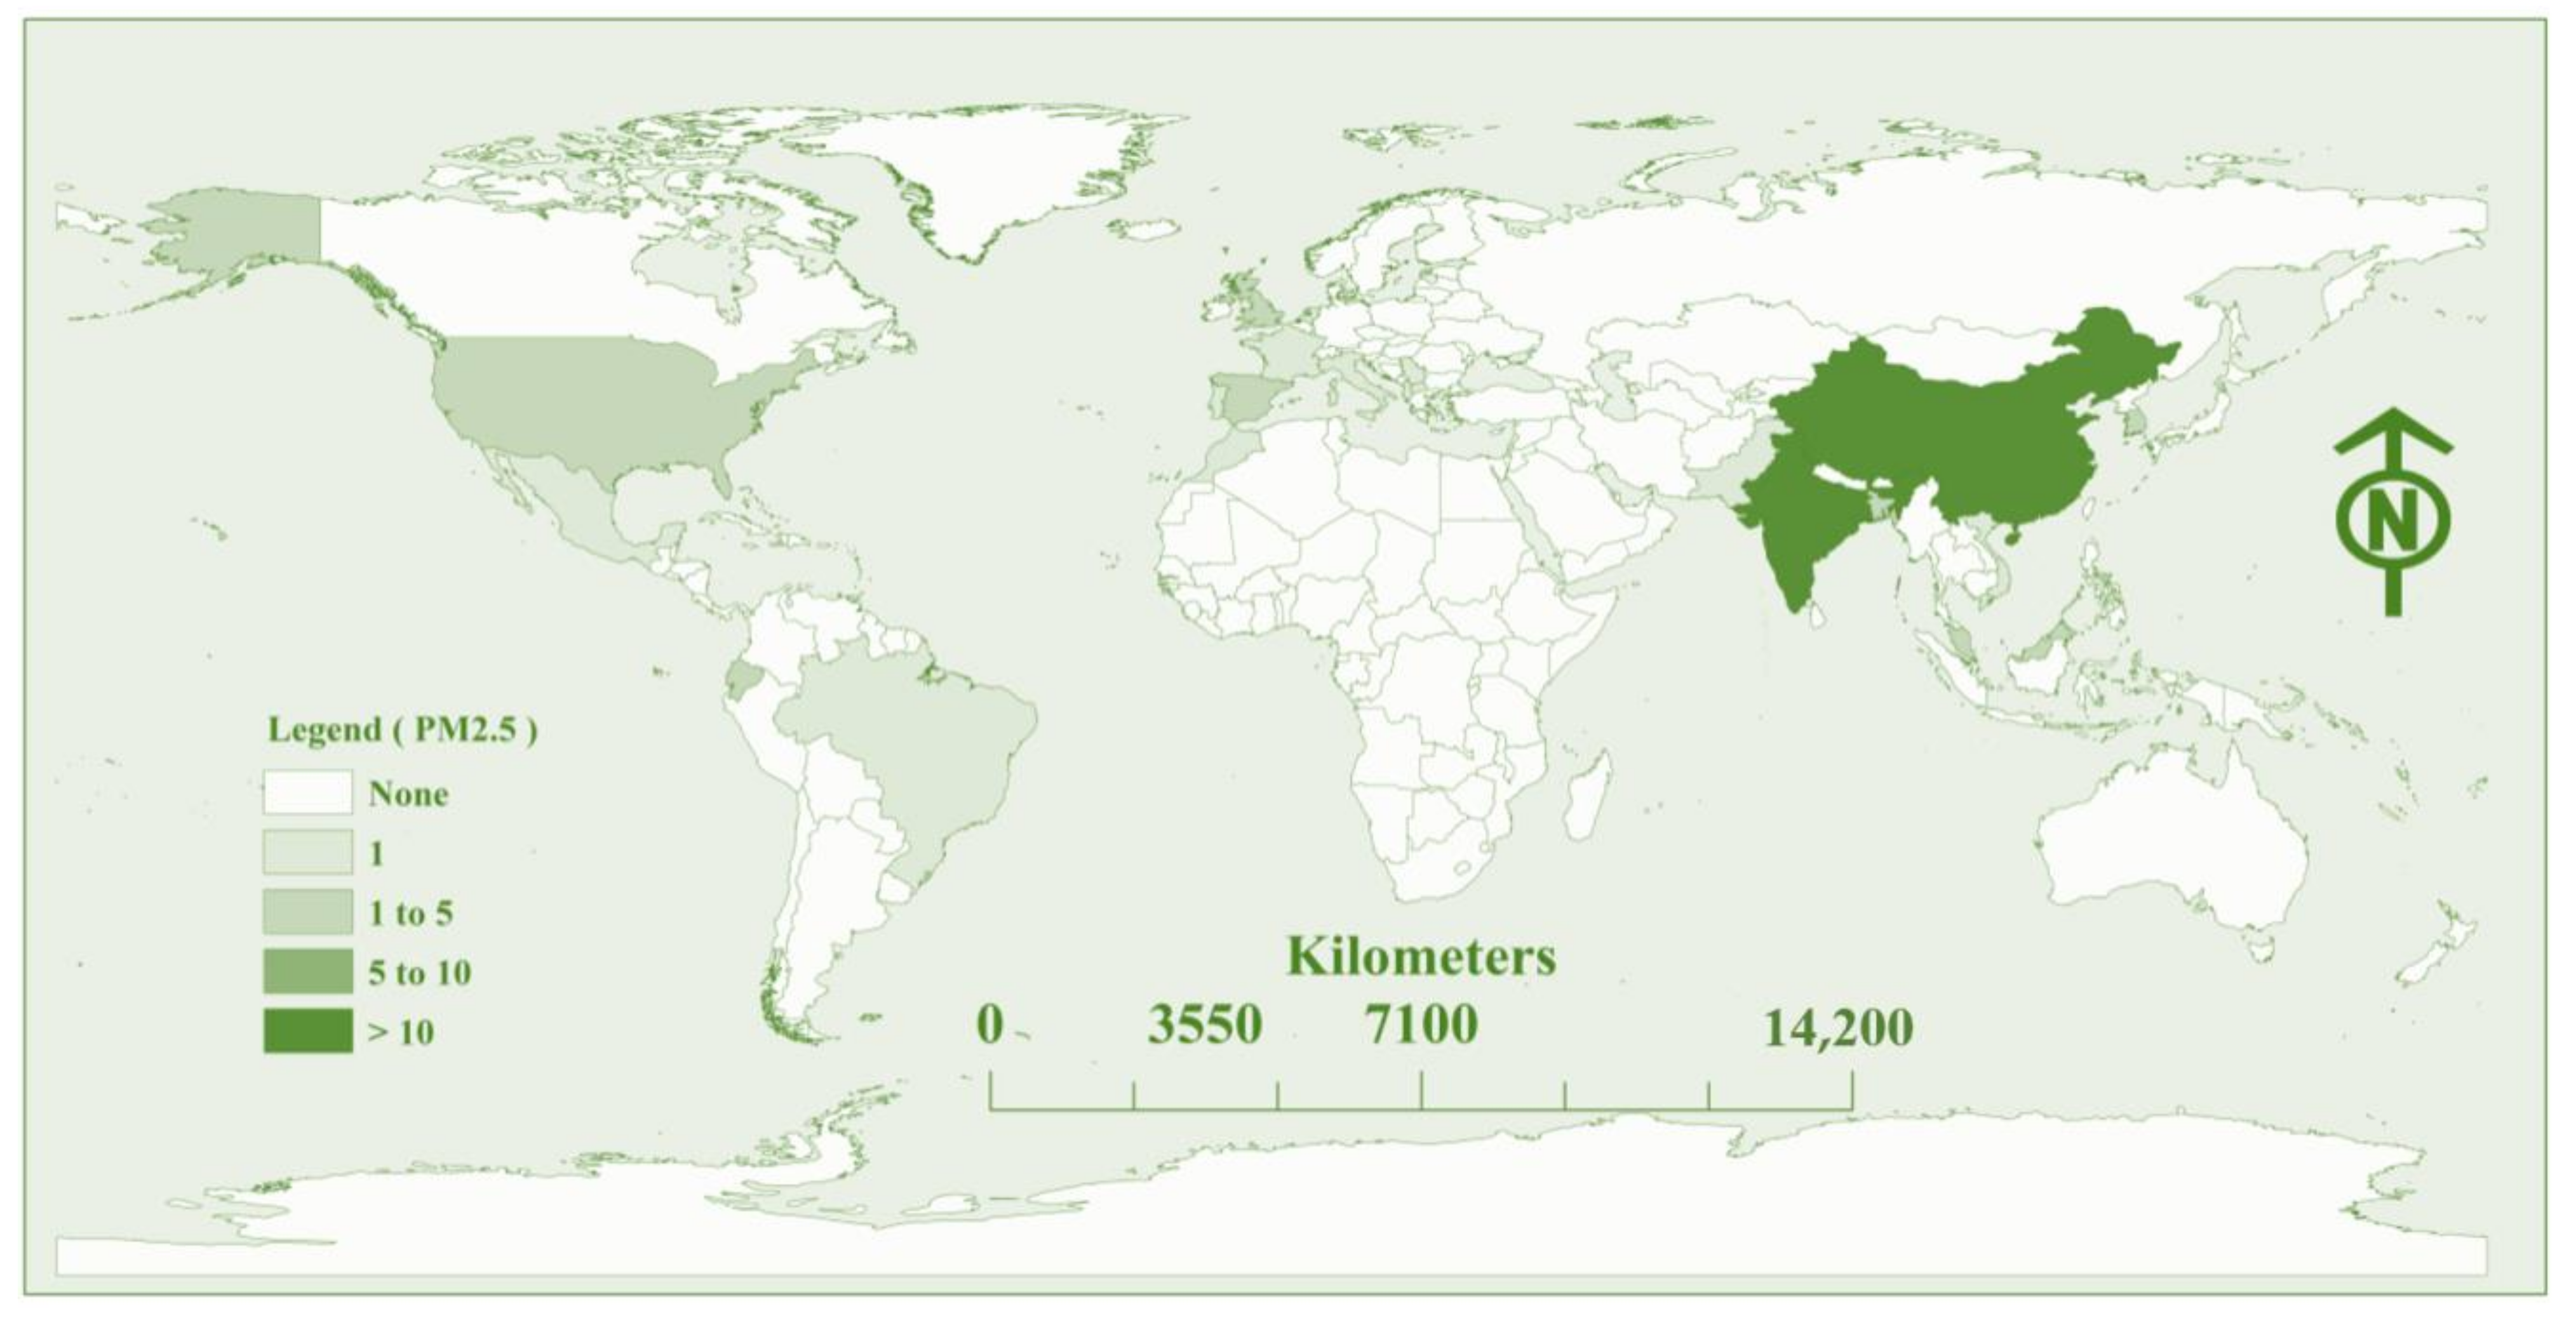
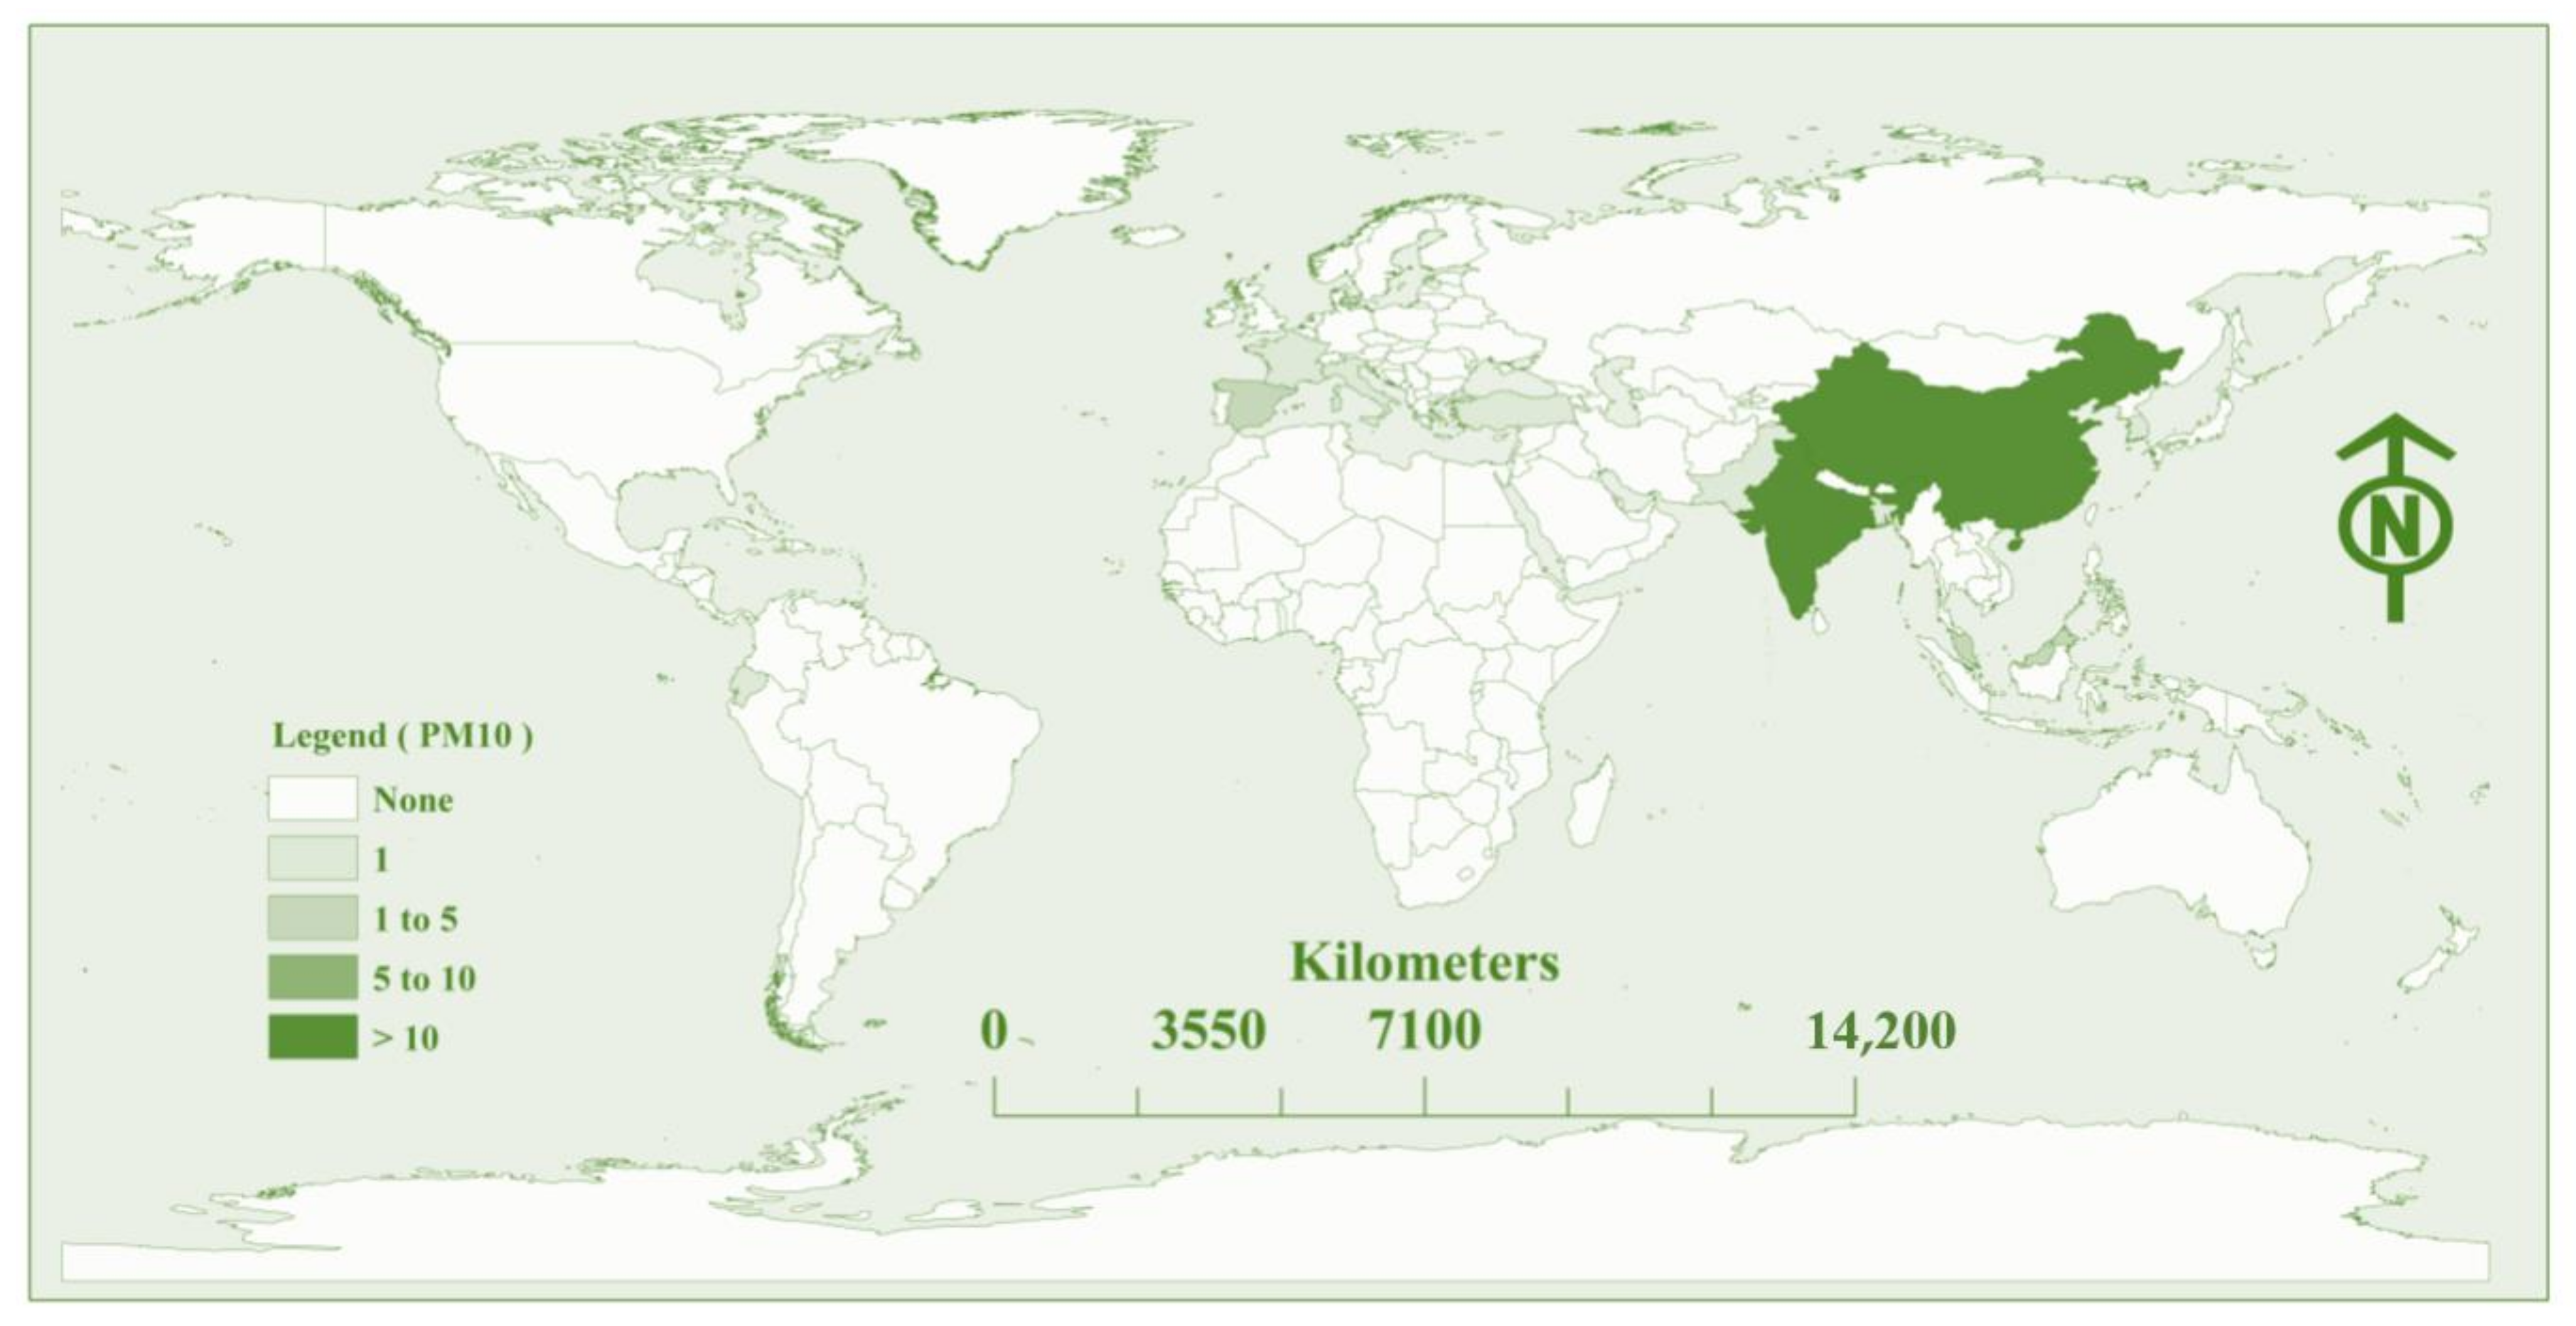
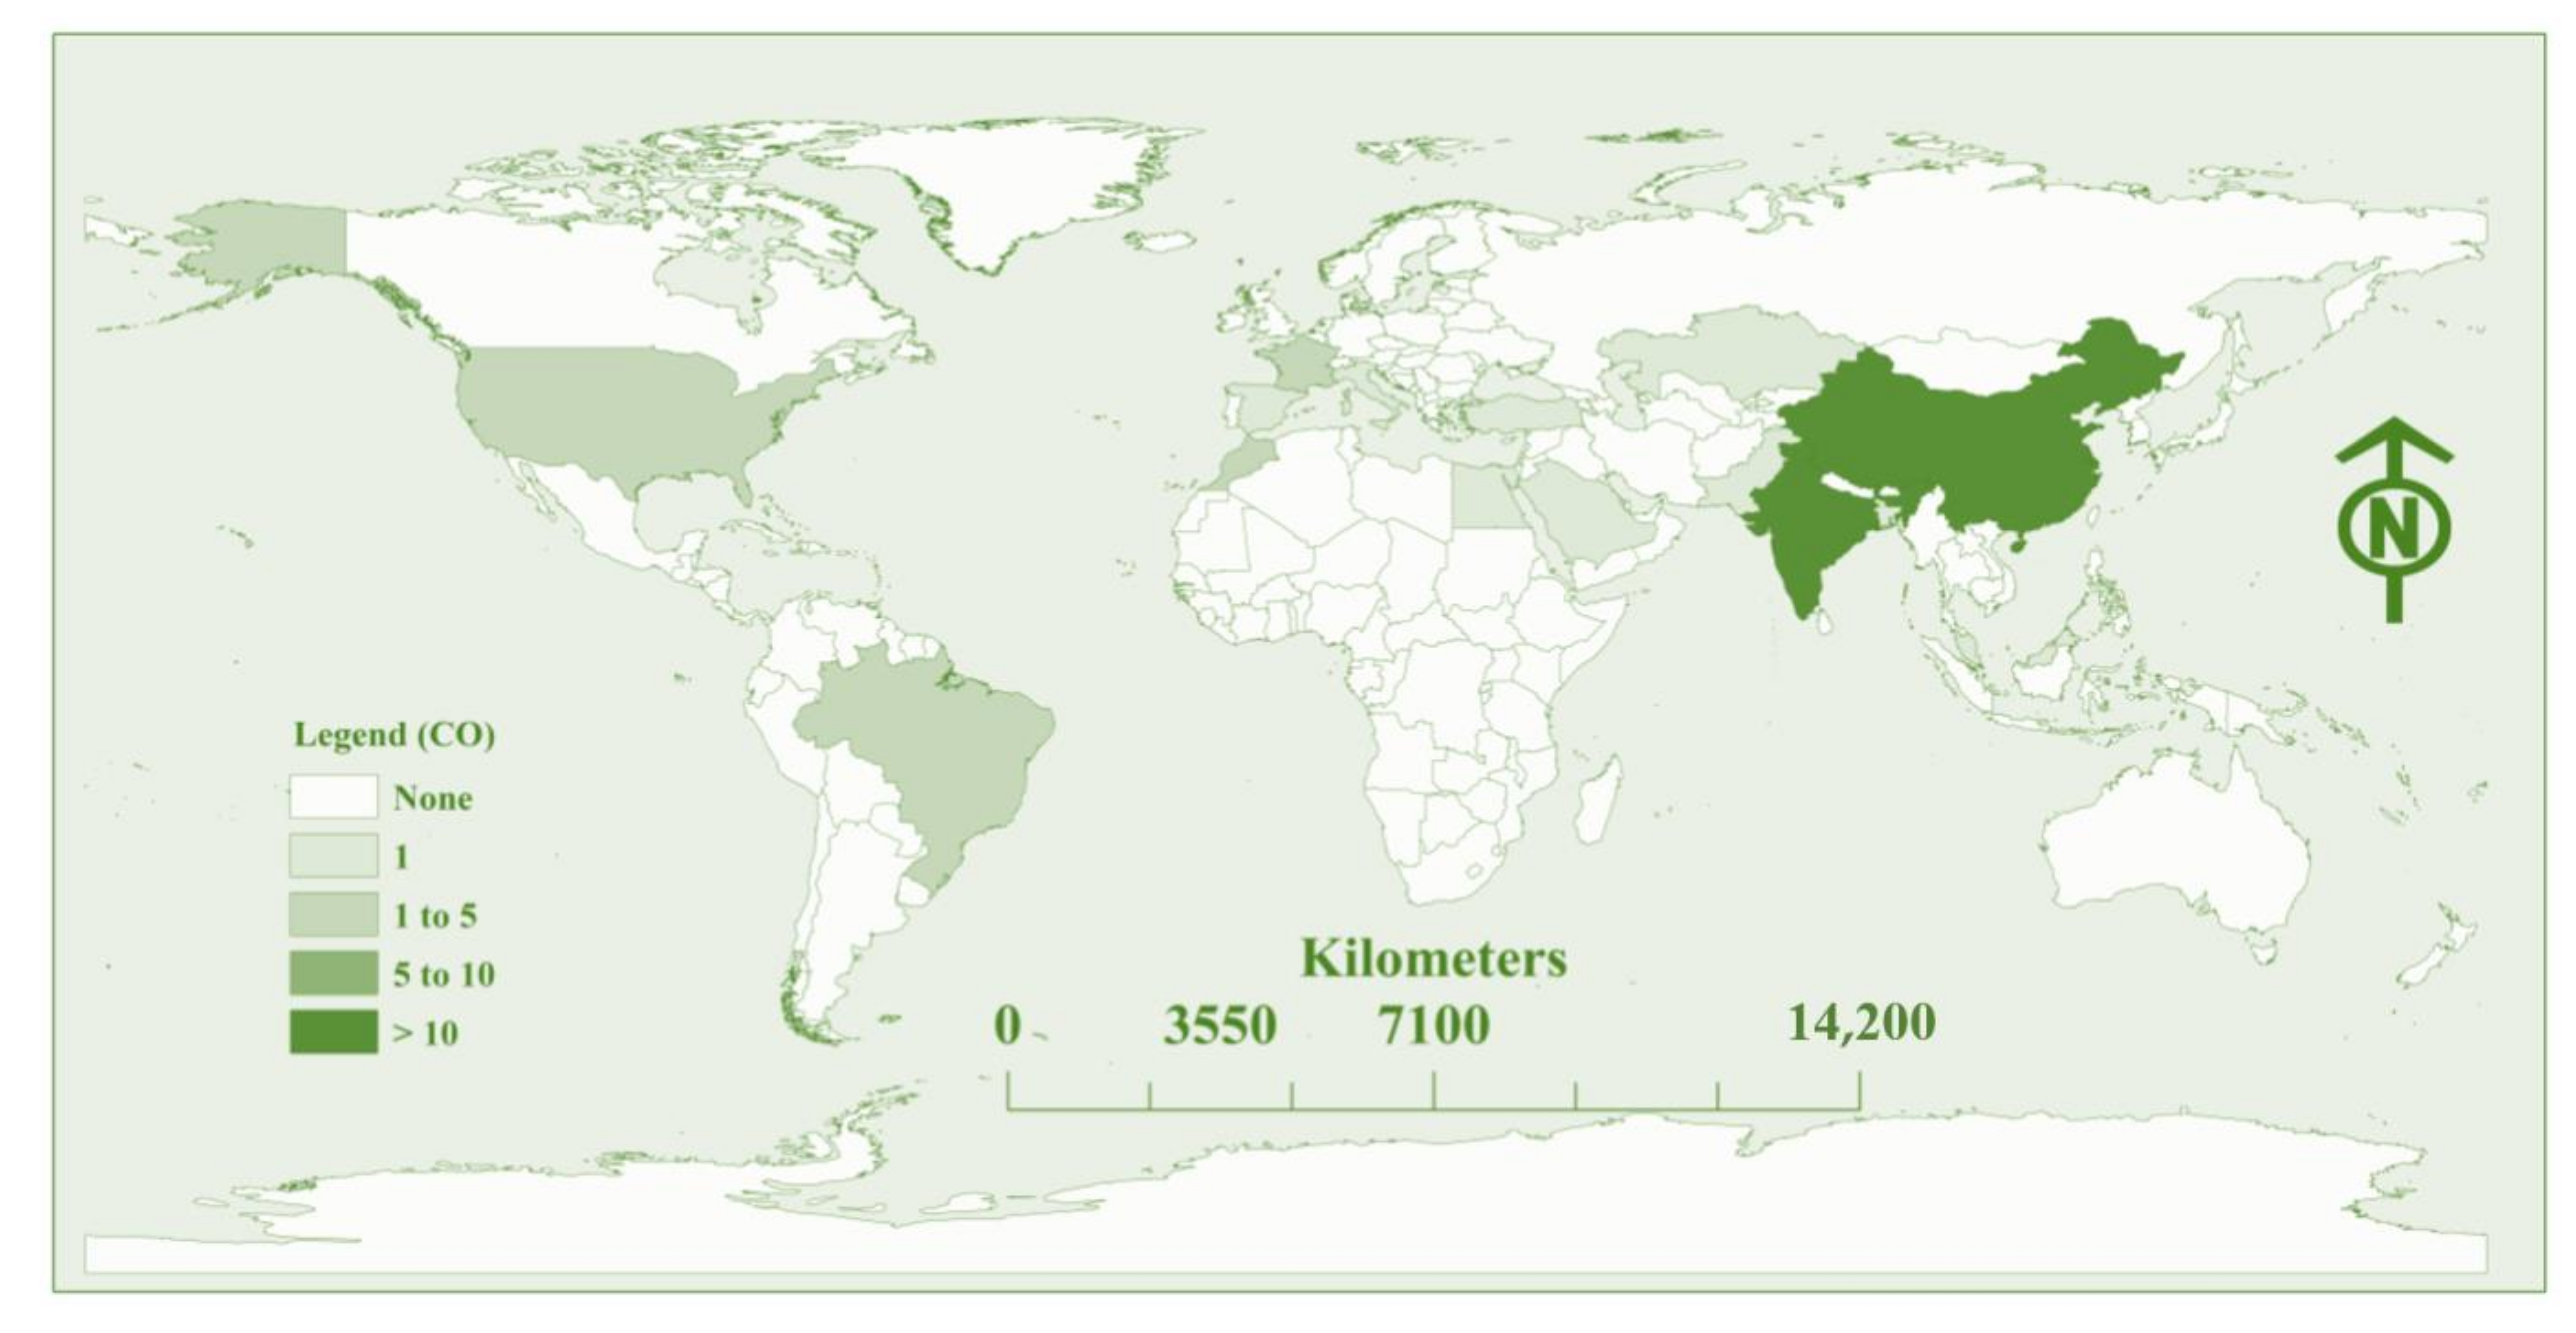
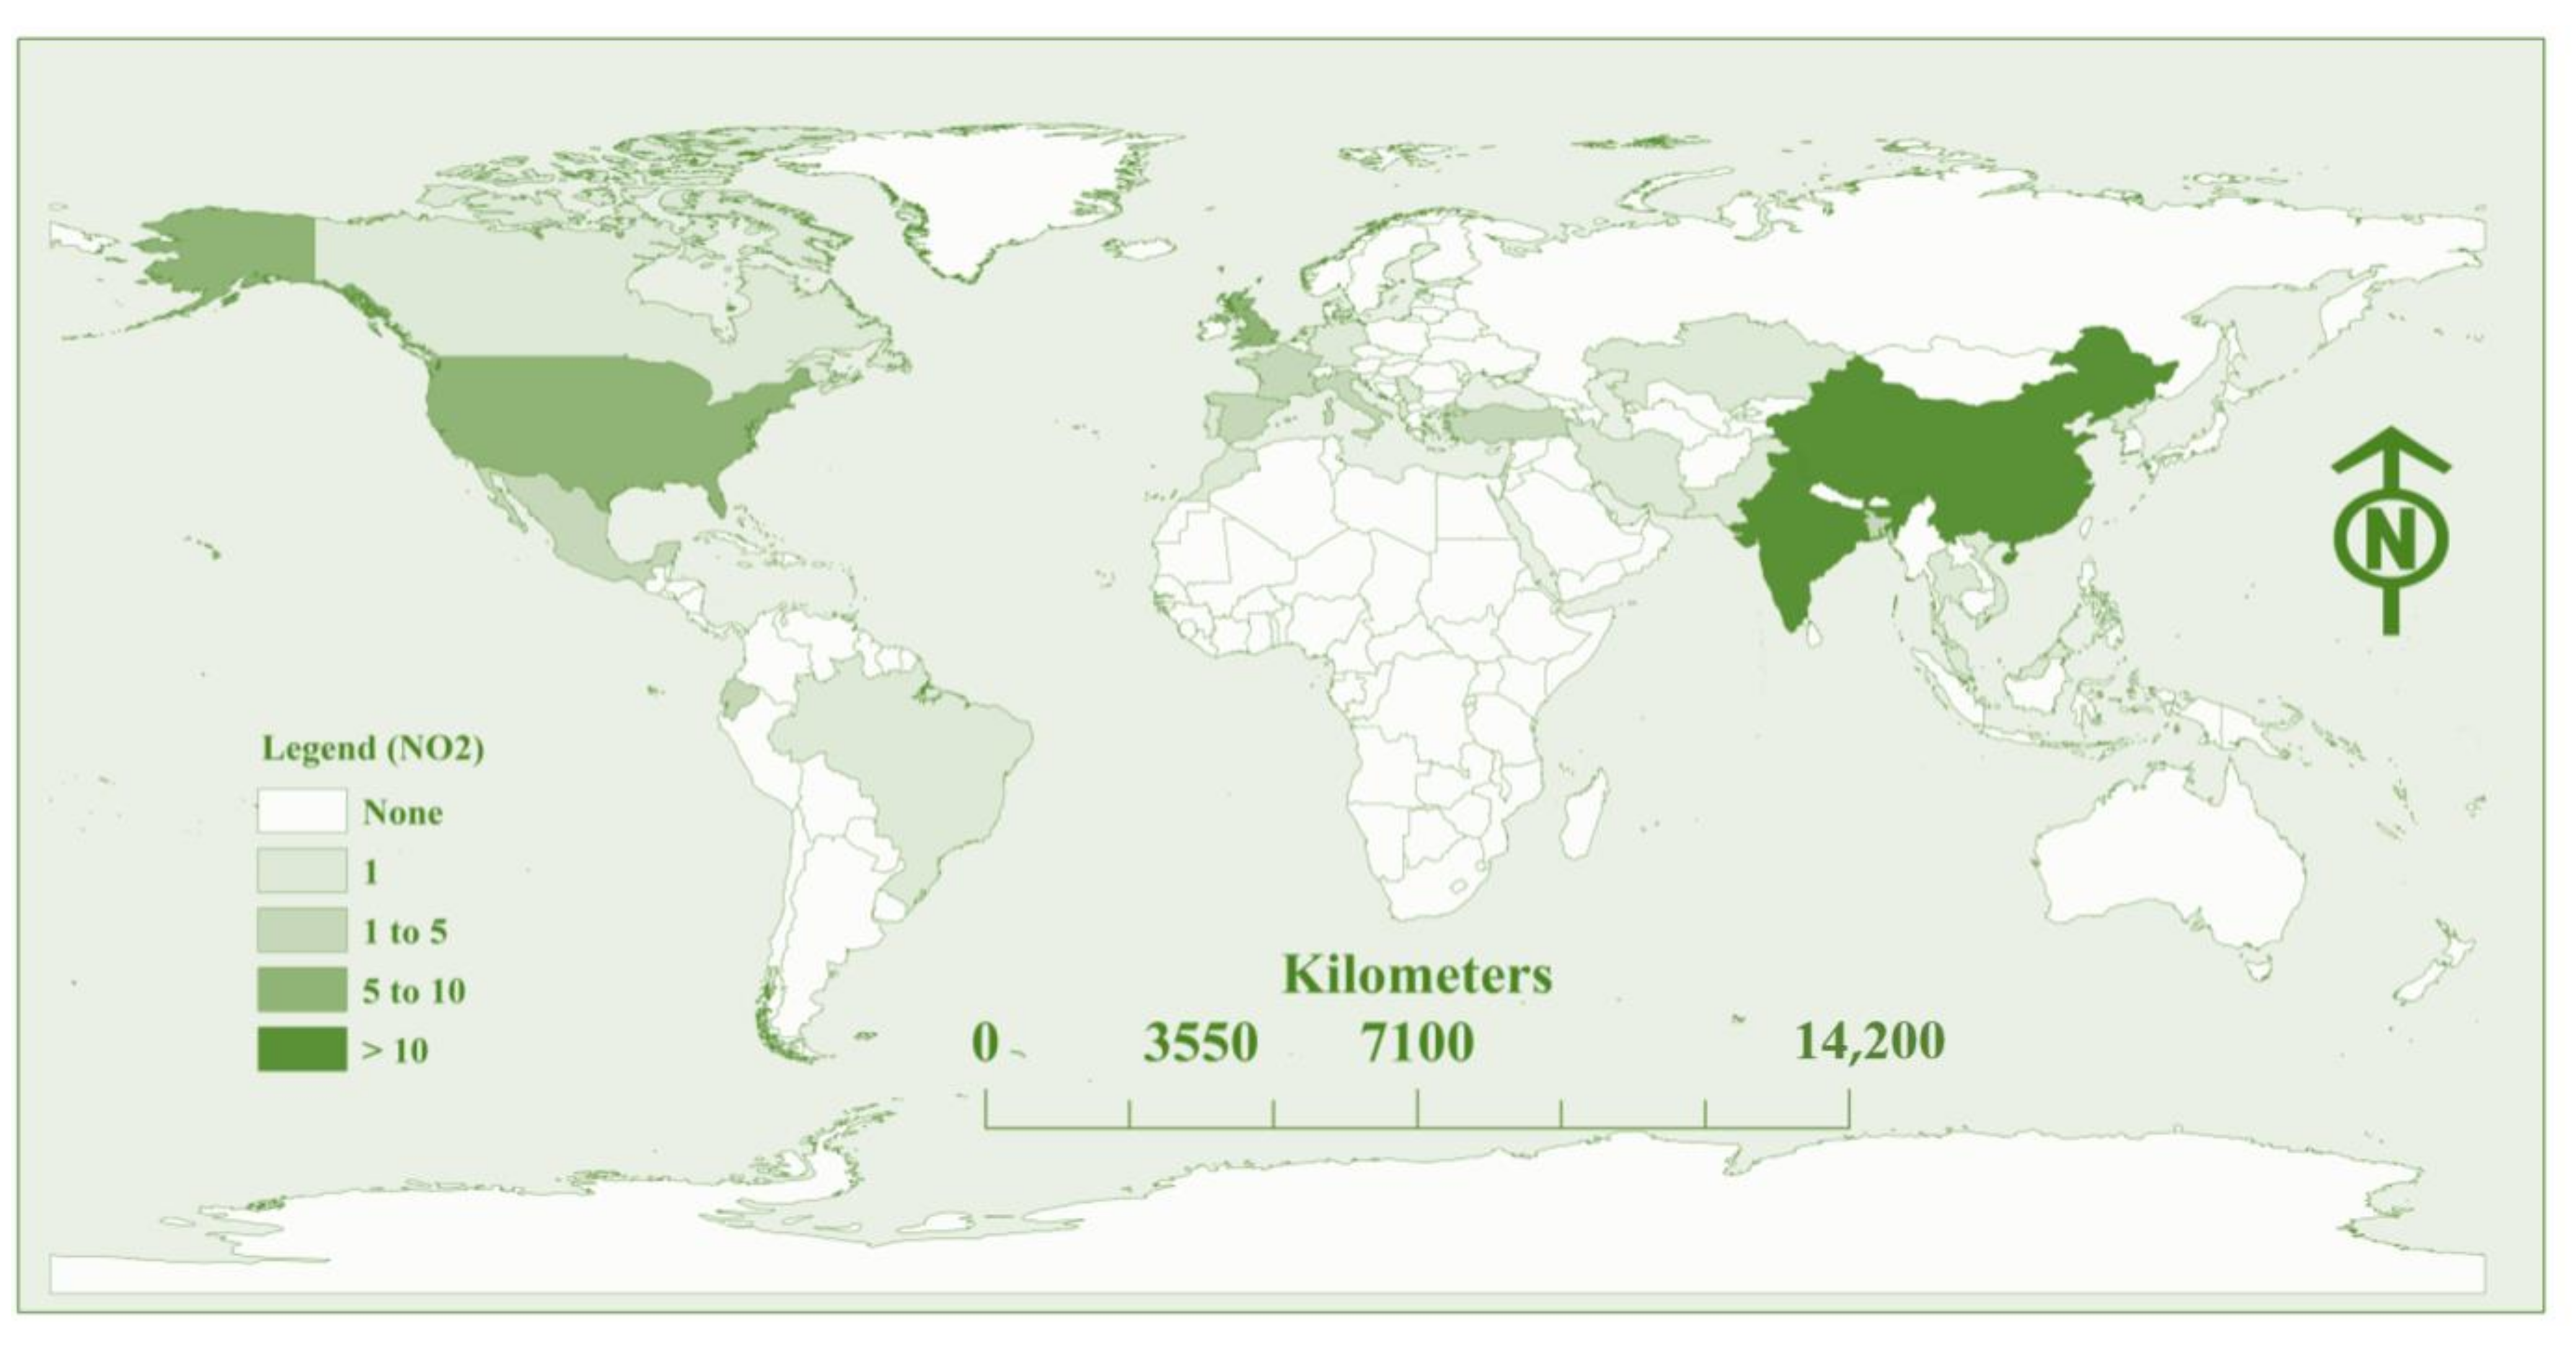
3.1. Geographical Distribution and COVID-19 Studies
3.2. Impact of COVID-19 on Air Quality over Asian Countries
3.3. Impact of COVID-19 on Air Quality over European Countries
3.4. Impact of COVID-19 on Air Quality over North American Countries
3.5. Impact of COVID-19 on Air Quality over South American Countries
3.6. Impact of COVID-19 on Air Quality over African Countries
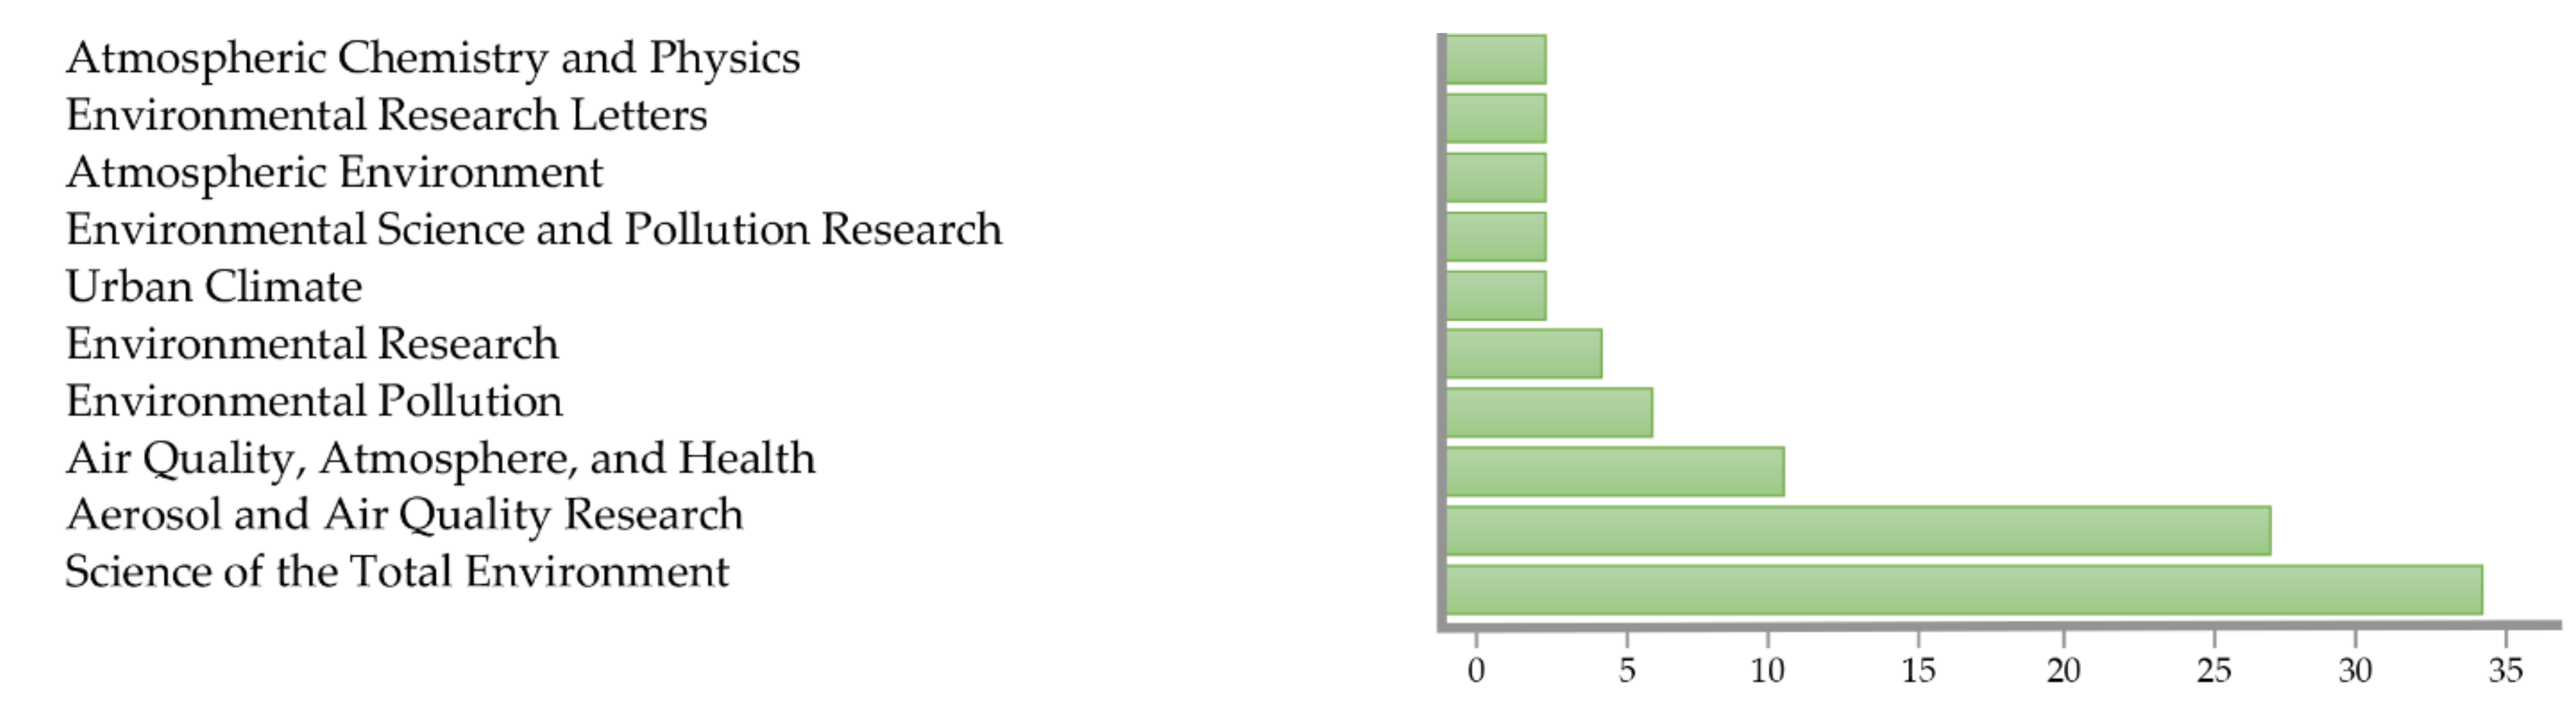
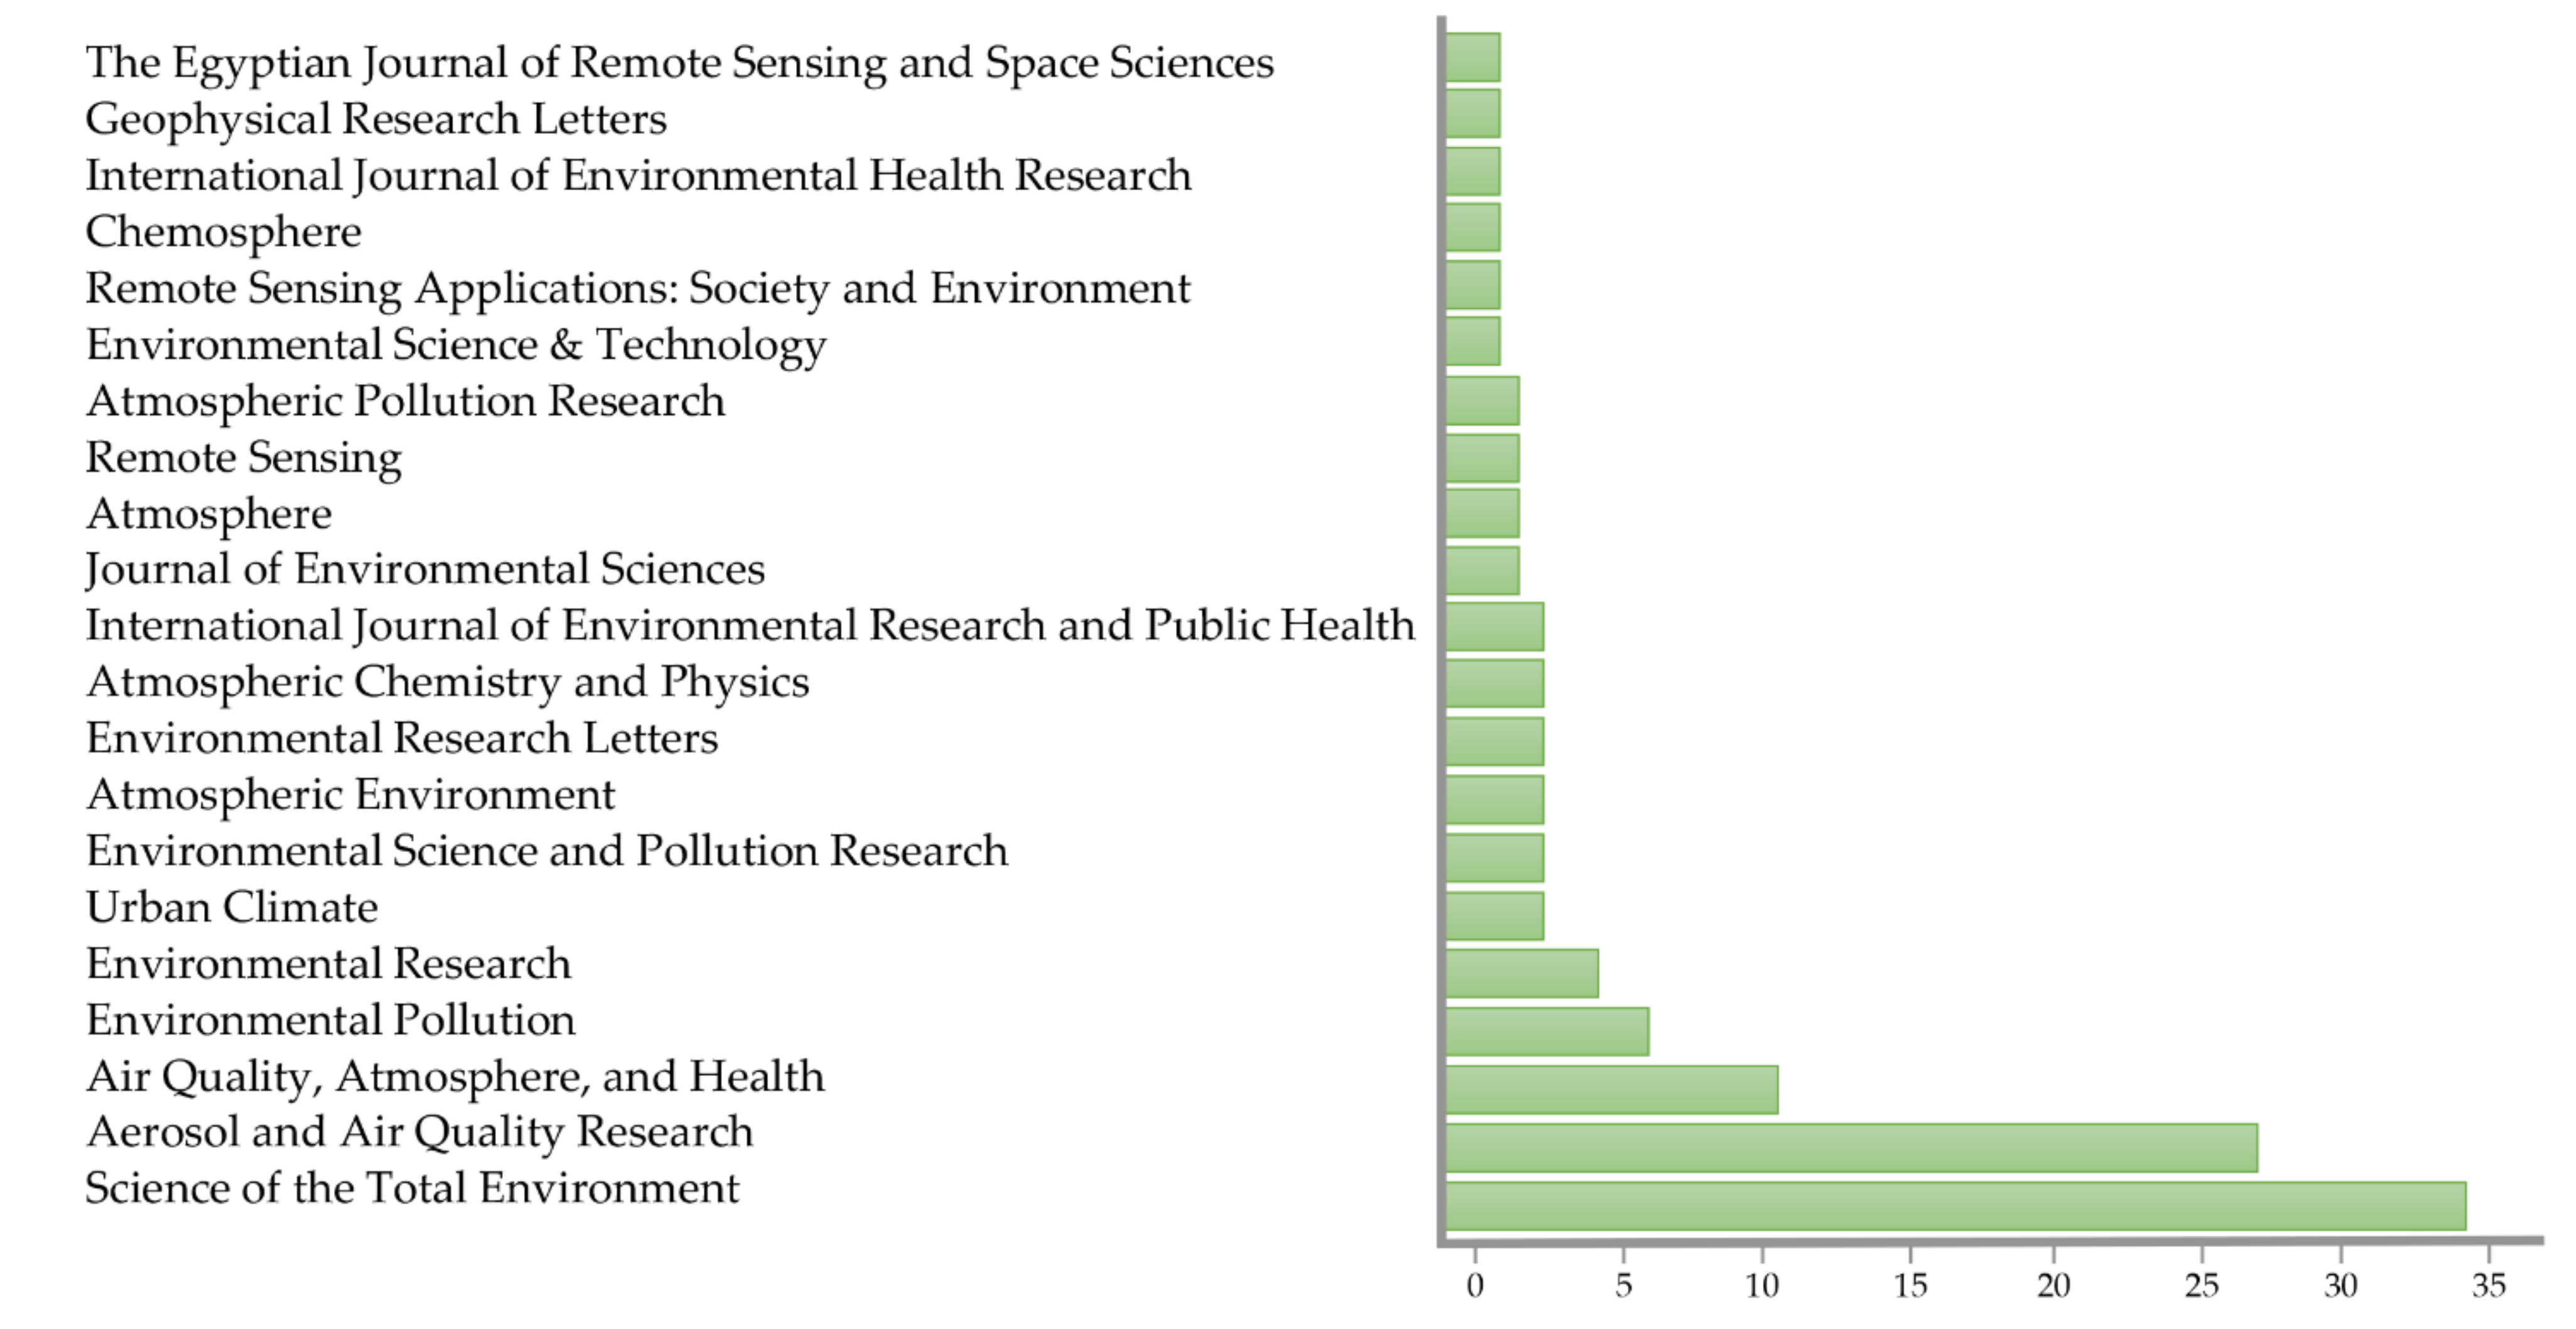
3.7. Number of Publications and Journal Distributions
4. Discussion
5. Conclusions
Author Contributions
Funding
Institutional Review Board Statement
Informed Consent Statement
Data Availability Statement
Conflicts of Interest
References
- World Health Organization. World Health Statistics 2016: Monitoring Health for the SDGs Sustainable Development Goals; World Health Organization: Geneva, Switzerland, 2016. [Google Scholar]
- Anenberg, S.; Horowitz, L.; Tong, D.; West, J.J. An Estimate of the Global Burden of Anthropogenic Ozone and Fine Particulate Matter on Premature Human Mortality Using Atmospheric Modeling. Environ. Health Perspect. 2010, 118, 1189–1195. [Google Scholar] [CrossRef] [PubMed]
- Krewski, D.; Jerrett, M.; Burnett, R.T.; Ma, R.; Hughes, E.; Shi, Y.; Turner, M.; Pope, C.; Thurston, G.; Calle, E.; et al. Extended Follow-Up and Spatial Analysis of the American Cancer Society Study Linking Particulate Air Pollution and Mortality; Health Effects Institute: Boston, MA, USA, 2009; pp. 5–114. [Google Scholar]
- Slama, R.; Darrow, L.; Parker, J.; Woodruff, T.J.; Strickland, M.; Nieuwenhuijsen, M.; Glinianaia, S.; Hoggatt, K.; Kannan, S.; Hurley, F.; et al. Meeting Report: Atmospheric Pollution and Human Reproduction. Environ. Health Perspect. 2008, 116, 791–798. [Google Scholar] [CrossRef] [Green Version]
- Smith, K.R.; Bruce, N.; Balakrishnan, K.; Adair-Rohani, H.; Balmes, J.; Chafe, Z.; Dherani, M.; Hosgood, H.; Mehta, S.; Pope, D.; et al. Millions dead: How do we know and what does it mean? Methods used in the comparative risk assessment of household air pollution. Annu. Rev. Public Health 2014, 35, 185–206. [Google Scholar] [CrossRef] [Green Version]
- Pedersen, M.; Giorgis-Allemand, L.; Bernard, C.; Aguilera, I.; Andersen AM, N.; Ballester, F.; Beelen, R.; Chatzi, L.; Cirach, M.; Danileviciute, A.; et al. Ambient air pollution and low birthweight: A European cohort study (ESCAPE). Lancet Respir. Med. 2013, 1, 695–704. [Google Scholar] [CrossRef]
- Pope, C.A.; Rodermund, D.L.; Gee, M.M. Mortality Effects of a Copper Smelter Strike and Reduced Ambient Sulfate Particulate Matter Air Pollution. Environ. Health Perspect. 2007, 115, 679–683. [Google Scholar] [CrossRef] [PubMed] [Green Version]
- Sun, Z.; Yang, L.; Bai, X.; Du, W.; Shen, G.; Fei, J.; Wang, Y.; Chen, A.; Chen, Y.; Zhao, M. Maternal ambient air pollution exposure with spatial-temporal variations and preterm birth risk assessment during 2013–2017 in Zhejiang Province, China. Environ. Int. 2019, 133, 105242. [Google Scholar] [CrossRef] [PubMed]
- Weinmayr, G.; Hennig, F.; Fuks, K.; Nonnemacher, M.; Jakobs, H.; Möhlenkamp, S.; Erbel, R.; Jöckel, K.; Hoffmann, B.; Moebus, S.; et al. Long-term exposure to fine particulate matter and incidence of type 2 diabetes mellitus in a cohort study: Effects of total and traffic-specific air pollution. Environ. Health 2015, 14, 1–8. [Google Scholar] [CrossRef] [Green Version]
- GBD. The Global Burden of Disease, 2018, GBD. In The Global Burden of Disease. Generating Evidence and Guiding Policy; Institute for Health Metrics and Evaluation: Seattle, WA, USA, 2018. [Google Scholar]
- Dantas, G.; Siciliano, B.; França, B.B.; da Silva, C.M.; Arbilla, G. The impact of COVID-19 partial lockdown on the air quality of the city of Rio de Janeiro, Brazil. Sci. Total Environ. 2020, 729, 139085. [Google Scholar] [CrossRef]
- Ibe, F.C.; Opara, A.I.; Duru, C.E.; Obinna, I.B.; Enedoh, M.C. Statistical analysis of atmospheric pollutant concentrations in parts of Imo State, Southeastern Nigeria. Sci. Afr. 2020, 7, e00237. [Google Scholar] [CrossRef]
- Otmani, A.; Benchrif, A.; Tahri, M.; Bounakhla, M.; Chakir, E.M.; El Bouch, M.; Krombi, M. Impact of Covid-19 lockdown on PM10, SO2 and NO2 concentrations in Salé City (Morocco). Sci. Total Environ. 2020, 735, 139541. [Google Scholar] [CrossRef] [PubMed]
- Tobías, A.; Carnerero, C.; Reche, C.; Massagué, J.; Via, M.; Minguillón, M.C.; Via, M.; Minguillón, M.; Alastuey, A.; Querol, X. Changes in air quality during the lockdown in Barcelona (Spain) one month into the SARS-CoV-2 epidemic. Sci. Total Environ. 2020, 726, 138540. [Google Scholar] [CrossRef]
- Nigam, R.; Pandy, K.; Luis, A.; Sengupta, R.; Kotha, M. Positive effects of COVID-19 lockdown on air quality of industrial cities (Ankleshwar and Vapi) of Western India. Sci. Rep. 2021, 11, 4285. [Google Scholar] [CrossRef] [PubMed]
- Navinya, C.; Patidar, G.; Phuleria, H.C. Examining effects of the COVID-19 national lockdown on ambient air quality across urban India. Aerosol Air Qual. Res. 2020, 20, 1759–1771. [Google Scholar] [CrossRef]
- Sikarwar, A.; Rani, R. Assessing the Immediate Effect of Covid-19 Lockdown on Air Quality: A Case Study of Delhi, India. J. Environ. Geogr. 2020, 13, 27–33. [Google Scholar] [CrossRef]
- Singh, R.P.; Chauhan, A. Impact of lockdown on air quality in India during COVID-19 pandemic. Air Qual. Atmos. Health 2020, 13, 921–928. [Google Scholar] [CrossRef]
- Zhang, J.; Cui, K.; Wang, Y.F.; Wu, J.L.; Huang, W.S.; Wan, S.; Xu, K. Temporal Variations in the Air Quality Index and the Impact of the COVID-19 Event on Air Quality in Western China. Aerosol Air Qual. Res. 2020, 20, 1552–1568. [Google Scholar] [CrossRef]
- Querol, X.; Massagué, J.; Alastuey, A.; Moreno, T.; Gangoiti, G.; Mantilla, E.; Duéguez, J.; Escudero, M.; Monfortf, E.; García-Pando, C.P.; et al. Lessons from the COVID-19 air pollution decrease in Spain: Now what? Sci. Total Environ. 2021, 779, 146380. [Google Scholar] [CrossRef] [PubMed]
- Collivignarelli, M.C.; Abbà, A.; Bertanza, G.; Pedrazzani, R.; Ricciardi, P.; Miino, M.C. Lockdown for CoViD-2019 in Milan: What are the effects on air quality? Sci. Total Environ. 2020, 732, 139280. [Google Scholar] [CrossRef]
- Mostafa, M.K.; Gamal, G.; Wafiq, A. The impact of COVID 19 on air pollution levels and other environmental indicators—A case study of Egypt. J. Environ. Manag. 2021, 277, 111496. [Google Scholar] [CrossRef] [PubMed]
- Singh, V.; Singh, S.; Biswal, A.; Kesarkar, A.P.; Mor, S.; Ravindra, K. Diurnal and temporal changes in air pollution during COVID-19 strict lockdown over different regions of India. Environ. Pollut. 2020, 266, 115368. [Google Scholar] [CrossRef]
- Chen, L.-W.A.; Chien, L.-C.; Li, Y.; Lin, G. Nonuniform impacts of COVID-19 lockdown on air quality over the United States. Sci. Total Environ. 2020, 745, 141105. [Google Scholar] [CrossRef] [PubMed]
- Islam, S.; Rahman, M.; Tusher, T.R.; Roy, S.; Razi, M.A. Assessing the Relationship between COVID-19, Air Quality, and Meteorological Variables: A Case Study of Dhaka City in Bangladesh. Aerosol Air Qual. Res. 2021, 21, 200609. [Google Scholar] [CrossRef]
- Muhammad, S.; Long, X.; Salman, M. COVID-19 pandemic and environmental pollution: A blessing in disguise? Sci. Total Environ. 2020, 728, 138820. [Google Scholar] [CrossRef] [PubMed]
- Wang, Q.; Su, M. A preliminary assessment of the impact of COVID-19 on environment—A case study of China. Sci. Total Environ. 2020, 728, 138915. [Google Scholar] [CrossRef]
- Saadat, S.; Rawtani, D.; Hussain, C.M. Environmental perspective of COVID-19. Sci. Total Environ. 2020, 728, 138870. [Google Scholar] [CrossRef]
- NASA. Airborne Nitrogen Dioxide Plummets over China. 2020. Available online: https://earthobservatory.nasa.gov/images/146362/airborne-nitrogen-dioxide-plummets-over-china (accessed on 28 April 2020).
- Moher, D.; Liberati, A.; Tetzlaff, J.; Altman, D.G.; The PRISMA Group. Preferred Reporting Items for Systematic Reviews and Meta-Analyses: The PRISMA Statement. PLoS Med. 2009, 6, e1000097. [Google Scholar] [CrossRef] [PubMed] [Green Version]
- Naqvi, H.R.; Datta, M.; Mutreja, G.; Siddiqui, M.A.; Naqvi, D.F.; Naqvi, A.R. Improved air quality and associated mortalities in India under COVID-19 lockdown. Environ. Pollut. 2021, 268, 115691. [Google Scholar] [CrossRef]
- Mor, S.; Kumar, S.; Singh, T.; Dogra, S.; Pandey, V.; Ravindra, K. Impact of COVID-19 lockdown on air quality in Chandigarh, India: Understanding the emission sources during controlled anthropogenic activities. Chemosphere 2021, 263, 127978. [Google Scholar] [CrossRef]
- Eregowda, T.; Chatterjee, P.; Pawar, D.S. Impact of lockdown associated with COVID19 on air quality and emissions from transportation sector: Case study in selected Indian metropolitan cities. Environ. Syst. Decis. 2021, 41, 401–412. [Google Scholar] [CrossRef]
- Mahato, S.; Pal, S.; Ghosh, K.G. Effect of lockdown amid COVID-19 pandemic on air quality of the megacity Delhi, India. Sci. Total Environ. 2020, 730, 139086. [Google Scholar] [CrossRef]
- Bedi, J.S.; Dhaka, P.; Vijay, D.; Aulakh, R.S.; Gill, J.P.S. Assessment of Air Quality Changes in the Four Metropolitan Cities of India during COVID-19 Pandemic Lockdown. Aerosol Air Qual. Res. 2020, 20, 2062–2070. [Google Scholar] [CrossRef]
- Shehzad, K.; Sarfraz, M.; Shah, S.G.M. The impact of COVID-19 as a necessary evil on air pollution in India during the lockdown. Environ. Pollut. 2020, 266, 115080. [Google Scholar] [CrossRef] [PubMed]
- Gautam, S. COVID-19: Air pollution remains low as people stay at home. Air Qual. Atmos. Health 2020, 13, 853–857. [Google Scholar] [CrossRef]
- Rahman, S.; Azad, A.K.; Hasanuzzaman; Salam, R.; Islam, A.R.M.T.; Rahman, M.; Hoque, M.M.M. How air quality and COVID-19 transmission change under different lockdown scenarios? A case from Dhaka city, Bangladesh. Sci. Total Environ. 2021, 762, 143161. [Google Scholar] [CrossRef]
- Mitra, A.; Chaudhuri, T.R.; Mitra, A.; Pramanick, P.; Zaman, S.; Mitra, A.; Zaman, S. Impact of COVID-19 related shutdown on atmospheric carbon dioxide level in the city of Kolkata. Parana J. Sci. Educ. 2020, 6, 84–92. [Google Scholar]
- Roy, S.S.; Balling, R.C. Impact of the COVID-19 lockdown on air quality in the Delhi Metropolitan Region. Appl. Geogr. 2021, 128, 102418. [Google Scholar] [CrossRef]
- Goel, A. Impact of the COVID-19 Pandemic on the Air Quality in Delhi, India. Nat. Environ. Pollut. Technol. 2020, 19, 1095–1103. [Google Scholar] [CrossRef]
- Chakrabortty, R.; Pal, S.C.; Ghosh, M.; Arabameri, A.; Saha, A.; Roy, P.; Pradhan, B.; Mondal, A.; Ngo, P.; Chowdhuri, I.; et al. Weather indicators and improving air quality in association with COVID-19 pandemic in India. Soft Comput. 2021, 25, 1–22. [Google Scholar] [CrossRef]
- Das, M.; Das, A.; Sarkar, R.; Saha, S.; Mandal, A. Examining the impact of lockdown (due to COVID-19) on ambient aerosols (PM2.5): A study on Indo-Gangetic Plain (IGP) Cities, India. Stoch. Environ. Res. Risk Assess. 2021, 35, 1301–1317. [Google Scholar] [CrossRef] [PubMed]
- Das, M.; Das, A.; Ghosh, S.; Sarkar, R.; Saha, S. Spatio-temporal concentration of atmospheric particulate matter (PM2.5) during pandemic: A study on most polluted cities of indo-gangetic plain. Urban Clim. 2021, 35, 100758. [Google Scholar] [CrossRef]
- Das, M.; Das, A.; Sarkar, R.; Saha, S.; Mandal, P. Regional scenario of air pollution in lockdown due to COVID-19 pandemic: Evidence from major urban agglomerations of India. Urban Clim. 2021, 37, 100821. [Google Scholar] [CrossRef]
- Aman, M.A.; Salman, M.S.; Yunus, A.P. COVID-19 and its impact on environment: Improved pollution levels during the lockdown period—A case from Ahmedabad, India. Remote. Sens. Appl. Soc. Environ. 2020, 20, 100382. [Google Scholar] [CrossRef]
- Biswal, A.; Singh, V.; Singh, S.; Kesarkar, A.P.; Ravindra, K.; Sokhi, R.S.; Chipperfield, M.; Dhomse, S.; Pope, R.; Singh, T.; et al. COVID-19 lockdown-induced changes in NO 2 levels across India observed by multi-satellite and surface observations. Atmos. Chem. Phys. 2021, 21, 5235–5251. [Google Scholar] [CrossRef]
- Biswas, M.S.; Choudhury, A.D. Impact of COVID-19 Control Measures on Trace Gases (NO2, HCHO and SO2) and Aerosols over India during Pre-monsoon of 2020. Aerosol Air Qual. Res. 2021, 21, 200306. [Google Scholar] [CrossRef]
- Datta, A.; Rahman, H.; Suresh, R. Did the COVID-19 lockdown in Delhi and Kolkata improve the ambient air quality of the two cities? J. Environ. Qual. 2021, 50, 485–493. [Google Scholar] [CrossRef]
- Dhaka, S.K.; Kumar, V.; Panwar, V.; Dimri, A.P.; Singh, N.; Patra, P.K.; Matsumi, Y.; Takigawa, M.; Nakayama, T.; Hayashida, S. PM2.5 diminution and haze events over Delhi during the COVID-19 lockdown period: An interplay between the baseline pollution and meteorology. Sci. Rep. 2020, 10, 1–8. [Google Scholar] [CrossRef]
- Dutta, A.; Jinsart, W. Air Quality, Atmospheric Variables and Spread of COVID-19 in Delhi (India): An Analysis. Aerosol Air Qual. Res. 2021, 21, 200417. [Google Scholar] [CrossRef]
- Siddiqui, A.; Halder, S.; Chauhan, P.; Kumar, P. COVID-19 Pandemic and City-Level Nitrogen Dioxide (NO2) Reduction for Urban Centres of India. J. Indian Soc. Remote. Sens. 2020, 48, 1–8. [Google Scholar] [CrossRef]
- Sharma, S.; Zhang, M.; Gao, J.; Zhang, H.; Kota, S.H. Effect of restricted emissions during COVID-19 on air quality in India. Sci. Total Environ. 2020, 728, 138878. [Google Scholar] [CrossRef]
- Jain, S.; Sharma, T. Social and Travel Lockdown Impact Considering Coronavirus Disease (COVID-19) on Air Quality in Megacities of India: Present Benefits, Future Challenges and Way Forward. Aerosol Air Qual. Res. 2020, 20, 1222–1236. [Google Scholar] [CrossRef]
- Kumar, P.; Hama, S.; Omidvarborna, H.; Sharma, A.; Sahani, J.; Abhijith, K.V.; Debele, S.; Zavala-Reyes, J.; Barwise, Y.; Tiwari, A. Temporary reduction in fine particulate matter due to ‘anthropogenic emissions switch-off’during COVID-19 lockdown in Indian cities. Sustain. Cities Soc. 2020, 62, 102382. [Google Scholar] [CrossRef] [PubMed]
- Kumari, P.; Toshniwal, D. Impact of lockdown measures during COVID-19 on air quality–A case study of India. Int. J. Environ. Health Res. 2020, 31, 1–8. [Google Scholar] [CrossRef]
- Lal, P.; Kumar, A.; Bharti, S.; Saikia, P.; Adhikari, D.; Khan, M. Lockdown to Contain the COVID-19 Pandemic: An Opportunity to Create a Less Polluted Environment in India. Aerosol Air Qual. Res. 2021, 21, 200229. [Google Scholar] [CrossRef]
- Garg, A.; Kumar, A.; Gupta, N.C. Impact of Lockdown on Ambient Air Quality in COVID-19 Affected Hotspot Cities of India: Need to Readdress Air Pollution Mitigation Policies. Environ. Claims J. 2021, 33, 65–76. [Google Scholar] [CrossRef]
- Yuan, Q.; Qi, B.; Hu, D.; Wang, J.; Zhang, J.; Yang, H.; Zhang, S.; Liu, L.; Xu, L.; Li, W. Spatiotemporal variations and reduction of air pollutants during the COVID-19 pandemic in a megacity of Yangtze River Delta in China. Sci. Total Environ. 2021, 751, 141820. [Google Scholar] [CrossRef]
- Zheng, H.; Kong, S.; Chen, N.; Yan, Y.; Liu, D.; Zhu, B.; Xu, K.; Cao, W.; Ding, Q.; Lan, B.; et al. Significant changes in the chemical compositions and sources of PM2.5 in Wuhan since the city lockdown as COVID-19. Sci. Total Environ. 2020, 739, 140000. [Google Scholar] [CrossRef]
- He, G.; Pan, Y.; Tanaka, T. The short-term impacts of COVID-19 lockdown on urban air pollution in China. Nat. Sustain. 2020, 3, 1005–1011. [Google Scholar] [CrossRef]
- Ji, J.; Chang, R. Air quality changes and Grey relational analysis of pollutants exceeding standards during the COVID-19 pandemic in Wuhan. Res. Sq. 2020. [Google Scholar] [CrossRef]
- Miller, P.; Reesman, C.; Grossman, M.; Nelson, S.; Liu, V.; Wang, P. Marginal warming associated with a COVID-19 quarantine and the implications for disease transmission. Sci. Total Environ. 2021, 780, 146579. [Google Scholar] [CrossRef]
- Wang, N.; Xu, J.; Pei, C.; Tang, R.; Zhou, D.; Chen, Y.; Li, M.; Deng, X.; Deng, T.; Huang, X.; et al. Air Quality During COVID-19 Lockdown in the Yangtze River Delta and the Pearl River Delta: Two Different Responsive Mechanisms to Emission Reductions in China. Environ. Sci. Technol. 2021, 55, 5721–5730. [Google Scholar] [CrossRef]
- Feng, H.; Ning, E.; Feng, H.; Li, J.; Wang, Q. Impact of COVID-19 on Air Quality in Central and Eastern China. Res. Sq. 2021. [Google Scholar] [CrossRef]
- Ming, W.; Zhou, Z.; Ai, H.; Bi, H.; Zhong, Y. COVID-19 and Air Quality: Evidence from China. Emerg. Mark. Finance Trade 2020, 56, 2422–2442. [Google Scholar] [CrossRef]
- Zhang, K.; De Leeuw, G.; Yang, Z.; Chen, X.; Jiao, J. The Impacts of the COVID-19 Lockdown on Air Quality in the Guanzhong Basin, China. Remote. Sens. 2020, 12, 3042. [Google Scholar] [CrossRef]
- Filonchyk, M.; Yan, H.; Hurynovich, V.; Wang, Z. Impact of COVID-19 pandemic on air quality changes in Shanghai, China. Environ. Forensics 2021, 1–6. [Google Scholar] [CrossRef]
- Silver, B.; He, X.; Arnold, S.R.; Spracklen, D.V. The impact of COVID-19 control measures on air quality in China. Environ. Res. Lett. 2020, 15, 084021. [Google Scholar] [CrossRef]
- E Marlier, M.; Xing, J.; Zhu, Y.; Wang, S. Impacts of COVID-19 response actions on air quality in China. Environ. Res. Commun. 2020, 2, 075003. [Google Scholar] [CrossRef]
- Xu, K.; Cui, K.; Young, L.-H.; Wang, Y.-F.; Hsieh, Y.-K.; Wan, S.; Zhang, J. Air Quality Index, Indicatory Air Pollutants and Impact of COVID-19 Event on the Air Quality near Central China. Aerosol Air Qual. Res. 2020, 20, 1204–1221. [Google Scholar] [CrossRef] [Green Version]
- Tang, R.; Huang, X.; Zhou, D.; Wang, H.; Xu, J.; Ding, A. Global air quality change during the COVID-19 pandemic: Regionally different ozone pollution responses COVID-19. Atmos. Ocean. Sci. Lett. 2021, 14, 100015. [Google Scholar] [CrossRef]
- Su, Z.; Duan, Z.; Deng, B.; Liu, Y.; Chen, X. Impact of the COVID-19 Lockdown on Air Quality Trends in Guiyang, Southwestern China. Atmosphere 2021, 12, 422. [Google Scholar] [CrossRef]
- Han, Y.; Lam, J.C.; Li, V.O.; Guo, P.; Zhang, Q.; Wang, A.; Crowcroft, J.; Gozes, I.; Fu, J.; Gilani, Z.; et al. Outdoor Air Pollutant Concentration and COVID-19 Infection in Wuhan, China. medRxiv 2020. [Google Scholar] [CrossRef]
- Chen, J.; Hu, H.; Wang, F.; Zhang, M.; Zhou, T.; Yuan, S.; Bai, R.; Chen, N.; Xu, K.; Huang, H. Air quality characteristics in Wuhan (China) during the 2020 COVID-19 pandemic. Environ. Res. 2021, 195, 110879. [Google Scholar] [CrossRef]
- Filonchyk, M.; Hurynovich, V.; Yan, H. Impact of Covid-19 lockdown on air quality in the Poland, Eastern Europe. Environ. Res. 2021, 198, 110454. [Google Scholar] [CrossRef] [PubMed]
- Al-Qaness, M.A.; Fan, H.; Ewees, A.A.; Yousri, D.; Elaziz, M.A. Improved ANFIS model for forecasting Wuhan City Air Quality and analysis COVID-19 lockdown impacts on air quality. Environ. Res. 2021, 194, 110607. [Google Scholar] [CrossRef] [PubMed]
- Bao, R.; Zhang, A. Does lockdown reduce air pollution? Evidence from 44 cities in northern China. Sci. Total Environ. 2020, 731, 139052. [Google Scholar] [CrossRef]
- Brimblecombe, P.; Lai, Y. Diurnal and weekly patterns of primary pollutants in Beijing under COVID-19 restrictions. Faraday Discuss. 2020, 226, 138–148. [Google Scholar] [CrossRef] [PubMed]
- Chang, Y.; Huang, R.; Ge, X.; Huang, X.; Hu, J.; Duan, Y.; Zou, Z.; Liu, X.; Lehmann, M. Puzzling Haze Events in China During the Coronavirus (COVID-19) Shutdown. Geophys. Res. Lett. 2020, 47, 088533. [Google Scholar] [CrossRef]
- Chen, Q.X.; Huang, C.L.; Yuan, Y.; Tan, H.P. Influence of COVID-19 event on air quality and their association in Mainland China. Aerosol Air Qual. Res. 2020, 20, 1541–1551. [Google Scholar] [CrossRef]
- Diamond, M.S.; Wood, R. Limited Regional Aerosol and Cloud Microphysical Changes Despite Unprecedented Decline in Nitrogen Oxide Pollution During the February 2020 COVID-19 Shutdown in China. Geophys. Res. Lett. 2020, 47, 088913. [Google Scholar] [CrossRef]
- Chu, B.; Zhang, S.; Liu, J.; Ma, Q.; He, H. Significant concurrent decrease in PM2.5 and NO2 concentrations in China during COVID-19 epidemic. J. Environ. Sci. 2021, 99, 346–353. [Google Scholar] [CrossRef]
- Griffith, S.; Huang, W.; Lin, C.; Chen, Y.; Chang, K.; Lin, T.; Wang, S.; Lin, N. Long-range air pollution transport in East Asia during the first week of the COVID-19 lockdown in China. Sci. Total Environ. 2020, 741, 140214. [Google Scholar] [CrossRef]
- Ding, J.; van der A, R.J.; Eskes, H.J.; Mijling, B.; Stavrakou, T.; van Geffen, J.H.G.M.; Veefkind, J.P. NOx Emissions Reduction and Rebound in China Due to the COVID-19 Crisis. Geophys. Res. Lett. 2020, 47, 089912. [Google Scholar] [CrossRef]
- Huang, L.; Liu, Z.; Li, H.; Wang, Y.; Li, Y.; Zhu, Y.; Ooi, M.; An, J.; Shang, Y.; Zhang, D.; et al. The Silver Lining of COVID-19: Estimation of Short-Term Health Impacts Due to Lockdown in the Yangtze River Delta Region, China. GeoHealth 2020, 4, 000272. [Google Scholar] [CrossRef]
- Huang, Y.; Zhou, J.L.; Yu, Y.; Mok, W.-C.; Lee, C.; Yam, Y.-S. Uncertainty in the Impact of the COVID-19 Pandemic on Air Quality in Hong Kong, China. Atmosphere 2020, 11, 914. [Google Scholar] [CrossRef]
- Le, T.; Wang, Y.; Liu, L.; Yang, J.; Yung, Y.L.; Li, G.; Seinfeld, J.H. Unexpected air pollution with marked emission reductions during the COVID-19 outbreak in China. Science 2020, 369, 702–706. [Google Scholar] [CrossRef] [PubMed]
- Li, J.; Yang, H.; Zha, S.; Yu, N.; Liu, X.; Sun, R. Effects of COVID-19 Emergency Response Levels on Air Quality in the Guangdong-Hong Kong-Macao Greater Bay Area, China. Aerosol Air Qual. Res. 2021, 21, 200416. [Google Scholar] [CrossRef]
- Li, L.; Li, Q.; Huang, L.; Wang, Q.; Zhu, A.; Xu, J.; Liu, Z.; Li, H.; Shi, L.; Li, R.; et al. Air quality changes during the COVID-19 lockdown over the Yangtze River Delta Region: An insight into the impact of human activity pattern changes on air pollution variation. Sci. Total Environ. 2020, 732, 139282. [Google Scholar] [CrossRef] [PubMed]
- Li, Z.; Meng, J.; Zhou, L.; Zhou, R.; Fu, M.; Wang, Y.; Yi, Y.; Song, A.; Guo, Q.; Hou, Z.; et al. Impact of the COVID-19 Event on the Characteristics of Atmospheric Single Particle in the Northern China. Aerosol Air Qual. Res. 2020, 20, 1716–1726. [Google Scholar] [CrossRef]
- Lian, X.; Huang, J.; Huang, R.-J.; Liu, C.; Wang, L.; Zhang, T. Impact of city lockdown on the air quality of COVID-19-hit of Wuhan city. Sci. Total Environ. 2020, 742, 140556. [Google Scholar] [CrossRef]
- Miyazaki, K.; Bowman, K.; Sekiya, T.; Jiang, Z.; Chen, X.; Eskes, H.; Ru, M.; Zhang, Y.; Shindell, D. Air quality response in China linked to the 2019 novel coronavirus (COVID-19) lockdown. Geophys. Res. Lett. 2020, 47, e2020GL089252. [Google Scholar] [CrossRef]
- Kaewrat, J.; Janta, R. Effect of COVID-19 Prevention Measures on Air Quality in Thailand. Aerosol Air Qual. Res. 2021, 21, 200344. [Google Scholar] [CrossRef]
- Stratoulias, D.; Nuthammachot, N. Air quality development during the COVID-19 pandemic over a medium-sized urban area in Thailand. Sci. Total Environ. 2020, 746, 141320. [Google Scholar] [CrossRef] [PubMed]
- Masum, M.H.; Pal, S.K. Statistical evaluation of selected air quality parameters influenced by COVID-19 lockdown. Glob. J. Environ. Sci. Manag. 2020, 6, 85–94. [Google Scholar]
- Islam, S.; Tusher, T.R.; Roy, S.; Rahman, M. Impacts of nationwide lockdown due to COVID-19 outbreak on air quality in Bangladesh: A spatiotemporal analysis. Air Qual. Atmos. Health 2021, 14, 351–363. [Google Scholar] [CrossRef]
- Roy, S.; Chowdhury, N.; Bhuyan, M.M.M. COVID-19 Induced Lockdown Consequences on Air Quality and Economy-A Case Study of Bangladesh. J. Environ. Pollut. Hum. Health 2020, 8, 55–68. [Google Scholar]
- Kanniah, K.D.; Zaman, N.A.F.K.; Kaskaoutis, D.G.; Latif, M.T. COVID-19’s impact on the atmospheric environment in the Southeast Asia region. Sci. Total Environ. 2020, 736, 139658, Erratum in 2020, 745, 142200. [Google Scholar] [CrossRef] [PubMed]
- Suhaimi, N.F.; Jalaludin, J.; Latif, M.T. Demystifying a Possible Relationship between COVID-19, Air Quality and Meteorological Factors: Evidence from Kuala Lumpur, Malaysia. Aerosol Air Qual. Res. 2020, 20, 1520–1529. [Google Scholar] [CrossRef]
- Li, J.; Tartarini, F. Changes in Air Quality during the COVID-19 Lockdown in Singapore and associations with Human Mobility Trends. Aerosol Air Qual. Res. 2020, 20, 1748–1758. [Google Scholar] [CrossRef]
- Seo, J.; Jeon, H.; Sung, U.; Sohn, J.-R. Impact of the COVID-19 Outbreak on Air Quality in Korea. Atmosphere 2020, 11, 1137. [Google Scholar] [CrossRef]
- Han, B.-S.; Park, K.; Kwak, K.-H.; Park, S.-B.; Jin, H.-G.; Moon, S.; Kim, J.-W.; Baik, J.-J. Air quality change in Seoul, South Korea under COVID-19 social distancing: Focusing on PM2.5. Int. J. Environ. Res. Public Health 2020, 17, 6208. [Google Scholar] [CrossRef]
- Ju, M.J.; Oh, J.; Choi, Y.-H. Changes in air pollution levels after COVID-19 outbreak in Korea. Sci. Total Environ. 2021, 750, 141521. [Google Scholar] [CrossRef]
- Agami, S. Impact of COVID-19 on Air Quality in Israel. arXiv 2020, arXiv:2007.06501. Available online: https://arxiv.org/abs/2007.06501v1 (accessed on 14 April 2021).
- Broomandi, P.; Karaca, F.; Nikfal, A.; Jahanbakhshi, A.; Tamjidi, M.; Kim, J.R. Impact of COVID-19 Event on the Air Quality in Iran. Aerosol Air Qual. Res. 2020, 20, 1793–1804. [Google Scholar] [CrossRef]
- Mehmood, K.; Bao, Y.; Petropoulos, G.P.; Abbas, R.; Abrar, M.M.; Mustafa, A.; Soban, A.; Saud, S.; Ahmad, M.; Fahad, S. Investigating connections between COVID-19 pandemic, air pollution and community interventions for Pakistan employing geo-information technologies. Chemosphere 2021, 272, 129809. [Google Scholar] [CrossRef]
- Bacak, T.; Dursun, Ş.; Toros, H. The Effect of COVID-19 Outbreak on Air Quality of Istanbul City Centre. 2020. Available online: https://www.researchgate.net/profile/Tugce-Bacak/publication/346059005_The_Effect_of_COVID-19_outbreak_on_Air_Quality_of_Istanbul_city_centre/links/5fb9307d458515b7975cc203/The-Effect-of-COVID-19-outbreak-on-Air-Quality-of-Istanbul-city-centre.pdf (accessed on 25 May 2021).
- Şahin, A. The Effects of COVID-19 Measures on Air Pollutant Concentrations at Urban and Traffic Sites in Istanbul. Aerosol Air Qual. Res. 2020, 20, 1874–1885. [Google Scholar] [CrossRef]
- Nguyen, T.P.M.; Bui, T.H.; Nguyen, M.K.; Nguyen, T.H.; Pham, H.L. Impact of Covid-19 partial lockdown on PM2.5, SO2, NO2, O3, and trace elements in PM2.5 in Hanoi, Vietnam. Environ. Sci. Pollut. Res. 2021, 1–11. [Google Scholar] [CrossRef]
- Kerimray, A.; Baimatova, N.; Ibragimova, O.; Bukenov, B.; Kenessov, B.; Plotitsyn, P.; Karaca, F. Assessing air quality changes in large cities during COVID-19 lockdowns: The impacts of traffic-free urban conditions in Almaty, Kazakhstan. Sci. Total Environ. 2020, 730, 139179. [Google Scholar] [CrossRef]
- Anil, I.; Alagha, O. The impact of COVID-19 lockdown on the air quality of Eastern Province, Saudi Arabia. Air Qual. Atmos. Health 2021, 14, 117–128. [Google Scholar] [CrossRef]
- Faridi, S.; Yousefian, F.; Niazi, S.; Ghalhari, M.R.; Hassanvand, M.S.; Naddafi, K. Impact of SARS-CoV-2 on ambient air particulate matter in Tehran. Aerosol Air Qual. Res. 2020, 20, 1805–1811. [Google Scholar] [CrossRef]
- Anderson, B.; Dirks, K. A Preliminary Analysis of Changes in Outdoor Air Quality in the City of Southampton during the 2020 COVID-19 Outbreak to Date: A Response to DEFRA’s Call for Evidence 1 on Estimation of Changes in Air Pollution Emissions, Concentrations and Exposure during the COVID-19 Outbreak in the UK. 2020. Available online: https://cfsotago.github.io/airQual/sccAirQualExplore_covidLockdown2020.html (accessed on 12 May 2021).
- Lee, J.D.; Drysdale, W.S.; Finch, D.P.; Wilde, S.E.; Palmer, P.I. UK surface NO2 levels dropped by 42 % during the COVID-19 lockdown: Impact on surface O3. Atmos. Chem. Phys. Discuss. 2020, 20, 15743–15759. [Google Scholar] [CrossRef]
- Jephcote, C.; Hansell, A.L.; Adams, K.; Gulliver, J. Changes in air quality during COVID-19 ‘lockdown’ in the United Kingdom. Environ. Pollut. 2021, 272, 116011. [Google Scholar] [CrossRef]
- Sannino, A.; D’Emilio, M.; Castellano, P.; Amoruso, S.; Boselli, A. Analysis of Air Quality during the COVID-19 Pandemic Lockdown in Naples (Italy). Aerosol Air Qual. Res. 2021, 21, 200381. [Google Scholar] [CrossRef]
- Travaglio, M.; Yu, Y.; Popovic, R.; Selley, L.; Leal, N.S.; Martins, L.M. Links between air pollution and COVID-19 in England. Environ. Pollut. 2021, 268, 115859. [Google Scholar] [CrossRef]
- Ropkins, K.; Tate, J.E. Early observations on the impact of the COVID-19 lockdown on air quality trends across the UK. Sci. Total Environ. 2021, 754, 142374. [Google Scholar] [CrossRef] [PubMed]
- Wyche, K.; Nichols, M.; Parfitt, H.; Beckett, P.; Gregg, D.; Smallbone, K.; Monks, P. Changes in ambient air quality and atmospheric composition and reactivity in the South East of the UK as a result of the COVID-19 lockdown. Sci. Total Environ. 2021, 755, 142526. [Google Scholar] [CrossRef]
- Higham, J.; Ramírez, C.A.; Green, M.; Morse, A.P. UK COVID-19 lockdown: 100 days of air pollution reduction? Air Qual. Atmos. Health 2021, 14, 325–332. [Google Scholar] [CrossRef]
- A Potts, D.; A Marais, E.; Boesch, H.; Pope, R.J.; Lee, J.; Drysdale, W.; Chipperfield, M.P.; Kerridge, B.; Siddans, R.; Moore, D.P.; et al. Diagnosing air quality changes in the UK during the COVID-19 lockdown using TROPOMI and GEOS-Chem. Environ. Res. Lett. 2021, 16, 054031. [Google Scholar] [CrossRef]
- Briz-Redón, Á.; Belenguer-Sapiña, C.; Serrano-Aroca, Á. Changes in air pollution during COVID-19 lockdown in Spain: A multi-city study. J. Environ. Sci. 2021, 101, 16–26. [Google Scholar] [CrossRef] [PubMed]
- Mesas-Carrascosa, F.-J.; Porras, F.P.; Triviño-Tarradas, P.; García-Ferrer, A.; Meroño-Larriva, J. Effect of Lockdown Measures on Atmospheric Nitrogen Dioxide during SARS-CoV-2 in Spain. Remote. Sens. 2020, 12, 2210. [Google Scholar] [CrossRef]
- Donzelli, G.; Cioni, L.; Cancellieri, M.; Llopis-Morales, A.; Morales-Suárez-Varela, M. Relations between Air Quality and Covid-19 Lockdown Measures in Valencia, Spain. Int. J. Environ. Res. Public Health 2021, 18, 2296. [Google Scholar] [CrossRef]
- Petetin, H.; Bowdalo, D.; Soret, A.; Guevara, M.; Jorba, O.; Serradell, K.; García-Pando, C.P. Meteorology-normalized impact of the COVID-19 lockdown upon NO2 pollution in Spain. Atmos. Chem. Phys. Discuss. 2020, 20, 11119–11141. [Google Scholar] [CrossRef]
- Baldasano, J.M. COVID-19 lockdown effects on air quality by NO2 in the cities of Barcelona and Madrid (Spain). Sci. Total Environ. 2020, 741, 140353. [Google Scholar] [CrossRef]
- Bassani, C.; Vichi, F.; Esposito, G.; Montagnoli, M.; Giusto, M.; Ianniello, A. Nitrogen dioxide reductions from satellite and surface observations during COVID-19 mitigation in Rome (Italy). Environ. Sci. Pollut. Res. 2021, 28, 22981–23004. [Google Scholar] [CrossRef]
- Coker, E.S.; Cavalli, L.; Fabrizi, E.; Guastella, G.; Lippo, E.; Parisi, M.L.; Pontarollo, N.; Rizzati, M.; Varacca, A.; Vergalli, S. The Effects of Air Pollution on COVID-19 Related Mortality in Northern Italy. Environ. Resour. Econ. 2020, 76, 611–634. [Google Scholar] [CrossRef] [PubMed]
- Cameletti, M. The Effect of Corona Virus Lockdown on Air Pollution: Evidence from the City of Brescia in Lombardia Region (Italy). Atmos. Environ. 2020, 239, 117794. [Google Scholar] [CrossRef] [PubMed]
- Albrecht, L.; Czarnecki, P.; Sakelaris, B. Investigating the Relationship between Air Quality and COVID-19 Transmission. J. data Sci. JDS 2021, 19, 485–497. [Google Scholar] [CrossRef]
- Granella, F.; Reis, L.A.; Bosetti, V.; Tavoni, M. COVID-19 lockdown only partially alleviates health impacts of air pollution in Northern Italy. Environ. Res. Lett. 2021, 16, 035012. Available online: https://iopscience.iop.org/article/10.1088/1748-9326/abd3d2/meta (accessed on 19 May 2021). [CrossRef]
- Dursun, S.; Sagdic, M.; Toros, H. The impact of COVID-19 measures on air quality in Turkey. Environ. Forensics 2021, 22, 1–13. [Google Scholar] [CrossRef]
- Aydın, S.; Nakiyingi, B.A.; Esmen, C.; Güneysu, S.; Ejjada, M. Environmental impact of coronavirus (COVID-19) from Turkish perceptive. Environ. Dev. Sustain. 2021, 23, 7573–7580. [Google Scholar] [CrossRef]
- Kaskun, S. The effect of COVID-19 pandemic on air quality caused by tra c in Istanbul. Res. Sq. 2020, 1–24. [Google Scholar] [CrossRef]
- Sbai, S.E.; Mejjad, N.; Norelyaqine, A.; Bentayeb, F. Air quality change during the COVID-19 pandemic lockdown over the Auvergne-Rhône-Alpes region, France. Air Qual. Atmos. Health 2021, 14, 617–628. [Google Scholar] [CrossRef]
- Ginzburg, A.S.; Semenov, V.A.; Semutnikova, E.G.; Aleshina, M.A.; Zakharova, P.V.; Lezina, E.A. Impact of COVID-19 Lockdown on Air Quality in Moscow. Dokl. Earth Sci. 2020, 495, 862–866. [Google Scholar] [CrossRef]
- Burns, J.; Hoffmann, S.; Kurz, C.; Laxy, M.; Polus, S.; Rehfuess, E. COVID-19 mitigation measures and nitrogen dioxide—A quasi-experimental study of air quality in Munich, Germany. Atmos. Environ. 2021, 246, 118089. [Google Scholar] [CrossRef]
- Dimovska, M.; Gjorgjev, D. The Effects of COVID-19 Lockdown on Air Quality in Macedonia. Open Access Maced. J. Med Sci. 2020, 8, 353–362. [Google Scholar] [CrossRef]
- Gama, C.; Relvas, H.; Lopes, M.; Monteiro, A. The impact of COVID-19 on air quality levels in Portugal: A way to assess traffic contribution. Environ. Res. 2021, 193, 110515. [Google Scholar] [CrossRef] [PubMed]
- Velders, G.J.; Willers, S.M.; Wesseling, J.; Elshout, S.V.D.; van der Swaluw, E.; Mooibroek, D.; van Ratingen, S. Improvements in air quality in the Netherlands during the corona lockdown based on observations and model simulations. Atmos. Environ. 2021, 247, 118158. [Google Scholar] [CrossRef]
- Dragic, N.; Bijelovic, S.; Jevtic, M.; Velicki, R.; Radic, I. Short-term health effects of air quality changes during the COVID-19 pandemic in the City of Novi Sad, the Republic of Serbia. Int. J. Occup. Med. Environ. Health 2021, 34, 1–15. [Google Scholar] [CrossRef] [PubMed]
- Bourdrel, T.; Annesi-Maesano, I.; Alahmad, B.; Maesano, C.N.; Bind, M.-A. The impact of outdoor air pollution on COVID-19: A review of evidence from in vitro, animal, and human studies. Eur. Respir. Rev. 2021, 30, 200242. [Google Scholar] [CrossRef] [PubMed]
- Menut, L.; Bessagnet, B.; Siour, G.; Mailler, S.; Pennel, R.; Cholakian, A. Impact of lockdown measures to combat Covid-19 on air quality over western Europe. Sci. Total Environ. 2020, 741, 140426. [Google Scholar] [CrossRef]
- Deroubaix, A.; Brasseur, G.; Gaubert, B.; Labuhn, I.; Menut, L.; Siour, G.; Tuccella, P. Response of surface ozone concentration to emission reduction and meteorology during the COVID-19 lockdown in Europe. Authorea Preprints 2020, 28. [Google Scholar] [CrossRef]
- Goldberg, D.L.; Anenberg, S.C.; Griffin, D.; McLinden, C.A.; Lu, Z.; Streets, D.G. Disentangling the Impact of the COVID-19 Lockdowns on Urban NO2 From Natural Variability. Geophys. Res. Lett. 2020, 47, e2020gl089269. [Google Scholar] [CrossRef] [PubMed]
- Pan, S.; Jung, J.; Li, Z.; Hou, X.; Roy, A.; Choi, Y.; Gao, H. Air Quality Implications of COVID-19 in California. Sustainability 2020, 12, 7067. [Google Scholar] [CrossRef]
- Takagi, H.; Kuno, T.; Yokoyama, Y.; Ueyama, H.; Matsushiro, T.; Hari, Y.; Ando, T. Air Quality and COVID-19 Prevalence/Fatality. medRxiv 2020. [Google Scholar] [CrossRef]
- Berman, J.D.; Ebisu, K. Changes in U.S. air pollution during the COVID-19 pandemic. Sci. Total Environ. 2020, 739, 139864. [Google Scholar] [CrossRef]
- Jiang, Z.; Shi, H.; Zhao, B.; Gu, Y.; Zhu, Y.; Miyazaki, K.; Lu, X.; Zhang, Y.; Bowman, K.; Sekiya, T.; et al. Modeling the Impact of COVID-19 on Air Quality in Southern California: Implications for Future Control Policies. Atmos. Chem. Phys. Discuss. 2020, 21, 8693–8708. [Google Scholar] [CrossRef]
- Zangari, S.; Hill, D.T.; Charette, A.T.; Mirowsky, J.E. Air quality changes in New York City during the COVID-19 pandemic. Sci. Total Environ. 2020, 742, 140496. [Google Scholar] [CrossRef] [PubMed]
- Liu, Q.; Harris, J.T.; Chiu, L.S.; Sun, D.; Houser, P.R.; Yu, M.; Duffy, D.Q.; Little, M.M.; Yang, C. Spatiotemporal impacts of COVID-19 on air pollution in California, USA. Sci. Total Environ. 2021, 750, 141592. [Google Scholar] [CrossRef]
- Adams, M.D. Air pollution in Ontario, Canada during the COVID-19 State of Emergency. Sci. Total Environ. 2020, 742, 140516. [Google Scholar] [CrossRef]
- Hernández-Paniagua, I.Y.; Valdez, S.I.; Almanza, V.; Rivera-Cárdenas, C.; Grutter, M.; Stremme, W.; García-Reynoso, A.; Ruiz-Suárez, L.G. Impact of the COVID-19 Lockdown on Air Quality and Resulting Public Health Benefits in the Mexico City Metropolitan Area. Front. Public Health 2021, 9, 642630. [Google Scholar] [CrossRef]
- Zalakeviciute, R.; Vasquez, R.; Bayas, D.; Buenano, A.; Mejia, D.; Zegarra, R.; Diaz, V.; Lamb, B. Drastic Improvements in Air Quality in Ecuador during the COVID-19 Outbreak. Aerosol Air Qual. Res. 2020, 20, 1783–1792. [Google Scholar] [CrossRef]
- Nakada, L.Y.K.; Urban, R.C. COVID-19 pandemic: Impacts on the air quality during the partial lockdown in São Paulo state, Brazil. Sci. Total Environ. 2020, 730, 139087. [Google Scholar] [CrossRef]
- Siciliano, B.; Carvalho, G.; da Silva, C.M.; Arbilla, G. The Impact of COVID-19 Partial Lockdown on Primary Pollutant Concentrations in the Atmosphere of Rio de Janeiro and São Paulo Megacities (Brazil). Bull. Environ. Contam. Toxicol. 2020, 105, 2–8. [Google Scholar] [CrossRef] [PubMed]
- Zambrano-Monserrate, M.A.; Ruano, M.A. Has air quality improved in Ecuador during the COVID-19 pandemic? A parametric analysis. Air Qual. Atmos. Health 2020, 13, 929–938. [Google Scholar] [CrossRef]
- Cazorla, M.; Herrera, E.; Palomeque, E.; Saud, J. What the COVID-19 lockdown revealed about photochemistry and ozone production in Quito, Ecuador. Atmos. Pollut. Res. 2021, 12, 124–133. [Google Scholar] [CrossRef]
- Mendez-Espinosa, J.F.; Rojas, N.Y.; Vargas, J.; Pachón, J.E.; Belalcazar, L.C.; Ramírez, O. Air quality variations in Northern South America during the COVID-19 lockdown. Sci. Total Environ. 2020, 749, 141621. [Google Scholar] [CrossRef] [PubMed]
- Kutralam-Muniasamy, G.; Pérez-Guevara, F.; Roy, P.D.; Elizalde-Martínez, I.; Shruti, V. Impacts of the COVID-19 lockdown on air quality and its association with human mortality trends in megapolis Mexico City. Air Qual. Atmos. Health 2021, 14, 553–562. [Google Scholar] [CrossRef]
- El-Magd, I.A.; Zanaty, N. Impacts of short-term lockdown during COVID-19 on air quality in Egypt. Egypt. J. Remote. Sens. Space Sci. 2020. [Google Scholar] [CrossRef]
- Sekmoudi, I.; Khomsi, K.; Faieq, S.; Idrissi, L. Covid-19 lockdown improves air quality in Morocco. arXiv 2020, arXiv:2007.05417. Available online: https://arxiv.org/abs/2007.05417v1 (accessed on 1 May 2021).
- Khomsi, K.; Najmi, H.; Amghar, H.; Chelhaoui, Y.; Souhaili, Z. COVID-19 national lockdown in Morocco: Impacts on air quality and public health. One Health 2020, 11, 100200. [Google Scholar] [CrossRef]
- Meji, M.A.; Dennison, M.S.; Mobisha, M. Effect of COVID-19 Induced Lockdown on Air Quality in Kampala. i-Manag. J. Future Eng. Technol. 2020, 16, 43. Available online: https://www.researchgate.net/profile/Abisha-Meji-Milon/publication/346631417_EFFECT_OF_COVID-19_INDUCED_LOCKDOWN_ON_AIR_QUALITY_IN_KAMPALA/links/5fca620892851c00f84d55b9/EFFECT-OF-COVID-19-INDUCED-LOCKDOWN-ON-AIR-QUALITY-IN-KAMPALA.pdf (accessed on 19 May 2021). [CrossRef]
- Fuwape, I.A.; Okpalaonwuka, C.T.; Ogunjo, S.T. Impact of COVID -19 pandemic lockdown on distribution of inorganic pollutants in selected cities of Nigeria. Air Qual. Atmos. Health 2021, 14, 149–155. [Google Scholar] [CrossRef]
- Wilson, A.D. Electronic-nose applications in forensic science and for analysis of volatile biomarkers in the human breath. J. Forensic Sci. Criminol. 2014, 1, 1–21. [Google Scholar]
- Brooks, W.A.; Goswami, D.; Rahman, M.; Nahar, K.; Fry, A.M.; Balish, A.; Iftekharuddin, N.; Azim, T.; Xu, X.; Klimov, A.; et al. Influenza is a major contributor to childhood pneumonia in a tropical developing country. Pediatric Infect. Dis. J. 2010, 29, 216–221. [Google Scholar] [CrossRef]
- Maji, K.J.; Dikshit, A.K.; Arora, M.; Deshpande, A. Estimating premature mortality attributable to PM2.5 exposure and benefit of air pollution control policies in China for 2020. Sci. Total Environ. 2018, 612, 683–693. [Google Scholar] [CrossRef] [PubMed]
- Martelletti, L.; Martelletti, P. Air pollution and the novel Covid-19 disease: A putative disease risk factor. SN Compr. Clin. Med. 2020, 15, 1–5. [Google Scholar] [CrossRef] [PubMed] [Green Version]
- Ogen, Y. Assessing nitrogen dioxide (NO2) levels as a contributing factor to coronavirus (COVID-19) fatality. Sci. Total Environ. 2020, 726, 138605. [Google Scholar] [CrossRef] [PubMed]
- Zhu, L.; She, Z.-G.; Cheng, X.; Qin, J.-J.; Zhang, X.-J.; Cai, J.; Lei, F.; Wang, H.; Xie, J.; Wang, W.; et al. Association of Blood Glucose Control and Outcomes in Patients with COVID-19 and Pre-existing Type 2 Diabetes. Cell Metab. 2020, 31, 1068–1077. [Google Scholar] [CrossRef] [PubMed]
- Fattorini, D.; Regoli, F. Role of the chronic air pollution levels in the Covid-19 outbreak risk in Italy. Environ. Pollut. 2020, 264, 114732. [Google Scholar] [CrossRef]
- Huang, C.; Wang, Y.; Li, X.; Ren, L.; Zhao, J.; Hu, Y.; Zhang, L.; Fan, G.; Xu, J.; Gu, X.; et al. Clinical features of patients infected with 2019 novel coronavirus in Wuhan, China. Lancet 2020, 395, 497–506. [Google Scholar] [CrossRef] [Green Version]
- Intergovernmental Panel on Climate Change (IPCC). Contribution of Working Group III to the Fourth Assessment Report of the Intergovernmental Panel on Climate Change; Metz, O.R.D.B., Bosch, P.R., Cambridge, L.A.M., Eds.; Cambridge University Press: Cambridge, UK, 2007. [Google Scholar]


| Continents | Country | Number of Studies |
|---|---|---|
| Europe (33) | UK (8), Turkey (3), France (2), Spain (6), Italy (7), Germany (1), Poland (1), Netherland (1), Portugal (1), Russia (1), Macedonia (1), Albania (1), | 33 |
| North and South America (20) | USA (9), Canada (1), Ecuador (4), Brazil (4), Mexico (2), | 20 |
| Asia (117) | India (53), China (42), Thailand (2), Bangladesh (5), Malaysia (2), Singapore (1), Iran (1), Israel (1), Japan (1), Pakistan (3), Vietnam (1), Korea (3), Kazakhstan (1), Saudi Arabia (1) | 117 |
| Oceania (2) | Australia (2) | 2 |
| Africa (7) | Nigeria (1), Morocco (3), Egypt (2), Uganda (1) | 7 |
| Continent | Country | Number of Studies | % of Studies |
|---|---|---|---|
| Asia | India | 53 | 29.44 |
| China | 42 | 23.33 | |
| Bangladesh | 5 | 2.78 | |
| Thailand | 2 | 1.11 | |
| Pakistan | 3 | 1.67 | |
| Malaysia | 2 | 1.11 | |
| Korea | 3 | 1.67 | |
| Israel | 1 | 0.56 | |
| Iran | 1 | 0.56 | |
| Vietnam | 1 | 0.56 | |
| Kazakhstan | 1 | 0.56 | |
| Saudi Arabia | 1 | 0.56 | |
| Teheran | 1 | 0.56 | |
| Singapore | 1 | 0.56 | |
| Europe | UK | 8 | 4.44 |
| Spain | 6 | 3.33 | |
| Italy | 7 | 3.89 | |
| Turkey | 3 | 1.67 | |
| Russia | 1 | 0.56 | |
| Germany | 1 | 0.56 | |
| Macedonia | 1 | 0.56 | |
| Albania | 1 | 0.56 | |
| Portugal | 1 | 0.56 | |
| Netherlands | 1 | 0.56 | |
| Poland | 1 | 0.56 | |
| Serbia | 1 | 0.56 | |
| France | 2 | 1.11 | |
| North America | US | 9 | 5.00 |
| Canada | 1 | 0.56 | |
| Africa | Morocco | 3 | 1.67 |
| Egypt | 2 | 1.11 | |
| Kampala | 1 | 0.56 | |
| Nigeria | 1 | 0.56 | |
| South America | Brazil | 4 | 2.22 |
| Ecuador | 4 | 2.22 | |
| Mexico | 2 | 1.11 | |
| Oceania | Australia | 1 | 0.56 |
| Country | Study Area | Publication Year | Major Findings |
|---|---|---|---|
| India | City scale | 2020 | A substantial decrease in PM2.5 and the air quality index (AQI) was reported for Delhi, Mumbai, Hyderabad, Kolkata, and Chennai. (ii) PM2.5 concentrations were reduced by 34.52% and 27.57% in Kolkata and Delhi, respectively, in comparison to 2019 [18]. |
| Country | 2020 | There was a remarkable decline in the ambient air quality index (AQI) (17.75% and 20.70%, respectively) during post-lockdown periods as compared to pre-lockdown periods (ii) poor air quality had a positive correlation with COVID-19 mortalities (r = 0.435 for AQI) [31]. | |
| State | 2020 | There was a substantial reduction in air pollutants during different phases of lockdowns (ii) PM 2. 5 and PM10 decreased by about 17.76% and 20.66%, respectively, during consecutive periods of lockdowns [32]. | |
| City scale | 2021 | PM 2.5 was reduced by about 40 to 45% during lockdown periods in comparison to the previous two years [33]. | |
| City scale | 2020 | Particulate matter concentration decreased by about 40% during lockdown in comparison to previous years [34]. | |
| City scale | 2020 | The lockdown measures reflected a significant reduction in air pollutants; the most significant fall was estimated for NO2 (29.3–74.4%), while the least reduction was noticed for SO2 [35]. | |
| City scale | 2020 | The average value of AQI at Punjab Bagh was noticed as 212 before the lockdown, which dropped down to 74 during the lockdown, indicating a significant improvement in air quality [23]. | |
| City scale | 2020 | The results indicate the lowering of PM 2.5, PM 10, and NO2 concentrations in the city by 93%, 83%, and 70%, respectively, from 25 February 2020 to 21 April 2020 [17]. | |
| City scale | 2020 | The concentration of NO2 and PM2.5 significantly decreased due to lockdowns across cities [36]. | |
| City scale | 2020 | These two cities observed a substantial decrease in nitrogen dioxide (40–50%) compared to the same period last year [37]. | |
| City scale | 2020 | Major negative effects on the social and surrounding environment have been reported due to COVID-19, however positive effects have also been observed with respect to air quality. The results have been taken from the National Aeronautics and Space Administration (NASA), and indicate a significant reduction (50%) in the air quality of the Indian region [23]. | |
| City Scale | 2020 | A considerable reduction (∼30–70%) in NO2 was found, except for a few sites in the central region. A similar pattern was observed for CO having a ∼20–40% reduction. The reduction observed for PM2.5, PM10, NO2, and the enhancement in O3 was proportional to the population density [38]. | |
| City scale | 2021 | PM2.5 has declined by 14%, by about 30% for NO2 in million-plus cities, and a 2.06% CO, SO2 within the range of 5 to 60%, whereas the concentration of O3 has increased by 1 to 3% in the majority of cities compared with pre-lockdown. On the other hand, CPCB/SPCB data showed a more than 40% decrease in PM2.5 and a 47% decrease in PM10 in north Indian cities, more than a 35% decrease in NO2 in metropolitan cities, more than an 85% decrease in SO2 in Chennai and Nagpur, and a more than 17% increase in O3 in five cities during 43 days of pandemic lockdown [39]. | |
| City scale | 2020 | The lockdown effect due to COVID-19 in the city: the complete closure of industries, transports, markets, shopping malls, recreation units, construction works, etc., which are the main sources of CO2 emissions [40]. | |
| City scale | 2021 | Highest levels of PM10 and PM2.5 were observed near sunrise, with little change in the time of maximum levels between 2019 and 2020 [41]. | |
| City scale | 2020 | A reduction of almost 60% in the particulate matter pollution, and up to 40% in the NOx pollution, were observed, while the ozone levels were reduced by 30–40%, as compared to the same period during the previous two years [42]. | |
| City scale | 2021 | The air quality has improved across the country and the average temperature and maximum temperature were connected to the outbreak of the COVID-19 pandemic [43]. | |
| City scale | 2020 | Before 30 days of lockdown, PM2.5 was 65.77 µg/m3 and that reached 42.72 µg/m3 during lockdown periods [44]. | |
| City scale | 2021 (a) | During lockdown, maximum decrease was reported for NO2 (40%), followed by PM2.5 (32%), PM10 (24%), and SO2 (18%) [45]. | |
| City scale | 2021 (b) | During entire periods of lockdown, the average concentration of PM2.5 declined by 50% [46]. | |
| City scale | 2020 | Suspended particulate matter (SPM) was reduced by about 36%. The concentration of NO2 was also reduced during lockdown periods [46]. | |
| City | 2020 | The concentration of PM2.5, PM10, and NO2 declined by about 50%, with a significant increase in O3 in Delhi (p < 0.05) [35]. | |
| Country | 2021 | Over the urban agglomerations (UAs), and rural regions, the concentrations of NO2 were reduced by about 20–40% and 15–25%, respectively [47]. | |
| Regional | 2020 | Mumbai recorded the highest decrease of NO2 (34%) with a seasonal decrease of SO2 in western and southern India [48]. | |
| City | 2021 | During lockdown periods, the concentration of PM 2.5 and PM10 declined by about 43% and 59%, respectively, in Delhi, and by 50% and 49%, respectively, in Kolkata [49]. | |
| City | 2020 | During the initial periods of lockdown, the concentration of PM 2.5 declined by about 40 to 70% (from 25 March to 31 March 2020) [50]. | |
| City | 2020 | From 11 May to 9 June 2020, the concentrations of PM2.5, PM10, and NO2 were reduced by about 74%, 46%, and 63%, respectively [51]. | |
| City | 2020 | There was a substantial decrease in PM 2.5, PM10, and NO2 during lockdown, with the highest decline in Ahmedabad (68%), Delhi (71%), Bangalore (87%), and Nagpur (63%), for PM2.5, PM10, NO2 and CO, respectively [16]. | |
| City | 2020 | NO2 was reduced by about 46% and the air quality index (AQI) improved by about 27% [52]. | |
| City | 2020 | Air quality index (AQI) was reduced by 44, 33, 29, 15, and 32% in north, south, east, central and western India. The highest decrease was reported for PM2.5 (43%), followed PM10 (33%), NO2 (18%), and CO (10%) [53]. | |
| City | 2020 | Air pollutants (PM2.5, PM10, NO2, and CO) were reduced by about 50% across the megacities of India [54]. | |
| City | 2020 | The concentration of PM2.5 was reduced by about 19 to 43% in Chennai, 41 to 53% in Delhi, 26 to 54% in Hyderabad, 24 to 36% in Kolkata, and 10 to 39% in Mumbai [55]. | |
| City | 2020 | The concentrations of PM2.5, PM10, NO2 and SO2 were 49, 55, 60 and 19%, respectively, in Delhi, and 44, 37, 78, and 39%, respectively, in Mumbai [56]. | |
| City | 2020 | PM10 was reduced by more than 46% across five cities [57]. | |
| City | 2020 | Over the urban agglomerations (UAs) and rural regions, the concentrations of NO2 were reduced by about 20–40%, and 15–25%, respectively [58]. | |
| City | 2021 | The concentrations of PM10, PM2.5, NOx, SO2, and CO were reduced by about 58, 47, 83, 11, and 30%, respectively [59]. | |
| City | 2020 | The concentration of PM2.5 decreased from 72.9 μg m−3 (2019) to 45.9 μg m−3 (2020) during lockdown periods [60]. | |
| City scale | 2020 | The concentrations of PM2.5, PM10, SO2, CO2, and NO2 decreased due to lockdown [17]. | |
| Country and City scale | 2020 | Air quality improved by about 25% during lockdown periods [61]. | |
| City scale | 2020 | The over-standard multiples method and a grey relational analysis to study the individual and overall change trends of pollutants in Wuhan during the same period in the past seven years. The results show that the concentrations of SO2 and O3 increased because of the pandemic, but still met the standard [62]. | |
| City Scale | 2020 | Urban aerosols decreased from 27.1% for pre-C19Q aerosols to only 17.5% during C19Q. WRF-Chem reported a ~0.2 °C warming across east-central China that represented a minor, though statistically significant, contribution to C19Q temperature anomalies. The largest area of warming is concentrated south of Chengdu and Wuhan, where temperatures increased between +0.2–0.3 °C [63]. | |
| City scale | 2021 | The increment in secondary organic and inorganic aerosols under stationary weather reached up to 36.4% and 10.2%, respectively, which was further intensified by regional transport. PRD was quite the opposite. The emission reductions benefited PRD air quality, while regional transport corresponded to an increase of 17.3% and 9.3% in secondary organic and inorganic aerosols, respectively. In different regions, the maximum daily 8 h average ozone (O3) soared by 20.6–76.8% in YRD but decreased by 15.5–28.1% in PRD. In YRD, nitrogen oxide (NOx) reductions enhanced O3 accumulation and, hence, increased secondary aerosol formation [64]. | |
| City scale | 2020 | It was found that the COVID-19 pandemic caused PM2.5 and AQI to decrease by about 7 μg/m3 and 5-points, respectively [65]. | |
| City scale | 2021 | The precipitous decrease of AQI and PCDI in Q1 2020, and the peaks of the AQI during the epidemic period were closely related to people’s activities. AQI, PM2.5, and NO2 were significantly positively correlated with PCDI [66]. | |
| City scale | 2020 | The average concentrations of PM2.5, PM10, SO2, CO, and NO2 were 89.4 µg m–3, 106 µg m–3, 2.31 ppb, 0.72 ppm, and 12.3 ppb, respectively, and were 17.9%, 30.8%, 83.8%, 19.8%, and 62.1%, lower than those in February from 2017–2019. However, the average O3 concentration was 31.8 ppb in February 2020 [67]. | |
| City scale | 2021 | PM2.5, PM10, SO2, and NO2 during a 2-week portion of the lockdown period (from 24 January–6 February) were reduced by −19.2%, −44.7%, −21.5%, and −33.6%, respectively, compared to the same period in 2019. Even with the decrease in PM2.5 and PM10 concentrations, they were still more than four times higher than the World Health Organization standards (10μg/m3 and 20 μg/m3, respectively) [68]. | |
| City scale | 2020 | Average concentrations of PM2.5 and PM10 across China were 10.5% and 21.4% lower, respectively, during the lockdown period. The largest reductions were in Hubei province, where NO2 concentrations were 50.5% lower than expected during the lockdown [69]. | |
| City scale | 2020 | PM2.5 and PM10 were reduced by about 10%, 12% [70]. | |
| City scale | 2020 | The AQIs in these cities were brought down by 6.34 points (PM2.5 was down by 7.05 µg m−3) relative to the previous year. The lockdown effects were greater in colder, richer, and more industrialized cities [61]. | |
| City scale | 2020 | In January (2020), average concentration of PM2.5 and PM10 was 23.8% and 33.9% (over Anqing, Hefei and Suzhou) which was lower in comparison to previous year (2017–2019) [15]. | |
| City scale | 2020 | The pandemic promoted a decrease in PM2.5, PM10, and NO2 concentrations, but it had just reached the standard or even exceeded the standard [71]. | |
| China | City scale | 2020 | The concentrations of SO2 and O3 increased but still met the standard. However, the pandemic promoted a decrease in PM2.5, PM10, and NO2 concentrations, but it had just reached the standard or even exceeded the standard [62]. |
| Country and City scale | 2020 | O3 responses to NO2 declines can be affected by the primary dependence on its precursors [72]. | |
| City scale | 2021 | The air quality index (AQI) during the lockdown period decreased by 7.4%, and by 23.48%, compared to pre-lockdown levels and the identical lunar period during the past 3 years, respectively, which exhibited optimal air quality due to reduced emissions [73]. | |
| City scale | 2020 | A causal relationship between P and R across 31 provincial capital cities in China was established via matching. A higher P resulted in a higher R in China. A 10 µg/m3 increase in P produced a 0.9% increase in R (p < 0.05). An interaction analysis between P and absolute humidity (AH) showed a statistically significant positive relationship between P × AH and R (p < 0.01). When AH was ≤8.6 g/m3, higher P and AH produced a higher R (p < 0.01) [74]. | |
| City scale | 2021 | The number of days with NO2, PM10, and PM2.5 as the primary pollutants decreased by approximately 10, 9, and 15%, respectively. We compared the wind direction, wind speed, temperature, and relative humidity from January-April 2020, 2019, 2018, and 2017, and found no obvious correlation between meteorological factors and improved air quality during the 2020 lockdown [75]. | |
| Country | 2020 | The concentrations of CO and NO2 were reduced by about 20% and 30%, respectively [76]. | |
| City | 2021 | During lockdown periods, PM2.5 decreased by about 30% and NO2 by 50%, respectively [77]. | |
| City | 2020 | The concentration of PM2.5, PM10, NO2, and SO2 decreased by about 6, 14, 25, and 7%, respectively [78]. | |
| City | 2021 | The PM2.5 and SO2 were reduced from 37 to 26 ug/m3 and from 6 to 4 ug/m3, respectively, during restricted lockdown periods [79]. | |
| City | 2020 | The concentration of PM2.5 was higher during New Year holidays in 2020 (73%) than New Year holidays in 2019 (59%) [80]. | |
| Country | 2020 | In comparison to last year (2019), the concentrations of CO, NO2, SO2, PM2.5, and PM10 were reduced by about 12, 16, 12, 15, and 14%, respectively [81]. | |
| Country | 2021 | Lockdown resulted in about a 50% reduction in NO2 [82]. | |
| Country | 2021 | The NO2 was reduced by about 53, 50, and 30% in Wuhan, Hubei province, and China, respectively. The concentration of PM2.5 declined by about 35, 29, and 19%, respectively, in comparison to last year [83]. | |
| Country | 2020 | NO2 declined by about 24% during the Chinese New Year (CNY) holiday [84]. | |
| Country | 2020 | The concentration of NO2 was reduced by about 20 to 50% for cities, 15 to 40% for maritime transport, and 40% for power plants [85]. | |
| Regional | 2020 | There were reductions of PM2.5 concentration from 22.9% to 43% during lockdown periods, as compared to previous year [86]. | |
| City | 2020 | A substantial reduction of PM2.5, PM10, CO, and SO2 were reported during lockdown periods [87]. | |
| Country | 2020 | Air pollution was reduced by up to 90% during city lockdown [88]. | |
| Regional | 2020 | The concentrations of PM2.5, PM10, and CO decreased by about 40%, 45%, and 24%, respectively, during lockdown periods [89]. | |
| Regional | 2020 | Lockdown resulted in a substantial reduction in PM2.5 (27–46%), NO2 (29–47%), and SO2 (16–26%) [90]. | |
| Regional | 2020 | Carbonaceous particles decreased by about 20% during lockdown periods [91]. | |
| City | 2020 | During lockdown periods, the concentration of PM2.5 and NO2 decreased by about 36% and 53%, respectively, and O3 increased by about 116% [92]. | |
| Country | 2020 | During lockdown periods, the concentration of PM2.5 decreased by up to 23 ug/m3 [93]. | |
| Thailand | City scale | 2020 | Air quality improved by about 50% to 70% during lockdown periods due to restricted emissions from transportation [94]. |
| City scale | 2020 | The environmental benefits documented in major urban agglomerations during the lockdown may extend to medium-sized urban areas as well [95]. | |
| Bangladesh | City scale | 2021 | Due to lockdown measures, significant differences between PM2.5, SO2, NO2, CO, and O3 in 2019 and 2020 were observed in Dhaka city. We used lag-0, lag-7, lag-14, and lag-21 days on daily COVID-19 cases to look at the lag effect of different air pollutants on meteorology [25]. |
| City scale | 2021 | The concentration of NO2, PM2.5, and SO2 decreased by about 20%, 26%, and 17.5%, respectively, because of lockdown [38]. | |
| City scale | 2021 | The concentration of PM2.5 and PM10 decreased by 40% and 32% during lockdown periods in comparison to previous dry seasons [96]. | |
| Country scale | 2020 | The concentration of NO2 and SO2 decreased by about 40% and 43%, respectively [97]. | |
| City scale | 2020 | Air quality during lockdown was found to be 5.30% lower than 2019 [98]. | |
| Malayasia | Country and City scale | 2020 | PM.5 and PM10 decreased by about 25% during lockdown [99]. |
| City scale | 2020 | Differences between PM10, PM2.5, SO2, NO2, CO, O3, and solar radiation in 2019 and 2020 since the movement control order (MCO) was implemented on 18 March 2020 [100]. | |
| Singapore | Country and City scale | 2020 | The concentrations of the following pollutants PM10, PM2.5, NO2, CO, and SO2 decreased by 23, 29, 54, 6, and 52%, respectively, while that of O3 increased by 18%. The Pollutant Standards Index decreased by 19% [101]. |
| Korea | City scale | 2020 | In March 2020, PM2.5 showed remarkable reductions of 36% and 30% in Seoul and Daegu, respectively, when compared with the same period from 2017–2019 [102]. |
| City scale | 2020 | The PM2.5 concentration decreased by about 10.4%, where the average concentration of PM2.5 was 23.7% the last 5 years [103]. | |
| Country | 2021 | The concentration of PM2.5, PM10, and NO2 declined by about 45, 35, and 20%, respectively, because of lockdown [104]. | |
| Israel | City scale | 2020 | In its earlier closest period, the pollution from transport, based on nitrogen oxides, had reduced by 40% on average, whereas the pollution from industry, based on Grand-level ozone had increased by 34% on average [105]. |
| Iran | City scale | 2020 | PM2.5 increased by 0.5–103, 25, and 2–50%. In terms of the national air quality, SO2 and NO2 levels decreased, while AOD 26 increased during the lockdown [106]. |
| Pakisthan | Country | 2021 | There were no significant improvements of air quality in Lahore and Karachi during lockdown periods, as compared to 2019 [107]. |
| City scale | 2021 | With the reduction in human activity (known to be the biggest source of air pollution) during the COVID-19 pandemic, changes in air pollution values were observed. The year 2020, compared with 2018 and 2019, in order to observe this change and to compare it with other years: 1 January–15 March, considered the pre-pandemic process; 16 March–31 May, considered the pandemic process; 1 June–30 June, considered the normalization process [108]. | |
| City | 2021 | During lockdown periods, PM10, PM2.5, NO2, and CO were reduced 32–43%, 19–47%, 29–44% and 40–58%, respectively [109]. | |
| Vietnam | City scale | 2020 | The concentrations of NO2, PM2.5, and SO2 were reduced by about 75%, 55%, and 67%, respectively [110]. |
| Kazakhstan | City scale | 2020 | PM2.5 declined by 21%, and CO and NO2 decreased by about 49% and 35%, respectively, during lockdown [111]. |
| Saudi Arabia | Regional | 2021 | The eastern province of Saudi Arabia reported a reduction in PM10, CO, and SO2 by 21–70%, 5.8–55%, and 8.7–30%, respectively [112]. |
| Teheran | Country | 2020 | There were increases in PM2.5 and PM10 (by 20.5% and 15.7%) during the first month of the COVID-19 outbreak [113]. |
| Country | Scale of Study | Publication Year | Major Findings |
|---|---|---|---|
| UK | England | 2021 | PM2.5 was a major contributor to COVID-19 cases in England, as an increase of 1 m3 in the long-term average of PM2.5 was associated with a 12% increase in COVID-19 cases [118]. |
| Southampton | 2020 | NO2 decreased by about 92% during lockdown, as compared with the previous two years [114]. | |
| Country | 2020 | NO2 was reduced by about 42% during lockdown periods [115]. | |
| Country | 2021 | The concentration of NO2 and PM2.5 concentrations decreased by 38.3% and 16.5%, respectively [116]. | |
| Country | 2021 | The concentration of NO, NO2, and NOx decreased 32% to 50% at roadsides during lockdown [119]. | |
| Country | 2021 | NO2 concentrations across measurement sites declined by about ~14–38% [120]. | |
| Country | 2021 | The concentration of NO2 decreased by about 50%, and O3 increased by about 10% [121]. | |
| Country | 2021 | The concentration of Ox emissions declined nationwide by ~20% during the lockdown [122]. | |
| Spain | City | 2020 | The 4-week lockdown had a significant impact on reducing the atmospheric levels of NO2 in all cities, except for the small city of Santander, as well as the levels of CO, SO2, and PM10 in some cities, but resulted in an increase of the O3 level [123]. |
| Country | 2020 | Changes in the concentration of the pollutant nitrogen dioxide (NO2) during the lockdown period were examined, as well as how these changes relate to the Spanish population [124]. | |
| City | 2021 | In 2020, NOx, NO2, and NO concentrations decreased by 48.5–49.8–46.2%, 62.1–67.4–45.7%, 37.4–35.7–35.3%, 60.7–67.7–47.1%, 65.5–65.8–63.5%, 60.0–64.5–41.3%, and 60.4–61.6–52.5%, respectively [125]. | |
| Country | 2021 | Decreases in PM10 levels were greater than in PM2.5 because of reduced emissions from road dust, vehicle wear, and construction/demolition activities. The averaged O3 daily maximum of 8-h (8hDM) experienced a generalized decrease in the rural receptor sites in the relaxation (June-July) with −20% reduced mobility [20]. | |
| Country | 2020 | NO2 was reduced by about 50% during lockdown periods [126]. | |
| City | 2020 | The concentration of NO2 in Barcelona and Madrid decreased by about 50% and 62%, respectively, during lockdown periods [127]. | |
| Italy | City | 2021 | NO2 decreased by about 50%, 34% and 20% from urban traffic, urban backgrounds, and rural backgrounds, respectively [128]. |
| Regional | 2020 | Potentially, it is the spatially confounding factors related to urbanization that may have influenced the spreading of novel coronavirus. Our epidemiological analysis uses geographical information (e.g., municipalities) and Poisson regression to assess whether both the ambient PM concentration and the excess mortality have a similar spatial distribution [129]. | |
| Regional | 2020 | The estimate of the time series slope, i.e., the expected change in the concentration associated with a time unit increase, decreased from −0.25 to −1.67 after the lockdown [130]. | |
| Country | 2021 | The model finds that there is a positive nonlinear relationship between the density of particulate matter in the air and COVID-19 transmission, which is in alignment with similar studies on other respiratory illnesses [131]. | |
| City | 2021 | NO2 was reduced by about 49–62%, and CO and SO2 declined by about 50–58% and 70%, respectively [117]. | |
| City | 2020 | There were significant reductions in PM2.5, PM10, CO and NO, respectively [21]. | |
| Regional | 2021 | The concentration of PM2.5 and NO2 declined by about 16% and 33%, respectively [132]. | |
| Turkey | Country | 2021 | To determine the effects of COVID-19 measures on air quality in Turkey, for this investigation, the daily means of PM10, PM2.5, NO2, CO, O3, and SO2 air pollutant data were used [133]. |
| Country | 2020 | By the end of April, the PM2.5 index had improved by about 35% during lockdown [134]. | |
| City | 2021 | The NO2 concentrations were reduced by about 11.8 % in the after-virus period [135]. | |
| France | Country | 2020 | Air quality in the Auvergne-Rhône-Alpes region, focusing on nine atmospheric pollutants (NO2, NO, PM10, PM2.5, O3, VOC, CO, SO2, and isoprene): In Lyon, the center of the region, the results indicated that NO2, NO, and CO levels were reduced by 67%, 78%, and 62%, respectively, resulting from a decrease in road traffic by 80%. However, O3, PM10, and PM2.5 were increased by 105%, 23%, and 53%, respectively [136]. |
| Russia | City | 2020 | Just under half were from changes in surface transport. At their peak, emissions in individual countries decreased by –26% on average. The impact on 2020 annual emissions depends on the duration of the confinement, with a low estimate of –4% (–2 to –7%) if pre-pandemic conditions return by mid-June, and a high estimate of –7% (–3 to –13%) [137]. |
| Germany | City | 2021 | The concentration of NO2 reduced by about 15–25% and 34–36% from traffic sites during lockdown periods [138]. |
| Macedonia | Country | 2020 | PM2.5 in Kumanovo and carbon monoxide in Skopje (7% and 3% higher concentrations, respectively). The most notable decrement was for NO2, with a concentration 5–31% lower during the COVID-19 period [139]. |
| Portugal | Country | 2021 | PM10 and NO2 concentration was reduced by about 18% and 41%, respectively [140]. |
| Netherland | Country | 2021 | NO2 and PM10 concentration was reduced by about 18–30% and 20%, respectively, during lockdown periods [141]. |
| Poland | Country | 2021 | Aerosols concentrations were reduced by about 23% and 18% in April and May, respectively [76]. |
| Serbia | City | 2021 | The average daily concentrations of PM2.5, NO2, PM10, and SO2 were reduced by 35%, 34%, 23%, and 18%, respectively. In contrast, the average daily concentration of O3 increased by 8%, even if the primary precursors were reducing, thus representing a challenge for air quality management [142]. |
| Whole Eorope | Europe | 2021 | Viruses may persist in the air through complex interactions with particles and gases depending on: (1) chemical composition; (2) the electric charges of the particles; and (3) meteorological conditions, such as relative humidity, ultraviolet (UV) radiation, and temperature. In addition, by reducing UV radiation, air pollutants may promote viral persistence in the air and reduce vitamin D synthesis [143]. |
| Europe | 2020 | The lockdown effect on atmospheric composition, in particular through massive traffic reductions, has been important for several short-lived atmospheric trace species, with a large reduction in NO2 concentrations, a lower reduction in particulate matter (PM) concentrations, and a mitigated effect on ozone concentrations due to nonlinear chemical effects [144]. | |
| Europe | 2020 | The concentration of NO2 was reduced by about 25% during lockdown periods, when compared to the same periods of previous years [145]. |
| Country | Scale of the Study | Publication Year | Major Findings |
|---|---|---|---|
| US | City | 2020 | The surface air quality monitoring data from the United States Environmental Protection Agency’s (U.S. EPA) AirNow network, during the period from 20 March–5 May in 2020, to the 2015–2019 period, from the Air Quality System (AQS) network over the state of California. The results indicate changes in fine particulate matter (PM2.5) of −2.04 ± 1.57 μg m−3 and ozone of −3.07 ± 2.86 ppb. If the air quality improvements persist over a year, it could potentially lead to 3970–8900 preventable premature deaths annually (note: the estimates of preventable premature deaths have large uncertainties). Public transit demand showed dramatic declines (~80%) [147]. |
| City | 2020 | COVID-19 prevalence and fatality (plotted as logarithm-transformed prevalence/fatality on the y-axis) as a function of mean ozone/PM2.5 AQI (plotted on the x-axis). Coefficients were not statistically significant for ozone (p = 0.212/0.814 for prevalence/fatality) and PM2.5 (p = 0.986/0.499) [148]. | |
| Country | 2020 | The concentration of NO2 was reduced by about 25% in comparison to past years [149]. | |
| Country | 2020 | The NO2 concentration was reduced by about 5 to 49%, with a mixed impact on O3 (±20%) [24]. | |
| US | 2020 | NO2 decreased by about 9–42%, with the highest decreases (>30%) in San Jose and Los Angeles, and the lowest decreases (<12%) in Miami, Minneapolis, and Dallas [146]. | |
| US | 2020 | PM2.5 concentration was reduced by about 68% after lockdown [150]. | |
| City | 2020 | There were decreases of PM2.5 and NO2 by 36% and 51%, respectively, during lockdown [151]. | |
| City | 2021 | As per ground-based observation, it was reported that the concentration of NO2, CO, and PM2.5 dropped by about 38%, 49%, and 31%, respectively, during lockdown periods (19 March to 7 May 2020) [152]. | |
| Canada | City | 2020 | The concentration of nitrogen dioxide and nitrogen oxides reduced across Ontario [153]. |
| Country | Scale of the Study | Publication Year | Major Findings |
|---|---|---|---|
| Brazil | City | 2020 | There was a substantial decrease of NO (more than 70%), CO (more than 60%), and NO2 (more than 50%). Ozone concentration increased by about 30% during partial lockdown periods, as compared to previous years [11]. |
| City Scale | 2020 | Among CO, NO2, and PM2.5, a significant reduction was reported for CO (30–48%) [157]. | |
| City Scale | 2020 | During lockdown, CO reported the highest decline of up to 100%. NO2 decreased by about 9 to 41% [158]. | |
| Ecuador | City | 2020 | The concentration of NO2 and PM2.5 significantly decreased due to the implementation of lockdown. The concentration of PM2.5 was lower in 2020, as compared to 2018 and 2019 during the same lockdown periods i.e., March [159]. |
| City | 2021 | There was a substantial reduction in NO during lockdown periods [160]. | |
| Regional | 2020 | The concentration of PM2.5, PM10, and NO2 decreased by about 40%, 44% and 60%, respectively, during strict lockdown, and 69%, 58%, and 62%, respectively, during relaxed lockdown periods [155]. | |
| Country | 2020 | Air quality improved by 29–68% due to lockdown [161]. | |
| Mexico | Country | 2020 | The concentrations of NO2, SO2, and PM10 declined by about 29, 55, and 11%, respectively [154]. |
| Country | Scale of the Study | Publication Year | Major Findings |
|---|---|---|---|
| Egypt | Country | 2020 | The whole country is improved as a result of reduced pollutant emissions, with NO2 reduced by 45.5%, CO emissions reduced by 46.23%, ozone concentration decreased by about 61.1%, and AOD reduced by 68.5%, compared to the previous two years [163]. |
| City | 2021 | Absorbing aerosol index (AAI) and NO2 decreased by about 30% and 15%, respectively, and 33% in Cairo and Alexandria Governorate [22]. | |
| Morocco | City Scale | 2020 | PM10 and NO2 decreased by about 75% and 96%, respectively [164]. |
| Morocco | Country | 2020 | COVID-19-compelled lockdown may have saved lives by restraining air pollution, thereby preventing infection. We found that NO2 dropped by −12 μg/m3 in Casablanca, and by −7 μg/m3 in Marrakech. PM2.5 dropped by −18 μg/m3 in Casablanca, and −14 μg/m3 in Marrakech. CO dropped by −0.04 mg/m3 in Casablanca, and −0.12 mg/m3 in Marrakech [165]. |
| Uganda | City Scale | 2020 | (i) The COVID-19-induced lockdown period. The data has been compared with the same period of the previous year. Promising and notable observations were made in terms of the AQI of Kampala [166]. |
| Nigeria | City Scale | 2021 | The lockdown resulted in a decrease of SO2 and NO2 across the cities. For example, 1.1% and 215.5% of NO2 and SO2, respectively, from the city Port Harcourt [167]. |
Publisher’s Note: MDPI stays neutral with regard to jurisdictional claims in published maps and institutional affiliations. |
© 2021 by the authors. Licensee MDPI, Basel, Switzerland. This article is an open access article distributed under the terms and conditions of the Creative Commons Attribution (CC BY) license (https://creativecommons.org/licenses/by/4.0/).
Share and Cite
Addas, A.; Maghrabi, A. The Impact of COVID-19 Lockdowns on Air Quality—A Global Review. Sustainability 2021, 13, 10212. https://doi.org/10.3390/su131810212
Addas A, Maghrabi A. The Impact of COVID-19 Lockdowns on Air Quality—A Global Review. Sustainability. 2021; 13(18):10212. https://doi.org/10.3390/su131810212
Chicago/Turabian StyleAddas, Abdullah, and Ahmad Maghrabi. 2021. "The Impact of COVID-19 Lockdowns on Air Quality—A Global Review" Sustainability 13, no. 18: 10212. https://doi.org/10.3390/su131810212
APA StyleAddas, A., & Maghrabi, A. (2021). The Impact of COVID-19 Lockdowns on Air Quality—A Global Review. Sustainability, 13(18), 10212. https://doi.org/10.3390/su131810212