Abstract
To master the transformation method and spatio-temporal variation characteristics of cultivated land quality at multiple scales, this paper constructed three spatial scales (Laixi city, Qingdao city, and Shandong province) and two temporal scales (the second survey (2007) and the third survey (2020)), and used a linear model to transform the evaluation system. Descriptive statistics, area statistics, spatial distribution, and aggregation analysis were used to explore the spatial scale variability, and the dynamic variation characteristics were analyzed. The results showed that (1) the R2 of scale transformation models are more than 0.826, which has a simple structure and strong universality; (2) with the administrative scale increases, the evaluation units’ number decreases, the spatial distribution is generally similar but progressively approximate, the high and low land levels gradually change to medium-level land, and the spatial aggregation degree is county-scale > provincial-scale > city-scale, with significant scale effect; and (3) in the past ten years, the average grade has increased from 6.26 to 6.13 in Laixi city, but still has much room for development. This study puts forward a method of spatio-temporal scale transformation and scale effect analysis for cultivated land quality, which has positive significance for improving the evaluation system, promoting land protection, and regional sustainable development.
1. Introduction
Cultivated land quality (CLQ) reflects the cultivated land production capacity. It is crucial to maintaining agricultural ecosystem balance, promoting sustainable agricultural development, and maintaining social and economic stability [1]. At present, there are many problems in cultivated land resources utilization, such as quantity reduction, quality decrease, and ecological destruction, which cause increased pressure on cultivated land and seriously threaten both sustainable utilization and food security [2,3]. Therefore, scientific evaluation and long-term monitoring of regional CLQ are necessary [4].
CLQ has a significant scale effect [5]. Many domestic and foreign scholars have conducted lots of research on CLQ at different spatial scales. For example, the agricultural land assessment was carried out in large-scale areas such as provinces, countries, and the world [6,7,8], in medium-scale areas such as counties and cities [9,10,11], and in small-scale areas such as villages and towns [12,13,14]. Related studies provide evaluation methods at different scales, but the evaluation results cannot learn from each other. As a result, the characteristics and rules obtained from single-scale evaluation cannot be applied to the CLQ analysis at other scales. Therefore, a multi-scale comprehensive CLQ evaluation and result analysis have become a research hotspot. For example, Li et al., Zhang et al., and Sun et al. used the spatial autocorrelation method to analyze the spatial distribution difference of CLQ at multiple scales [15,16,17]. However, the research focused on evaluation results analysis, and each scale used the same evaluation system, which made it difficult to reflect the scale difference of the evaluation system. Therefore, how to use the CLQ characteristics at one scale to infer and predict the CLQ at another scale based on ensuring the comparability and scale suitability, and how to realize the scale transformation of the CLQ evaluation system still need to be studied in depth.
Establishing a long-term monitoring system is the key to ensuring the stability and improvement of CLQ [18]. At present, the research on CLQ has changed from static spatial analysis to dynamic spatio-temporal change analysis, and fruitful research results have been achieved [19,20]. Since 2002, the Ministry of Agriculture has begun to carry out cultivated land fertility evaluation, soil testing, and formula fertilization projects, and has accumulated rich research experience [21]. In recent years, with the proposed management and protection policy of “quantity, quality and ecology of cultivated land”, and the gradual implementation of CLQ evaluation based on the third survey data, ecological and environmental factors began to be incorporated into the evaluation system [22]. However, the previous connotation of CLQ and its evaluation methods could not meet the needs of new spatio-temporal dynamic analysis. Realizing the transformation and unification of different systems is the premise for CLQ analysis.
This study explored a spatial and temporal transformation method from provincial, city, and county scales, and studied the spatial variation characteristics and the dynamic change law of multi-scale CLQ. The aim of this study was to improve the evaluation system, realize scientific evaluation and dynamic monitoring of multi-scale CLQ, and provide a reference for the protection and sustainable utilization of cultivated land resources.
2. Materials and Methods
2.1. Study Area
In this study, Laixi city was taken as the study area, and a three-layer integrated spatial scale system of Laixi city, Qingdao city, and Shandong province was constructed (Figure 1). Laixi city (36°34′~37°90′ N, 120°12′~120°40′ E) is located in the northeast of Qingdao, which belongs to the county-level city. It has a temperate continental monsoon climate and complex geomorphic types. The cultivated land area is stable at about 80,000 hectares, primarily including dry land, irrigated land, and vegetable land. The soil types are brown soil, alluvial soil, and black soil, etc., primarily planting wheat, maize, and peanut. The cultivated layer texture is primarily light loam and medium loam soil, and the texture configuration is primarily clay interlayer, with a deep soil layer. The city is a national modern agricultural demonstration area and an advanced county in grain production. Moreover, Qingdao city (35°35′~37°90′ N, 119°30′~121°00′ E) is located in the south of Shandong Peninsula, bordering the Yellow Sea to the east and south. The topography is high in the east and low in the west. The cultivated land in Qingdao is primarily dry land and irrigated land, with about 500,000 hectares. The soil is primarily brown soil and black soil. The cultivated layer texture is primarily light loam soil, the texture configuration is primarily clay interlayer, and the main crops are wheat, corn, cotton, etc., with a high agricultural development level. Furthermore, Shandong province (34°22′~38°24′ N, 114°47′~122°42′ E) is located in the east of China, with the Bohai Sea in the north and the Yellow Sea in the east and south. The topography is high in the middle and low around. The cultivated land area remained stable at about 7 million hectares, mainly including irrigated and dry land. The soils include brown soil, cinnamon soil, and 15 other soil types. The cultivated layer texture is primarily light, medium, and sandy loam soil. The texture configuration is primarily loam and clay interlayer, with a deep soil layer. Wheat and maize are the main grain crops, and cotton and peanut are the main cash crops, with a high agricultural modernization and industrialization level. In conclusion, the selected study areas are similar in agricultural development, so conducting multi-scale research on CLQ is typical and feasible.
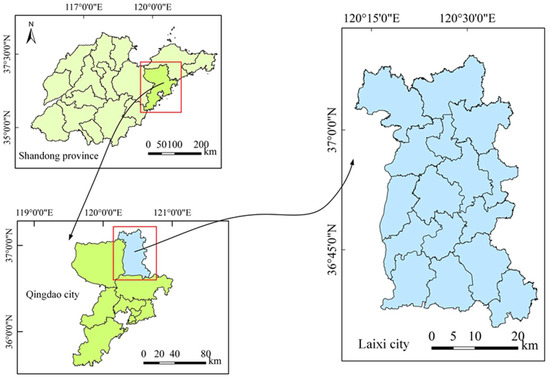
Figure 1.
Distribution map of the study area.
2.2. Data Source and Preprocessing
The CLQ evaluation data are mainly derived from the cultivated land fertility evaluation, soil testing, and formula fertilization project of Laixi city, Qingdao city, and Shandong province (2007–2011), based on the second national land use survey in China (hereinafter called “the second survey”), and the cultivated land quality evaluation project of Laixi city (2020), based on the third national land use survey in China (hereinafter called “the third survey”). The data content includes the sampling sites data, thematic maps, and relevant statistical data. As for sampling data, there are 2000, 2553, and 44,966 sites in Laixi, Qingdao, and Shandong in the second survey, and 988 sites in Laixi in the third survey. The data is mainly investigating the topography, soil parent material, and management level around the points, and analyzing the primary nutrient information such as organic matter, available potassium, and available phosphorus. Thematic maps include a land use status map, a soil map, and an administrative zoning map (scale: 1:50,000, 1:100,000, 1:500,000, and 1:50,000), and the statistical data mainly includes land area, population area, and various input-output indicators.
In this study, The Inverse Distance Weight (IDW) method was used to interpolate soil nutrients. The IDW method assumes that the value at an unknown location can be approximated as a weighted average of values at points within a certain cut-off distance [23]. The weighted index P was set as two by default, and the grid map resolution was set according to the study area scale to ensure that the evaluation unit could obtain the corresponding nutrient values. To better manage the data, the basic information of sampling points and soil test data were recorded in the survey points as the primary database, and the attribute database was established. At the same time, the grid maps interpolated by nutrients and vectorized thematic maps were stored in the form of grid and point, line, and area files, respectively, to form a primary thematic map graph database. All kinds of data are collected and sorted, and the primary database of CLQ evaluation is constructed.
2.3. Methods
The technical flow chart adopted in this study is shown in Figure 2. Firstly, the CLQ evaluation was realized based on determining the multi-scale evaluation system. Then, the linear model was used to transform the evaluation system of the spatial and temporal scale. Finally, the temporal and spatial variation characteristics of CLQ were analyzed based on the evaluation results after the scale transformation.
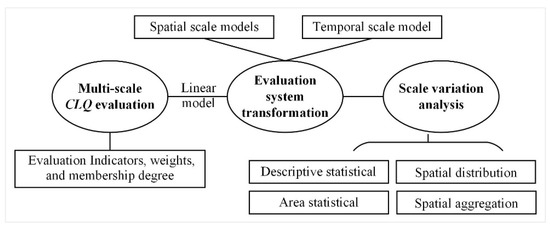
Figure 2.
Technical flow chart. CLQ: cultivated land quality.
2.3.1. Cultivated Land Quality Evaluation Based on GIS
Since cultivated land is a complex system, a single soil property cannot quantitatively express the CLQ. Therefore, this study introduces the index sum evaluation method, aiming to use the Integrated Fertility Index (IFI) to coordinate the influencing factors of CLQ, and then comprehensively and objectively reflect the CLQ in the region [24]. The CLQ evaluation in this paper mainly refers to the evaluation standards such as “Rules for soil quality survey and assessment (NY/T 1634-2008)” [25] and “Cultivated land quality grade (GB/T 33469-2016)” [26]. First of all, the administrative zoning map, soil map, and land use status map were superimposed to realize the division of evaluation units. Secondly, the hierarchical cluster and Delphi methods were used to screen the evaluation factors. Among them, the hierarchical cluster method [27] was used to screen relatively independent quantitative indicators. The Delphi method [28] is a feedback anonymous letter inquiry method, which is suitable for screening qualitative indicators. Thirdly, the Analytic Hierarchy Process (AHP) method was used to determine the evaluation factor weights (), which is a quantitative evaluation method developed on a qualitative basis [29]. Fourthly, we used the Delphi and fuzzy statistical methods to determine the indicator membership degree (). The fuzzy statistical method [30] is a quantitative evaluation method based on the membership degree theory of fuzzy mathematics. Finally, the IFI was calculated by using the index sum method, and the CLQ grade was divided. The specific formula is as follows:
where represents the combined weight of the index, and represents the membership degree of the index.
2.3.2. Spatial and Temporal Scale Transformation of the CLQ Evaluation System
Spatial Scale Transformation of the CLQ Evaluation System
According to the characteristics of different study areas, the corresponding evaluation indicators, indicator weights, and membership degree were selected to evaluate the CLQ in each region. Then, the CLQ evaluation results transformation at multiple scales was carried out, which is divided into two steps:
(1) The application of other scale evaluation systems. Starting from the evaluation units at A-scale, the system at B-scale was used to evaluate, and the evaluation results of the A region at B-scale were obtained.
(2) The construction of the scale transformation model. Taking the evaluation result at A-scale as an independent variable and the evaluation result at B-scale as a dependent variable, the linear model was used to construct the scale transformation model from A to B.
The A and B scales represent the current and transformation scales, respectively. The specific transformation method adopted is shown in Figure 3.
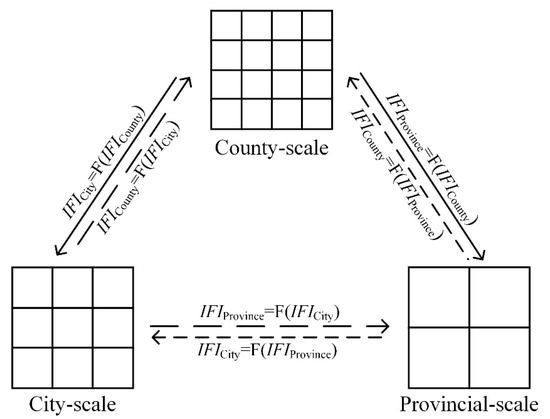
Figure 3.
The technical roadmap of the evaluation system scale transformation. Note: The box and the line segment represent the evaluation results and transformation models at different scales, respectively. IFICounty, IFICity, and IFIProvince represent the Integrated Fertility Index at county-scale, city-scale, and provincial-scale, respectively.
Temporal Scale Transformation of the CLQ Evaluation System
The model construction steps are as follows: First of all, the second and third survey systems were used to evaluate the CLQ based on the third survey evaluation units. Then, the second survey evaluation results were used as independent variables, the third survey evaluation results were used as dependent variables, and the scale transformation from the second survey to the third survey evaluation system was realized by a linear regression model.
2.3.3. Spatial Scale Variation Characteristics Analysis of CLQ
The analysis of spatial variation characteristics is carried out from two perspectives: county-level region (Laixi city) and city-level region (Qingdao city). As shown in Figure 4, the main steps are as follows:
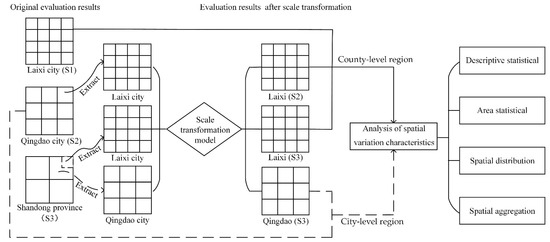
Figure 4.
The technical roadmap of spatial variation characteristics analysis and the evaluation results conversion. Note: S1, S2, and S3 represent the elements at county-scale, city-scale, and provincial–scale, respectively.
(1) The acquisition of evaluation results at other scales. That is, the evaluation results of corresponding regions were extracted from the evaluation results of CLQ at different scales.
(2) The unification of the evaluation system. That is, we used the scale transformation model to transform the evaluation results at different scales to the corresponding regional evaluation system.
(3) The analysis of variation characteristics. Based on the CLQ evaluation results at multi-scale in the same region after the unification of the evaluation system, the following methods were used to analyze the characteristics of spatial variability:
① Descriptive statistical analysis
The evaluation units’ number and descriptive parameters such as the maximum, minimum, average, median, standard deviation, and coefficient of variation [31] of IFI were analyzed by SPSS software.
② Area statistical analysis
This mainly includes the area proportion calculation of CLQ grade and Weighted Average Grade (WAG) under multiple scales. The specific formula is as follows:
where represents the land, and represents the area ratio of land.
③ Spatial distribution analysis
The CLQ evaluation results were plotted by ArcGIS software, and its spatial distribution characteristics were analyzed.
④ Spatial aggregation analysis
Geoda software was used to analyze the aggregation degree of CLQ at multiple scales. The global Moran’s I index was used to measure the aggregation degree in the whole region, and the Local Moran’s I index reflected the CLQ correlation between adjacent areas within the local scope [32].
2.3.4. Temporal Scale Variation Characteristics Analysis of CLQ
To analyze the dynamic changes of CLQ in Laixi city, first of all, this study used the temporal scale transformation model to transform the evaluation results (the second survey data) into the third survey system. Then, the dynamic analysis of CLQ was achieved through the area changes and spatial distribution before and after the two land use surveys (2007~2020).
3. Results and Analysis
3.1. Multi-Scale CLQ Evaluation Based on GIS
According to the characteristics of different study areas, following the principles of dominance, difference, stability, and sensitivity, evaluation indicators were selected at different scales, and their weights were determined (Table 1). After the division, 6730, 8800, and 11,188 evaluation units were obtained based on the second survey data for Laixi city, Qingdao city, and Shandong province, respectively, and 39,184 evaluation units were obtained based on the third survey data for Laixi city. Then, the CLQ at different scales was evaluated.

Table 1.
CLQ evaluation indicators and weights at different scales.
3.2. Spatial and Temporal Scale Transformation Results of CLQ
3.2.1. Spatial Scale Transformation Results of CLQ
The spatial scale transformation models obtained through model construction are shown as follows, and the determination coefficient (R2) is used to measure the model accuracy [33]: (1) y = 0.722x + 0.262 (R2 = 0.934) and y = 0.851x + 0.150 (R2 = 0.843) are the transformation model from county-scale to city-scale and provincial-scale; (2) y = 0.969x – 0.016 (R2 = 0.826) and y = 0.827x + 0.144 (R2 = 0.886) are the transformation model from city-scale to county-scale and provincial-scale; and (3) y = 1.108x − 0.124 (R2 = 0.881) and y = 1.005x − 0.007 (R2 = 0.948) are the transformation model from provincial-scale to county-scale and city-scale. The R2 of obtained models is better than 0.826, indicating a significant linear relationship between different evaluation systems results. This indicates that the model could better realize the CLQ transformation between multiple scales.
3.2.2. Temporal Scale Transformation Results of CLQ
The temporal scale transformation model between the second and third survey systems is y = 0.847x + 0.150, with R2 = 0.900, which has a simple structure, strong stability, and good fitting effect.
3.3. Spatial Scale Variation Characteristics Analysis of CLQ
3.3.1. Descriptive Statistical Analysis of Multi-Scale CLQ
Figure 5 and Table 2 reflect the cumulative frequency curve characteristics and mathematical statistics characteristics of IFI at different scales in the same region, respectively. Figure 5 shows that the cumulative frequency curve of IFI at different scales in the same region has similar changes. As shown in Table 2, with the administrative scale increases from the county perspective, the evaluation units’ number decreases, and the IFI scope gradually narrowed. The average and median first decrease and then increase, while the standard deviation and coefficient of variation first increase and then decrease. Among them, the CV is 8.65% at the provincial-scale, with weak variability, and the CV is better than 11.90% at the county-scale and city-scale, with medium variability. From the city perspective, the evaluation units number decreases, the average and median of IFI increase, and the standard deviation and coefficient of variation decrease and has moderate variability, which is consistent with the observation law in the county.
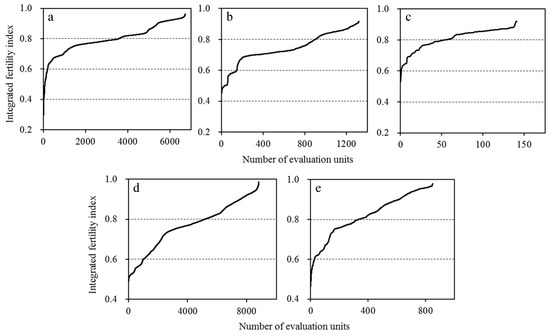
Figure 5.
Cumulative frequency curves of Integrated Fertility Index ((a). Laixi at county-scale; (b). Laixi at city-scale; (c). Laixi at provincial-scale; (d). Qingdao at city-scale; (e). Qingdao at provincial-scale).
Table 2.
Descriptive statistical characteristics of Integrated Fertility Index.
3.3.2. Area Proportion Results Analysis of Multi-Scale CLQ
According to relevant standards [25], the CLQ evaluation results were divided into 6 grades. Grade 1 and 2 were classified as high-level land, grade 3 and 4 were classified as medium-level land, and grade 5 and 6 were classified as low-level land. The results are shown in Table 3. The Weighted Average Grade (WAG) of CLQ at the county, city, and provincial scales are 3.23, 3.15, and 3.27, respectively. With administrative scale increases, the area proportion of high and low land levels decreases, while the medium-level land is increased in the county. In the city area, the area proportion of high-level land decreases from 40.45% to 37.54%, medium-level land increases from 42.68% to 44.65%, and the low-level land increases slightly. It can be seen that with the administrative scale increases, the high and low land levels have a trend of changing to the medium-level land.
Table 3.
The area proportion of CLQ grade (%).
3.3.3. Spatial Distribution Results Analysis of Multi-Scale CLQ
As shown in Figure 6, the CLQ grades at different scales in the same region have a particular spatial distribution similarity. In Laixi city, the high-level land is concentrated in the central and southern part, the low-level land is concentrated in the northern and central part, and the middle-level land is relatively widely distributed. In Qingdao city, the high-level land is mainly concentrated in Pingdu and Jiaodong city, the low-level land is mainly concentrated in Huangdao city, and the middle-level land is mainly distributed in the central part. At the same time, the distribution of CLQ grades on a small scale is relatively dispersed, and the cross distribution phenomenon of some grades is common. With administrative scale increases, the spatial distribution of CLQ grades is gradually generalized, and some fine CLQ grades are covered.
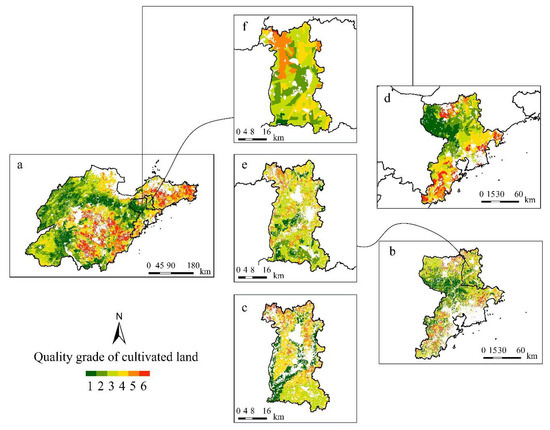
Figure 6.
Spatial distribution map of CLQ grades ((a). Shandong province; (b). Qingdao at city-scale; (c). Laixi at county-scale; (d). Qingdao at provincial-scale; (e). Laixi at city-scale; (f). Laixi at provincial-scale).
3.3.4. Spatial Aggregation Results Analysis of Multi-Scale CLQ
According to the local spatial autocorrelation analysis results (Figure 7), H-H types are mainly concentrated in the central and southern part, while L-L types are mainly concentrated in the northern part of Laixi city. In Qingdao city, H-H types are mainly distributed in the northwest, while the L-L types are mainly distributed in the east and north, with similar spatial clustering characteristics. Based on spatial autocorrelation analysis, the global Moran’s I index at the county, city, and provincial scales in Laixi city is 0.860, 0.248, and 0.475 respectively, and that is 0.450 and 0.776 at the city and provincial scales in Qingdao city, respectively. It can be seen that with the administrative scale increases, the spatial distribution aggregation degree of CLQ decreases first and then increases in Laixi city. Among them, the aggregation at city-scale is the worst, which is mainly due to the excessive number of independent evaluation units. At the same time, Qingdao city at different scales has similar aggregation variation.
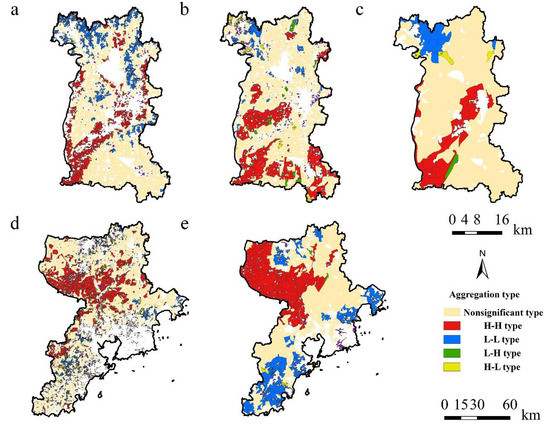
Figure 7.
Local spatial association and aggregation of CLQ ((a). Laixi at county-scale; (b). Laixi at city-scale; (c). Laixi at provincial-scale; (d). Qingdao at city-scale; (e). Qingdao at provincial-scale).
3.4. Time Temporal Scale Variation Characteristics Analysis of CLQ
After the transformation of the temporal-scale model (y = 0.847x + 0.150), the area proportion under the third survey system was shown in Table 4. Referring to the relevant technical regulations [26], the equidistant method divided the land into ten grades. Grade 1, 2, and 3 were classified as high-level land; grade 4, 5, and 6 were classified as medium-level land; and grade 7, 8, 9, and 10 were classified as low-level land. The second survey evaluation results show that the area proportion of high, middle, and low level-land is 6.16%, 65.78%, and 28.06%, respectively, while the area proportion is 7.07%, 67.16%, and 25.77% in the third survey. It can be seen that from 2007 to 2020, the area proportion of high and medium land levels increases, while the area proportion of low-level land decreases continuously, and the WAG increased from 6.26 to 6.13. According to the dynamic evaluation results (Figure 8), the spatial distribution characteristics of CLQ grade in the past ten years are stable. Still, the spatial distribution of low land is gradually reduced, and the spatial distribution of middle and high land is gradually extensive.
Table 4.
The area proportion of CLQ grade in different periods (%).
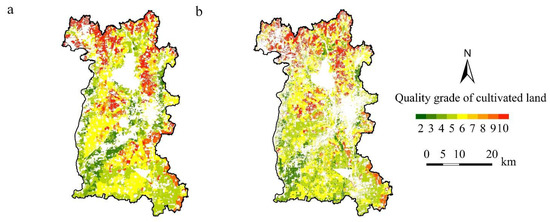
Figure 8.
Dynamic evaluation results of CLQ: (a) evaluation results of the second survey (the third survey system); (b) evaluation results of the third survey.
4. Discussion
(1) As an open and gray system, cultivated land is characterized by the coexistence of quantitative and qualitative elements, making the CLQ at different scales show complex characteristics [34,35]. A scientific and reasonable CLQ assessment at multiple scales is directly related to the efficient use and management of farmland and sustainable agricultural development [36]. The evaluation at multiple scales should reflect the CLQ at corresponding scales and the differences between scales. Natural factors (e.g., climate and terrain) and human factors (e.g., farming methods and agricultural inputs) will lead to CLQ differences to some extent [37]. Therefore, screening the evaluation indicators and determining the weights has become the premise of CLQ evaluation at a multi-scale. According to the characteristics of study areas and based on the characteristic elements of the cultivated land, this study adopted the combination of qualitative and quantitative methods, using the hierarchical cluster and Delphi methods to screen the evaluation factors. This study also used the AHP method to determine the indicator weights, where the CLQ evaluation at multiple spatial scales (province, city, and county) and temporal scales (the twice and third survey) were realized. These methods can be used for a reference as a multi-scale land evaluation.
(2) CLQ has a significant spatial variability, and the possible reasons are discussed here. On the one hand, the driving factors of CLQ (e.g., soil nutrients) have a significant scale variability [38], which directly leads to the scale difference of CLQ. On the other hand, the evaluation tries to reflect the CLQ at this scale, and the difference in the evaluation system indirectly leads to the difference in CLQ [39]. Therefore, the scale transformation of the evaluation system has become the key to solving the scale effect problem and conducting multi-scale comprehensive research. In this paper, the linear model was used to realize the scale transformation of the evaluation system between province, city, and county. Compared with the evaluation system directly using other scales, the obtained model has a simple structure, which can effectively avoid the disadvantages of repeated evaluation and realize the CLQ transformation quickly and efficiently at different scales, which is consistent with the research results of Zhang et al. [40]. However, the selected study areas are primarily located in hilly areas, so the applicability of the scale transformation model in plain areas needs further discussion.
(3) Based on the use of the scale transformation model to ensure the scale suitability and comparability of the evaluation system, this study found that the evaluation results at different scales in the same region are both similar and different. With the evaluation scale increases, the comprehensiveness and generality of the evaluation results increases, the number of evaluation units decreases, and the high and low land levels gradually changed to medium-level land. However, with the evaluation scale decreases, the diversity and multiplicity of CLQ are gradually enhanced, the cultivated land patches are more fragmented, the implied CLQ information in a large scale is gradually highlighted, and the spatial distribution of each grade is more refined, which is similar to the research of Odeh et al., Luan et al., and Su et al. in other fields [41,42,43]. However, the Integrated Fertility Index (IFI) was taken as the research object in this paper, which cannot reveal the internal correlation and mechanism of CLQ influencing factors at multi-scale. Relevant content will become the focus of the following research.
(4) CLQ has a significant temporal scale effect. With the time change, it shows the characteristic of time autocorrelation. Under the natural state, the CLQ is relatively stable in a certain period [44]. However, due to differences in farmland management measures and agricultural input levels, the CLQ constantly changes over time [45]. As a result, dynamic evaluation and long-term monitoring of CLQ are essential, but current studies mainly analyze the change under the same evaluation system [46,47]. However, over time, on the one hand, affected by the spatial and temporal heterogeneity of land, the driving factors of CLQ will change, and the previous evaluation system will no longer be applicable [48]. On the other hand, scholars’ cognition of CLQ is constantly improving, resulting in continuous changes in the evaluation system, where the ecological environment factors have increasingly become an essential indicator. Therefore, how to achieve comparability has become the primary problem in the dynamic monitoring of CLQ. In this paper, the linear model was used to realize the temporal scale transformation of the evaluation system from the second survey to the third survey. It is found that the CLQ has a good development trend, but it still mainly indicates medium-level land and has much room for improvement in Laixi city. The obtained temporal scale transformation model effectively enhances the dynamic comparability of CLQ.
5. Conclusions
This paper uses the linear model to carry out the spatial and temporal transformation of multi-scale CLQ. Multiple methods were integrated to realize the spatial scale effect and the dynamic change analysis of CLQ. The following conclusions are drawn:
(1) The spatial scale transformation models are y = 0.722x + 0.262 (from county-scale to city-scale), y = 0.851x + 0.150 (from county-scale to provincial-scale), y = 0.969x – 0.016 (from city-scale to county-scale), y = 0.827x + 0.144 (from city-scale to provincial-scale), y = 1.108x – 0.124 (from provincial-scale to county-scale), and y = 1.005x – 0.007 (from provincial-scale to city-scale). The temporal scale transformation model is y = 0.847x + 0.150 (from the second survey to the third survey), with R2 > 0.826, which has a simple structure, good fitting effect, strong stability and universality, and is suitable for the transformation and unification of a multi-scale CLQ evaluation system.
(2) With the administrative scale increases, the number of evaluation units decreases, the average and median of IFI first decrease and then increase, and the standard deviation and coefficient of variation first increase and then decrease. The high and low land levels change to medium-level land. The spatial distribution is generally consistent and gradually approximate, and the spatial aggregation degree is shown as county-scale > provincial-scale > city-scale, with significant scale effect.
(3) In the past ten years, CLQ has been continuously improved in Laixi city. The weighted average grade (WAG) has been increased from 6.26 to 6.13, the area proportion of high-level land has been increased from 6.16% to 7.07%, the medium-level land has been increased from 65.78% to 67.16%, and the low-level land has been reduced from 28.06% to 25.77%.
This paper proposes a spatio-temporal scale transformation method of the evaluation system, which can effectively realize the spatial variation and the dynamic change characteristics analysis of multi-scale CLQ. It can accurately grasp the CLQ grade distribution at different scales, and provides a scientific basis for guiding cultivated land resource management and agricultural production according to local conditions.
Author Contributions
Conceptualization, Y.L. and G.Z.; data curation, formal analysis, and methodology, Y.L., C.C., Y.Z., and Z.W.; funding acquisition and supervision, G.Z.; investigation, project administration, and resources, T.L., J.L., J.D., and R.F.; software, validation, and visualization, Q.W., J.Y., and S.Z.; writing—original draft, Y.L.; writing—review and editing, G.Z., C.C., and Z.W. All authors have read and agreed to the published version of the manuscript.
Funding
This research was funded by the National Natural Science Foundation of China (41877003), the Major Scientific and Technological Innovation Project in Shandong Province (2019JZZY010724), and the Funds of Shandong “Double Tops” Program (SYL2017XTTD02).
Institutional Review Board Statement
Not applicable.
Informed Consent Statement
Not applicable.
Data Availability Statement
Not applicable.
Conflicts of Interest
The authors declare that they have no conflict of interest.
References
- Pham, T.G.; Nguyen, H.T.; Kappas, M. Assessment of soil quality indicators under different agricultural land uses and topographic aspects in Central Vietnam. Int. Soil Water Conserv. Res. 2018, 6, 280–288. [Google Scholar] [CrossRef]
- Rogozan, G.C.; Micle, V.; Sur, I.M. Maps of heavy metals in Cluj County soils developed using the Regression-Kriging method. Environ. Eng. Manag. J. 2016, 15, 1035–1039. [Google Scholar] [CrossRef]
- Li, Y.Q.; Shi, K.F.; Wang, Y.H.; Yang, Q.Y. Quantifying and evaluating the cultivated areas suitable for fallow in Chongqing of China using multisource data. Land 2021, 10, 74. [Google Scholar] [CrossRef]
- Rondhi, M.; Pratiwi, P.A.; Handini, V.T.; Sunartomo, A.F.; Budiman, S.A. Agricultural land conversion, land economic value, and sustainable agriculture: A case study in East Java, Indonesia. Land 2018, 7, 148. [Google Scholar] [CrossRef] [Green Version]
- Chen, R.S.; Cai, Y.L. Progress in the study of scale issues in land change science. Geograph. Res. 2010, 29, 1244–1256. [Google Scholar]
- Yang, Z.F.; Yu, T.; Hou, Q.Y.; Xia, X.Q.; Feng, H.Y.; Huang, C.L.; Wang, L.S.; Lv, Y.Y.; Zhang, M. Geochemical evaluation of land quality in China and its applications. J. Geochem. Explor. 2014, 139, 122–135. [Google Scholar] [CrossRef]
- Ma, R.M.; Ma, R.H.; Han, D.M.; Yun, W.J. Construction of cultivated land quality evaluation system in provincial level based on multilevel indicators. Trans. Chin. Soc. Agric. Eng. 2018, 34, 249–257. [Google Scholar]
- Jahanshiri, E.; Nizar, N.M.M.; Suhairi, T.A.S.T.M.; Gregory, P.J.; Mohamed, A.S.; Wimalasiri, E.M.; Azam-Ali, S.N. A land evaluation framework for agricultural diversification. Sustainability 2020, 12, 3110. [Google Scholar] [CrossRef] [Green Version]
- Nabiollahi, K.; Taghizadeh-Mehrjardi, R.; Kerry, R.; Moradian, S. Assessment of soil quality indices for salt-affected agricultural land in Kurdistan Province, Iran. Ecol. Indic. 2017, 83, 482–494. [Google Scholar] [CrossRef]
- Wang, Q.T.; Kong, X.B.; Yun, W.J.; Chen, W.Q.; Xin, Y.N.; Zhang, Q.P. The application of the method for cultivated land quality gradation in the new era: A case study in Pingshan county, Hebei province. China Land Sci. 2018, 32, 59–66. [Google Scholar]
- Seyedmohammadi, J.; Sarmadian, F.; Jafarzadeh, A.A.; McDowell, R.W. Development of a model using matter element, AHP and GIS techniques to assess the suitability of land for agriculture. Geoderma 2019, 352, 80–95. [Google Scholar] [CrossRef]
- Messing, I.; Fagerström, M.H.H.; Chen, L.D.; Fu, B.J. Criteria for land suitability evaluation in a small catchment on the Loess Plateau in China. Catena 2003, 54, 215–234. [Google Scholar] [CrossRef]
- Cheng, J.N.; Zhao, G.X.; Zhang, Z.X.; Wang, J. GIS supported comprehensive evaluation of cultivated land quality at small scale—A case study in Dingzhuang town of Shandong Province. J. Nat. Resour. 2009, 24, 536–544. [Google Scholar]
- Vasu, D.; Srivastava, R.; Patil, N.G.; Tiwary, P.; Chandran, P.; Singh, S.K. A comparative assessment of land suitability evaluation methods for agricultural land use planning at village level. Land Use Policy 2018, 79, 146–163. [Google Scholar] [CrossRef]
- Li, W.Y.; Zhu, C.M.; Wang, H.; Xu, B.G. Multi-scale spatial autocorrelation analysis of cultivated land quality in Zhejiang province. Trans. Chin. Soc. Agric. Eng. 2016, 32, 239–245. [Google Scholar]
- Zhang, H.; Zhao, X.M.; Ouyang, Z.C.; Guo, X.; Li, W.F.; Kuang, L.H.; Ye, Y.C.; Huang, C.; Wang, X.Y. Multi-scale spatial autocorrelation analysis of cultivated land quality in China’s southern hillside areas: A case study of Lichuan county, Jiangxi province. Chin. J. Eco Agric. 2018, 26, 263–273. [Google Scholar]
- Sun, C.K.; Xu, J.L.; Yu, D.; Zhou, W.; Wang, J.P.; Liang, Z.B. Spatial distribution of cultivated land quality at different scales in Chongyi County. Chin. J. Eco Agric. 2019, 27, 601–612. [Google Scholar]
- Kiani, M.; Hernandez-Ramirez, G.; Quideau, S.; Smith, E.; Janzen, H.; Larney, F.J.; Puurveen, D. Quantifying sensitive soil quality indicators across contrasting long-term land management systems: Crop rotations and nutrient regimes. Agric. Ecosyst. Environ. 2017, 248, 123–135. [Google Scholar] [CrossRef]
- Lin, L.; Ye, Z.R.; Gan, M.Y.; Shahtahmassebi, A.R.; Weston, M.; Deng, J.S.; Lu, S.G.; Wang, K. Quality perspective on the dynamic balance of cultivated land in Wenzhou, China. Sustainability 2017, 9, 95. [Google Scholar] [CrossRef] [Green Version]
- Liu, L.M.; Zhou, D.; Chang, X.; Lin, Z.L. A new grading system for evaluating China’s cultivated land quality. Land Degrad. Dev. 2020, 31, 1482–1501. [Google Scholar] [CrossRef]
- Wang, R.Y.; Zhao, G.X.; Li, T.; Yue, Y.D. GIS supported quantitative evaluation of cultivated land fertility. Trans. Chin. Soc. Agric. Eng. 2004, 20, 307–310. [Google Scholar]
- Zhao, R.; Wu, K.N.; Li, X.L.; Gao, N.; Yu, M.M. Discussion on the Unified Survey and evaluation of cultivated land quality at county scale for China’s 3rd national land survey: A case study of Wen County, Henan Province. Sustainability 2021, 13, 2513. [Google Scholar] [CrossRef]
- Huang, F.; Liu, D.; Tan, X.; Wang, J.; Chen, Y.; He, B. Explorations of the implementation of a parallel IDW interpolation algorithm in a Linux cluster-based parallel GIS. Comput. Geosci. 2011, 37, 426–434. [Google Scholar] [CrossRef]
- Chen, S.; Lin, B.W.; Li, Y.Q.; Zhou, S.N. Spatial and temporal changes of soil properties and soil fertility evaluation in a large grain-production area of subtropical plain, China. Geoderma 2020, 357, 113937. [Google Scholar] [CrossRef]
- The Ministry of Agriculture of the People’s Republic of China. Rules for Soil Quality Survey and Assessment (NY/T 1634-2008). 2008. Available online: https://www.chinesestandard.net/PDF/BOOK.aspx/NYT1634-2008 (accessed on 1 August 2021).
- General Administration of Quality Supervision, Inspection, Quarantine of the (AQSIQ), P.R.C., Standardization Administration of China (SAC). Cultivated Land Quality Grade (GB/T 33469-2016). 2016. Available online: https://www.chinesestandard.net/PDF/BOOK.aspx/GBT33469-2016 (accessed on 1 August 2021).
- Di Vita, G.; Zanchini, R.; Falcone, G.; D’Amico, M.; Brun, F.; Gulisano, G. Local, organic or protected? Detecting the role of different quality signals among Italian olive oil consumers through a hierarchical cluster analysis. J. Clean. Prod. 2021, 290, 125795. [Google Scholar] [CrossRef]
- Ocampo, L.; Ebisa, J.A.; Ombe, J.; Escoto, M.G. Sustainable ecotourism indicators with fuzzy Delphi method—A Philippine perspective. Ecol. Indic. 2018, 93, 874–888. [Google Scholar] [CrossRef]
- Hoang, H.T.; Truong, Q.H.; Nguyen, A.T.; Hens, L. Multicriteria evaluation of tourism potential in the central highlands of vietnam: Combining geographic information system (GIS), analytic hierarchy process (AHP) and principal component analysis (PCA). Sustainability 2018, 10, 3097. [Google Scholar] [CrossRef] [Green Version]
- Akter, M.; Jahan, M.; Kabir, R.; Karim, D.S.; Haque, A.; Rahman, M.; Salehin, M. Risk assessment based on fuzzy synthetic evaluation method. Sci. Total Environ. 2019, 658, 818–829. [Google Scholar] [CrossRef]
- Fathelrahman, E.M.; Ascough, J.C., II; Hoag, D.L.; Malone, R.W.; Heilman, P.; Wiles, L.J.; Kanwar, R.S. Continuum of risk analysis methods to assess tillage system sustainability at the experimental plot level. Sustainability 2011, 3, 1035–1063. [Google Scholar] [CrossRef] [Green Version]
- Das, M.; Das, A.; Pereira, P.; Mandal, A. Exploring the spatio-temporal dynamics of ecosystem health: A study on a rapidly urbanizing metropolitan area of Lower Gangetic Plain, India. Ecol. Indic. 2021, 125, 107584. [Google Scholar] [CrossRef]
- Li, H.Y.; Liu, X.L.; Hu, B.F.; Biswas, A.; Jiang, Q.S.; Liu, W.Y.; Wang, N.; Peng, J. Field-scale characterization of spatio-temporal variability of soil salinity in three dimensions. Remote Sens. 2020, 12, 4043. [Google Scholar] [CrossRef]
- Wang, J.; Qiu, Y. Review on spatial variability and scale effects of land quality. Prog. Geogr. 2005, 4, 28–35. [Google Scholar]
- Goenster-Jordan, S.; Jannoura, R.; Jordan, G.; Buerkert, A.; Joergensen, R.G. Spatial variability of soil properties in the floodplain of a river oasis in the Mongolian Altay Mountains. Geoderma 2018, 330, 99–106. [Google Scholar] [CrossRef]
- Zhao, C.; Zhou, Y.; Jiang, J.H.; Xiao, P.N.; Wu, H. Spatial characteristics of cultivated land quality accounting for ecological environmental condition: A case study in hilly area of northern Hubei province, China. Sci. Total Environ. 2021, 774, 145765. [Google Scholar] [CrossRef]
- Shukla, M.K.; Lal, R.; Ebinger, M. Determining soil quality indicators by factor analysis. Soil Tillage Res. 2006, 87, 194–204. [Google Scholar] [CrossRef]
- Wang, M.M.; Chen, H.S.; Zhang, W.; Wang, K.L. Influencing factors on soil nutrients at different scales in a karst area. Catena 2019, 175, 411–420. [Google Scholar] [CrossRef]
- Zhao, Y.F.; Cheng, D.Q.; Chen, J.; Sun, Z.Y.; Zhang, H.N. Problems and analytical logic in building cultivated land productivity evaluation index system. Acta Pedol. Sin. 2015, 52, 1197–1208. [Google Scholar]
- Zhang, Y.L.; Zhou, Y.; Zhai, X.Y.; Guo, S.J.; Yu, L.; Huang, J.C.; Cheng, D.Q. Scale transformation method and its application of cultivated land productivity evaluation between county and city. Soil Water Conserv. 2015, 29, 327–331. [Google Scholar]
- Odeh, I.O.A.; Todd, A.J.; Triantafilis, J.; McBratney, A.B. Status and trends of soil salinity at different scales: The case for the irrigated cotton growing region of eastern Australia. Nutr. Cycl. Agroecosyst. 1998, 50, 99–107. [Google Scholar] [CrossRef]
- Luan, H.J.; Tian, Q.J.; Yu, T.; Hu, X.L.; Huang, Y.; Du, L.T.; Zhao, L.M.; Wei, X.; Han, J.; Zhang, Z.W.; et al. Modeling continuous scaling of NDVI based on fractal theory. Spectrosc. Spectral Anal. 2013, 33, 1857–1862. [Google Scholar]
- Su, B.W.; Zhao, G.X.; Dong, C. Spatiotemporal variability of soil nutrients and the responses of growth during growth stages of winter wheat in northern China. PLoS ONE 2018, 13, e0203509. [Google Scholar] [CrossRef] [PubMed]
- Vasu, D.; Singh, S.K.; Ray, S.K.; Duraisami, V.P.; Tiwary, P.; Chandran, P.; Nimkar, A.M.; Anantwar, S.G. Soil quality index (SQI) as a tool to evaluate crop productivity in semi-arid Deccan plateau, India. Geoderma 2016, 282, 70–79. [Google Scholar] [CrossRef]
- Aziz, I.; Mahmood, T.; Islam, K.R. Effect of long term no-till and conventional tillage practices on soil quality. Soil Tillage Res. 2013, 131, 28–35. [Google Scholar] [CrossRef]
- Sonneveld, M.P.W.; Hack-ten Broeke, M.J.D.; Van Diepen, C.A.; Boogaard, H.L. Thirty years of systematic land evaluation in The Netherlands. Geoderma 2010, 156, 84–92. [Google Scholar] [CrossRef]
- Cao, J.J.; Zhou, Y.; Ye, Q.Q.; Yun, W.J.; Leng, G.Y. Reasearch on county-level cultivated land classification update methods based on the fuzzy matter-elementand Kriging interpolation method. Econ. Geogr. 2012, 32, 131–137. [Google Scholar]
- Qiu, Y.; Wang, Y.; Fu, B.J.; Wang, J.; Meng, Q.H. Spatiotemporal variation in soil quality and its relation to the environmental factors. Prog. Geogr. 2008, 4, 42–50. [Google Scholar]
Publisher’s Note: MDPI stays neutral with regard to jurisdictional claims in published maps and institutional affiliations. |
© 2021 by the authors. Licensee MDPI, Basel, Switzerland. This article is an open access article distributed under the terms and conditions of the Creative Commons Attribution (CC BY) license (https://creativecommons.org/licenses/by/4.0/).