Abstract
Green supply chain management (GSCM) is an important management means for enterprises to achieve sustainable development and green transformation. However, the intrinsic mechanism by which GSCM impacts the sustainable development performance (SDP) of enterprises remains a theoretical “black box”. Based on the Porter’s hypothesis, this study constructs a moderated mediation model from the theoretical perspective of green innovation and signal transmission to explore this intrinsic mechanism. Then, this study analyzes data from China’s Shanghai and Shenzhen A-share listed companies from 2015 to 2020 to conduct an empirical analysis to test the model. The results show that GSCM has a significantly positive effect on SDP. The mediating effect of green innovation and the moderating effect of green subsidies are significant. The results remain valid after a series of endogeneity and robustness tests.
1. Introduction
Increasingly serious ecological and environmental problems and natural resource depletion have led people to become increasingly concerned with sustainable development. Manufacturing enterprises are a main source of energy consumption and environmental pollution, and receive significant pressure from the government, society, customers, and other stakeholders. To protect the environment, manufacturing enterprises must implement sustainable development and green transformation. The practice of green supply chain management (GSCM) is an effective means for enterprises to achieve sustainable development and green transformation. An increasing number of Chinese enterprises have begun to construct green supply chains.
GSCM is a supply chain management model where products are produced in a fully enclosed process from suppliers to producers and consumers; it also integrates reverse logistics, with the goal of comprehensively considering economic and environmental benefits [1]. The goal of GSCM is to integrate environmentalism into the entire supply chain process to reduce environmental consumption and optimize resource allocation, improving social welfare and promoting the sustainable and stable development of the social economy [2]. This highlights the research needed to explore the efficacy of GSCM and green innovation to improve the sustainable performance of enterprises.
Most studies on GSCM have adopted the classical theoretical logic of “external pressure—green supply chain—enterprise performance”. These studies apply institutional theory and stakeholder theory to identify the driving effects of government, shareholders, and consumers on the green supply chain of enterprises [3,4]. Other studies have applied a resource-based view (RBV) to deeply analyze the role of the green supply chain on financial performance [5] or environmental performance [6,7]. Some research results report a virtuous circle between corporate environmental and financial performance, while others report that improvements in environmental performance do not lead to improvements in the financial condition [8]. This study applies both financial performance and environmental performance to comprehensively evaluate the sustainable development performance (SDP) of enterprises.
Past research has found that GSCM significantly impacts the financial and environmental performance of enterprises; however, the internal mechanism driving how GSCM affects enterprise SDP is unclear. The Porter’s hypothesis argues that strict environmental regulations can stimulate innovation, balance the cost of regulatory compliance, and positively impact the operational performance of these enterprises [9]. Using Porter’s hypothesis, this study explores the internal connection between GSCM and sustainable development from the perspective of green innovation theory.
Most empirical studies on GSCM have used cross-sectional data collected using questionnaires [10]. These studies have two key shortcomings. First, the conclusions may be biased due to the subjectivity of the questionnaire. Second, few studies have used longitudinal data to assess the mechanism by which green supply chain management impacts sustainable development performance. It takes time for GSCM implementation to generate performance outcomes. As such, longitudinal studies are critical for understanding changes over time, and performance outcomes from the implementation of GSCM practices [10].
The main contribution in the research is to construct a moderated mediation model to explore the internal mechanism by which GSCM impacts corporate SDP, based on green innovation and signaling theory. Further, this study adopts objective research methods using a time series database. Using data for A-share listed companies in Shanghai and Shenzhen of China from 2015 to 2020, this study applies a non-equilibrium panel model to conduct a longitudinal study with large data sets. This approach is more objective compared with studies using questionnaire-based cross-section data.
The rest of this paper is organized as follows. Section 2 provides a theoretical analysis on the relationship between GSCM and SDP, the mediating effect of green innovation (GI), and the moderating effect of government green subsidies. Section 3 introduces the research design in detail. Section 4 reports the application of the negative binomial fixed effect model to test and analyze the intrinsic relationship between GSCM and SDP. Section 5 reports the outcomes of tests on the endogeneity and robustness of the research model used in this study. Section 6 is the conclusion of the study.
2. Theoretical Background and Hypothesis Development
2.1. GSCM and SDP
GSCM practice refers to the environmental management activities implemented in an enterprise’s supply chain. These activities can be further divided into internal practices and external practices [11]. Internal practices encompass green management [12], green design [13], and corporate social responsibility [14]; external practices include green purchasing and green marketing. Research on the relationship between GSCM practice and performance has attracted significant attention. However, researchers have not reached a consensus on the relationship between GSCM and financial performance. Vachon and Klassen (2008) pointed out that GSCM advances environmental friendliness throughout the life cycle of a product, leading to changes in environmental awareness, management systems, and environmental technologies. These, in turn, play a positive role in operational performance such as enhancing productivity and product quality [15]. However, Zhu and Sarkis (2004) noted that, in the face of increasing stringency with respect to environmental regulations and other factors, enterprises in developing countries with weak environmental technologies and equipment are making large investments to implement GSCM, resulting in higher costs and having a negative impact on the financial performance [16].
Based on “signaling theory”, this study hypothesizes that enterprises implementing GSCM will convey their willingness to actively comply with environmental regulations and meet the green needs of stakeholders, and convey the signals of social responsibility to win recognition and trust from the government, consumers, and other stakeholders. This enables enterprises to obtain key resources needed for their own development, improving their financial performance.
GSCM studies have shown that both internal practices and external practices have positive effects on environmental performance [10]. For example, Arimura et al. (2011) and Zsidisin and Hendrick (1998) examined the positive effects of green management, green design, green procurement, and green marketing on environmental performance [17]. Vachon (2007) found that environmental cooperation between enterprises and suppliers is positively related to investment in pollution control technologies [18]. Therefore, green purchasing ensures product quality, effectively reduces costs, and encourages enterprises to constantly launch new environment-friendly products or improve the production process. This improves environmental performance.
The analysis above leads to the following hypotheses:
Hypothesis 1a (H1a).
GSCM contributes to the improvement of corporate financial performance.
Hypothesis 1b (H1b).
GSCM contributes to the improvement of corporate environmental performance.
2.2. Mediating Effects of Green Innovation (GI)
2.2.1. GSCM and GI
By researching, developing, and applying green products and green technology, GI makes the life cycle of a product more “green” to achieve a “win-win” balance of economic and environmental benefits. Green innovation originates from product innovation, process innovation, and other aspects. As such, manufacturing enterprises should consider both product and process design when pursuing sustainable development [19].
From the perspective of external practices, green purchasing is at the front end of the supply chain. By choosing appropriate suppliers and cooperating closely with them, enterprises can ensure the supply of raw materials, and ensure that the purchased products satisfy the needs of green management. In GSCM, enterprises can introduce management strategies like quality management and just-in-time production to improve production processes, by establishing close ties with suppliers. Geffen et al. (2000) found that a good cooperative relationship between enterprises and suppliers, coupled with appropriate incentive measures, can effectively promote green innovation [10].
The collaboration between enterprises and consumers is at the back end of the supply chain, and their mutual cooperation on environmental issues is an important factor in promoting enterprise environmental management and environmental performance. Environmental pressure from consumers or foreign companies prompts Chinese enterprises to self-regulate with respect to environmental management [20]. Consumers raise certain environmental requirements for products, and specific standards for product design and the production process. In response to these requirements, enterprises improve their technology and update their products and production processes. An interactive enterprise and consumer collaborative process, which can promote mutual understanding and knowledge sharing, helps enterprises to understand consumers’ environmental requirements, guides them to green product innovation, and improves their green innovation capabilities.
From the perspective of internal practice, senior management commitment and support within an enterprise to GSCM strengthens the organization’s understanding of the importance of environmental management [8]. Collaboration among all departments increases the effectiveness of internal environmental management, environmental protection consciousness, and the smooth delivery of environmental protection technology among the departments, which will promote GI. The GI process considers environmental demands from stakeholders like suppliers, consumers, and governments. To minimize pollution, enterprises will choose alternative products or materials that are environmentally friendly, reengineer production to reduce energy loss and resource inputs, and improve the recyclability of products. This background indicates that the internal and external practices of GSCM potentially trigger green innovation, leading to the following hypothesis.
Hypothesis 2 (H2).
GSCM has a positive effect on the GI.
2.2.2. GI and SDP
The goal of GI is to develop processes that reduce energy consumption in production, reduce emissions and waste, and use renewable energy that can be reused and recycled in closed-loop systems. Business managers have recognized that green innovation plays an important role in achieving their sustainable development goals [21]. GI includes new or modified products, processes, and services, and management, which adds value to customers and businesses. This significantly reduces the adverse impacts on the environment [22]. In contrast to traditional innovation, GI places more emphasis on the use of new technologies and ideas to achieve efficient resource utilization and pollution reduction, while also achieving economic performance. Furthermore, the purpose of GI is to produce environmental benefits, rather than just reducing environmental pressure [23].
El-Kassar and Singh (2019) noted that green innovation can be divided into green product innovation and green technology innovation [24]. Green product innovation can develop enterprises with more differentiated products and capital portfolios. When done in response to market demand, it can meet consumers’ pursuit of product quality and environmental awareness, strengthen green differentiation advantages, enhance the financial performance of enterprises, and create more environmental premiums [25]. Green investments in the capital market are also being increasingly more directed towards enterprises that are more likely to produce differentiated green products.
In contrast, green technology innovation focuses on adopting clean energy and the introduction of production technologies, like energy-saving equipment, to alleviate non-renewable energy constraints. This helps the enterprise more effectively meet government environmental regulation requirements. Meanwhile, this also effectively treats pollution, reducing pollutants emissions and generating a good green image of the enterprise [26]. In addition, green technology innovation is devoted to streamlining the process, reducing production time, improving productivity, and avoiding excessive energy consumption [27]. Green product innovation and green technology innovation work in different ways on corporate SDP; however, both have a positive impact.
Therefore, in implementing GI, enterprises can reduce resource costs, improve the technology, and achieve environmental protection through green technology innovation. Furthermore, enterprises generate competitive environmental premiums through green product innovation, and can establish a good business image to further improve their environmental performance. GI is increasingly seen as an important strategy for enterprises to gain a sustainable competitive advantage [28]. This background leads to the following hypotheses:
Hypothesis 3a (H3a).
GI contributes to the improvement of corporate financial performance.
Hypothesis 3b (H3b).
GI contributes to the improvement of corporate environmental performance.
2.2.3. Moderating Effect of Green Subsidy (GS)
From an institutional and governance perspective, government environmental subsidies play an important role in the production and operation of enterprises [29]. To strengthen environmental control within a region, the local government implements measures, such as raising taxes, reducing subsidies, and suspending the water supply and electricity to oversee and encourage enterprises to implement green innovation and pollution abatement. Local governments also support GSCM and GI by adopting fiscal taxation policies to alleviate the constraints faced by enterprises implementing GSCM and financing green innovation.
Based on the leverage effect hypothesis and certification effect hypothesis, GS and the evaluation mechanism, developed by the government, help enterprises improve their GSCM and GI input performance [30]. GS provides enterprises with resources needed for GSCM and GI, triggering a sense of moral identity, and motivating them to demonstrate a stronger accountability for environmental protection. The green innovation resulting from the efforts mentioned above are posited to lead to a more efficient use of resources and speed the transformation of resource inputs into green innovation outputs [31]. Moreover, based on the signaling mechanism [22], GS conveys the willingness of enterprises to actively fulfill their social responsibilities, helps them to establish high-quality social network relationships, improves their financing ability in the capital market, and accelerates the promotion of green products, thereby strengthening the positive relationship between GSCM and GI.
This analysis leads to the following hypothesis.
Hypothesis 4a (H4a).
GS plays a positive moderating role in the relationship between GSCM and GI.
In summary, GSCM can improve the SDP of an enterprise by enhancing the GI. GS provides enterprise-level GSCM and GI with required resources and plays a role in influencing an enterprise’s reputation. In other words, enterprises convey an important signal to other stakeholders, such as the government and customers, that they are trustworthy. Therefore, this study proposes that GS affects the mediating effect of GI on the relationship between GSCM and SDP (as shown in Figure 1). Specifically, when an enterprise receives GS, the marginal effect of GSCM on GI is projected to increase, intensifying the indirect effects of GI on SDP. Based on H4a, this study further proposes the following hypothesis.
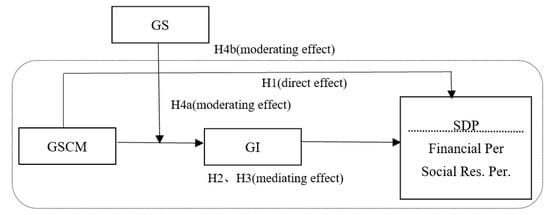
Figure 1.
Theoretical model.
Hypothesis 4b (H4b).
GS positively moderates the mediating effect of GI on the relationship between GSCM and SDP.
Figure 1 shows the theoretical model designed for this study.
3. Methodology
3.1. Samples Selection and Data Source
To obtain reliable data, this study used the following steps to filter research samples: (1) data about A-share listed companies in Shanghai and Shenzhen, China, from 2015 to 2020 in the list of the Green Supply Chain-Corporate Information Transparency Index (CITI) Annual Evaluation Report, published by the Institute of Public and Environmental Affairs and Natural Resources Defense Council in China (IPEA/NRDC) were collected for a detailed analysis. (2) All of the ST and PT corporations and the listed companies that have not announced their corporate social responsibility (CSR) reports during the given period were eliminated. (3) Companies with incomplete data and with negative social responsibility value were removed from the sample. (4) A non-equilibrium panel database consisting of 815 research samples from 146 listed companies from 2015 to 2020 was established.
To eliminate the effect of extreme values, continuous variables with outliers were winsorized based on 1% quantile tailing. The patent data of the listed companies were collected from the State Intellectual Property Office (SIPO) and incoPat Global Patent Database. The data about CSR fulfillment were collected from the CSR report of the Hexun Network, and other data from the China Stock Market and Accounting Research Database (CSMAR).
3.2. Variable Measurement
3.2.1. Green Supply Chain Management (GSCM)
The IPEA/NRDC report has released CITI each year since 2015 to advance green supply chain management in China. This report collects environmental monitoring information on enterprises to dynamically evaluate their GSCM. This makes the GSCM evaluation index both objective and accurate.
The CITI evaluation system includes five dimensions: engagement and responsiveness, compliance and corrective action, extended green supply chain behavior, data disclosure and transparency, and responsible recycling. Each dimension is allocated a specific score totaling up to 100 points [32]. Engagement and responsiveness represent the company’s response to environmental pollution caused by upstream suppliers. Compliance and corrective actions indicate whether companies communicate with their upstream suppliers and require them to correct environmental violations. Extended green supply chain behaviors reflect whether companies recommend that upstream suppliers conduct GSCM to reduce environmental pollution. Data disclosure indicates whether companies require suppliers to reveal environmental information. Responsible recycling shows whether the company recycles its products and reduces possible environmental pollution.
3.2.2. Green Innovation (GI)
Past studies have used three main methods to measure GI. The first method is that the volumes of SO2, CO2, and industrial waste emissions are placed into a stochastic frontier function or data envelopment analysis model. GI is then characterized by measuring green total factor productivity [25]. The second method is that GI is divided into process innovation, product innovation, and end-of-line governance [33]. The third method measures GI using the number of green patents [33].
Considering the study focus and data availability, this study adopts the third method to measure GI. To define the green patents used, the International Green List of Patent Classification, launched by the World Intellectual Property Organization (WIPO) in 2010, was used to screen patent information related to environmentally friendly technologies. Additional searches were conducted in the National Intellectual Property Office. Based on these criteria, the number of green patent applications for listed companies in Shanghai and Shenzhen stock markets was identified [33].
3.2.3. Sustainability Development Performance (SDP)
Based on Ilias et al. (2018), SDP is divided into two dimensions: financial performance and environmental performance [8]. Based on Xie et al. (2019), a return on equity (ROE) is adopted to assess financial performance [26]. Based on Huang and Li (2017), a total CSR rating score issued by a third party is used to measure the environmental performance of enterprises [21].
3.2.4. Green Subsidy (GS)
The green subsidy refers to the amount of government subsidy provided to the sample companies for green production, green manufacturing, and green innovation during the specific time period [34,35]. Its values are manually determined using accounting items labeled non-business income or expenditures in the CSMAR database. Specifically, this variable includes green tax incentives, local green subsidies, green innovation incentives, green innovation funds, and supporting funds. For enterprises of different scales, the same amounts of government subsidies produce different effects. Therefore, this study adopts the government green subsidy intensity, or the ratio of the government green subsidy to total assets at the end of each fiscal year, to eliminate the impact of enterprise scale.
3.2.5. Control Variables
Five key control variables are used in this study, based on Ilias et al. (2018) [8], Li et al. (2019) [25], Sorensen and Stuart (2000) [35], Suphi (2015) [36], and Dong et al. (2021) [33].
- (1)
- Enterprise Scale. This variable is measured using the net assets and the number of employees of an enterprise. The basic production function indicates that capital and labor are considered as input elements and performance is considered as output. Generally, a larger enterprise scale is associated with a stronger innovation ability and higher innovation success rate. To eliminate the impact of dimensional differences and extreme values, capital and labor are expressed as lnCapital and lnLabor after the logarithm of the values are calculated [7,37].
- (2)
- Enterprise Maturity. Scholars have found that enterprises established for a longer period of time have a stronger sense of innovation and innovation ability. The longer an enterprise has been established, the more knowledge and technologies it accumulates, and the more likely it is to be successful in technological innovation [35,37]. Therefore, the age of the listed enterprises is set as a control variable to measure enterprise maturity, which is also logarithmically processed and expressed as lnAge.
- (3)
- Financial Leverage. Financial leverage plays an important role in the environmental investment behavior shown by enterprises. Appropriate debt operations can mitigate any lack of funds for operation and development. More funds are thus available for improving technical equipment, reengineering technologies, and conducting innovation activities. Financial leverage in this study is measured by the ratio of debt to total assets and is expressed as lnLev after the logarithm is applied [35].
- (4)
- ISO Certification Status. ISO14001 certification indicates that an enterprise’s green environmental protection has met the standards set by a broader international social system, which plays an important role in enterprise performance [25]. This study determines whether the companies in the sample held ISO14001 certification during the given period from 2015 to 2020. If a company had this certification, the variable is assigned a value of 1, otherwise it is assigned a 0.
- (5)
- Board Governance. Governance of the board shapes the development strategy and execution of enterprise decisions. The level of this governance directly affects the decision-making and behavior of the enterprise, which affects its performance and stakeholder interests. Governance is a pivotal indicator for measuring corporate governance. In this study, it is measured by the ratio of the number of independent directors to the total number of the board and is expressed as Dire [36]. An independent director is a director who is independent of the company’s shareholders, does not serve within the company, and has no significant business ties or professional affiliations with the company or the company’s management, and makes independent judgments about the company’s affairs.
Table A1, Table A2 and Table A3 in Appendix A provide a detailed definition of each variable, their descriptive statistics, and Pearson correlation coefficients, respectively. The Pearson correlation coefficients among all variables are less than 0.6, and the variance inflation factor (VIF) of all variables is less than 10. This indicates there is no serious multicollinearity interference among variables.
3.3. Models and Methods
There was a lack of available data for some listed companies from 2015 to 2020, resulting in some missing observed values. As such, the study adopts a non-equilibrium panel data regression model. The interpreted variables of green innovation and environmental performance are non-negative counted variables; as such, they are analyzed using a count model. The Poisson model and negative binomial model are two nonlinear panel regression models that are commonly used for this purpose. In this study, the standard deviation of environmental performance in this study is significantly larger than its mean (standard deviation = 127.74, mean = 38.21) (see Table A2), with excessive discretization. Given this, the panel Poisson model would lead to an unreal high level of significance.
To avoid this problem, the samples are assumed to obey a negative binomial distribution and then MLE is applied. This study uses panel data, where there are 146 individuals (N = 146), 6 periods (t = 6), t smaller, and N larger short panels. Therefore, the study adopts a negative binomial model based on the panel data. Because of the presence of unobservable heterogeneity in each enterprise, there may be missing variables that do not vary with time. This highlights the need to control the individual effects using a fixed effect model or random effect model. This research adopts the Hausman test (Chi = 196.42, p value = 0.0000); the fixed effect model is selected based on the results. Therefore, a negative binomial fixed-effect model is used to investigate the relationship between GSCM and SDP.
To test Hypothesis 1 and 2, a mediation effect test [38] is adopted to construct the following regression model, which gradually assesses whether the regression coefficients in Models (1)–(3) are significant and non-zero. If at least one of coefficients of GSCM in Model (2) and the coefficient of GI in Model (3) is insignificant, a test on is needed using the bootstrap method. The study adopts a non-parametric percentile bootstrap method based on a deviation correction. If the confidence interval does not contain 0, the product of the coefficients is demonstrated to be significant.
To test Hypothesis 4, this study considers the interaction between the GSCM and GS. This leads to the extended model in Equation (4). Variables need to be centralized before placing them into models to reduce the impact of multicollinearity. With respect to the potential endogeneity in the estimates, this study addresses this challenge using both an instrumental variable approach and SYS-GMM. Moreover, this study applies an alternative variable method and the unconditional negative binomial model proposed by Allison and Waterman (2002) to investigate the robustness of the findings.
4. Empirical Results
4.1. Benchmark Regression
Table 1 shows the regression results of GSCM to SDP. Columns (1)–(3) report results using financial performance as the dependent variable, while columns (4)–(6) report results using environmental performance. In the basic models, columns (2) and (5) report the impact of GSCM on sustainable development performance. The regression coefficient of GSCM is significantly positive at the level of 1%, indicating that GSCM significantly encourages the financial and environmental performance of enterprises. These regression results support H1a and H1b.

Table 1.
Mediation and moderation analyses.
With respect to the control variables, the coefficients of the control variables included in the models are mostly statistically significant, and the results tend to be consistent with previous study findings. Table 1 indicates that the financial performance and environmental performance of Chinese firms is largely driven by different internal factors. In general, larger firms with a longer history, more employees, and a higher ratio of independent directors on the board are more likely to have better financial and environmental performances. The coefficients for these variables are positive and highly significant. However, financial leverage has negatively significant effects on sustainable development performance. The data indicate that enterprises with ISO14001 certification tend to have better environmental performance but may be less likely to have strong financial performance.
4.2. Mediation Test of GI
A three-procedure regression analysis proposed by Baron and Kenny (1986) [38] is used to examine the mediating effect of GI. First, this approach tests the impact of GSCM on financial performance and environmental performance. In Table 1, columns (2) and (5) show the direct effect of GSCM on financial and environmental performance. Results show that the regression coefficients of GSCM are significantly positive at the level of 1%.
Second, this study tests the impact of GSCM on GI. In Table 1, column (7) shows that GSCM significantly positively impacts GI. H2 is supported by the positive coefficient of GSCM (, p < 0.001).
Third, this study tests the mediating effect of GI. Column (3) presents the regression result of GSCM and GI when simultaneously assessed with financial performance. The coefficient of GSCM is positive at the 1% significance level and the coefficient of GI is positive but not significant. This leads to the need for a Bootstrap test [39]. The non-parametric percentile bootstrap method of deviation correction is applied for verification; the sample size is set at 5000 with a 95% confidence level. Table 2 shows the results of the bootstrap test, which indicate that the lower and upper limits of the confidence interval of the mediating effect are 0.025 and 0.237, respectively, where 0 is excluded.
Table 2.
Bootstrap test results.
These results indicate that GI partially mediates the GSCM and financial performance relationship, which accounts for 11.64% of the total effect. This means that 11.64% of GSCM’s impact on financial performance can be explained by GI, supporting H3a. Meanwhile, in Table 1, column (6) presents the regression results of GSCM and GI on environmental performance. The coefficient of GSCM is positive at a 5% significance level, which is smaller than the coefficient of the GSCM in column (5). The coefficient of GI is positive at a 1% significance level. Therefore, GI plays a mediating role in the relationship between GSCM and environmental performance. H3b is also supported.
4.3. Moderation Effect Test of GS
A hierarchical moderated regression analysis is conducted to test the moderating effect of GS in the relationship between GSCM and GI. The interaction item GSCM*GS is added to column (7) of Table 1 to generate column (8). The results in column (8) indicate that the interaction item GSCM*GS has significantly positive effects on GI (β1 = 0.376, p < 0.5). Therefore, GS plays a positive moderating role in the relationship between GSCM and GI. In other words, when an enterprise obtains more GS, it is better able to enhance the positive effect of GSCM on GI. These results support H4a.
This study further examines the moderated mediation effect by applying the Monte Carlo method [37]. The full sample is first split into two sub-samples: a high green subsidy sample and a low green subsidy sample. The Monte Carlo method is used to compute confidence intervals (CI) for the conditional mediation effect of GI on the GSCM and financial and environmental performance for both the low and high GS. Table 3 presents the results of a 20,000-replication sample with a 90% bias-corrected CI. Table 3 shows that the mediating effect of GI between GSCM and financial performance is not significant in either the low or high GS sub-samples. The inter-group difference is also not significant (CI1 = [−0.088, 0.166], including 0). However, the mediating effect of GI between GSCM and environmental performance is significant in both the low and high GS sub-samples (β2 = 0.071, CI2 = [0.025, 0.189], excluding 0; β3 = 0.071, CI2 = [0.135, 0.821], excluding 0), and the inter-group difference is also significant (β4 = 0.124, CI2 = [0.212, 1.930], excluding 0). These results indicate that GS positively moderates the mediating effect of GI between GSCM and environmental performance. This result partially supports H4b.
Table 3.
GS moderating effect on front-end of mediation path.
These regression results are shown in Figure 2.
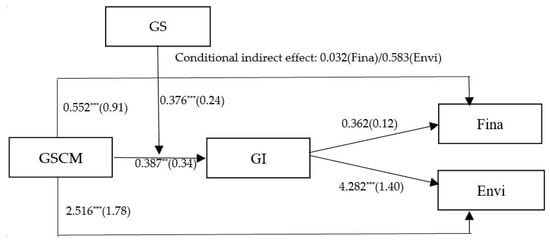
Figure 2.
The regression results. *** p < 0.01, ** p < 0.05.
5. Endogeneity and Robustness Test
5.1. Endogeneity Test
The endogeneity problem resulting from two-way causality is a significant issue to address in this study: GSCM improves the enterprise-level GI, while GI may contribute to improving the enterprise-level GSCM. To alleviate the endogeneity problem, the direct effects of GSCM and GI are further tested using the two-stage instrumental variable model. This study selects the average level of GSCM in different industries as an instrumental variable (GSCM-I) [40]. Table 4 shows that GSCM has significantly positive effects on GI, after accounting for the endogeneity problems (). Moreover, the Cragg–Donald Wald F value is higher than the 10% error tolerance threshold, and the instrumental variable coefficients in the first stage are all significant. Therefore, the instrumental variable selected for this study is valid.
Table 4.
Endogeneity test results.
In addition, missing variables may also lead to an endogeneity problem, even though many control variables have been included in the research models. To further address the potential endogeneity problems in the models, a one-year lag with respect to financial performance and environmental performance is adopted to estimate the dynamic model and SYS-GMM is applied. The regression results are consistent with the research conclusions discussed above. Moreover, the Hansen test results demonstrate that the systematic GMM estimation is valid. Therefore, the estimated results are robust, which further support the study’s conclusions.
5.2. Robustness Check
Two checks are conducted to test the robustness of our main findings. First, ambidextrous performance is selected as an alternative variable to assess enterprise-level financial and environmental performance [40]. Based on the organization ambidexterity theory, the ambidexterity performance here indicates that enterprises simultaneously achieve an effective balance and the joint value of financial and environmental performance with limited resources. Specific measurement procedures are as follows. First, the enterprise-level financial performance and environmental performance are standardized from 0 to 1; the formula is . Based on Zang and Li (2017), the standardized financial performance and environmental performance are transformed into ambidextrous performance (AMP), with the formula: [40]. As shown in the results in Table 5, robustness check 1 indicates that both GSCM and GI have significantly positively effects on AMP. Columns (1)–(4) show that the mediating effect of GI on the impact of GSCM on AMP is also supported.
Table 5.
Robustness test results.
Second, the unconditional negative binominal model proposed by Allison and Waterman (2002) is compared with the traditional model to test the study’s model robustness [41]. By using robust standard deviation, this new model can effectively control the data heteroscedasticity problem. as seen in the results in Table 5, robustness check 2 and the results shown in Table 1 are similar in coefficient and significance, indicating the high stability of the model.
Results of the robustness test show that ambidexterity performance as a substitute variable for SDP, and the application of the unconditional negative binominal model, do not change the research findings. This demonstrates that the conclusions are reliable.
6. Conclusions and Discussion
6.1. Conclusions and Theoretical Implications
Recent corporate sustainability studies have emphasized the important role of GSCM [5,6,7], while the internal mechanism of GSCM affecting SDP remains a black box. This study opens this black box by developing a moderated mediation model. The empirical results confirm the impact of GSCM on SDP, the mediating effect of GI, and the moderating effect of GS by using a negative binominal model of the non-equilibrium panel. This study further verifies a moderated meditation model, such that the indirect impact of GSCM on environmental performance is stronger when enterprises obtain more green subsidies. These results are consistent across a typical regression model, an instrumental variable model, the two-stage least squares method, and an unconditional negative binominal model. As such, the study’s findings are reliable, and are unlikely to be affected by reverse causality or other endogeneity and robustness problems.
The study makes important theoretical contributions to the field. First, from the perspective of SDP, this study expands the research on the effects of GSCM on enterprise-level performance. Previous studies have focused on a single enterprise’s performance, such as financial performance or environmental performance [5,6,7,10]. The study also systematically explains the impact of GSCM on comprehensive sustainable development performance [42,43].
Second, this study proposes a moderated mediation model to investigate the intrinsic mechanism between GSCM and SDP. Studies have shown that GSCM can improve resource efficiency, reduce environmental costs, and provide companies with greater competitive advantages [4,5,6,7], thus encouraging enterprises to address sustainability. Despite the increasing importance of GSCM, few studies have explored how GSCM affects enterprises’ sustainable development [9]. Past studies showed the separate mediating effect of GI and the moderating effect of GS; however, this study focuses on how the complicated relationship between GSCM and SDP is associated with different determinants, showing the possibility of using different variables to explain the mechanisms of GSCM. The study results suggest that green innovation theory [21], and a combination of Porter’s hypothesis [9] and signaling theory [22], both shape and substantiate our theoretical framework. The study’s tests of our conditional process model add value to the GSCM literature by exploring the moderated mediating effect of GS on the mediating effect of GI on GSCM and SDP using the conditional process analysis method suggested by Preacher and Zyphur [38]. In this way, this study opens the black box between GSCM and SDP. Our findings align well with those of GI studies [21,23,35], indicating that GSCM is a driving force of GI and promotes sustainable development.
Third, with respect to the research method, the study adopts objective research methods with time series data. Previous studies have acknowledged the importance of GSCM and have indicated that GSCM may play an important role in GI and SDP [10,19]; however, there remains a lack of convincing empirical analyses [10]. Instead of using a survey research design, this study draws on GSCM data from the IPEA/NRDC report. Objective data from 2015 to 2020 for selected listed companies were collected from the enterprises’ annual reports or other public databases, making the evaluation index for the variables highly objective and accurate. Moreover, a non-equilibrium panel model is applied to support a longitudinal research on GCSM and SDP. Compared with studies using cross-sectional data based on questionnaires [9], the conclusions drawn in this study are more objective and are consistent with the actual reality that GSCM is a dynamic process.
6.2. Managerial Implications
A number of practical implications flow from the findings above. First, enterprises should promote the practice of GSCM to simultaneously achieve high-quality development and environmental protection [42,43]. Enterprises successfully implementing GSCM can obtain unique resources, which can significantly improve their green innovation ability. GSCM practice has a positive effect on enterprise-level financial and environmental performance. Enterprises should learn from advanced enterprises about the GSCM experience, and actively participate in the communication among organizations to promote GSCM practices.
Second, enterprises should maximize green innovation, which can positively impact sustainable performance and strengthen the effect of GSCM on sustainable performance. Under significant environmental pressure, a series of green innovation activities can significantly improve enterprises’ environmental performance, enhance their business image as “green,” and increase their core competencies.
Third, enterprises should increase their interactions with the supply chain partners and strengthen their cooperation with customers. GSCM practices are more likely to succeed with a frequent information exchange and organizational coordination with supply chain partners and customers, and as a result, enterprises are more likely to achieve sustainable development.
6.3. Limitations and Future Directions
This study achieves important research results but could be further extended in the following aspects. First, this study only analyzes the intrinsic relationship between GSCM and SDP from the perspective of green innovation and green subsidy. In practice, there are other contingency factors that affect the relationship. Future research could build on our findings and focus on other contingency factors moderating or mediating the relation between GSCM and SDP, such as external factors, namely, green certification [44], green user participation [45,46] and internal factors, namely, green image [26], and green training [47]. Future studies should provide more theoretical and empirical explanations about this relationship.
Second, GSCM is a relatively complex concept. This study uses the CITI index to evaluate the GSCM; however, future research could further expand data sources and measure GSCM from multiple angles. Third, this study uses a sample of China’s listed enterprises for research and focuses on GSCM, due to its prevalence and importance in China. As discussed earlier, GSCM may be influenced by external environmental factors, such as legal settings, government policy, and technological environment. Due to these factors, the impact of GSCM may differ across countries. Future research should examine and compare the relationship between GSCM and SDP in other developing or developed countries for more universal findings.
Author Contributions
Conceptualization, J.L.; Methodology, J.L.; Data Collection, D.Y.; Software, J.L.; Validation, J.L.; Formal Analysis, J.L.; Investigation, J.L. and D.Y.; Writing—Original Draft Preparation, J.L.; Writing—Review and Editing, J.L.; Supervision, J.L.; Funding Acquisition, J.L. All authors have read and agreed to the published version of the manuscript.
Funding
This research was partially funded by the National Social Science Foundation of China (grant number 17BGL026).
Data Availability Statement
Please contact the corresponding author. The data are not publicly available due to conditional requests from the source.
Conflicts of Interest
The authors declare no conflict of interest.
Appendix A
Table A1.
Variable definition.
Table A1.
Variable definition.
| Variables | Name | Definition | Data Source |
|---|---|---|---|
| Dependent Variables: Sustainable Development Performance (SDP) | |||
| Financial performance | Fina | Return on equity (ROE) of each enterprise at the end of each fiscal year (%) | WIND database |
| Environmental performance | Envi | Environmental and social responsibility rating score of each enterprise every year | Corporate social responsibility report of HEXUN network |
| Explanatory variables | |||
| Green supply chain management | GSCM | The CITI system encompasses five dimensions for evaluation, namely engagement and responsiveness, compliance and corrective action, extended green supply chain behavior, data disclosure and transparency, and responsible recycling | IPEA/NRDC report |
| Green innovation | GI | The number of green patents applications of each enterprise at the end of each fiscal year | The State Intellectual Property Office and IncoPat Global Patent database |
| Green subsidy intensity | GS | The ratio of the government green subsidy to total assets at the end of each fiscal year (%) × 100 | CSMAR database |
| Control variables | |||
| Firm size | lncapi | Annual total assets of each enterprise | WIND database |
| Number of employees | lnlabor | Natural logarithm of permanent, full-time individuals working in this enterprise at the end of each fiscal year | |
| Enterprise maturity | lnage | Years since the company was established | |
| Financial leverage | lnlev | The ratio of debt to total assets at the end of each fiscal year (%) | |
| ISO | ISO | Has the company passed ISO14001? 1 = Yes, 0 = No | |
| Board governance | Dire | The ratio of the number of independent directors to the total number of the board at the end of each fiscal year (%) | CSMAR database |
Table A2.
Descriptive statistics for the variables.
Table A2.
Descriptive statistics for the variables.
| Variable | Obs | Mean | Std.Dev. | VIF | Max | Min |
|---|---|---|---|---|---|---|
| GSCM | 815 | 2.59 | 1.42 | 5 | 0 | |
| GI | 815 | 4.81 | 1.35 | 2.56 | 0 | 593 |
| Fina | 815 | 0.08 | 0.16 | 1.32 | −0.18 | 0.29 |
| Envi | 815 | 38.21 | 127.74 | 5.63 | 0 | 78.34 |
| GS | 815 | 0.014 | 0.049 | 1.02 | 0 | 0.362 |
| lncapi | 815 | 16.58 | 1.12 | 2.09 | 7.35 | 22.56 |
| lnage | 815 | 2.32 | 0.46 | 1.55 | 3.83 | 1.39 |
| lnlabor | 815 | 8.52 | 0.27 | 1.43 | 4.61 | 10.82 |
| lev | 815 | 0.47 | 0.93 | 2.16 | 0 | 1.42 |
| ISO | 815 | 0.75 | 0.45 | 1.51 | 0 | 1 |
| Dire | 815 | 0.38 | 0.08 | 1.05 | 0.34 | 0.48 |
Table A3.
Correlation coefficient of variables.
Table A3.
Correlation coefficient of variables.
| Var. | 1 | 2 | 3 | 4 | 5 | 6 | 7 | 8 | 9 | 10 | 11 |
|---|---|---|---|---|---|---|---|---|---|---|---|
| GSCM | 1 | ||||||||||
| GI | 0.37 **** | 1 | |||||||||
| Fina | 0.34 *** | −0.21 ** | 1 | ||||||||
| Envi | 0.46 *** | 0.16 *** | 0.06 | 1 | |||||||
| GS | 0.28 *** | 0.15 ** | −0.04 | 0.03 | 1 | ||||||
| lncapi | 0.26 *** | 0.32 *** | 0.27 *** | 0.13 *** | 0.16 *** | 1 | |||||
| lnage | 0.05 * | 0.12 *** | 0.05 | 0.35 *** | 0.24 *** | 0.23 *** | 1 | ||||
| lnlabor | −0.07 *** | −0.02 | −0.01 | 0.22 *** | 0.26 *** | −0.20 *** | −0.21 *** | 1 | |||
| lnlev | −0.06 | 0.11 ** | 0.04 | −0.17 ** | 0.13 *** | 0.26 *** | 0.24 *** | 0.32 *** | 1 | ||
| ISO | 0.34 *** | 0.17 *** | −0.05 | 0.12 ** | 0.23 *** | 0.37 *** | 0.06 * | −0.18 *** | −0.12 ** | 1 | |
| Dire | 0.16 ** | 0.08 * | 0.07* | 0.19 ** | 0.09 * | 0.03 | −0.03 | 0.07 * | −0.03 | 0.07 * | 1 |
Note: *** p < 0.01, ** p < 0.05, * p < 0.1.
References
- Zhu, Q.; Sarkis, J.; Kai, K. Confirmation of a measurement model for green chain management practices implementation. Int. J. Prod. Econ. 2008, 111, 261–273. [Google Scholar] [CrossRef]
- Diabat, A.; Govindan, K. An analysis of the drivers affecting the implementation of green supply chain management. Resour. Conserv. Recycl. 2011, 55, 659–667. [Google Scholar] [CrossRef]
- Longoni, A.; Cagliano, R. Inclusive environmental disclosure practices and firm performance: The role of green supply chain management. Int. J. Oper. Prod. Manag. 2018, 38, 1815–1835. [Google Scholar] [CrossRef] [Green Version]
- Li, G.; Lim, M.K.; Wang, Z. Stakeholders, green manufacturing, and practice performance: Empirical evidence from Chinese fashion businesses. Ann. Oper. Res. 2020, 290, 961–982. [Google Scholar] [CrossRef]
- Rao, P.; Holt, D. Do green supply chains lead to competitiveness and economic performance? Int. J. Oper. Prod. Manag. 2005, 25, 898–916. [Google Scholar] [CrossRef]
- Zhu, Q.; Sarkis, J.; Cordeiro, J.J.; Lai, K.H. Firm-level correlates of emergent green supply chain management practices in the Chinese context. Omega 2008, 36, 577–591. [Google Scholar] [CrossRef]
- Sanket, K.; Akshay, K.; Vishal, K. Traditional & Green Supply Chain Management—A review. Int. Adv. Res. J. Sci. Eng. Technol. 2017, 4, 38–41. [Google Scholar]
- Ilias, A.; Kostas, K.; Dimitris, T. Environmental and financial performance. Is there a win-win or a win-loss situation? Evidence from the Greek manufacturing. J. Clean. Prod. 2018, 197, 1275–1283. [Google Scholar]
- Eiadat, Y.; Kelly, A.; Roche, F.; Eyadat, H. Green and competitive? An empirical test of the mediating role of environmental innovation strategy. J. World Bus. 2008, 43, 131–145. [Google Scholar] [CrossRef]
- Bhatia, M.S.; Gangwani, K.K. Green supply chain management: Scientometric review and analysis of empirical research. J. Clean. Prod. 2021, 284, 124722. [Google Scholar] [CrossRef]
- Shi, V.G.; Koh, S.L.; Baldwin, J.; Cucchiella, F. Nature resource based green supply chain management. Supply Chain. Manag. Int. J. 2012, 17, 54–67. [Google Scholar]
- Arimura, T.H.; Darnall, N.; Katayama, H. Is ISO 14001 a gateway to more advanced voluntary action? The case of green supply chain management. J. Environ. Econ. Manag. 2011, 61, 170–182. [Google Scholar] [CrossRef]
- McAuley, J.W. Global sustainability and key needs in future automotive design. Environ. Sci. Technol. 2003, 37, 5414–5416. [Google Scholar] [CrossRef] [PubMed]
- Govindan, K.; Kannan, D.; Shankar, K.M. Evaluating the drivers of corporate social responsibility in the mining industry with multi-criteria approach: A multi-stakeholder perspective. J. Clean. Prod. 2014, 84, 214–232. [Google Scholar] [CrossRef]
- Vachon, S.; Klassen, R.D. Environmental management and manufacturing performance: The role of collaboration in the supply chain. Int. J. Prod. Econ. 2008, 111, 299–315. [Google Scholar] [CrossRef]
- Zhu, Q.; Sarkis, J. Relationships between operational practices and performance among early adopters of green supply chain management practices in Chinese manufacturing enterprises. J. Oper. Manag. 2004, 22, 265–289. [Google Scholar] [CrossRef]
- Zsidisin, G.A.; Hendrick, T.E. Purchasing’s involvement in environmental issues: A multi-country perspective. Ind. Manag. Data Syst. 1998, 9, 313–320. [Google Scholar] [CrossRef]
- Vachon, S. Green supply chain practices and the selection of environmental technologies. Int. J. Prod. Res. 2007, 45, 4357–4379. [Google Scholar] [CrossRef]
- Gunasekaran, A.; Spalanzani, A. Sustainability of manufacturing and service: Investigations for research and applications. Int. J. Prod. Econ. 2012, 140, 35–47. [Google Scholar] [CrossRef]
- Christmann, P.; Taylor, G. Globalization and the environment: Determinants of firm self-regulation in China. J. Int. Bus. Stud. 2001, 32, 439–458. [Google Scholar] [CrossRef]
- Huang, J.W.; Li, Y.H. Green innovation and performance: The view of organizational capability and social reciprocity. J. Bus. Ethics 2017, 145, 309–324. [Google Scholar] [CrossRef]
- Canh, N.T.; Liem, N.T.; Thu, P.A.; Khuong, N.V. The impact of innovation on the firm performance and corporate social responsibility of Vietnameses Manufacturing firms. Sustainability 2019, 11, 3666. [Google Scholar] [CrossRef] [Green Version]
- Weng, H.H.R.; Chen, J.S.; Chen, P.C. Effects of green innovation on environmental and corporate performance: A stakeholder perspective. Sustainability 2015, 7, 4997–5026. [Google Scholar] [CrossRef] [Green Version]
- El-Kassar, A.; Singh, S.K. Green innovation and organizational performance: The influence of big data and the moderating role of management commitment and HR practices. Technol. Forecast. Soc. Chang. 2019, 144, 483–498. [Google Scholar] [CrossRef]
- Li, D.; Wang, X.; Su, S.; Su, Y. How green technological innovation ability influences enterprise competitiveness. Technol. Surv. 2019, 59, 101136. [Google Scholar] [CrossRef]
- Xie, X.; Huo, J.; Zou, H. Green process innovation, green product innovation, and corporate financial performance: A content analysis method. J. Bus. Res. 2019, 101, 697–706. [Google Scholar] [CrossRef]
- Yu, W.; Ramanathan, R.; Nath, P. Environmental pressure and performance: An analysis of the roles of environmental innovation strategy and marketing capability. Technol. Forecast. Soc. Chang. 2017, 117, 160–169. [Google Scholar] [CrossRef]
- Fenando, Y.; Jabbour, C.J.C.; Wah, W.X. Pursuing green growth in technology firms through the connections between environmental innovation and sustainable business performance: Does service capability matter? Resour. Conserv. Recycl. 2019, 141, 656–680. [Google Scholar]
- Wei, Z.; Shen, H.; Zhou, K.Z.; Li, J.J. How does environmental corporate social responsibility matter in a dysfunctional institutional environment? Evidence from China. J. Bus. Ethics 2017, 140, 209–223. [Google Scholar] [CrossRef]
- Kleer, R. Government R&D subsidies as a signal for private investors. Res. Policy 2010, 39, 1361–1374. [Google Scholar]
- Hu, D.; Qiu, L.; She, M.; Wang, Y. Sustaining the sustainable development: How do firms turn government green subsidies into financial performance through green innovation? Bus. Strategy Environ. 2021, 30, 2271–2292. [Google Scholar] [CrossRef]
- CITI Index 2015. Annual Evaluation Report; Institute of Public & Environment Affairs (IPE) and Natural Resources Defense Council (NRDC): Beijing, China, 2015; pp. 56–60. Available online: https://wwwoa.ipe.org.cn//Upload/201512040248078803.pdf (accessed on 28 August 2021).
- Dong, Z.; Tan, Y.; Wang, L.; Zheng, J.; Hu, S. Green supply chain management and clean technology innovation: An empirical analysis of multinational enterprises in Chain. J. Clean. Prod. 2021, 310, 127377. [Google Scholar] [CrossRef]
- Popp, D.; Newell, R. Where does energy R&D come from? Examing crowding out from energy R&D. Energy Econ. 2012, 34, 980–991. [Google Scholar]
- Sorensen, J.B.; Stuart, T.E. Aging, obsolescence and organizational innovation. Adm. Sci. Q. 2000, 45, 81–112. [Google Scholar] [CrossRef] [Green Version]
- Suphi, S. Corporate governance, environmental regulations and technological change. European. Econ. Rev. 2015, 80, 36–61. [Google Scholar]
- Zhang, Y.; Wang, J.; Xue, Y.; Yang, J. Impact of environmental regulations on green technological innovative behavior: An empirical study in China. J. Clean. Prod. 2018, 188, 763–773. [Google Scholar] [CrossRef]
- Baron, R.M.; Kenny, D.A. The moderator-mediator variable distinction in social psychological research: Conceptual strategic, and statistical considerations. J. Personal. Soc. Psychol. 1986, 51, 1173. [Google Scholar] [CrossRef]
- Preacher, K.J.; Zyphur, M.J. A general multilevel SEM framework for assessing multilevel mediation. Psychol. Methods 2010, 15, 209–233. [Google Scholar] [CrossRef] [Green Version]
- Zang, J.; Li, Y. Technology capabilities, marketing capabilities and innovation ambidexterity. Technol. Anal. Strateg. Manag. 2017, 29, 23–37. [Google Scholar] [CrossRef]
- Allison, P.D.; Waterman, R.P. Fixed-effects negative binominal regression models. Sociological. Methodol. 2002, 32, 247–265. [Google Scholar] [CrossRef] [Green Version]
- Gong, R.F.; Xue, J.; Zhao, L.J.; Zolotova, O.; Ji, X.Q.; Xu, Y. A bibliometric analysis of green supply chain management based on the Web of Science (WOS) platform. Sustainability 2019, 11, 3459. [Google Scholar] [CrossRef] [Green Version]
- Li, G.; Li, L.; Choi, T.; Sethi, S. Green supply chain management in Chinese firms: Innovative measures and the moderating role of quick response technology. J. Oper. Manag. 2020, 66, 958–988. [Google Scholar] [CrossRef]
- Li, D.; Huang, M.; Ren, S.; Chen, X.; Ning, L. Environmental legitimacy, green innovation, and corporate carbon disclosure: Evidence from CDP China 100. J. Bus. Ethics 2018, 150, 1089–1104. [Google Scholar] [CrossRef]
- Sopjani, L.; Stier, J.J.; Ritzén, S.; Hesselgren, M.; Georén, P. Involving users and user roles in the transition to sustainable mobility systems: The case of light electric vehicle sharing in Sweden. Transp. Part D Transp. Environ. 2019, 71, 207–221. [Google Scholar] [CrossRef]
- Li, G.; Li, N.; Sethi, S. Does CSR Reduce Idiosyncratic Risk? Roles of Operational Efficiency and AI Innovation. Prod. Oper. Manag. 2021, 30, 2027–2045. [Google Scholar] [CrossRef]
- Pinzone, M.; Guerci, M.; Lellieri, E.; Huisingh, D. Effects of ‘Green’ training on Pro-environmental behaviors and job satisfaction: Evidence from the Italian Healthcare sector. J. Clean. Prod. 2019, 226, 221–232. [Google Scholar] [CrossRef]
Publisher’s Note: MDPI stays neutral with regard to jurisdictional claims in published maps and institutional affiliations. |
© 2021 by the authors. Licensee MDPI, Basel, Switzerland. This article is an open access article distributed under the terms and conditions of the Creative Commons Attribution (CC BY) license (https://creativecommons.org/licenses/by/4.0/).