Abstract
Coronavirus disease 2019 (COVID-19) is an infectious disease characterised by symptoms that are like the common cold. The current pandemic situation in anticipation of a vaccine has posed serious threats to the health and economic sectors of countries worldwide. To overcome the quick transmission of the virus, the government of Australia has also taken drastic measures to prevent its spread. These policies include an international and interstate travel ban, social distancing rules, lockdown, shutdown of educational institutes and work-from-home policies. Such rules have affected people on both behavioural and psychological levels. This study aims to analyse the effect of COVID-19 on Australian citizens, and therefore, the changed behaviour of citizens concerning their mobility patterns, transport preferences and shopping methods under the pandemic have been studied. A detailed literature search was adopted for gathering data related to the study theme, along with real-time evidence of changes in the behaviour of people following the pandemic. The socioeconomic impact of the pandemic on social inequality and thereby the effect on the vulnerable people of the population are also studied. Authentic surveys and statistical data are consulted to figure out how the new lifestyle choices of people will linger in the post-pandemic era. It was found that people in Australia have adopted the work-from-home regime, and new habits suiting the nationwide restrictions have become routine for many people.
Keywords:
COVID 19; Australia; work from home; public transport; travel; economics; unemployment; shopping pattern 1. Introduction
Coronavirus disease 2019 (COVID-19) has taken the world by storm, affecting the entire global population, either directly or indirectly. As of 8 August 2021, the global deaths due to COVID-19 had reached 4.3 M, with 203 M confirmed cases of infection [1]. COVID-19 has impacted almost all aspects of daily life, ranging from daily hygiene practices to border public dealings and gatherings, including physical distancing and the public display of face masks [2]. The impacts of COVID-19 have been devastating for many developed and developing economies, and global trade has been put to a halt. This has resulted in significant revenue and business losses to almost all types of businesses. Around 214 countries and territories of the world have registered 36,625,199 confirmed COVID-19 cases, with a total death toll of 1,063,780. Table 1 shows the top 10 countries affected severely by the COVID-19 pandemic. As an emergency response to the COVID-19 pandemic, most of the countries introduced mitigation and protection strategies (as advised by the WHO), which included quarantine of the infected and highly affected patients, encouragement of self-quarantine practices, social distancing, shutdown of non-essential services, more sanitisation and improved hygiene and cleaning practices [3,4].

Table 1.
List of countries with the highest number of COVID-19 cases and recorded deaths (source: Worldometers).
As far as Australia is concerned, it ranks 126th based on the total number of COVID-19 cases and deaths globally. Till now, it is one of the most successful developed countries in controlling the COVID-19 outspread [5]. The most important aspects in this regard are its steady political system, state wealth and isolated geographical area [6] some of these qualities are also shared by countries such as the United States and England, which failed to follow the initial COVID-19 prevention protocols such as social distancing. This explains how Australia became more successful in slowing down the spread of COVID-19. Despite the relative success in containing the spread of the disease, there have been significant socioeconomic effects of the outbreak on the country [7]. In Australia, 16% of the population falls under the age group of 65 years and above, which is most vulnerable to COVID-19, while 18.7% is in the age group of 0 to 15 years, which is least vulnerable to the disease [8]. The rate of infection was highest (30.3%) in people who were in the age group of 60+ years. As of 27 May 2020, 90 out of 93 fatalities in Australia were in this age group and the remaining mortalities were in the age group of 40+ years [9]. In the age group of 0 to 15 years, no fatalities have been reported, which is an important factor to be considered when it comes to the argument of reopening schools and day-care centres. The public showed obvious cooperation in observing the early social distancing and economic measures taken by the government. However, there exist some issues about the recovery of the country to its pre-pandemic state. The pandemic has brought changes in several economic sectors, along with differences in the tax system, policies regarding trade relations and jobseeker payments. The social impact of these changes has been studied in this paper, along with the issues that may be faced by the government for the recovery to the pre-pandemic state.
In March 2020, the government created an extra-constitutional National Cabinet to ensure nationwide cooperation for the containment of COVID-19 [10]. One of the many debatable concerns in the wake of the pandemic is the opening of schools and childcare institutes. In addition, for issues concerning trade and coronavirus test rules, there exist differences between the Commonwealth, territories and states [11]. The nationwide reaction to the pandemic is also influenced by the demographic profile of Australia, which is mostly multicultural. As of 2016, Australia had a population of 23.5 million people [12,13]. Out of this number, 2.8% were native and 28.5% were born abroad, out of which 5% were born in England, 2.5% in New Zealand, 2.2% in China and 1.9% in India [14]. A re-examination of these demographics needs to be done to study the responses to the economic and social policies during the pandemic in the long run.
The issue at present is the uncertainty regarding the post-pandemic lifestyle in Australia. Since the pandemic started, several offices shifted to a work-from-home culture and businesses started operating through online sales. However, once the pandemic is over and life starts to go back to normal, how will this culture then shift to the previous state? There is no previous data regarding the shift in lifestyles post-pandemic, since the last pandemic before COVID-19 was in the early 20th century and business operations were extremely different as to what they are now. The biggest gap in the literature lies in the fact that there is no guiding principle for taking the community back to how it was operating pre-pandemic. It is quite easy to predict that life will go back to normal once everyone is vaccinated. However, questions remain: What will be the norm? After having worked from home for almost a year, are most Australians willing to go back to working from offices? Is the community adapted to the current situation, and are businesses prepared for a change in their operational flow after adjusting to different modes of sales over the last year? Although these questions are to be answered in the future, the impact of changes can be huge, and it is important to identify whether Australians are ready for more changes that will be on the way as we emerge from the pandemic.
Generally, the travel preference of the people is constrained by socio-economic demographics, age, lifestyle, income, driving habits and environmental outcomes. These variables affect the purpose of travel and the areas (urban, rural) where people are living. The driving habits will predict the trips for leisure and shopping. For Australians, a consistent relationship has been observed between travel planning and preference with independent variables of income and lifestyle. Age and gender are not found to be consistently related to travel preferences. The COVID-19 pandemic has significantly impacted the lifestyle choices of the people. Therefore, the current study aimed to assess how the novel COVID-19 pandemic has affected the behaviour and activity patterns of people in Australia. It analysed the changed behaviour of citizens concerning their mobility patterns, transport preferences and shopping methods. A detailed literature search was adopted for gathering data along with real-time evidence of changes in the behaviour of people following the pandemic. The socio-economic impact of the pandemic for social inequality and thereby its effect on the vulnerable people of the population were also investigated.
The following sections will include a detailed overview of how the coronavirus pandemic has changed the lives of people in Australia. A carefully structured methodology has been used for extracting relevant literature and data related to change in the pattern of office work, the work-from-home culture, shopping patterns and the use of transportation. All these data points will provide a means to analyse the shift that has occurred in the lives of Australian citizens. Understanding this shift will further provide a window for understanding what the post-pandemic future might look like for Australia. The paper is organised as follows: Section 2 presents the methodology followed to collect data for the study. Section 3 presents the impact on transportation. Section 4 discusses the economic and social impacts. Section 5 summarises the flexible working arrangements. Section 6 examines the shopping patterns of people. Section 7 gives a brief discussion of the studied behavioural pattern, and Section 8 summarises the outcomes and limitations of the study.
2. Materials and Methods
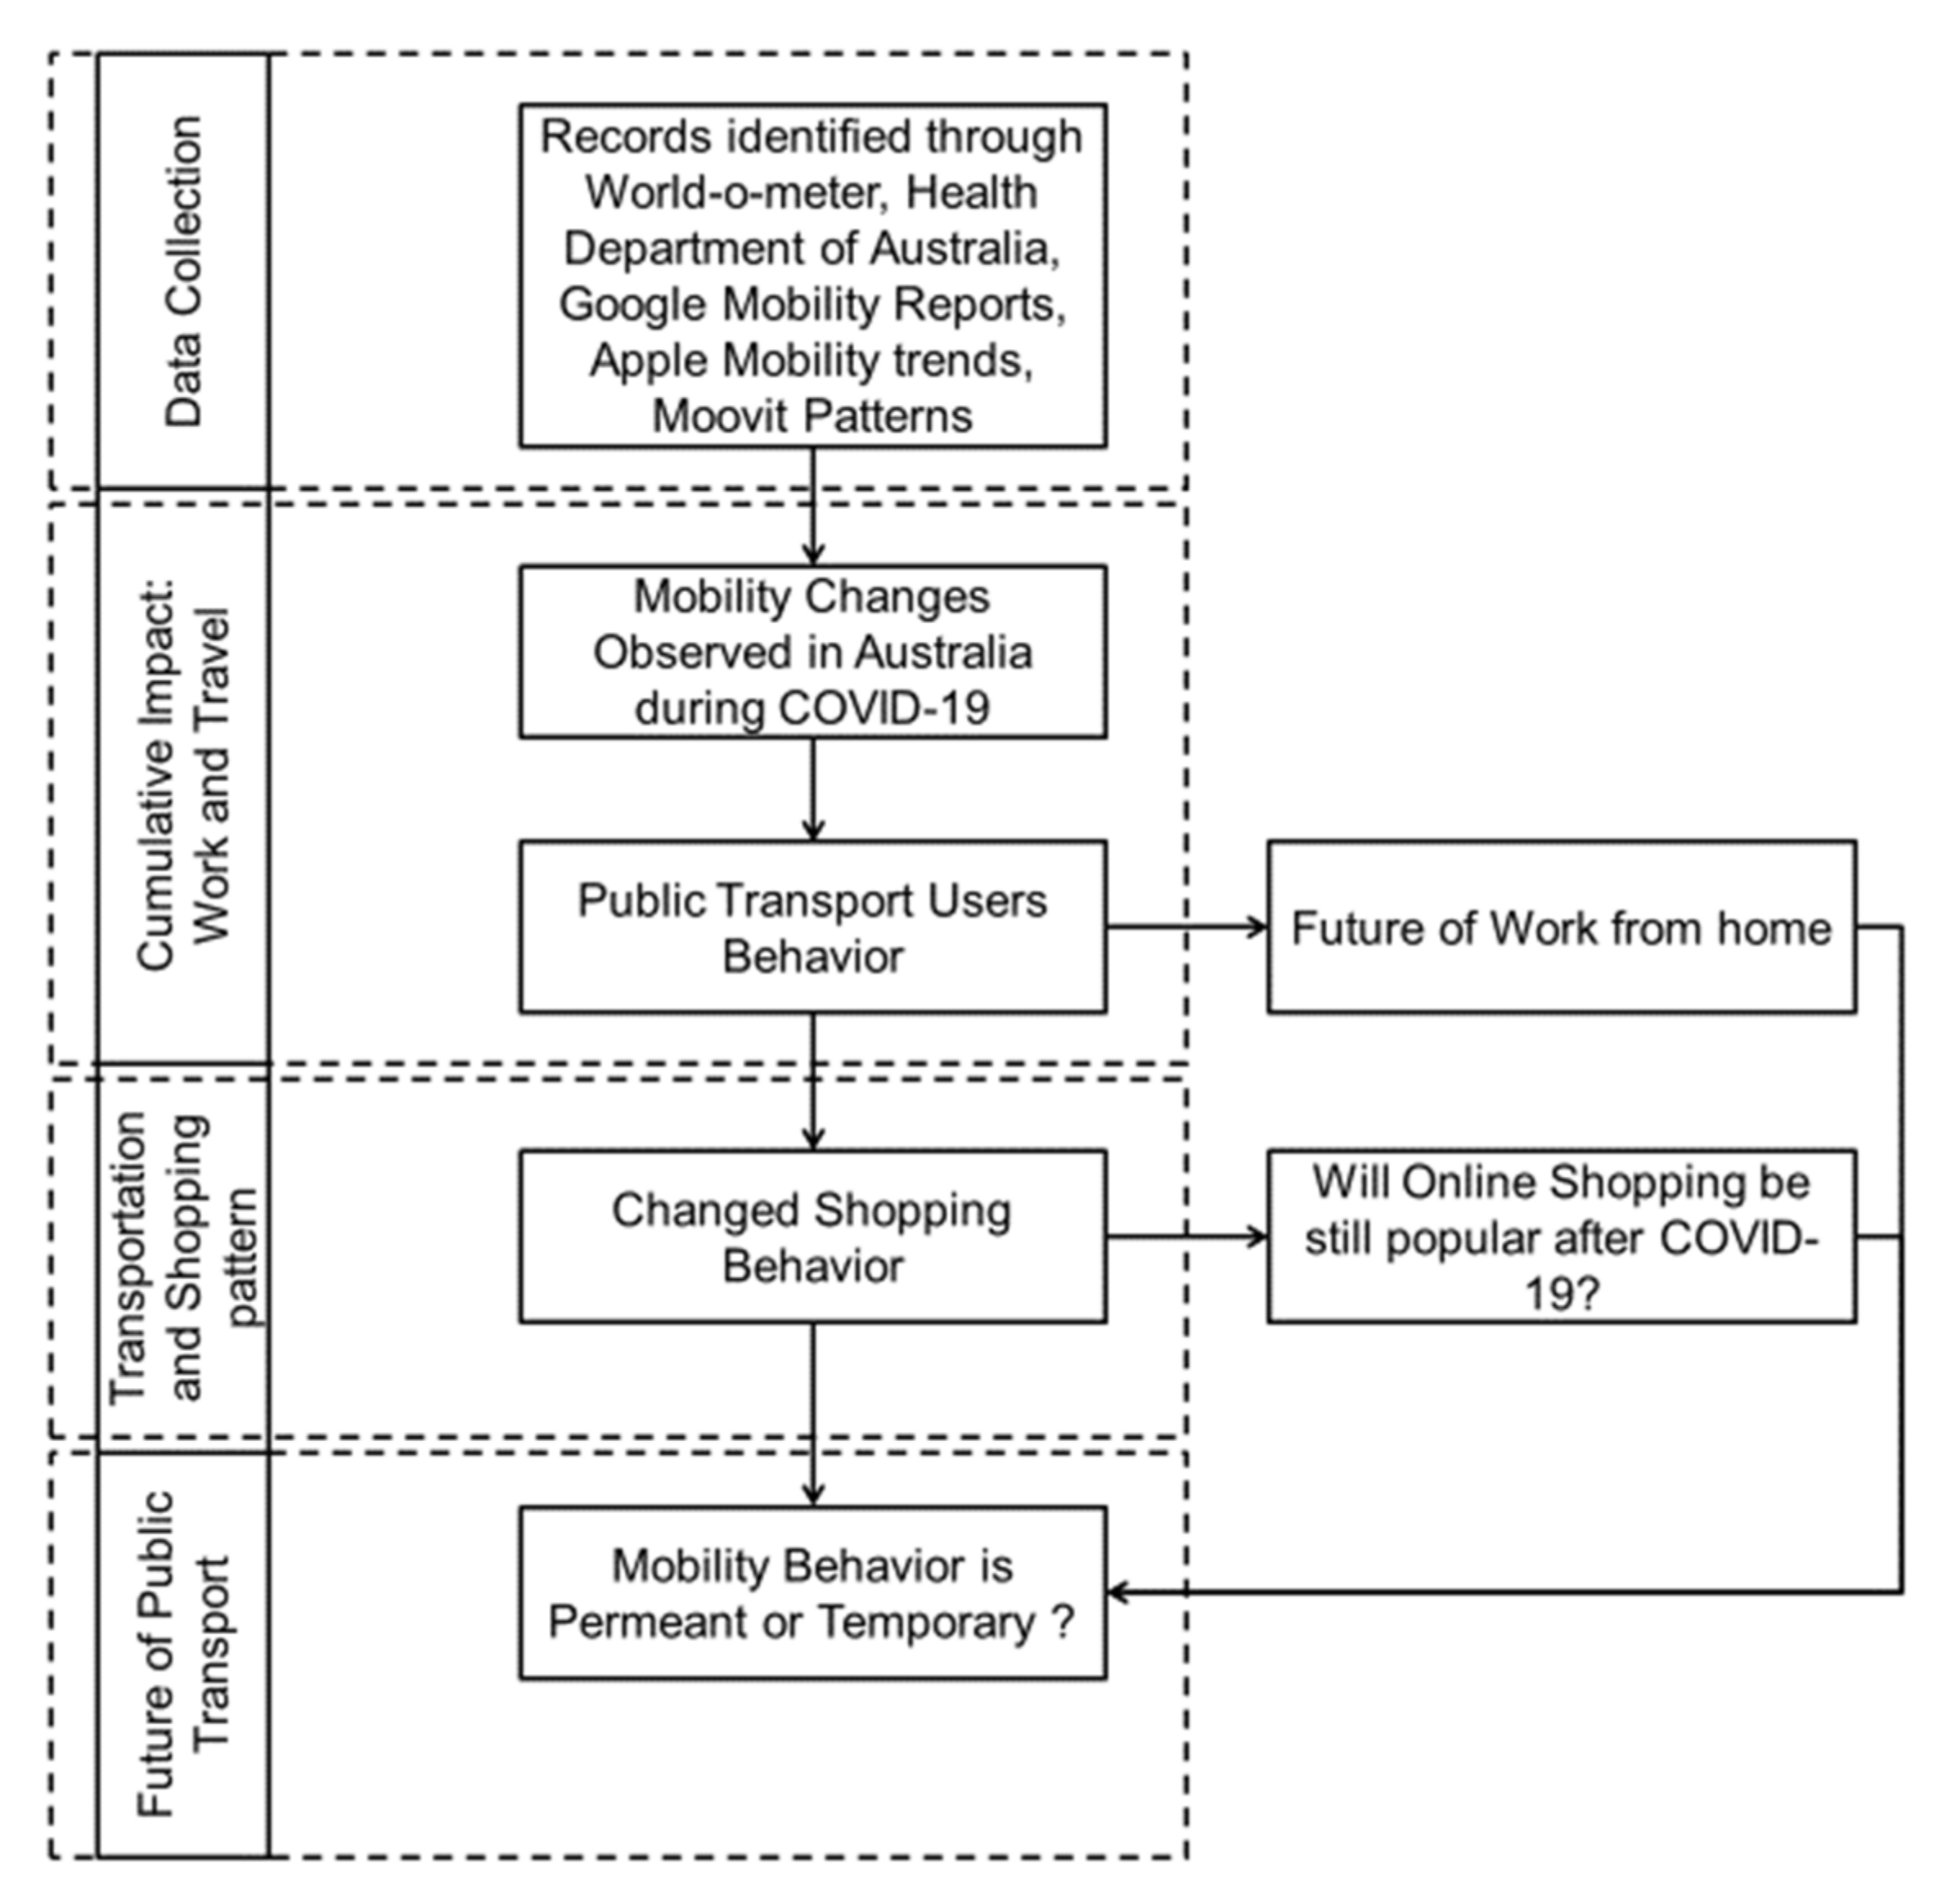
Figure 1 shows the workflow adopted for the study. A thorough literature review was performed to elucidate the background of COVID-19, the overall impact and its complete timeline in Australia. The precautionary measures from the World Health Organization and the Centers for Disease Control for the pandemic were reviewed. The current COVID-19 status data were acquired from the Department of Health, States and Territories Reports, Australia. The transportation data for Australia were acquired from the data providers that generate data analytics from Apple mobility reports, Google mobility trends, COVID-19 community mobility reports (insights into COVID-19 policies, guidelines and movements across different places) and Moovit mobility patterns (information about how, when and where people move around the city). The visualisation of raw data was performed using the table and graph options in Microsoft Excel.
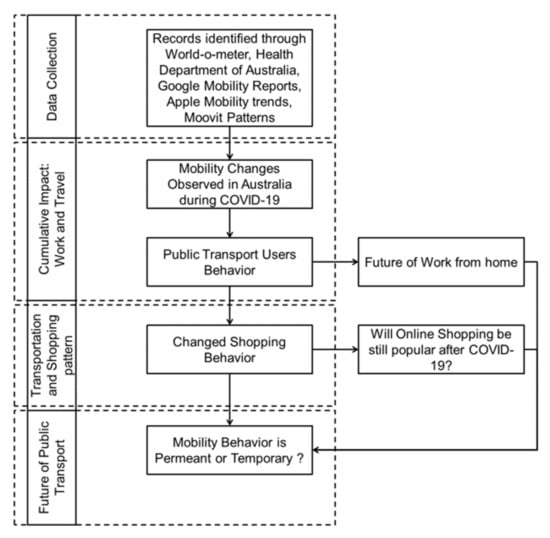
Figure 1.
Workflow designed to study the impacts of COVID-19 on public transportation in Australia.
The acquired data were analysed and interpreted to identify the trends in public transportation usage. The findings were discussed in connection to the mobility patterns and the behavioural changes observed in the citizens. The future possibility of working from home and online shopping in the long term was also discussed. Finally, the expected long-term impact of COVID-19 on public transportation regarding the passengers’ behaviour was reflected.
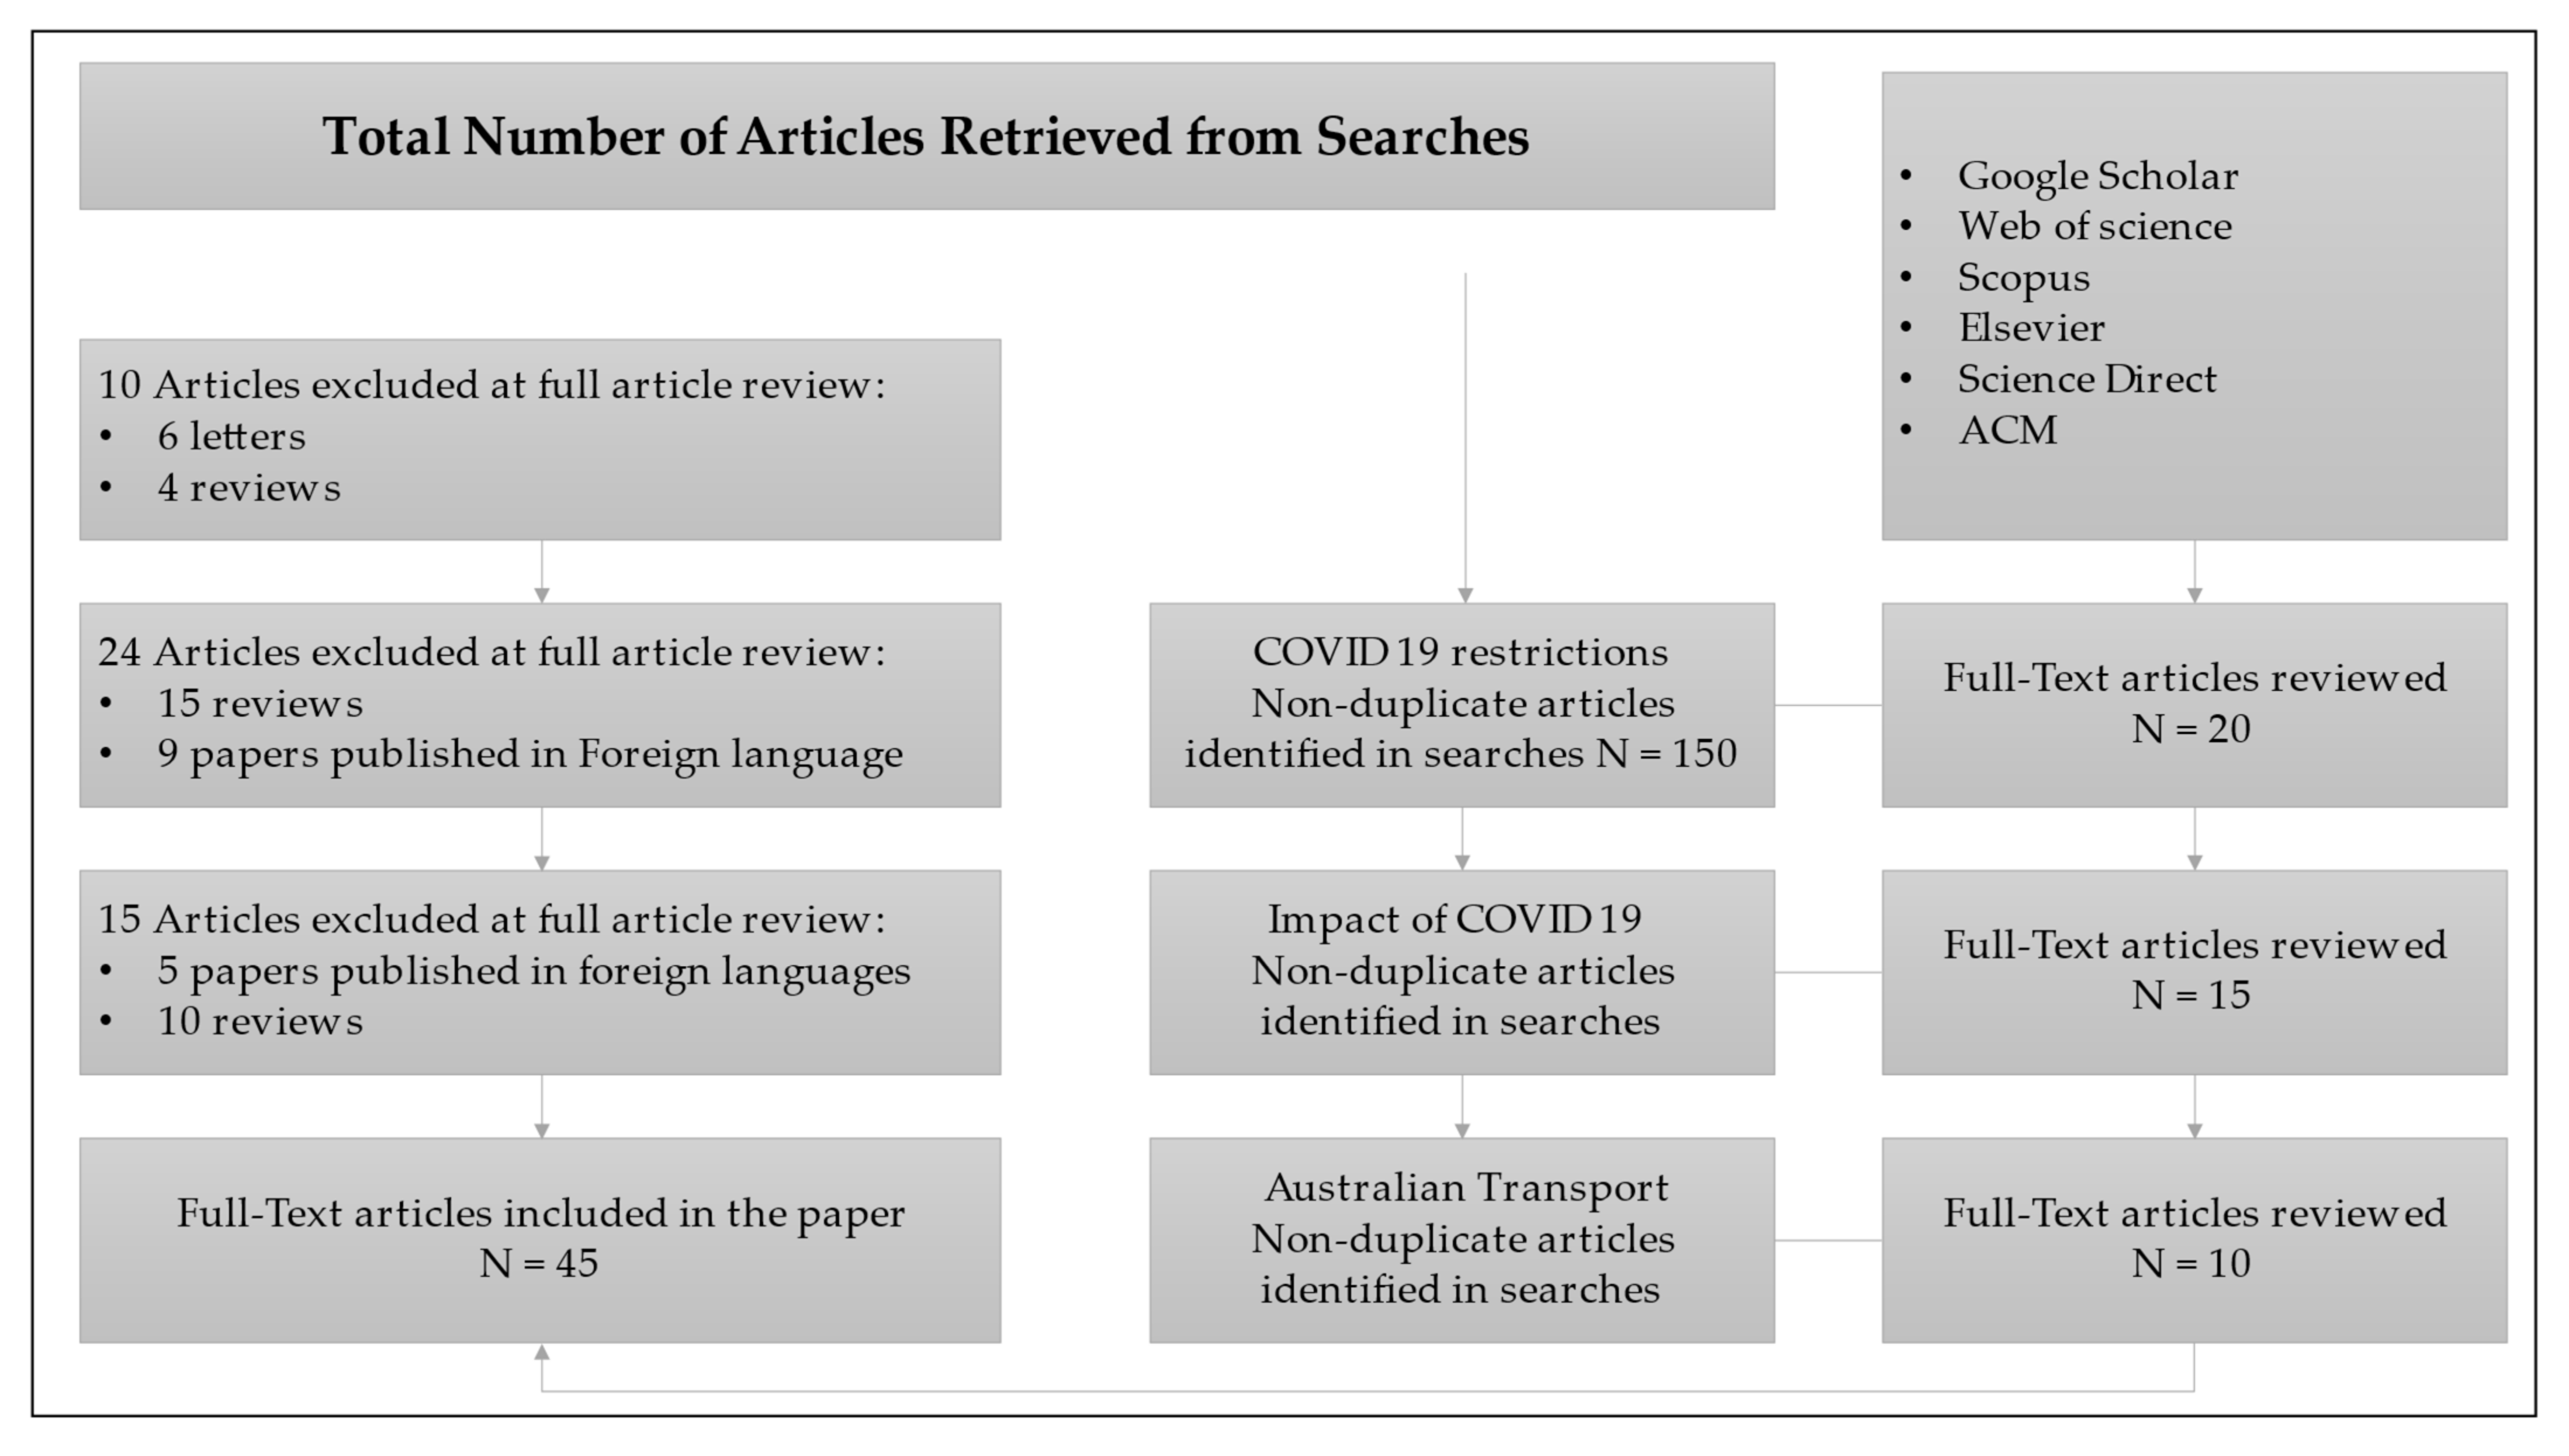
A detailed literature search was carried out to collate the most appropriate data for this study. Vos Viewer software is a tool for constructing and visualising bibliometric networks and was used to develop Figure 2, which shows some of the most frequently used keywords in the literature. From the selection of keywords, it is evident that the research rotates around the effects of COVID-19 on the transport system. A list of keywords was generated to refine the overall selection procedure based on the 5 Ws and the H idea generation strategy, i.e., who, what, when, where, why and how COVID-19 is impacting mobility. The keywords were used both separately and in combinations to extend the article-searching process and to retrieve a maximum number of articles from the search engines. Various search engines including, Google Scholar, Scopus, ACM PubMed, MedRxiv, MDPI, Elsevier, ScienceDirect, Web of Science and SSRN, were used for the retrieval of relevant articles. However, to perform exhaustive research, various search phrases were formulated to be used for different websites, for the extraction of a maximum number of relevant articles (Figure 3). Some of the search phrases formulated for the current study included “COVID-19 policies”, “COVID-19 restrictions”, “coronavirus response”, “impact of COVID-19”, “effects of coronavirus”, “coronavirus and public transport in Australia”, “coronavirus effect on air travel in Australia” and “coronavirus impact on freight transport in Australia”. Finally, articles, letters and review papers that were published in foreign languages were excluded from the extracted literature that was intended to be used for the current study [15]. A final list of 45 articles was selected for the current study to carry out the detailed background research and analysis. Statistical analysis was performed on the selected data sets using mean, mode and standard deviation parameters, which were followed by graphing the results to explore the trends for the studied parameters.
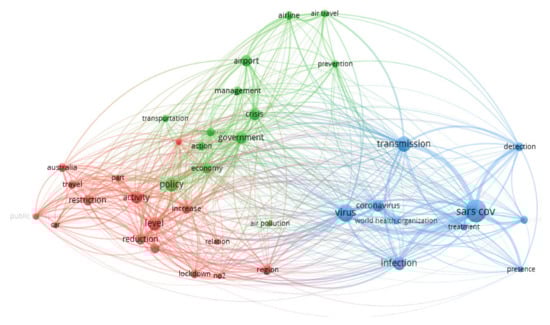
Figure 2.
Most repetitive keywords used in the research articles related to the COVID-19 impact on transport.
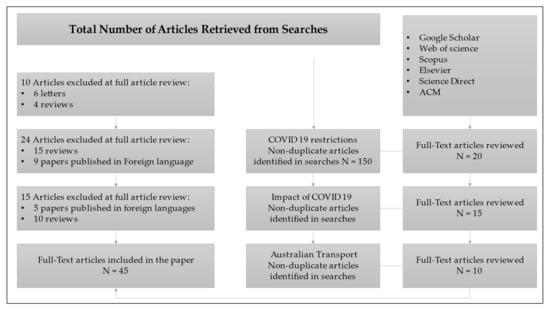
Figure 3.
Article-screening process for the impact of COVID 19 in Australia.
3. Impact on Transportation
Transportation systems are critical to providing access to essential goods and services, especially for those with no private conveyance mode. The transport system is recognised to be a high-risk area for catching the viral disease, owing to several factors, which include the following:
- A greater number of individuals share a common space for a prolonged duration, with limited means of ventilation.
- Users of public transport comprising the elderly and people with movement disabilities are at a higher risk of catching the virus.
- Several exposed surfaces (i.e., the railings, doors, tickets, farebox and straps) that have been touched by many people may lead to the vigorous spread of the virus.
- There is a lack of control or method of pre-screening people before boarding public transport.
3.1. Economic Impact on the Transport Industry
The pandemic’s economic impact on the public transportation and collective mobility sector (e.g., ride pooling, ride hailing and scooter sharing) is most severe. As public transportation is directly related to economic development and heavily dependent on fares of subsidies, revenue losses are inevitable. In the wake of COVID-19, the limited ridership on public transit has resulted in an unprecedented economic loss. Systems officials estimate a loss of a quarter billion dollars in 2020 due to the declining fare revenues and sales tax collection. For instance, King County Metro has projected more than $600 million in revenue losses through 2022. The agency declared that the fall service is expected to cut 15% from the pre-COVID-19 levels [16]. Furthermore, Addis Ababa, Johannesburg and Lagos are some major cities where public transport had to operate at less than 60% of the typical capacity in the lockdown [17]. According to the National Association of Urban Transport, similar restrictions in Brazil have impacted the public transport operators for as high as USD 188 million in daily fare losses [18]. Simultaneously, most of the service providers also have to ensure the protection of staff and passengers. In Rwanda, for instance, the bus stations are overloaded with hand sanitisers, and portable sinks, at a large expense to the government [19,20,21]. These results are in line with the findings of David et al. (2021), who estimated short-time reduction in money and time costs associated with travel patterns. It was observed that the annual travel time costs reduced by $5.58 billion (car and public transport), an approximately 54% reduction in the pre-COVID-19 total time costs.
3.2. Travel Restrictions
With the latest travel restrictions imposed in many countries, the travel industry has also faced massive revenue losses. The airline industry is an eight-trillion-dollar industry supporting more than one billion trips annually [22,23]. However, in the wake of COVID-19, this industry has lost 250 billion dollars owing to the current travel restrictions and global recession. In the current year, the airline industry was confronted with a 44% decrease in revenue as compared to the revenues for the year 2019. The graph illustrated in Figure 4 shows the percentage difference in the global revenues of the travel industry from 2019 to 2020 [24,25,26]. It is shown that Europe was confronted with the highest loss in revenues from the travel industry. Adekunle et al. (2020) developed a stochastic metapopulation model to investigate the spread of COVID-19. It was observed that the COVID-19 outbreak was restricted by reducing the importation by 79% due to travel restrictions.
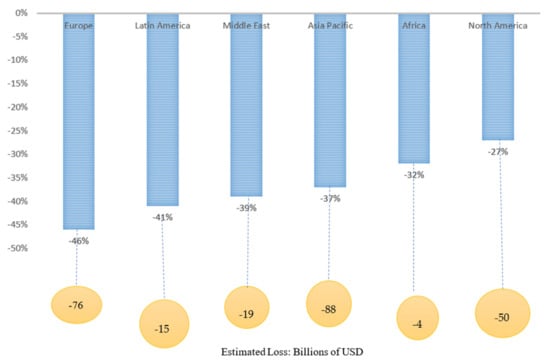
Figure 4.
Global revenue losses due to COVID-19 in the travel industry (International Air Transport Association (IATA).
3.3. Public Transport
The transportation sector has been extensively affected by COVID-19 since the virus’s onset, ranging from reduced transportation capacities due to physical distancing requirements to a general reluctance of using public transport [27]. Since the start of the pandemic, a significant drop in the number of visitors to public transport hubs has been recorded. The Google mobility reports show that since early March, the number of visitors to public transit areas, such as train stations, bus terminals and waiting areas, has dropped by 80% [28]. Less feasible routes are either eliminated or have higher costs that are charged by the customers. According to Google COVID-19 Community Mobility Trends, the number of visitors in transit stations has fluctuated across various countries since the beginning of the pandemic. This number is measured relative to a baseline value, which is calculated by taking a median of several visitors in a duration of five weeks from January to February 2020 [29].
Similarly, with the increase in coronavirus cases in Australia in mid-March 2020, the government restricted non-essential travel and minimised the use of public transport for limiting the spread of COVID-19. This significantly reduced the use of public transport and private cars. Around 80% reduction in the daily usage of transport relative to pre-COVID 19 situations was observed in April 2020 [30]. Australia has successfully tackled the health risk crisis by closing offices, restaurants, schools, cafés and saloons. However, the impact on the transport industry and economy has been large. The movement of people was significantly affected, along with the different modes of transport, such as walking, cycling, public transport and private cars, in major cities of Australia. Being restricted to homes and not being able to meet family and friends affected the mental health of people. Around 47% of the people were found to be depressed and anxious during the pandemic who reduced their daily outdoor activities and preferred working from home. Changes in the mobility pattern and visits to common places such as shopping malls and public parks were observed. As per Google’s COVID-19 Community Mobility Reports [31], the mobility trends for the use of public transport dropped to 46%; visiting recreational places such as restaurants, theme parks, museums, libraries and cinemas reduced by 23%; and only 15% people went to the workplace [31]. The sudden reduction in the mobility pattern confirmed that the people were following government restrictions and were concerned about the coronavirus. All these factors are expected to affect the employment status of about 1.5–2 million people across Australia [32].
3.4. Change in the Mode of Transport
When stage 2 restrictions (restriction on non-essential travel, gathering inside and outside, 1.5 m distancing) were imposed by the Australian government, the usage of cars dropped to almost 67%. However, the usage of private cars was seen to increase throughout the country as people considered it safe to travel in a personal transport vehicle and avoid interaction with the public. Public transport is gradually recovering, and people have started to use trains with the usage of masks. The exception was found in Melbourne as the usage of public transport and private vehicles was still seen to be below the baseline. South Australia was an exception, too, with a negligible impact on public transport due to the pandemic and the usage above the baseline. The people continued with normal transport means as the incidence of COVID-19 cases was found to be low [33]. Walking was considered safe for travelling to work and to perform daily chores; however, a rising trend was observed in Western Australia, South Australia and Queensland. The Northern Territory was found to show a stable walking trend (about 109%), while Victoria was found to be below the baseline [34]. Thus, it is notable that the Australians considered the usage of personal cars and walking as the safest mode of travelling instead of using public transport. Due to the increasing number of coronavirus cases, the mobility patterns were significantly low for Victoria with stage 4 restrictions. In stage 4 restrictions, no indoor and outdoor gathering of more than two people is allowed. People can only leave the house for essential reasons, state borders are closed, non-essential venues are closed, maintaining 1.5 m distance is essential, travellers arriving in Australia self-isolate for 14 days and only one visitor is allowed at home [35]. These are in line with the findings of Mathew and David (2020), who reported that the Australians followed the advice of the National Cabinet on travel restrictions and limited social contact, which flattened the curve. A need to rethink the public transport policy was indicated with increasing concerns of hygiene and social distancing.
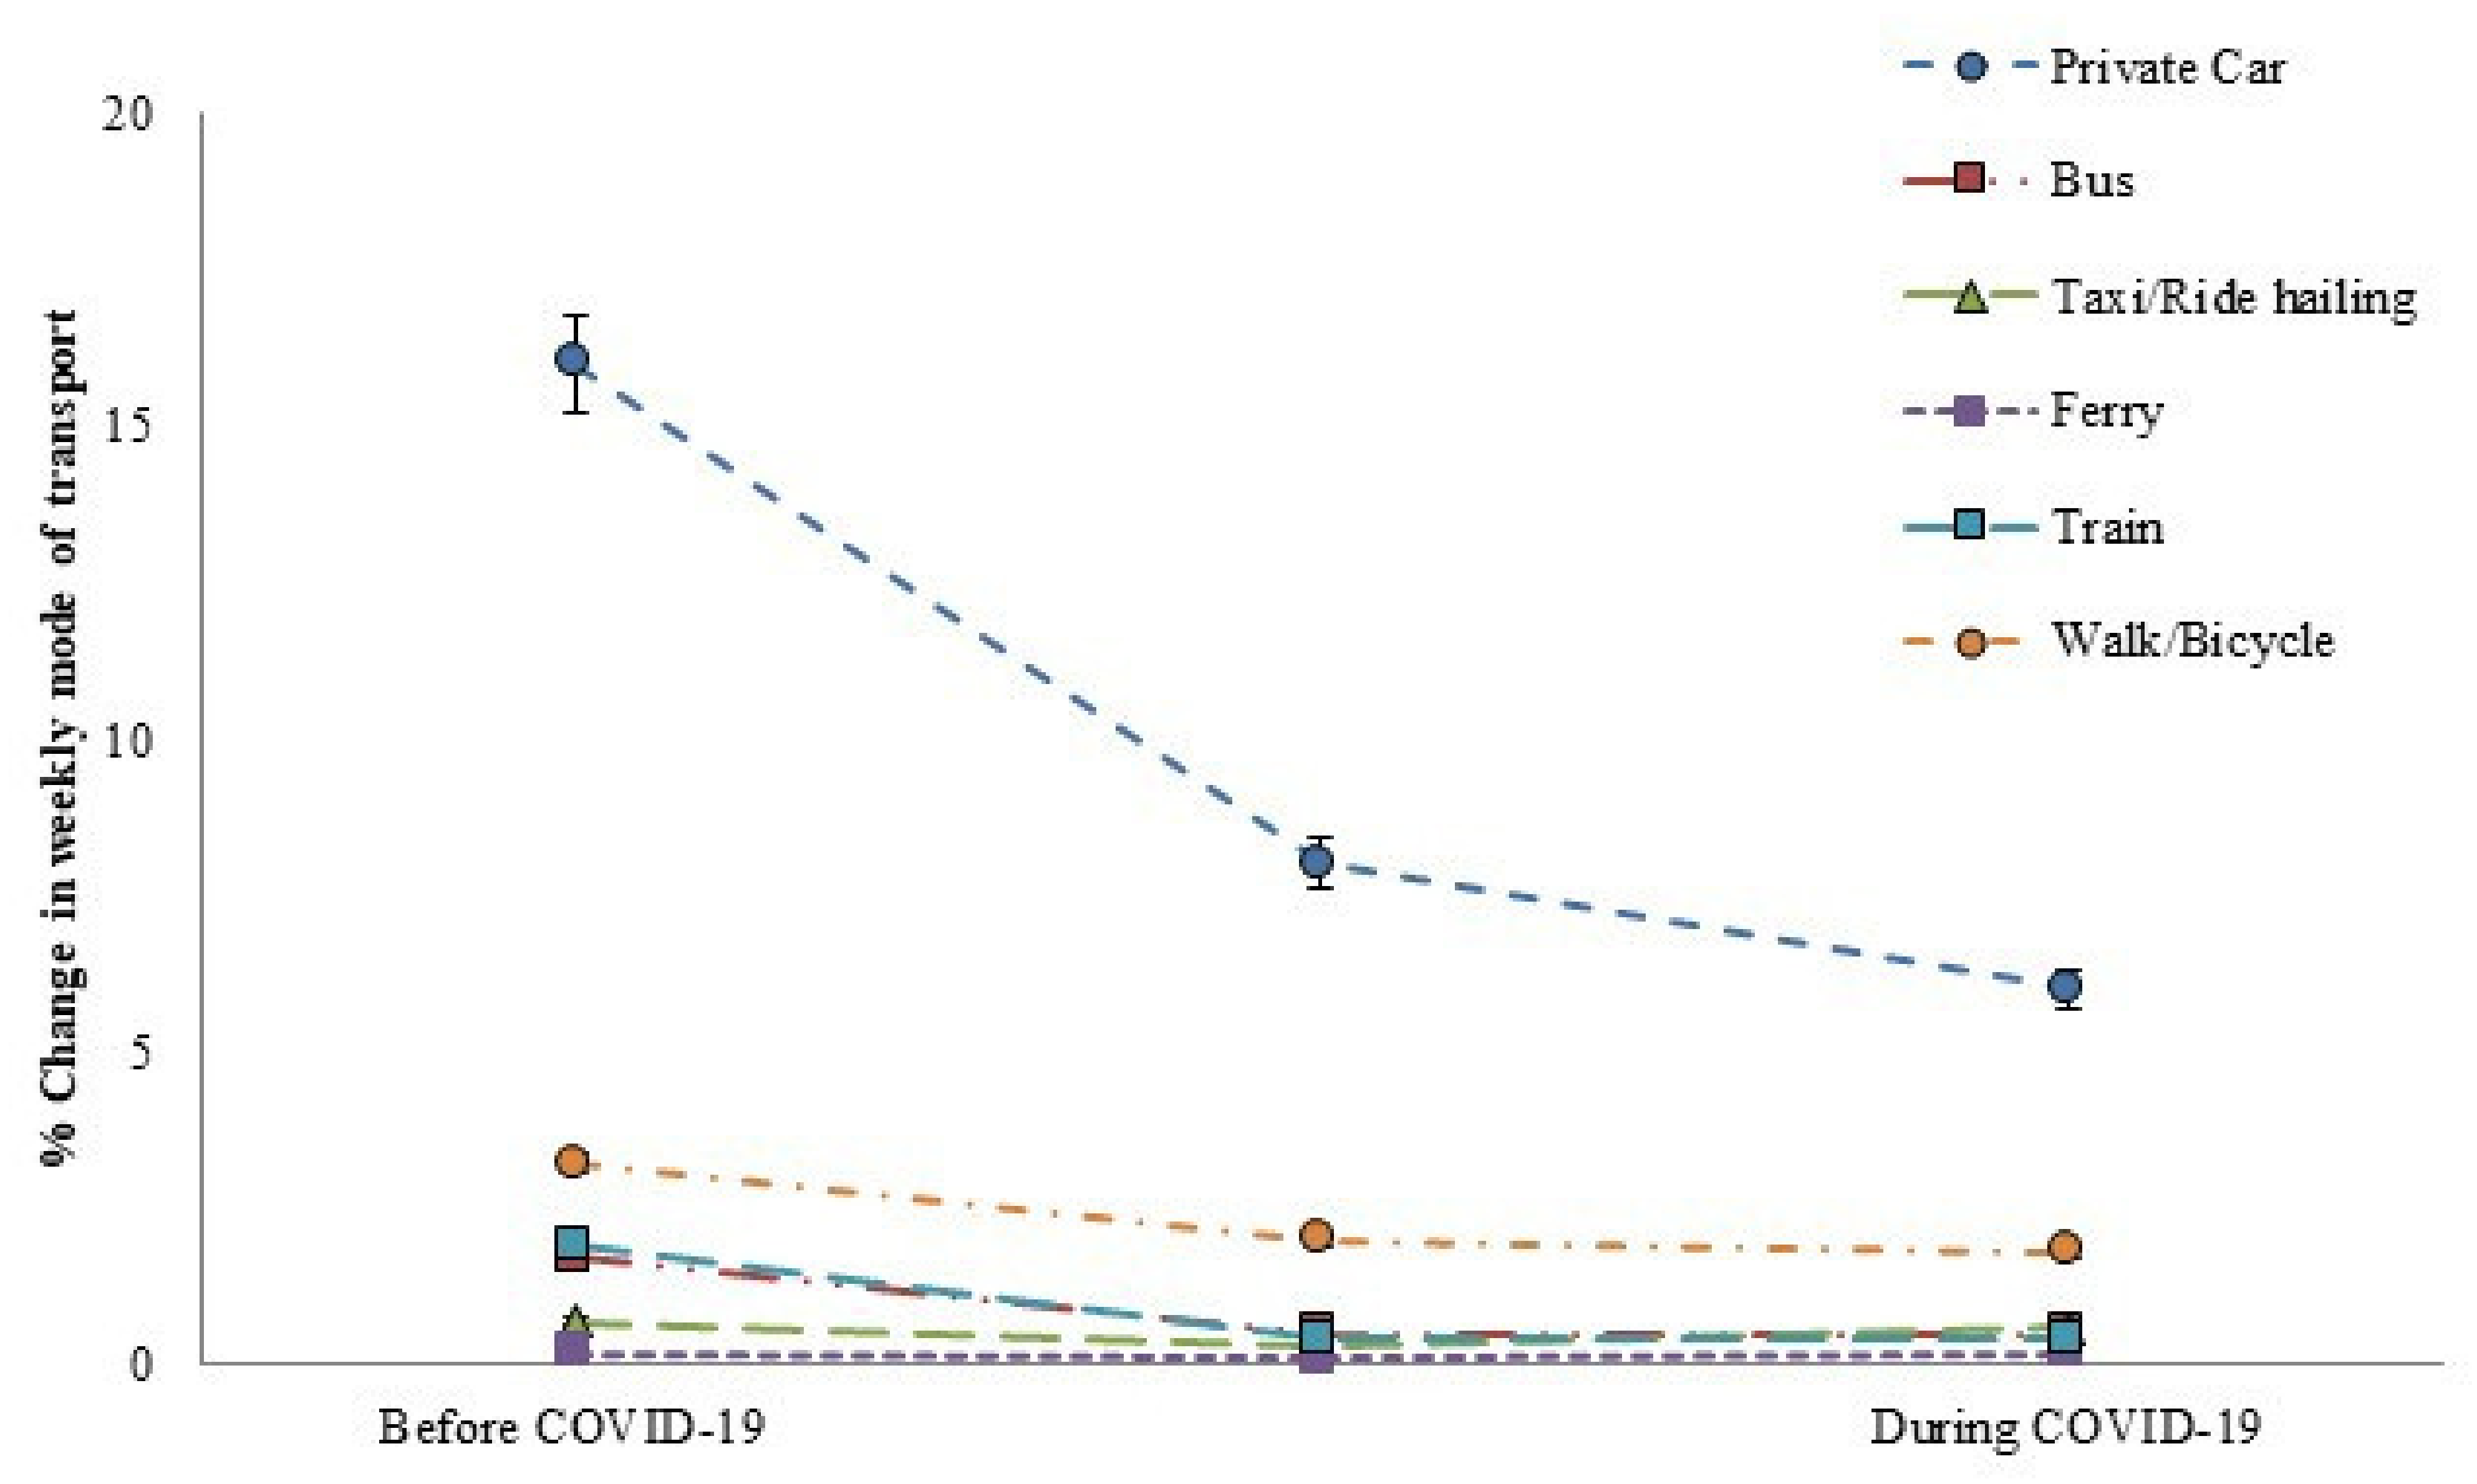
Figure 5 depicts the changing travel behaviours for different modes of transport in Australia (Moovit mobility patterns). The number of trips for private vehicles reduced from 17 to 8% trips per week during COVID-19. Public transport such as bus and train usage was significantly reduced from 16 to 7% of trips per week. Before COVID-19, the proportion of household trips by private cars was stable, with 70% of the people travelling by car, while during COVID-19, the usage of private cars was comparatively higher than the rest. Active transport of household trips increased from 14 to 20% but, however, was lower in absolute terms [36,37].
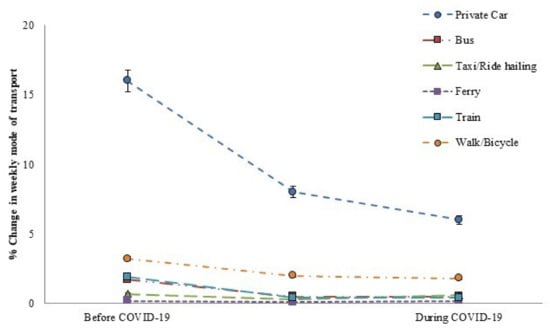
Figure 5.
Weekly household trips through different modes of transport.
Figure 6 depicts the perception of the public about various modes of transport in terms of comfort (i.e., either comfortable or least comfortable) during the COVID-19 crisis (Google mobility reports, Moovit mobility patterns). The figure clearly shows that people feel most comfortable using a private car, while train and bus usage was found to be least comfortable, showing percentages of 33% and 42%, respectively. These perceptions are dependent on social demographics, with different age groups preferring to ride by taxi, ride sharing or cycling as comfortable means of transport. The respondents scored the mode of transportation from least to most comfortable.
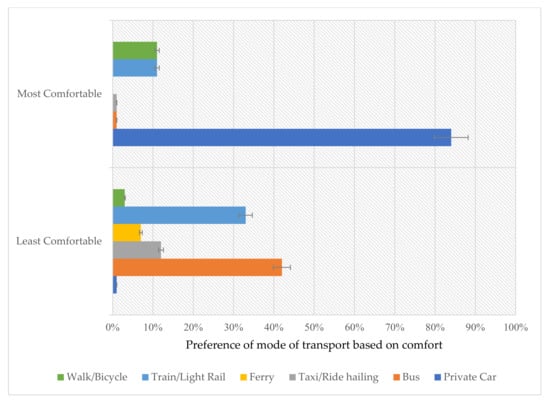
Figure 6.
Preference of people for a different mode of transport during a pandemic.
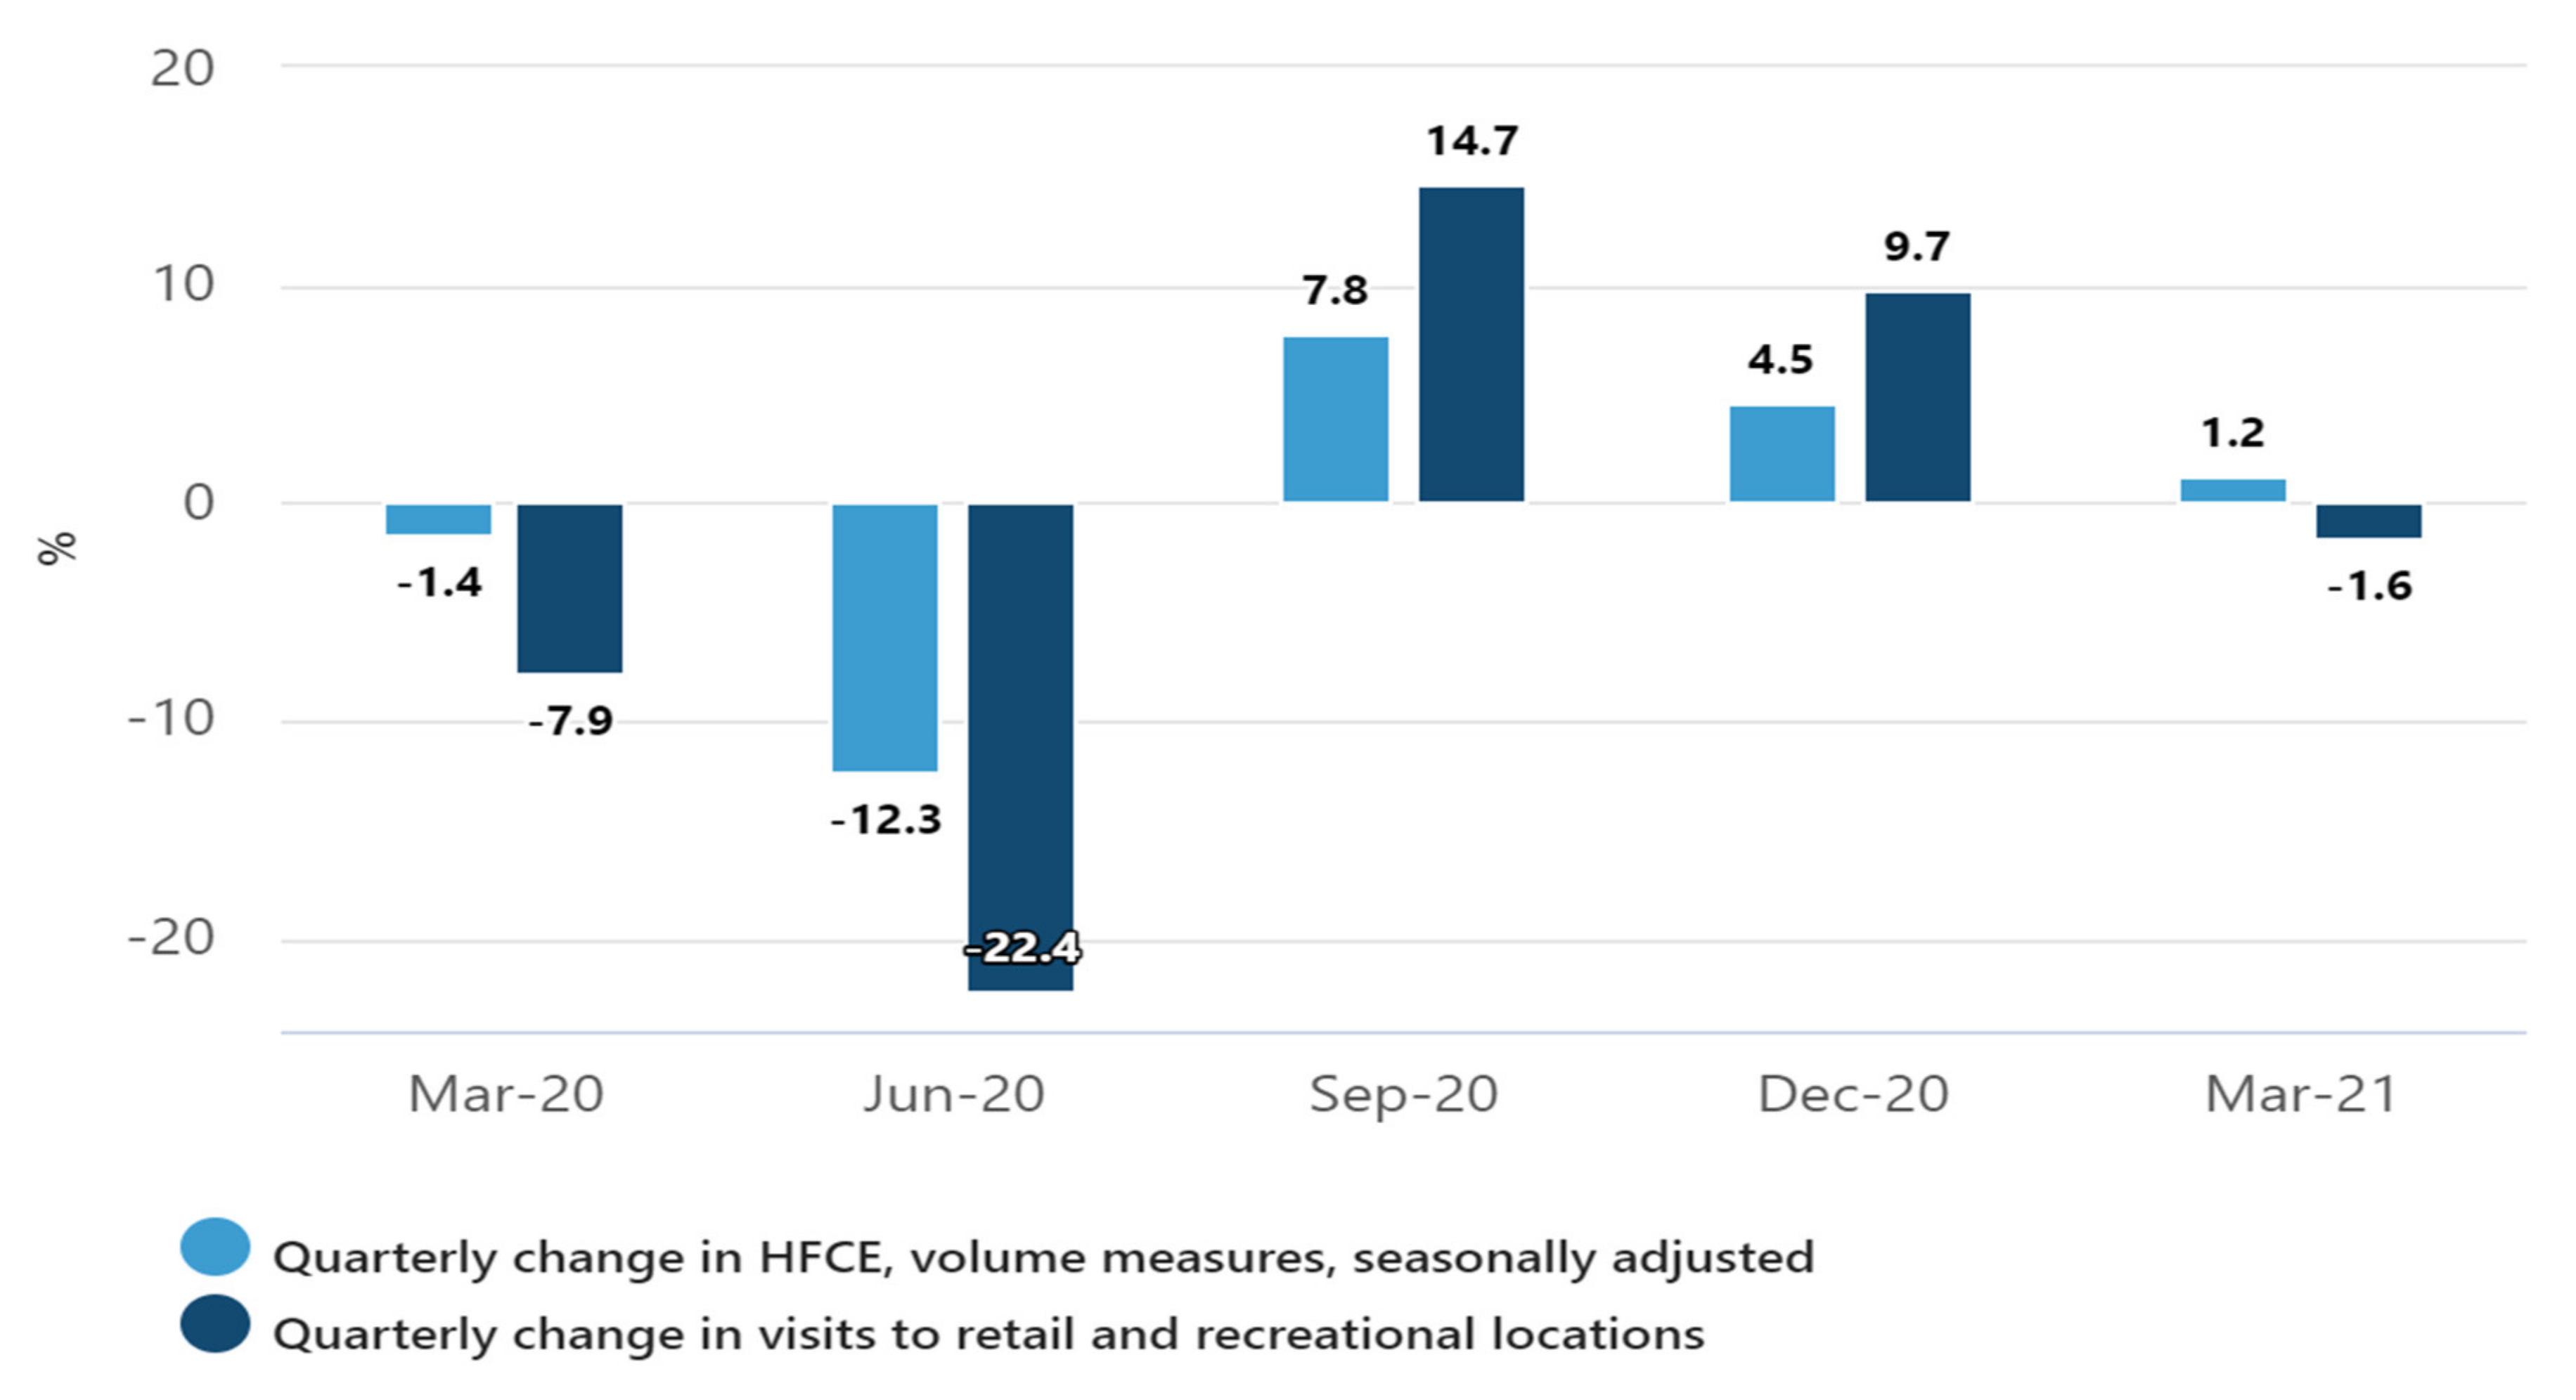
These results were compared with the data from the Australian Bureau of Statistics, which depicts the change in the mobility and household final consumption expenditure (HFCE) after a year of the pandemic (Figure 7).

Figure 7.
Quarterly change in the mobility and household final consumption expenditure (HFCE) for Australia [38].
3.5. Travelling during COVD-19
Before the implementation of border restrictions in March 2020, around 97% of visitors arrived in Australia. In 2020, around 1.8 million visitors arrived, which was around 80% lower than the last year and the lowest since 1987 [38]. The largest number of visitors were from New Zealand (242, 500), followed by China (207,700), and a larger number of visitors being women. Most of the visitors travelled for holidays and spent around 14 to 15 days in Australia. Due to travel restrictions, the visitors from source countries changed, with a decline in the number of visitors from the top five countries due to COVID-19. Before the pandemic, China was the largest source country with the highest number of visitors. The largest number of citizens arriving from different countries has reduced during the pandemic, and a decline has been observed (Table 2). With the restrictions in place, residents returned from overseas, with a total of 16,990 short-term trips recorded. About a 98% decrease in trips was observed in April 2021 as compared to trips observed in April 2019. Most of the residents (60%) returned from New Zealand, being the most popular travel destination.
Table 2.
Top source country citizens’ arrival to Australia during 2020–2021.
Before the restrictions by the Australian government in March 2020, around 92% of residents returned to Australia. Around 2.8 million residents were recorded, which declined by 75% and was the lowest recorded since 1996. Most of the residents’ return was from New Zealand as well. Due to travel restrictions, many international students were not able to arrive in Australia and were struck overseas. The arrival of international students declined by 99.4%, with only 260 students arriving in Australia in 2021.
4. Economic and Social Impact
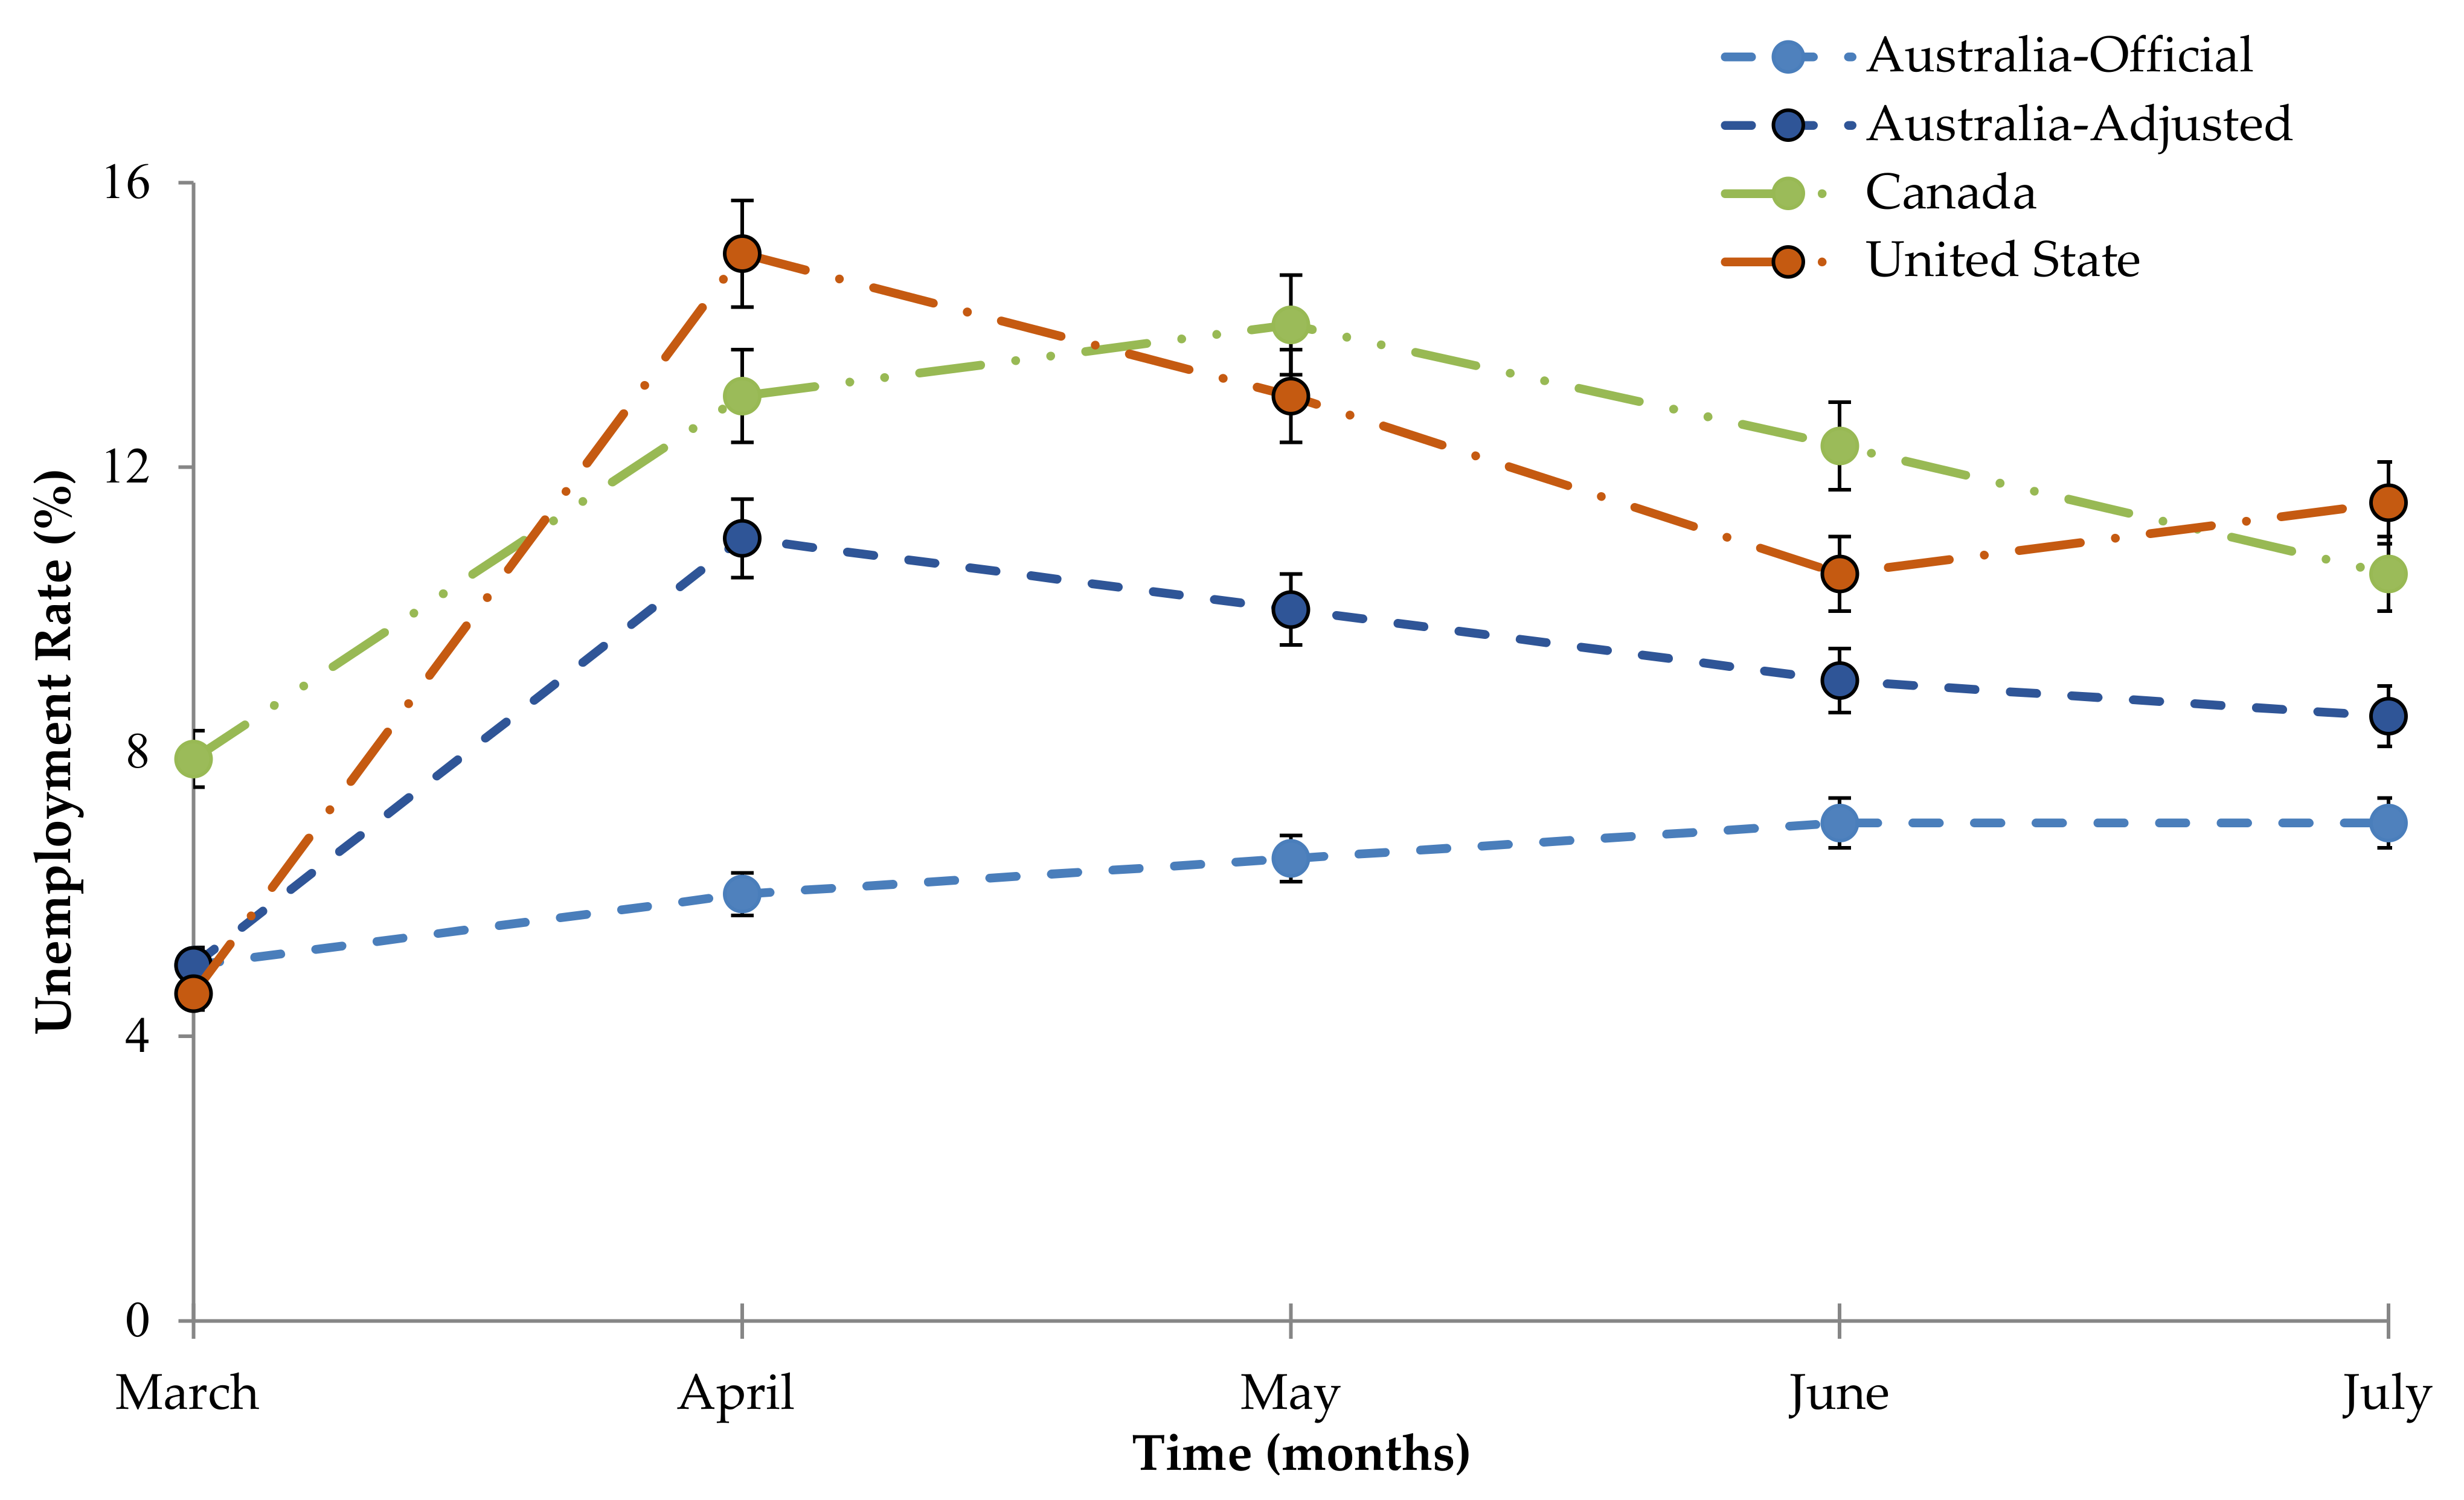
With the unemployment rate soaring up during COVID-19, drastic policy measures were taken up by different countries to reduce the unemployment rates. In the UK, the unemployment rate was 3.9% for April–June 2020, slightly higher than 3.89% in April–June 2019, while in June 2020, around 9.3 million people opted for a job retention scheme and almost 2.7 million people claimed self-employment income support grants. The largest decrease in weekly hours worked was observed, and the number of benefits claimed increased from 1.24 to 2.63 million people. An estimate of the Australian unemployment rate was made and compared with the US and Canadian unemployment rates [38] (Figure 8). It is estimated that a downward trend after the April surge may be difficult to maintain, with the emergency relief fund given to the people. The adjusted unemployment rate is calculated on a monthly basis and is a statistical method of removing the seasonal component of a time series that is used when analysing non-seasonal trends.
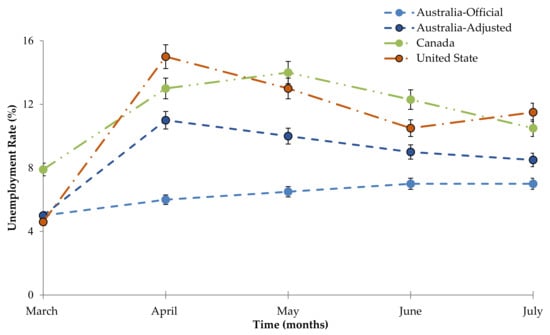
Figure 8.
Comparison of the unemployment rate of Australia with that of Canada and the United States.
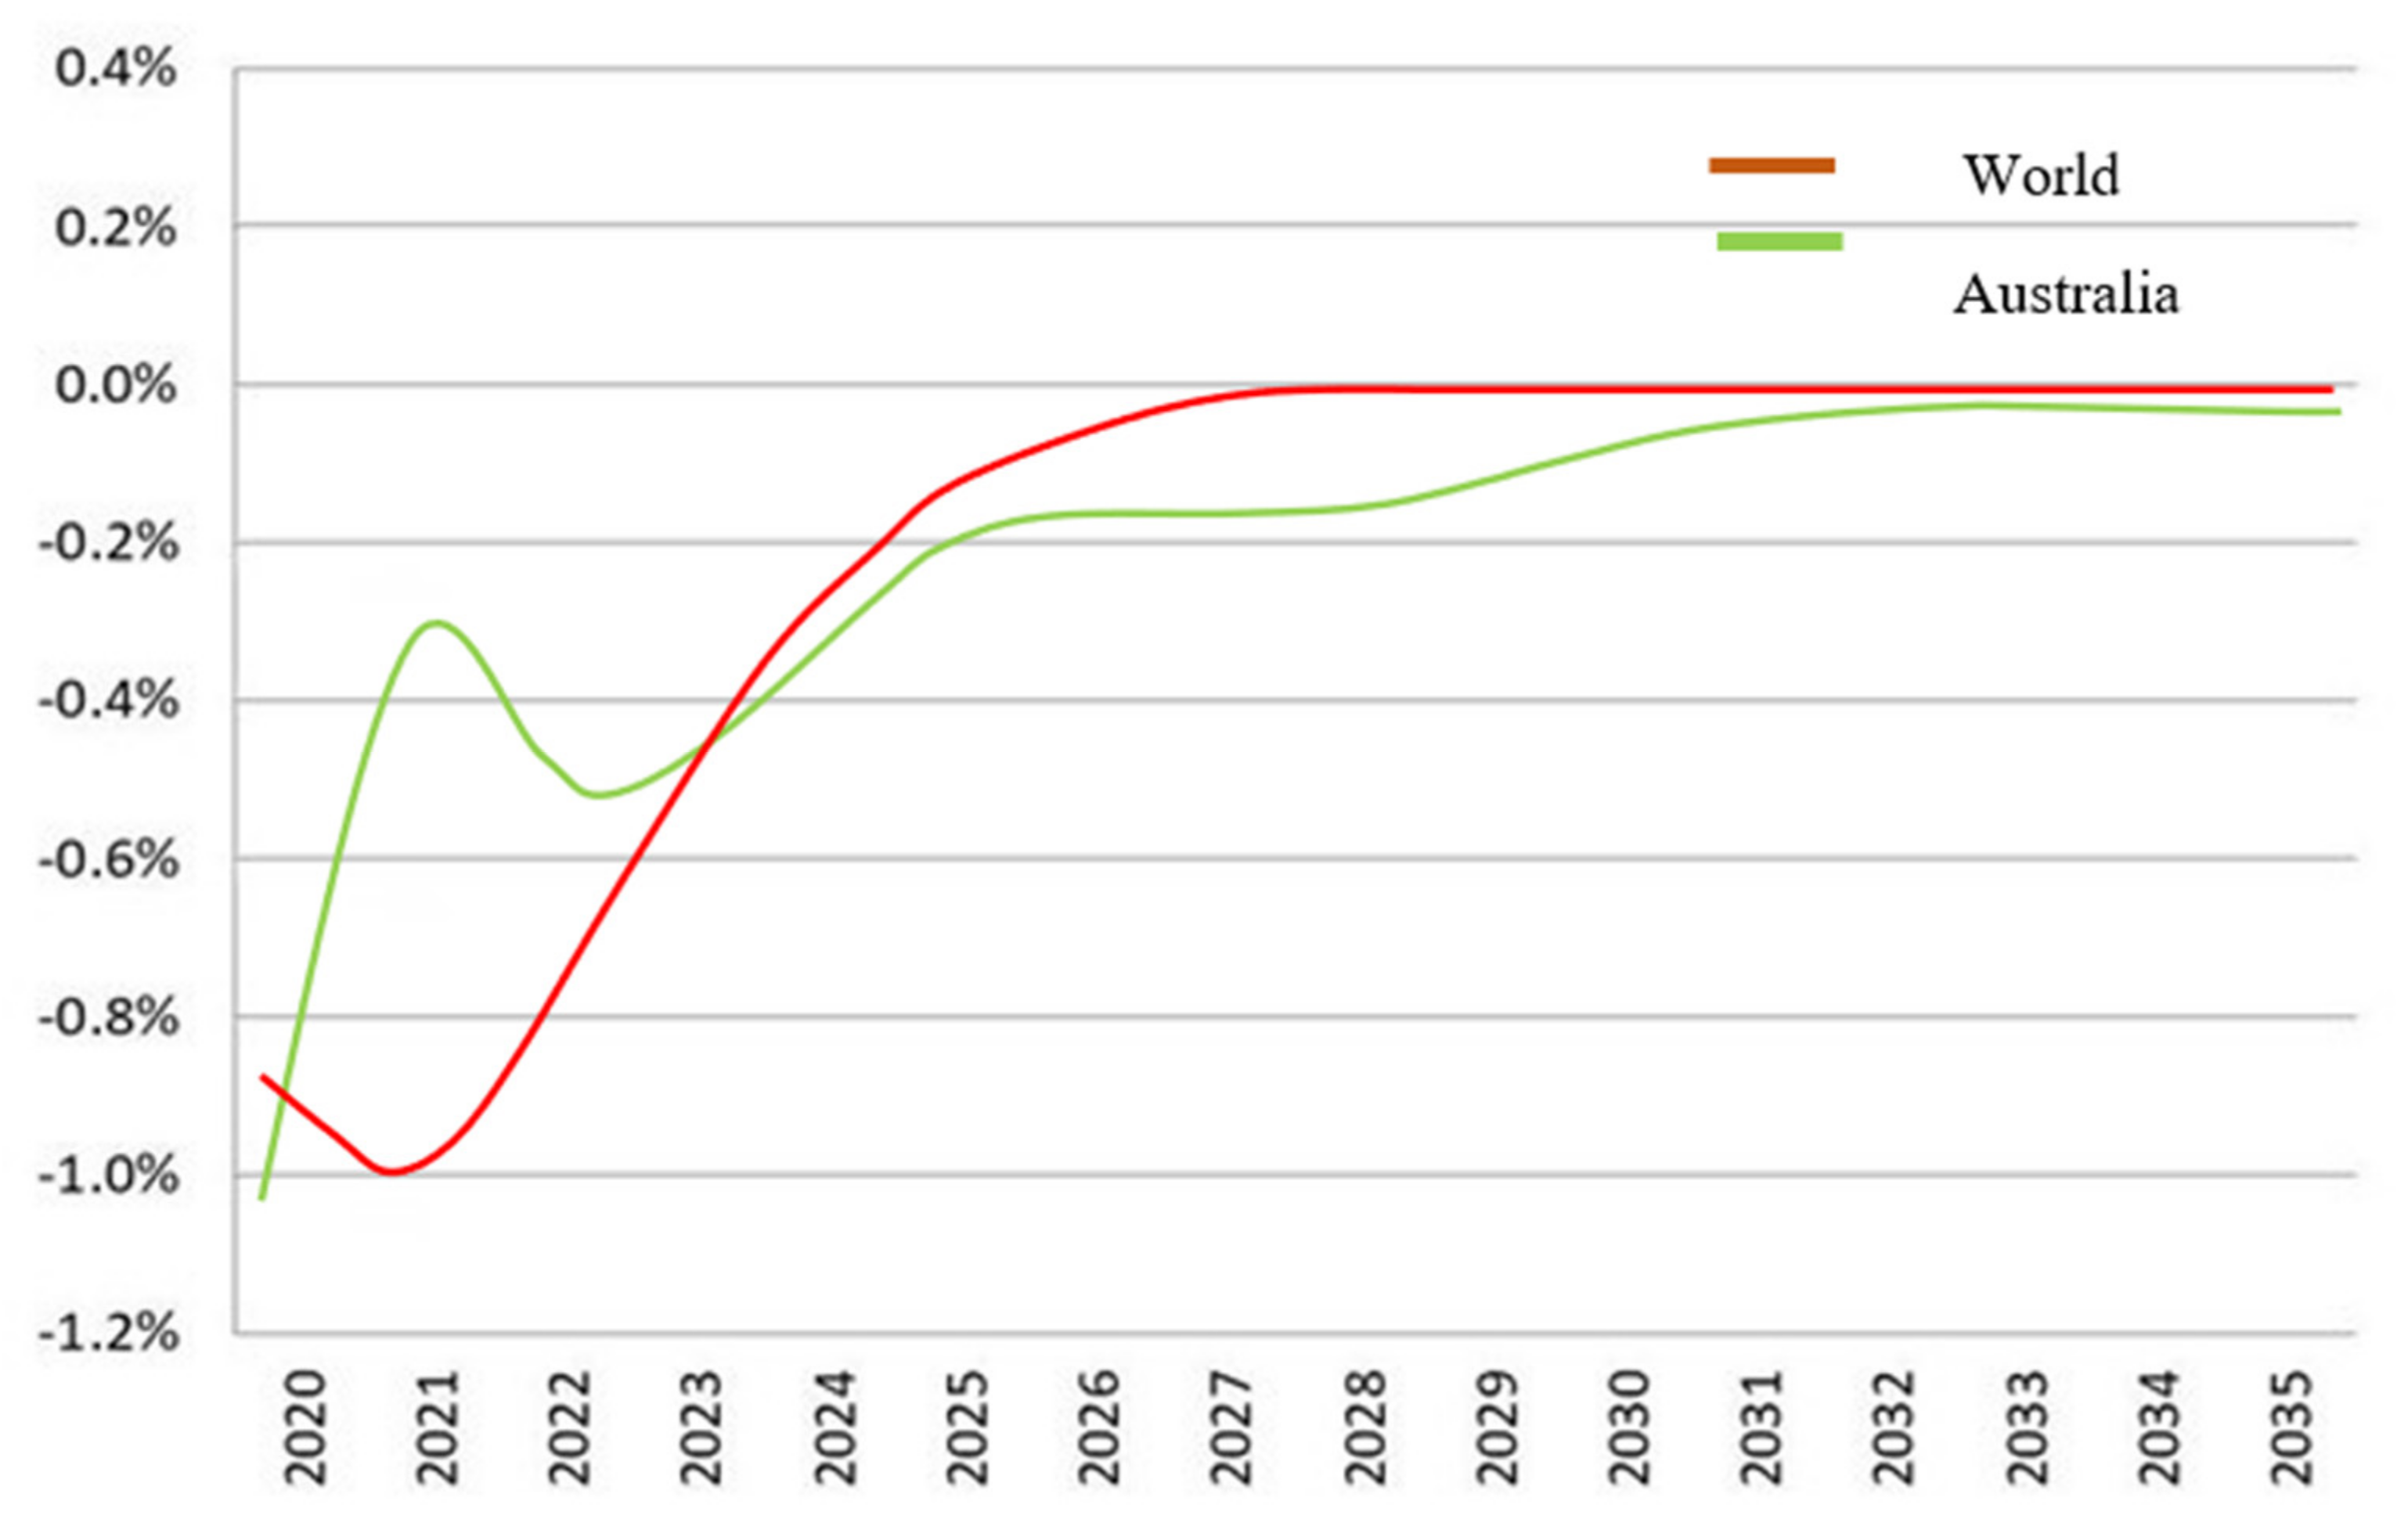
It was estimated that COVID-19 would lessen Australia’s GDP by 0.9% in the absence of the Commonwealth Government package. By the end of 2020, this may amount to impacting the GDP by $17 billion towards the end of 2020. A rebound of $12 billion is expected in 2021, but it may take several years to return to the forecasted GDP before the pandemic [39,40]. The supply side of the economy was affected at the first stage of the pandemic. While productivity was highly affected as many workers were absent from the workplace on a voluntary or involuntary basis, the supply chain was greatly impacted by the production being carried out at below the normal capacity. With time, the supply-side shock will turn into a demand-side shock. The demand for inputs has reduced by the businesses that are unable to operate at their full capacity and to meet the commitments with cash flow drying up. In addition, consumers’ expenditure patterns have changed with reduced spending on entertainment, dining out, travelling and tourism [41,42,43]. The intensity of the economic impact and uncertainty in the duration of coronavirus can further lead to negative demands as consumers reduce expenditures to save up as a precaution against low or no income. This will impact businesses as they avoid future investment decisions and tighten up on cash flow management.
Due to the pandemic conditions, it was estimated that unemployment would be maximum in 2020 at 10%, which is then expected to decrease and will reach 6% by 2022 [44]. In some economic sectors, there has been an increased labour demand despite the recorded increase in unemployment. For instance, an increase in trade and employment in supermarkets was reported in March 2020, when people resorted to buying essentials such as toilet paper and pasta in panic [45]. Similarly, employment in the health sector increased along with the demand for community amenities [46]. For immigrants who do not have access to the benefits provided by the government for the unemployed, the public needs to support them in these critical times. On March 19, 2020, the certified cash rate was reduced to 0.25% by the Reserve Bank [47]. The substantial impact of these decisions, however, will become visible in some time (Figure 9). As per a survey conducted by the Australian Bureau of Statistics (2020), the number of people working on an hourly basis reduced from 64 to 56% in the first week of April [48]. Unemployment increased from 1.5 to 2 million people due to the COVID-19 pandemic. These findings are in line with Friel and Demaio (2020), who reported that people below the poverty line were further marginalised due to health issues, debt, homelessness and physical and mental issues. Due to the economic burden on the people, the government provided unparalleled support to the people. As the Commonwealth anticipated a drastic rise in the unemployment rates during the pandemic, the unemployment benefit entitled Newstart was renamed to JobSeeker Allowance and the amount was also doubled to 1115.70 dollars per fortnight temporarily [43]. The Coalition was resisting increasing the unemployment subsidy for a long time despite being pushed by the welfare and business divisions [49]. Hence, the provision of the JobSeeker benefit was a drastic measure. The opposition supported the provision of debts for both small and medium businesses in its package of 66 billion dollars.
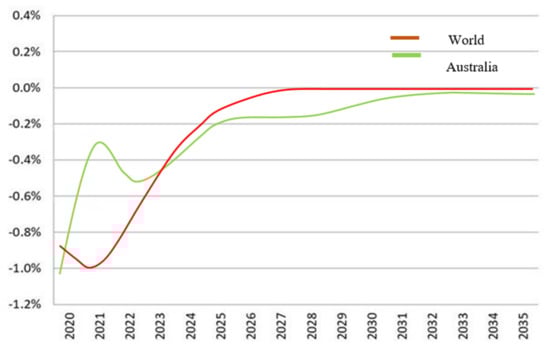
Figure 9.
Impact of COVID-19 on Australia’s GDP (KPMG, 2020).
The third-leading export sector of Australia in terms of earning is education. Unfortunately, due to travel bans, thousands of students were not able to enter the State at the start of 2020 to continue their education. The government did not try to save the higher education sector, even though COVID-19 had risked 21,000 jobs at the national level, because the revenues had fallen from 4.6 billion dollars to 3 billion dollars [50,51]. According to the government, the universities have enough funds to survive the impact of the pandemic and do not need support from the government [52]. The universities and opposition have applied for financial assistance, which has not been approved by the Commonwealth. The impact of higher education on the economic revival of the country is still questioned [53]. The contribution of the manufacturing sector to the economic development of Australia is also significant. However, the significance of this sector has gradually decreased because the government has attempted to expand the economy by developing export industries instead of the manufacturing division. With the onset of a pandemic, the importance of national self-sufficiency has increased. In this regard, the Commonwealth Treasurer has addressed the existing barriers in the manufacturing sector by introducing flexibility in the labour market and a reduction in taxes [46].
In the three-stage strategy of the government to remove social distancing rules, the hospitality industry has become the point of focus [42]. It is feared that if the hospitality industry is opened and the physical distancing measures are re-imposed, then closing the industry again would inflict lasting damage on this sector, which already has small revenues. For instance, the sustainability of restaurants may be compromised when they will have to implement the three-stage plan. Due to social distancing rules, many restaurants are not able to open, because they cannot function at their maximum capacity. Hence, they will not be contributing to the recovery of the economy, which requires the revival of 850,000 jobs. The employment rate dropped from 62% in February to 58.9% in April 2020, translating to a loss of 670,000 jobs. The largest employment drop was experienced for young people aged between 18 and 24 years and those above 65 years of age. From February to April 2020, the average working hours dropped from 35.1 to 31.1 h/week. The combined impact of reduced working hours and job loss translated to 13.1% in working hours, or 56.2 million h/week. Furthermore, the average household income after tax dropped by 9.1%, reduced from $ 1795 in February 2020 to $ 1632 in April 2020 [32].
In the month of October 2020, a prominent social and economic impact of the pandemic was the provision of the JobSeeker fund, which was expected to be cancelled and the unemployment benefit returned to its previous amount, which is 550 dollars per fortnight. This is a prominent reduction for the recipients who belong to a group that forms 10% of the population who are of working age. Decreasing the spending capacity of this group is predicted to have a significant economic impact (Reserve Bank of Australia, 2020a). Similar plans are developed by the government for the withdrawal of the JobSeeker fund that pays 1500 dollars per fortnight to those employees who left their jobs, if they regain the same jobs when the pandemic ends. Internationally, Australia has petitioned for a sovereign investigation for tracing the origin of coronavirus. It is still unclear whether the motivation of this step was general health concerns or involves the political association with China [37].
5. Flexible Working Arrangements
Working from home and flexible working times have been gaining popularity in recent years, as reported by the Australian Bureau of Statistics (2016), and a third of the entire employed citizens work from home regularly. The results from another survey anticipated that the statistics of Australian employees working from home for at least half of the week could be increased by as much as 50%. In contrast, almost two-thirds worked at least one day a week, away from the office.
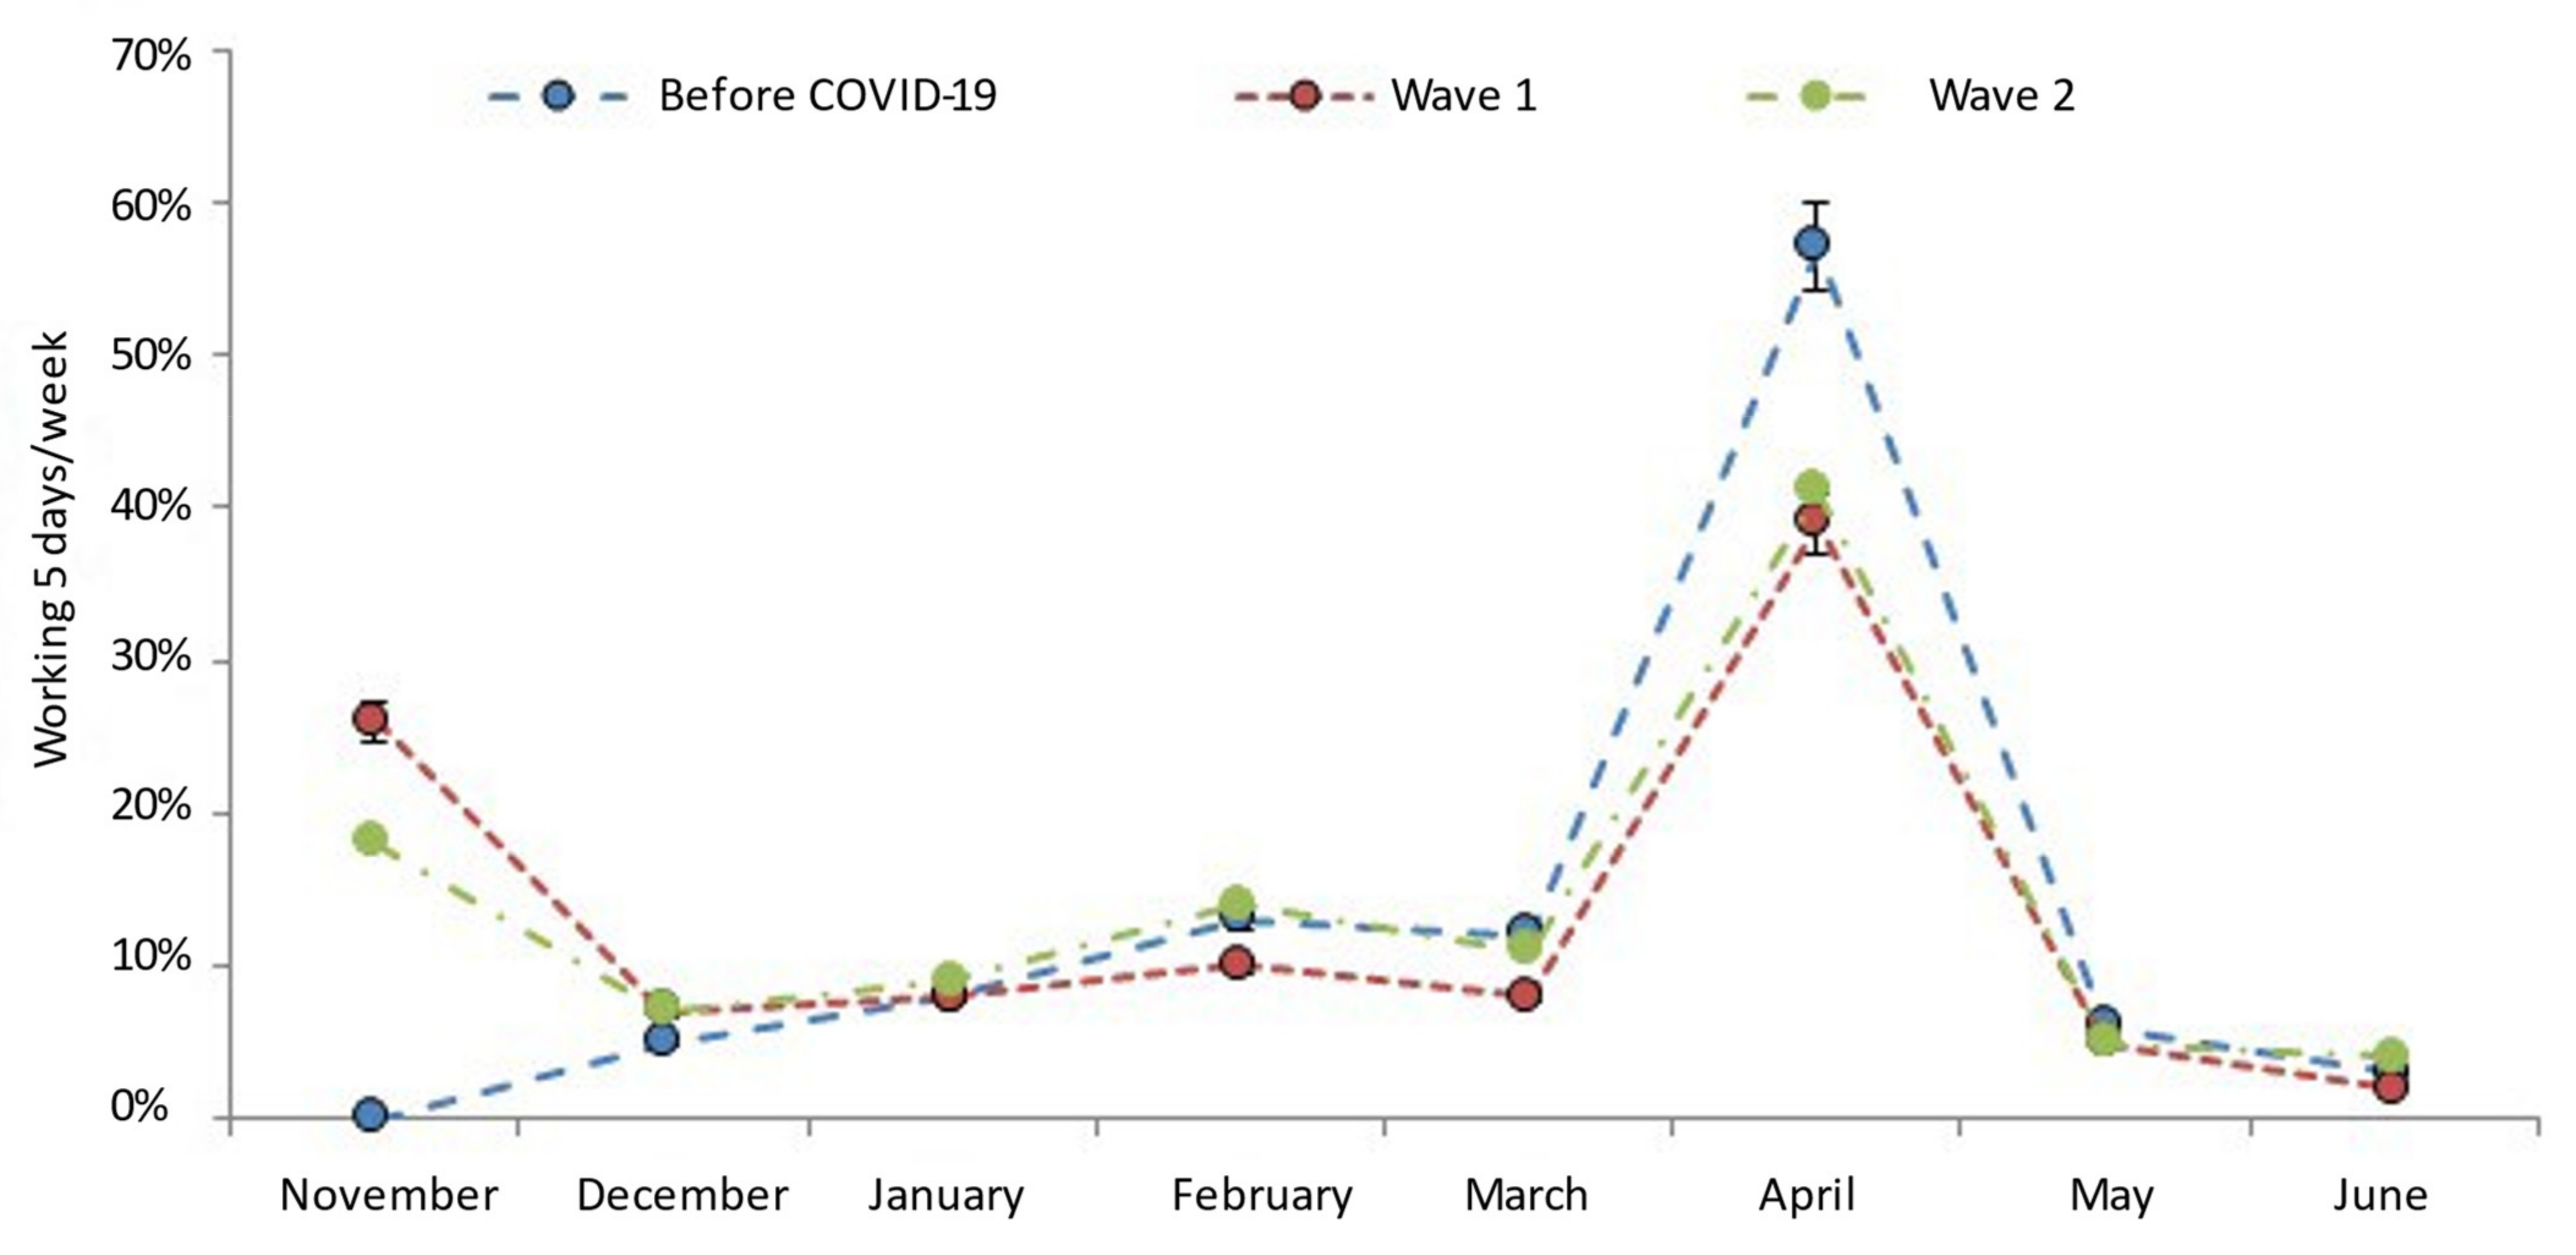
The restriction due to coronavirus significantly impacted the work availability and the workplace where the employees completed their work, as investigated by Beck et al. (2020). Around 476 respondents who work were interviewed for wave 1, while for wave 2, data were gathered from 705 respondents who travelled to work. For the people who were working 5 days a week before the onset of the pandemic, the statistics reduced from 58 to 39% after wave 1 (30 March to 15 April), while during wave 2 (23 May to 15 June), the statistics slightly improved to 41%. Furthermore, out of the people who were working 1 day per week before coronavirus restrictions, about 26% of workers were found to be unemployed during wave 1, while the number reduced to 17% during wave 2 (Figure 10) [37].
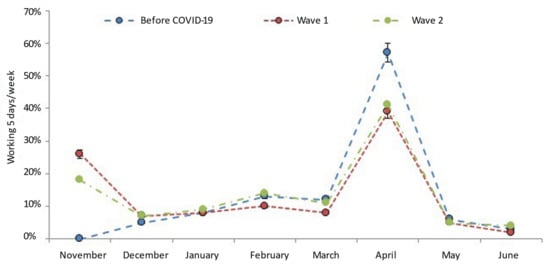
Figure 10.
Impact of COVID-19 waves 1 and 2 on the working conditions of people.
The proportion of working from home was examined as days worked from home out of the total working days. As per Table 3, the figures depict a change back towards the pre-COVID-19 scenario. The extreme change is not likely to be sustainable, and people would prefer to go back to their pre-COVID-19 working conditions. It can be assumed that equilibrium may be attained between WFH before coronavirus and during the first wave of the pandemic. In the future, there is a deviation from the extreme (0% or 100% WFH) towards the middle values, indicating an increase in the proportion of WFH out of the total hours worked [32].
Table 3.
The proportion of days worked from home [31].
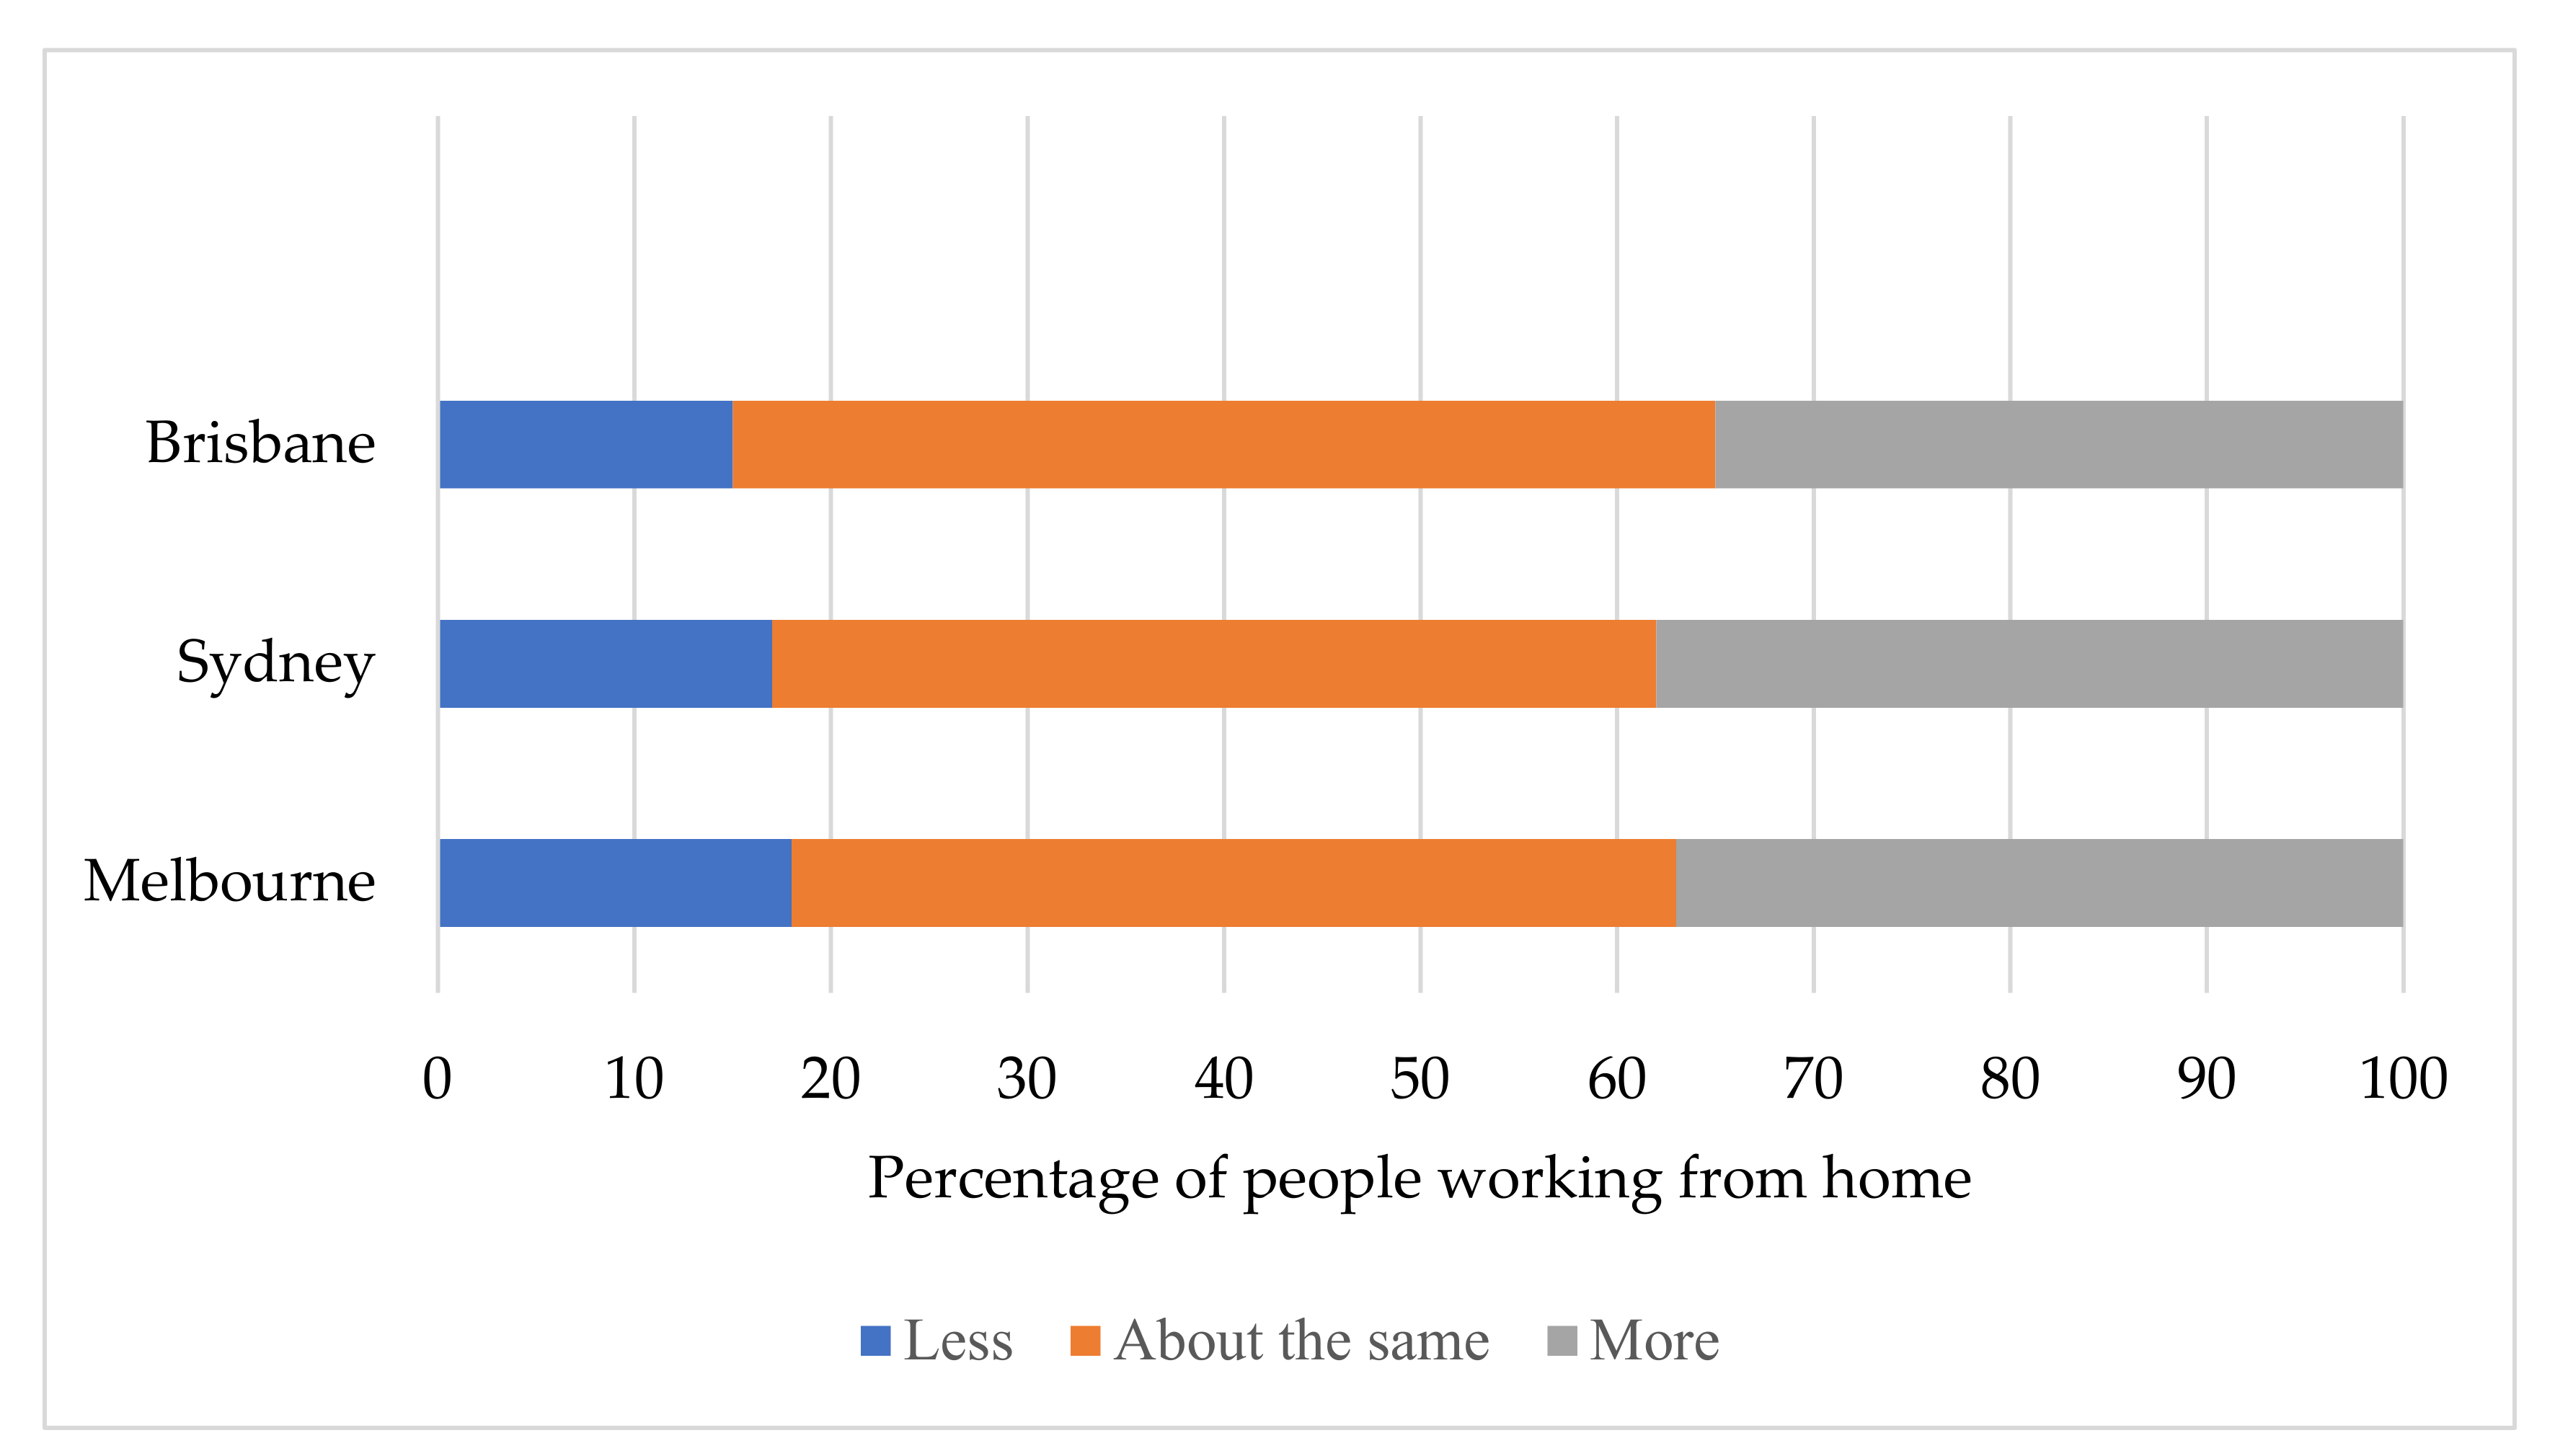
A recent online survey was sponsored by Transurban and conducted by Nature, Australia, the United States and Canada. This survey aimed to monitor the mobility trends in some major cities globally, including Brisbane, Sydney, Melbourne, Montreal and Washington. The survey included the data and events till 07 August 2020. One of the major questions posed to the respondents was that once the COVID-19 risk has passed, how much will they work from home (Figure 11). The results focused on Australia show that among the Brisbane respondents, almost 14% are less likely to work from home after COVID-19, whereas 44% will work the same hours and 41% are more inclined towards working in an office. Sydney and Melbourne’s respondents showed almost similar thoughts regarding their possibility of working from home or office. The remaining 15% think they will be more likely to work from home, whereas most are inclined to work regular hours in a centralised workplace. Overall, almost 45% of the respondents had worked remotely or were continuing to work remotely before the arrival of COVID-19 at the start of 2020.

Figure 11.
The future of working from home after COVID-19 (Transurban, 2020).
Nonetheless, a majority (86%) of the respondents believe they will not remarkably increase the amount of time they work from home post-pandemic. Only 14% think that the experience of the pandemic would considerably increase the extent of work performed from home after the virus is gone. Hence, most of the respondents hope to return to their centralised offices after the pandemic threat is over or neutralised.
6. Shopping Patterns of People
One significant change during the pandemic is the increased preference of people towards online shopping rather than in-store shopping. E-commerce has played a significant role in reducing the use of transportation facilities. According to statistics by the Bazaar Voice Network, online shopping represented 10% of the retail market in the United States in 2017. In 2019, before the onset of COVID-19, this percentage had grown to 16%. This percentage rose drastically during the pandemic, as it doubled in the month of April 2020 and was 57% higher in June [54]. Australia Post remarked that 2020 observed more online shoppers than ever in history—about a 31% increase in April compared to the average in 2019. Overall, the national average of online shopping transactions also rose by 41% for the year to 30 April 2020, increasing from 17.2% in 2019. The online shopping growth showed amazing numbers in Melbourne as it re-entered the stage 3 restrictions (closure of pubs, bars, entertainment venues, churches and places of worship, restricting restaurants and cafés to take-away only and limiting public gatherings to two people) in July, causing the purchases to rise by 161% as compared to the same week in the previous year. According to the earlier-mentioned Transurban survey of mobility trends, a potentially long-term shift in the shopping behaviours is expected in Australian citizens. Almost 48% of respondents of the survey informed they had availed online shopping more during the lockdown. Despite the restrictions in July, online shopping was also high in Sydney (73%) and Brisbane (about 65%), emphasising the possible significant shift in the shopping behaviour of people. In normal conditions, people use transportation to visit shopping malls, markets and outlets [55]. The increasing trend of online shopping during the pandemic has brought about a major reduction in the use of transport facilities as people can shop safely and conveniently from their homes.
7. Discussion
The statistics presented in this study show that people have now adjusted to the new normal under the pandemic. The people are now working from home due to quarantine, lockdown or social distancing policies. Working from home seems to be a long-term behavioural change in the citizens as many people are willing to work from home even in the post-pandemic era. The trend of online shopping has also increased drastically due to safety and convenience. The current COVID-19 prevention and containment policies will have a long-term effect on the behaviour of people. Due to decreased mobility of people, the transport industry has faced a major decline as people rarely leave their homes under the COVID-19 restrictions. This has also resulted in decreased traffic congestion in urban areas and a substantial reduction in noise and pollution. However, with people confined to their homes, many businesses have come to a halt and global trade is affected, which has resulted in an economic recession.
Moreover, it was observed that teleworking might emerge as the only long-term change relevant to the post-pandemic world, as indicated by the preliminary study conducted by Currie and coworkers. Therefore, there is an earnest need to explore the dynamic shift from routine working to teleworking and other forms that are based on flexible working procedures in Australia. Besides this, focused research on the active modes of transportation is also highly necessitated as the teleworking or work-from-home options would lead to a greater dependency on localised transport networks and active transport (i.e., walking and cycling), thus defining new mobility patterns.
The unique conditions imposed during this novel global pandemic have resulted in people’s changed behaviour and habits, causing them to re-examine the priorities in uncertain circumstances. During the worldwide pandemic, the prevention and precautionary measures from the governments and advisory organisations, such as social distancing and fear of transmission, have resulted in many people altering their daily lifestyles. Noteworthy transitions were observed in the way people preferred shopping. In-store shopping is a typical trend, but this had to halt, considering the outspread of the virus. Although recreational and leisurely shopping was no longer needed in the COVID-19 times, people had to shop for major purposes, including medicines and pharmaceuticals, groceries and food from restaurants. The postulates of social distancing, self-isolation and the shutdown of physical stores have all led to the increased use of online shopping. This mode of shopping is not only the preferred way but, realistically, the only way to shop in the COVID-19 era.
To ensure the sustainability of the failing businesses and industries in the pandemic period, the government should take steps for their rehabilitation, which includes the provision of funds and introduction of safety measures needed to carry on the business operations and ensure minimum loss during the pandemic crisis. The government of Australia and the opposition have mutually agreed on the support policies being introduced for social and economic sustenance. However, these measures are taken on a short-term basis and philosophical conflicts arise between these parties when considering the long-term use of these policies [22]. The issue of recovery after the end of the pandemic is reviving many debates, particularly over taxes and employment affairs strategies. Since the rollout of the COVID-19 vaccination, around 17.9% of people have been fully vaccinated. Australia is aiming to provide vaccines to all citizens. This will help to ease the restrictions and will encourage the people to return to the pre-pandemic lifestyle. Widespread vaccination will give more confidence to open businesses, plan events and minimise sudden lockdowns and closure of state borders.
8. Conclusions
Overall, this paper provided insights into the influence of COVID-19 on transportation, economic impacts, working from home and the shopping behaviour of the people in Australia. The study found out that:
- The public transport usage dropped to 46%, visits to public places dropped to 23% and only 15% of employees worked from their offices.
- The preference of working conditions in different states of Australia was evaluated, and it was found that more than 40% of the employees are willing to go back to their office working environment, while 15% are willing to continue working from home.
- Australia has observed the highest record of online shopping ever, increasing to 41% in April 2020, which was 17% the same time in 2019.
The limitation of the current study is that the research could have been improved with more understanding of the analysed data to understand the work-from-home experience with more insight. The figures indicate how many people are working from home, but their work experience and productivity are not gauged. In future research, working from home should be examined to understand the prospects of future working arrangements, and working from home will move forward. Furthermore, COVID-19 has largely disrupted industries that provide services to humans, such as restaurants, cafés, bars and salons, which need to be investigated for more insights.
Author Contributions
Conceptualisation, H.S.M., Z.Q. and S.I.K.; methodology, H.S.M., Z.Q. and S.I.K., and software, H.S.M., Z.Q.; validation, S.I.K.; formal analysis, H.S.M., Z.Q.; the investigation, H.S.M., Z.Q. and S.I.K.; reviewing and editing, Y.S.K.; resources, A.Z.K.; data curation, M.A.P.M.; writing—original draft preparation, H.S.M., Z.Q. and S.I.K.; funding acquisition, M.A.P.M. All authors have read and agreed to the published version of the manuscript.
Funding
This research received no external funding.
Institutional Review Board Statement
Not applicable.
Informed Consent Statement
Not applicable.
Data Availability Statement
Not applicable.
Conflicts of Interest
The authors declare no conflict of interest.
References
- ABC. Coronavirus Pandemic Means Some Australian Workers Are Busier Than Ever. 2020. Available online: https://www.abc.net.au/news/2020-04-12/coronavirus-work-for-truck-driverssupermarket-workers-cleaners/12142448 (accessed on 10 January 2021).
- ABC. Coronavirus Disease (COVID-19) Advice for the Public: Myth Busters from WHO. 2020. Available online: https://www.who.int/emergencies/diseases/novel-coronavirus-2019/advice-for-public/myth-busters (accessed on 20 April 2021).
- ABC. Academics in Talks to Take Pay Cuts to Save Thousands of University Jobs during Coronavirus Pandemic. 2020. Available online: https://www.abc.net.au/news/2020-05-13/universitiesand-union-negotiate-pay-cuts-save-jobs-coronavirus/12239448 (accessed on 12 February 2021).
- Abu-Rayash, A.; Dincer, I. Analysis of mobility trends during the COVID-19 coronavirus pandemic: Exploring the impacts on global aviation and travel in selected cities. Energy Res. Soc. Sci. 2020, 68, 101693. [Google Scholar] [CrossRef] [PubMed]
- Agarwal, P.; Mulenga, C. Impact of COVID-19 on International Trade: Lessons for African LDCs. SSRN 3693901. 2020. Available online: https://www.theguardian.com/australianews/2019/oct/08/morrison-government-defends-newstart-amid-criticism-it-isamong-lowest-welfare-payments-in-oecd (accessed on 10 March 2021).
- Anzai, A.; Kobayashi, T.; Linton, N.M.; Kinoshita, R.; Hayashi, K.; Suzuki, A.; Nishiura, H. Assessing the impact of reduced travel on exportation dynamics of novel coronavirus infection (COVID-19). J. Clin. Med. 2020, 9, 601. [Google Scholar] [CrossRef] [Green Version]
- Australian Bureau of Statistics. Census QuickStats. 2016. Available online: https://quickstats.censusdata.abs.gov.au/census_services/getproduct/census/2016/quickstat/036 (accessed on 20 March 2021).
- Australian Bureau of Statistics. Media Release. 2017. Available online: https://www.abs.gov.au/ausstats/abs@.nsf/lookup/3412.0Media%20Release12015-16 (accessed on 18 March 2021).
- Australian Bureau of Statistics. Australian Demographic Statistics. 2019. Available online: https://www.abs.gov.au/ausstats/ (accessed on 1 April 2021).
- Australian Government. Coronavirus (COVID-19) Current Situation and Case Numbers. 2020. Available online: https://www.health.gov.au/news/health-alerts/novel-coronavirus-2019-ncov-health-alert/coronavirus-covid-19-current-situation-and-case-numbers (accessed on 20 May 2021).
- Apple. COVID-19 Mobility Trends Reports. 2020. Available online: https://www.apple.com/covid19/mobility (accessed on 16 March 2021).
- Adekunle, A.; Meehan, M.; Rojas-Alvarez, D.; Trauer, J.; McBryde, E. Delaying the COVID-19 epidemic in Australia: Evaluating the effectiveness of international travel bans. Aust. N. Z. J. Public Health 2020, 44, 257–259. [Google Scholar] [CrossRef] [PubMed]
- Aktay, A.; Bavadekar, S.; Cossoul, G.; Davis, J.; Desfontaines, D.; Fabrikant, A.; Gabrilovich, E.; Gadepalli, K.; Gipson, B.; Guevara, M.; et al. Google COVID-19 community mobility reports anonymization process description (version 1.0). arXiv 2020, arXiv:2004.04145. [Google Scholar]
- Baldwin, R.E.; Tomiura, E. Thinking Ahead about the Trade Impact of COVID-19. In Economics in the Time of COVID-19; Centre for Economic Policy Research: London, UK, 2020; p. 59. [Google Scholar]
- Beck, M.J.; Hensher, D.A. Insights into the impact of COVID-19 on household travel and activities in Australia—The early days of easing restrictions. Transp. Policy 2020, 99, 95–119. [Google Scholar] [CrossRef] [PubMed]
- Beck, M.J.; Hensher, D.A.; Wei, E. Slowly coming out of COVID-19 restrictions in Australia: Implications for working from home and commuting trips by car and public transport. J. Transp. Geogr. 2020, 88, 102846. [Google Scholar] [CrossRef]
- Biddle, N.; Edwards, B.; Gray, M.; Sollis, K. Hardship, Distress, and Resilience: The Initial Impacts of COVID-19 in Australia; Australian National University Centre for Social Research and Methods: Acton, Australia, 2020. [Google Scholar]
- Blackmore, J. The carelessness of entrepreneurial universities in a world risk society: A feminist reflection on the impact of Covid-19 in Australia. High. Educ. Res. Dev. 2020, 39, 1332–1336. [Google Scholar] [CrossRef]
- Citymapper Mobility Index. 2020. Available online: www.citymapper.com/CMI (accessed on 2 May 2021).
- Currie, G.; Jain, T.; Aston, L.; McCarthy, L. Long-term post-pandemic impacts of the COVID-19 crisis on travel–early results. In Proceedings of the Smart Public Transport Lab Webinar, Delft, The Netherlands, 3 June 2020; The Delft University of Technology: Delft, The Netherlands, 2020. [Google Scholar]
- Chang, S.; Harding, N.; Zachreson, C.; Cliff, O.M.; Prokopenko, M. Modelling transmission and control of the COVID-19 pandemic in Australia. Nat. Commun. 2020, 11, 5710. [Google Scholar] [CrossRef]
- O’Sullivan, D.; Rahamathulla, M.; Pawar, M. The impact and implications of COVID-19: An Australian perspective. Int. J. Community Soc. Dev. 2020, 2, 134–151. [Google Scholar] [CrossRef]
- Dwivedi, Y.K.; Hughes, D.L.; Coombs, C.; Constantinou, I.; Duan, Y.; Edwards, J.S.; Raman, R. Impact of COVID-19 pandemic on information management research and practice: Transforming education, work and life. Int. J. Inf. Manag. 2020, 55, 102211. [Google Scholar] [CrossRef]
- Ewoldsen, B. The National Academies of Sciences Engineering Medicine. COVID-19 Trends Impacting the Future of Transportation Planning and Research. 2020. Available online: nationalacademics.org (accessed on 30 June 2021).
- Frydenberg, J. Ministerial Statement on the Economy. 2020. Available online: https://ministers.treasury.gov.au/ministers/josh-frydenberg-2018/speeches/ministerial-statement-economyparliament-house-canberragov.au/speeches/2020/sp-gov-2020-04-21.html (accessed on 28 June 2021).
- International Workplace Group. 2019. "Global Workplace Survey: Welcome to Generation Flex." In Google Community Mobility Report. 2020. Available online: https://www.google.com/covid19/mobility/ (accessed on 15 March 2021).
- Henriques-Gomes, L. Morrison Government Defends Newstart amid Criticism It Is among Lowest Welfare Payments in OECD; The Guardian Australia: Sydney, Australia, 2019. [Google Scholar]
- Hensher, D.A. What Might Covid-19 Mean for Mobility as a Service (MaaS)? 2020. Available online: https://www.sydney.edu.au/business/news-and-events/news/2020/05/25/what-might-covid-19-mean-for-mobility-as-a-service--maas--.html (accessed on 28 June 2021).
- Ibn-Mohammed, T.; Mustapha, K.B.; Godsell, J.; Adamu, Z.; Babatunde, K.A.; Akintade, D.D.; Acquaye, A.; Fujii, H.; Ndiaye, M.M.; Yamoah, F.A. A critical review of the impacts of COVID-19 on the global economy and ecosystems and opportunities for circular economy strategies. Resour. Conserv. Recycl. 2021, 164, 105169. [Google Scholar] [CrossRef]
- Johns Hopkins University & Medicine. Coronavirus Resource Center. COVID-19 Dashboard by the Center for Systems Science and Engineering (CSSE) at Johns Hopkins University (JHU). 2020. Available online: https://coronavirus.jhu.edu/map.html (accessed on 25 July 2021).
- Lyu, W.; Wehby, G.L. Community use of face masks and COVID-19: Evidence from a natural experiment of state mandates in the US: The study examines the impact on COVID-19 growth rates associated with state government mandates requiring face mask use in public. Health Affairs 2020, 39, 1419–1425. [Google Scholar] [CrossRef] [PubMed]
- Marsden, J.; Darke, S.; Hall, W.; Hickman, M.; Holmes, J.; Humphreys, K.; West, R. Mitigating and learning from the impact of COVID-19 infection on addictive disorders. Addiction 2020, 21. ISSN 0965-2140. [Google Scholar] [CrossRef] [PubMed] [Green Version]
- McKibbin, W.; Fernando, R. The economic impact of COVID-19. In Economics in the Time of COVID-19; Centre for Economic Policy Research: London, UK, 2020; p. 45. [Google Scholar]
- Mirage. Online Shopping Booms as Melbourne Bunkers Down Again. Miragenews. 2020. Available online: https://www.miragenews.com/online-shopping-booms-as-melbourne-bunkers-down-again/ (accessed on 27 July 2021).
- Mofijur, M.; Fattah, I.R.; Alam, M.A.; Islam, A.S.; Ong, H.C.; Rahman, S.A.; Mahlia, T.M.I. Impact of COVID-19 on the social, economic, environmental and energy domains: Lessons learnt from a global pandemic. Sustain. Prod. Consum. 2020, 26, 343–359. [Google Scholar] [CrossRef]
- Munawar, H.S.; Khan, S.I.; Qadir, Z.; Kouzani, A.Z.; Mahmud, M.A. Insight into the Impact of COVID-19 on Australian Transportation Sector: An Economic and Community-Based Perspective. Sustainability 2021, 13, 1276. [Google Scholar] [CrossRef]
- Prime Minister of Australia. Media Release. 2020. Available online: https://www.pm.gov.au/media/130-billion-jobkeeperpayment-keep-australians-job (accessed on 10 April 2021).
- Prime Minister of Australia. Media Release. 2020. Available online: https://www.pm.gov.au/media/advice-coronavirus (accessed on 27 April 2021).
- Prime Minister of Australia. Press Conference Transcript. 2020. Available online: https://www.pm.gov.au/media/pressconference-australian-parliament-house-08may20 (accessed on 23 February 2021).
- Hakeem, F.F.; Alshahrani, S.M.; Ghobain, M.A.; Albabtain, I.; Aldibasi, O.; Alghnam, S. The Impact of COVID-19 Lockdown on Injuries in Saudi Arabia: Results from a Level-I Trauma Center. Front. Public Health 2021, 9, 704294. [Google Scholar] [CrossRef]
- Probert, A.C.; Sivakumar, B.S.; An, V.; Nicholls, S.L.; Shatrov, J.G.; Symes, M.J.; Ellis, A.M. Impact of COVID-19-related social restrictions on orthopaedic trauma in a level 1 trauma centre in Sydney: The first wave. ANZ J. Surgery 2021, 91, 68–72. [Google Scholar] [CrossRef] [PubMed]
- Reserve Bank of Australia. An Economic and Financial Update. 2020. Available online: https://www.rba (accessed on 18 March 2021).
- Reserve Bank of Australia. Media Release. Available online: https://www.rba.gov.au/media-releases/2020/mr-20-08.html (accessed on 11 March 2021).
- Ritchie, M.; Roser, H. Our World in Data. Oxford Martin School, University of Oxford. 2020. Available online: https://ourworldindata.org/coronavirus-data (accessed on 20 May 2021).
- Romano, F. An Estimate of the Economic Impact of COVID-19 on Australia. SSRN 3581382. 2020. Available online: https://papers.ssrn.com/sol3/papers.cfm?abstract_id=3581382 (accessed on 2 June 2021).
- Scott, N.; Palmer, A.; Delport, D.; Abeysuriya, R.; Stuart, R.M.; Kerr, C.C.; Hellard, M.E. Modelling the impact of relaxing COVID-19 control measures during a period of low viral transmission. Med J. Australia 2021, 214, 79–83. [Google Scholar] [CrossRef]
- Seymour, B. Australia Post Sees Surge in Online Orders as the Country Bunkers Down during Coronavirus Lockdown. Available online: https://7news.com.au/lifestyle/health-wellbeing/australia-post-sees-surge-in-online-orders-as-the-country-bunkers-down-during-coronavirus-lockdown-c-955462 (accessed on 3 April 2020).
- Singh, A.K.; Misra, A. Impact of COVID-19 and comorbidities on health and economics: Focus on developing countries and India. Diabetes Metab. Syndr. Clin. Res. Rev. 2020, 14, 1625–1630. [Google Scholar] [CrossRef] [PubMed]
- Molloy, J. Undertaking Mobility Field Experiments Using GPS Tracking. Ph.D. Thesis, ETH Zurich, Zurich, Switzerland, 2021. [Google Scholar]
- Universities Australia. Uni Viability is Crucial to National Recovery. 2020. Available online: https://www.universitiesaustralia.edu.au/media-item/uni-viability-crucial-to-national-recovery/ (accessed on 10 December 2020).
- Weisbrod, G.; Mulley, C.; Hensher, D. Recognising the complementary contributions of cost-benefit analysis and economic impact analysis to an understanding of the worth of public transport investment: A case study of bus rapid transit in Sydney, Australia. Res. Transp. Econ. 2016, 59, 450–461. [Google Scholar] [CrossRef]
- WHO. Advice on the Use of Masks in the Context of COVID-19: Interim Guidance, 5 June 2020; World Health Organization: Geneva, Switzerland, 2020. [Google Scholar]
- Workie, E.; Mackolil, J.; Nyika, J.; Ramadas, S. Deciphering the impact of COVID-19 pandemic on food security, agriculture, and livelihoods: A review of the evidence from developing countries. Curr. Res. Environ. Sustain. 2020, 2, 100014. [Google Scholar] [CrossRef]
- Munawar, H.S.; Awan, A.A.; Khalid, U.; Munawar, S.; Maqsood, A. Revolutionizing telemedicine by instilling, H.265. Int. J. Image Graph. Signal Process. 2017, 9, 20–27. [Google Scholar] [CrossRef] [Green Version]
- Munawar, H.S. Reconfigurable origami antennas: A review of the existing technology and its future prospects. Int. J. Wirel. Microw. Technol. 2020, 10, 34–38. [Google Scholar] [CrossRef]


Publisher’s Note: MDPI stays neutral with regard to jurisdictional claims in published maps and institutional affiliations. |
© 2021 by the authors. Licensee MDPI, Basel, Switzerland. This article is an open access article distributed under the terms and conditions of the Creative Commons Attribution (CC BY) license (https://creativecommons.org/licenses/by/4.0/).