Article

Feedback to Minimize Household Waste a Field Experiment in The Netherlands

Faculty of Behavioural and Social Sciences, University of Groningen, Grote Kruisstraat 2/1, 9712 Groningen, The Netherlands
*
Author to whom correspondence should be addressed.
Sustainability 2021, 13(17), 9610; https://doi.org/10.3390/su13179610
Submission received: 31 May 2021 / Revised: 20 August 2021 / Accepted: 21 August 2021 / Published: 26 August 2021

Abstract

:
Households can reduce environmental problems by minimizing their waste. Studies suggest that feedback may promote waste minimization. We propose that the effectiveness of feedback depends on the standard to which the feedback is compared. We tested the effect of feedback on waste minimization compared to a personal goal (goal comparison feedback), the behaviour of others (social comparison feedback), or one’s past behaviour (historical comparison feedback). Furthermore, the underlying process explaining the effect of feedback on behaviour is yet unclear. We tested the influence of feedback on environmental self-identity, self-efficacy, and descriptive social norms to minimize waste. We conducted a field study in the Netherlands. Households received feedback during six months on the number of residual waste bags they produce. The results show that all intervention groups reduced their number of waste bags including the control group that only received information on how to reduce waste. Yet, a comparison neighbourhood did not reduce their actual waste during the same time period. We did not find clear differences between the different feedback comparison standards. Furthermore, the feedback did not influence any of the process variables. We found that environmental self-identity was most consistently related to self-reported waste behaviours.

1. Introduction

1.1. Waste Minimization

Waste causes serious environmental problems when it is not properly processed and managed. To reduce the negative impact of waste on the environment we need to decrease the amount of waste [1]. The average European Union (EU) citizen disposes 502 kg of waste per year [2]. This waste causes environmental problems when it is incinerated or goes to landfills [1]. Furthermore, new material resources are needed to produce new products or packaging which further causes serious environmental problems [3,4].
Households can contribute to reducing waste disposal problems by reducing and sorting their waste (see e.g., [4]). For example, households can buy fewer products or buy products with less packaging or with packaging that can be sorted into separate waste streams, such as metal, glass and paper. Here we define the sorting and purchasing behaviours to reduce environmental impacts of waste as ‘waste minimization’ [5]. In the current paper, we will study if feedback can promote waste minimization among households, whether the standard to which feedback is compared influences its effectiveness and we examine the underlying psychological mechanisms.

1.2. Feedback and Comparison Standards

Feedback can be an effective strategy to promote pro-environmental behaviour [6,7,8,9,10]. Generally, feedback provides basic information regarding the target behaviour and gives insight into the outcomes of the behaviour (e.g., the separation rate of recycling materials, the frequency of water-saving behaviour or the amount of energy consumed). By knowing how they perform, people will be able to adjust their behaviour, and therefore feedback is presumed to be an effective behaviour change strategy [9]. Most studies testing the effect of feedback in the environmental domain focused on energy conservation and found that it can reduce energy use [6,7,8,9,11]. Some studies have focused on recycling behaviour [12], and suggest feedback can increase the quality and the amount of recycling materials in households and at universities [13,14,15,16].
Meta-analyses suggest that the effect of feedback on pro-environmental behaviour in general [6], as well as on recycling is relatively small [12]. Furthermore, there is quite some variation in the size of the effect of feedback on behaviour. We argue that the effect of feedback on behaviour may depend on the standard to which the feedback is compared. Merely providing feedback on behaviour may not be very effective in changing behaviour as individuals do not know which behaviour is expected [17]. Effective feedback may require a standard to compare with to alert people to specific behaviour and to take action [18,19]. For example, simply receiving the feedback that you produce a certain amount of waste bags may not be very meaningful. However, receiving feedback that you produce more waste bags than your neighbours or that you produce more waste bags now than you did last year is more likely to signal that you could reduce your current number of waste bags. The standard can be a personal goal (goal comparison feedback), the behaviour of others (social comparison feedback), or your own past behaviour (historical comparison feedback). A meta-analysis on feedback suggests that goal comparison feedback is more effective in changing behaviour than social comparison feedback and historical comparison feedback [8]. However, to our knowledge there has not been a study testing the effectiveness of these comparison standards in one study. In the current paper, we will examine the impact of goal comparison, social comparison and historical comparison feedback on waste minimization. Furthermore, we will test via which processes the different feedback comparison standards influence behaviour. In the following, we will first discuss the different comparison standards and then discuss the process variables that may influenced by the comparison standards.
Goal comparison feedback provides feedback on one’s current behaviour compared to a goal. For example, the number of waste bags your household produced in the past weeks compared to the goal you set on how many bags you aim to produce during this period. Research suggests that feedback with goal comparison increases energy-saving behaviour and reduces actual energy consumption [7,20,21]. Similarly, it has been found to reduce the use of concrete and timber waste at the source [22]. However, research is needed to test the effect of goal comparison feedback on household waste minimization.
Feedback with social comparison is feedback on one’s own behaviour compared to the behaviour of others. For example, the number of waste bags you produced during a certain period compared to the number of waste bags your neighbours on average produced during the same period. Numerous studies have shown that social comparison feedback promotes pro-environmental behaviour, for example, energy conservation [23,24,25,26,27,28], water conservation in households [29,30,31], and food waste recycling [32]. Research also suggests that social comparison feedback promotes waste recycling and reduces sorting errors, compared to general persuasive information [17]. However, a study found that social comparison feedback did not reduce water and energy consumption [31]. The authors suggested that the comparative others should be socially meaningful to the participants (i.e., a pre-existing social group or similar others). We will test the impact of feedback on households’ waste compared to the amount of waste of other people in the neighbourhood.
Historical comparison feedback entails that one’s current behaviour is compared to one’s past behaviour. For example, the amount of waste you produced this week compared to previous weeks. Studies show that historical comparison feedback can reduce actual energy consumption both in households and in the workplace [23,26,33,34] and can increase the participation rate of recycling and the amount of recycled materials [35]. The present study will test to what extent historical comparison feedback is effective in promoting waste minimization.

1.3. The Underlying Process of Feedback

As mentioned above, a meta-analysis suggests that goal comparison feedback is more effective in changing behaviour than social comparison feedback and historical comparison feedback, yet this has not been explicitly tested. Furthermore, it is unknown why goal comparison feedback may be more effective than other comparison standards. It is essential to understand why feedback compared to a particular standard can influence behaviour, because then the feedback can be adapted to more effectively target the underlying process and thereby more strongly influence the behaviour. The underlying process of feedback interventions has hardly been studied [8,36]. To improve the effectiveness of feedback, the present study will examine the underlying process and specifically focus on the role of self-efficacy, descriptive social norms and environmental self-identity.
Feedback may influence the extent to which people feel they are capable of reducing their waste. How well people judge they can execute a behaviour has been defined as self-efficacy [37,38], which can be promoted by information on how well you perform (i.e., feedback; [37,39]. We expect that feedback on the extent to which people are minimizing their waste is likely to influence how well they believe they are capable to minimize waste, although to our knowledge it has not yet been tested whether feedback on waste behaviour influences self-efficacy. Furthermore, we expect that self-efficacy to minimize waste, in turn, promotes waste minimization. The stronger one’s self-efficacy the more one will persist in engaging in the behaviour [37]. Self-efficacy has indeed been found to be related to waste behaviour, for example, to separating waste [40,41]. In the current research, it is particularly expected that goal comparison feedback increases self-efficacy because the comparison of behaviour to a goal strongly focuses on the extent to which people have been successful in minimizing their waste and thus are capable of minimizing their waste, in line with research suggesting that goals can increase self-efficacy [42]. Historical comparison feedback may also influence self-efficacy, because people receive feedback on whether they have executed the behaviour successfully compared to their past behaviour. However, we expect that the extent to which you master the behaviour and therefore the extent to which self-efficacy is influenced, is clearer and stronger when your behaviour is compared to a goal that you achieved or not than when it is compared to your past behaviour. When your behaviour is compared to a goal, it immediately becomes clear whether you reached the goal and thus whether you successfully executed the behaviour. Finally, social comparison feedback may also influence self-efficacy. It has been suggested that learning that others master the behaviour may influence self-efficacy [37]. However, observing others has a weaker influence on self-efficacy than observing that you successfully engaged in the behaviour [35]. Furthermore, social comparison feedback may show that you master the behaviour compared to others in your neighbourhood. Therefore, we expect that social comparison feedback may influence self-efficacy as well, however to a lesser extent than goal or historical comparison feedback. In sum, the present study expects feedback to increase self-efficacy to minimize waste which in turn influences waste minimization. We expect that self-efficacy is most strongly influenced by goal comparison feedback, followed by historical comparison feedback and subsequently we expect social comparison feedback to have the weakest impact on self-efficacy.
Feedback can also increase the extent to which people believe that others aim to minimize their waste. The extent to which you perceive others engage in behaviour has been defined as descriptive social norms [43]. Social comparison feedback provides information on how much waste others produced. Therefore, we expect social comparison feedback to strengthen the descriptive social norm to minimize waste. Research indeed suggests that descriptive social norms are strengthened by social comparison feedback [44]. Descriptive social norms, that is, the extent to which you think others minimize their waste, are likely to promote waste minimization behaviour in turn. Research has shown that descriptive social norms can promote pro-environmental behaviour [45], including recycling [46]. We expect that goal comparison feedback and historical comparison feedback are not likely to influence descriptive social norms to minimize waste because people do not receive information on the extent to which others minimize their waste in those cases.
Finally, feedback may also strengthen the extent to which people see themselves as a pro-environmental person (i.e., environmental self-identity; [47,48]). Receiving feedback on one’s past environmental behaviour has been found to influence how pro-environmental one sees oneself, thus influencing one’s environmental self-identity [49]. Therefore, we expect that feedback on one’s past waste minimization behaviour is likely to influence environmental self-identity. Environmental self-identity is related to a range of pro-environmental behaviours including waste behaviour [47,48,49,50]. Particularly, we expect that historical comparison feedback and goal comparison feedback are likely to influence environmental self-identity. Feedback compared to these standards is more likely to make people aware of their own past waste behaviour, while social comparison feedback is more likely to make people aware of the waste behaviour of others. Specifically, historical and goal comparison feedback may strengthen environmental self-identity which in turn promotes future waste minimization.

1.4. Present Study

In sum, we aimed to examine the influence of feedback on waste minimization and test whether the effectiveness of feedback depends on the comparison standard, specifically historical comparison, goal comparison and social comparison feedback. We expected that goal comparison feedback is more effective in minimizing waste compared to social comparison feedback and historical comparison feedback. Moreover, the present study tested the underlying mechanism explaining why feedback may be effective in influencing behaviour. We studied whether feedback influences self-efficacy, descriptive social norms and environmental self-identity and whether these variables in turn influenced waste minimization. Goal comparison feedback was expected to influence waste minimization via self-efficacy and, to a lesser extent, via environmental self-identity. We expected that social comparison feedback mainly influences waste minimization via descriptive social norms and to a lesser extent via self-efficacy. Historical comparison feedback was expected to mainly influence waste minimization via environmental self-identity, and, to a lesser extent, via self-efficacy. Furthermore, because we provided all households with information on how to reduce their waste we also tested if knowledge on how to reduce waste (i.e., procedural knowledge) increased. Many studies aiming to reduce the environmental impact of waste behaviour focus on recycling behaviour [12], yet it is also important that people purchase differently and thereby produce less waste [4]. Therefore, in the current study, we focused on the reduction of residual waste. Households can reduce residual waste by recycling more, but also by purchasing differently or less.

2. Method

This study was part of the intervention strategy “Waste Awareness” (See https://www.afvalbewust.nl/ (accessed on 5 October 2020)), designed by the publicly-owned Dutch waste collection company ROVA. The intervention started in September 2018 and lasted for six months, until March 2019. All subjects gave their informed consent for inclusion before they participated in the study. The study was conducted in accordance with the Declaration of Helsinki, and the protocol was approved by the Ethics Committee of the university of Groningen.

2.1. Participants and Procedure

A neighbourhood served by ROVA was selected for the intervention strategy. We selected a neighbourhood with many inhabitants to allow us to test the intervention, with underground waste bins that households open with a card to allow us to monitor their waste and where there was room to reduce household waste to make sure our intervention could have an effect. Participants in the neighbourhood that use a collective underground residual waste container received a letter from ROVA and the municipality to inform them about the intervention (the “Waste Awareness” strategy). The letter was sent by the municipality with the aim to increase the likelihood that inhabitants would open and read the letter and thereby increase the response rate. In total 6069 households received the letter. Furthermore, households were informed about the intervention via local media and posters in their neighbourhood. Participants could sign up for the intervention by downloading the mobile application developed by ROVA and by agreeing in the mobile application that their waste card data would be monitored for the duration of the intervention. In total 723 participants signed up (response rate 12%). A power analysis assuming a medium effect size and 80% power showed that we needed 179 participants to test the effect of the different types of feedback on waste.
Participants were asked to fill out a questionnaire immediately after they installed the mobile application (t0) and after the feedback had ended (t1). Participants received a link to the questionnaire via the mobile application and spent about 5 to 10 min to complete the questionnaire. To increase the response rate participants could win a mobile phone (€299), a bin (€149) or one of the three vouchers of 50 euros if they filled out both questionnaires. Furthermore, we sent a push message via the app to remind participants to fill out the questionnaire. In total, 230 participants filled out the questionnaire at t0 and 176 participants filled out the questionnaire at t1. In total there were 327 unique participants and 79 participants filled out both questionnaires.
We measured the demographic variables in both questionnaires (see Table 1). However, in the post measure, we did not ask for income and educational level to keep the questionnaire short. The household size is similar to the average household in this part of the Netherlands (2.3). There are slightly more men in our sample compared to the average (50%) and our sample is somewhat older compared to the average (41; [51]).

2.2. Feedback

During six months, participants received feedback on their household residual waste. Participants could open the collective underground residual waste container with their waste card or their phone. Participants can dispose one waste bag at a time, if they want to dispose another waste bag they need to scan their waste card or phone again to open the container. After each deposit of a residual waste bag, they received a message on their phone. The message included the feedback indicating how many times they had opened the container since the start of the feedback, the date of their previous waste deposit, and the number of residual waste bags they would produce per year if they continued disposing waste in current speed. Participants were randomly assigned to one of four conditions: historical comparison feedback, social comparison feedback, goal comparison feedback or a control condition (see Table 2). For technical reasons, participants were assigned to conditions before they signed up for the intervention. Therefore, numbers differ somewhat between the conditions. The number of residual waste bags they would produce per year was compared to a standard, depending on the condition to which participants were assigned. In the historical comparison feedback condition, the number of residual waste bags the household would produce per year was compared to the number of residual waste bags they produced last year. In the social comparison feedback condition, the number of residual waste bags the household would produce per year was compared to the average number of residual waste bags produced in their neighbourhood. In the goal comparison feedback condition, participants were asked how many bags of residual waste they aim to produce this year. The number of residual waste bags they would produce per year was compared to this goal. Finally, the control condition only received tips and tricks on how to reduce residual waste. All participants in the feedback conditions also received these tips and tricks. Participants could view the feedback in the mobile application and on the website (see Figure 1).

2.3. Measures

2.3.1. Waste

Actual waste. We monitored actual waste via participants’ waste cards. For all participants who installed the mobile application, we received data on the number of times households opened collective underground residual waste container from ROVA. Participants can only dispose one full waste bag at a time as the container is not large enough to dispose more than one full waste bag at a time, therefore each opening of the container represents one waste bag. For the pre-measure t0, we used the data from October 2017 until December 2017 and from January 2017 until 18 March 2017. The data between January and October 2018 (before the intervention started) were not available due to new privacy regulations. At t0 households on average deposited their waste 35 times (SD = 32). The data collected during the feedback intervention, mid-September 2018 until mid-March 2019, served as the post-measure. On average households deposited their waste 24 times (SD = 24) during the intervention. We also measured the waste of a comparison neighbourhood during the same time period. The comparison neighbourhood was in the same part of the country with a similar collection system and did not receive any information. The comparison neighbourhood was similar to the neighbourhood selected for the intervention with regard to the percentage of women (53% in the intervention neighbourhood; 51% in the comparison neighbourhood [52]), household size (2.2 in both neighbourhoods), percentage of houses owned (48% in the intervention neighbourhood; 53% in the comparison neighbourhood). However, the average age was a bit higher in the intervention neighbourhood (M = 45) compared to the comparison neighbourhood (M = 39).
The following self-reported behaviours were monitored via the online questionnaire.
Residual waste. To measure the amount of residual waste produced during the six months of the intervention period and six months before the intervention, we asked participants two questions: ‘In the past months, how many days did it take you on average to fill up a residual waste bag?’ and ‘How full is your residual waste bag when you take it out? Please keep a regular waste bag (60 litres) in mind’. Participants could answer how full their bag is on average on a five-point scale, including clarifying pictures from 1 (emptier; 10 litres), 2 (1/3 full; 22.5 litres), 3 (2/3 full; 35 litres), 4 (full, can still be closed; 47.5 litres), 5 (fuller; 60 litres; see Figure 2). We calculated the total number of litres during six months (Mt0 = 1158, SDt0 = 1109; Mt1 = 911, SDt1 = 1011).
Reducing waste. We used three items to measure to what extent participants try to reduce their household waste. Participants could answer on a scale from 1 (never) to 7 (always) to what extent they engage in the following behaviours: I buy products with as little packaging as possible; I buy products of which I can reuse or recycle the package; I buy products that I can reuse or recycle. We calculated Cronbach’s alpha and the mean at t0, (ɑ = 0.89, M = 3.96, SD = 1.45) and at t1 (ɑ = 0.80, M = 4.47, SD = 1.25).
Reusing. We used two items to measure to what extent participants try to reuse products and packages. Participants could answer on a scale from 1 (never) to 7 (always) to what extent they engage in the behaviours: I try to fix products before I buy something new; I reuse products (for example glasses and jars). Cronbach’s alpha for the pre- and post-measurement are 0.61 and 0.59. As the Cronbach’s alpha is relatively low, we only use the item ‘I reuse products (for example glasses and jars)’ (Mt0 = 4.43, SDt0 = 1.61; Mt1 = 4.76, SDt1 = 1.56) in the analyses.
Separating waste. Separating waste was measured by asking participants to what extent they separate specific waste streams, i.e., glass; paper; textile; plastics, metal and drinking cartons; organic waste. Participants could answer on a scale from 1 (never) to 7 (always). We calculated the average of all streams. The Cronbach’s alpha in the pre- and post-questionnaire were 0.69 (Cronbach’s alpha does not improve if one of the items is removed) (M = 6.28, SD = 0.89) and 0.44 (Cronbach’s alpha increases to 0.51 if the item on organic waste is removed, and further increases to 0.63 if the item on textile is also removed) (M = 6.46, SD = 0.65) respectively. The Cronbach’s alpha of the post-measure is too low, however, we are interested in the mean of all recycling behaviours and therefore decided to combine those measures.

2.3.2. Process Variables

We measured all the process variables via the questionnaire. Furthermore, procedural knowledge was also measured because all participants received information on how to reduce their residual waste.
Procedural knowledge. We measured procedural knowledge with items: I know how to reduce my household waste; I know how to reduce my residual waste. Participants could answer on a scale from 1 (totally disagree) to 7 (totally agree). Cronbach’s alpha for the pre-measure is 0.89 (M = 5.04, SD = 1.34) and for the post-measure 0.90 (M = 5.26, SD = 1.38).
Environmental self-identity. Environmental self-identity was measured with three items: I am the type of person who acts environmentally-friendly; I see myself as a pro-environmental person; Acting environmentally-friendly is an important part of who I am [48]. Participants could answer on a scale from 1 (totally disagree) to 7 (totally agree). Cronbach’s alpha for the pre-measure is 0.94 (M = 5.21, SD = 1.21) and for the post-measure 0.92 (M = 5.42, SD = 1.11).
Self-efficacy. Self-efficacy was measured with two items: I am able to reduce my household residual waste; I am capable of reducing my household residual waste [53]. Participants could answer on a scale from 1 (totally disagree) to 7 (totally agree). Cronbach’s alpha for the pre-measure is 0.65 (M = 4.78, SD = 1.31) and for the post-measure 0.70 (M = 4.78, SD = 1.48).
Descriptive social norms. We measured descriptive social norms with two items: How many of the people in [name of neighbourhood] reduce their residual waste according to you?; What percentage of the inhabitants of [name of neighbourhood] try to reduce their residual waste according to you? [54]. Participants could answer on a scale from 1 (no one) to 7 (everyone). Cronbach’s alpha at t0 was 0.78 (M = 4.17, SD = 0.78) and at t1 0.85 (M = 4.14, SD = 0.84).

2.4. Data Analysis

We used multilevel modelling for repeated measures to test our hypotheses. We expected that the feedback conditions would reduce waste from the premeasure (t0) to the post measure (t1), while we expected that the control group did not reduce waste from the premeasure to the post measure. The control condition was included in the multilevel analysis as the reference group and compared to the three feedback conditions (goal comparison, historical comparison, and social comparison feedback). A random intercepts model with variance components as the covariance structure was executed. The effects of time (t1) were added and the effects of groups (intervention), as well as interaction effects between the intervention and time (t1 × goal comparison condition, t1 × historical comparison condition, t1 × social comparison condition). We expected the interaction effects to be significant. That is, the intervention groups are expected to significantly decrease waste from t0 to t1, while no change in the control condition was expected from t0 to t1.
We used multilevel modelling for repeated measures for the actual waste measure and for the self-reported waste measures included in the questionnaires. Since multilevel modelling does not require data on all measurements for each individual, all 230 participants who filled out the questionnaire at t0 and all 176 participants who filled out the questionnaire at t1 were included in the analysis.
We also used multilevel modelling for repeated measures to test if the process variables increased in the specific feedback conditions from the premeasure to the post measure. We again included the control group as the reference group. We expected the goal and historical comparison feedback group to significantly increase self-efficacy and environmental self-identity from t0 to t1. Therefore, we expected a significant interaction between time and the goal comparison feedback group and between time and the historical comparison group for self-efficacy and environmental self-identity. We expected the social comparison feedback group to significantly increase descriptive social norms and self-efficacy from t0 to t1. Therefore, we expected a significant interaction between time and the social comparison group for descriptive social norms and self-efficacy. In addition, we expected procedural knowledge to significantly increase in all groups, as all the participants received information during the intervention. Therefore, we expected a main effect of time for procedural knowledge. Finally, we aimed to test via regression analyses if the changes in the process variables were related to the changes in waste behaviour.

3. Results

3.1. Effects on Actual Waste

We first tested if the intervention influenced the number of times participants brought a waste bag to the collective underground collection system. All 723 participants who installed the app were included. The results of the multilevel analysis showed a main effect of time (see Table 3 and Figure 3). Overall, participants produced fewer waste bags during the intervention compared to before the intervention. Furthermore, we found main effects for all groups. The goal comparison feedback group, the historical comparison feedback group and the social comparison feedback group all produced less waste than the control group during the premeasure. We did not find significant the expected interaction effects. Following the suggestion of a reviewer we also ran the analysis including household size as a covariate. The findings were similar. Furthermore, a larger household size was related to more waste bags.
Our control group received information on how to reduce their waste and therefore was not a true control group. Therefore, we additionally analysed group-level data from the comparison neighbourhood in the same part of the country with a similar collection system that did not receive any information. We used the same period for the pre- and post-measure as the neighbourhood in our sample. In 2017, there were 79,485 households in this neighbourhood, and in 2018, there were 79,915 households. On average, households in this neighbourhood produced 30.66 bags of waste during the pre-measure and 30.13 bags during the post-measure. This suggests that there was no change in the number of bags during the same period in this comparison neighbourhood that did not receive any information.

3.2. Effects on Self-Reported Waste

Residual waste. We did not find a main effect of time on self-reported residual waste (see Table 4 and Figure 4a). As can be seen in Figure 4a, all groups reduced self-reported residual waste from t0 to t1, however this change was not significant. We found a main effect of the goal comparison feedback and social comparison feedback. Participants in the goal and social comparison feedback group produced less residual waste during the premeasure than those in the control condition. In contrast to our expectation, we did not find any significant interaction effects. That is, the reduction in self-reported residual waste was not larger in the feedback groups than in the control group. We again ran the same analysis including household size as a covariate. A larger household was related to more residual waste. Furthermore, we no longer found a significant main effect of social comparison. Other than that the results were the similar.
Reducing waste. We found a main effect of time for reducing waste (see Table 4). Overall, participants were more likely to reduce their waste during the intervention compared to before the intervention (see Figure 4b). We did not find significant main effects for the feedback groups. In contrast to our expectation we did not find significant interaction effects. Suggesting that the increase in waste reduction was not larger in the feedback groups than in the control group.
Reusing. We did not find a main effect of time or of condition on self-reported reusing behaviour (see Table 4). In contrast to our expectation we also did not find any significant interaction effects. Figure 4c shows that all groups increased their reusing behaviour from t0 to t1, however this increase was not significant. Furthermore, the nonsignificant interaction effects show that the increases in the feedback groups was not larger than the increase in the control group.
Separating waste. We did not find a main effect of time or condition on self-reported separation of waste (see Table 4). Also, in contrast to our expectations we did not find any significant interaction effects. As can be seen in Figure 4d, the means of separating waste were already high during the pre-measure and continued to be high during the post-measure.

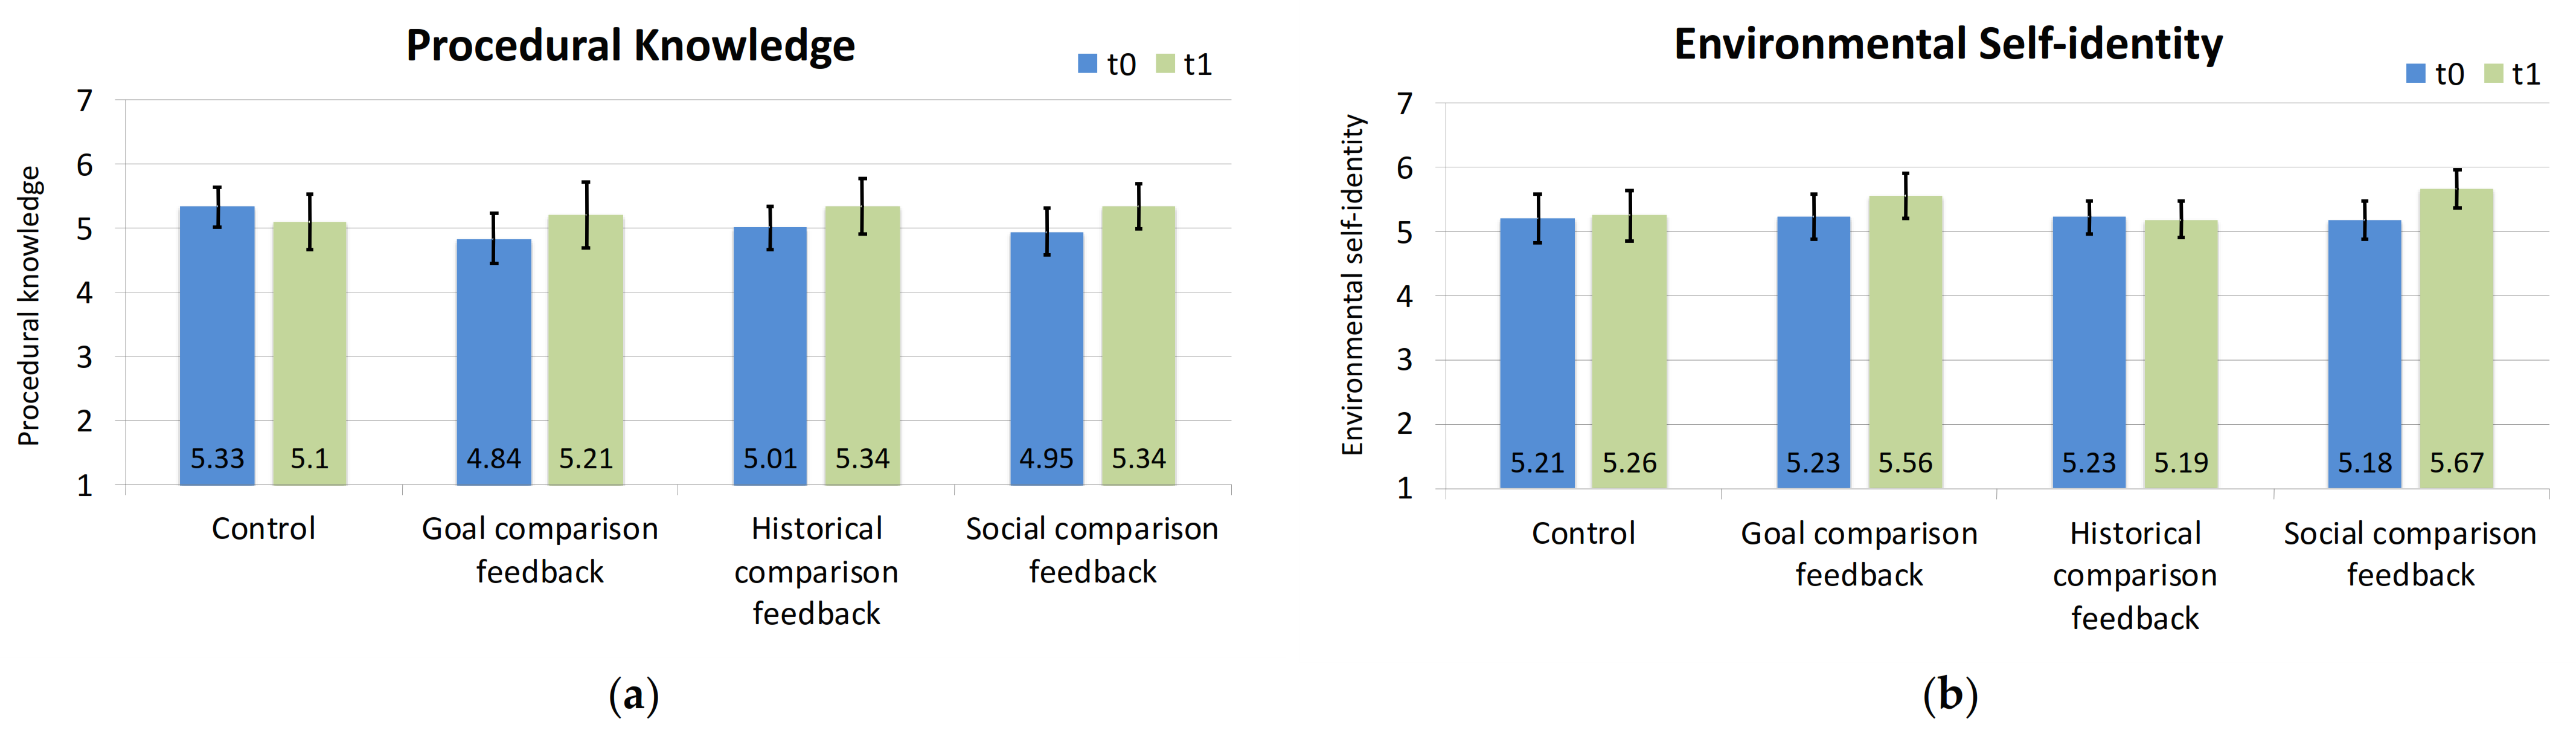
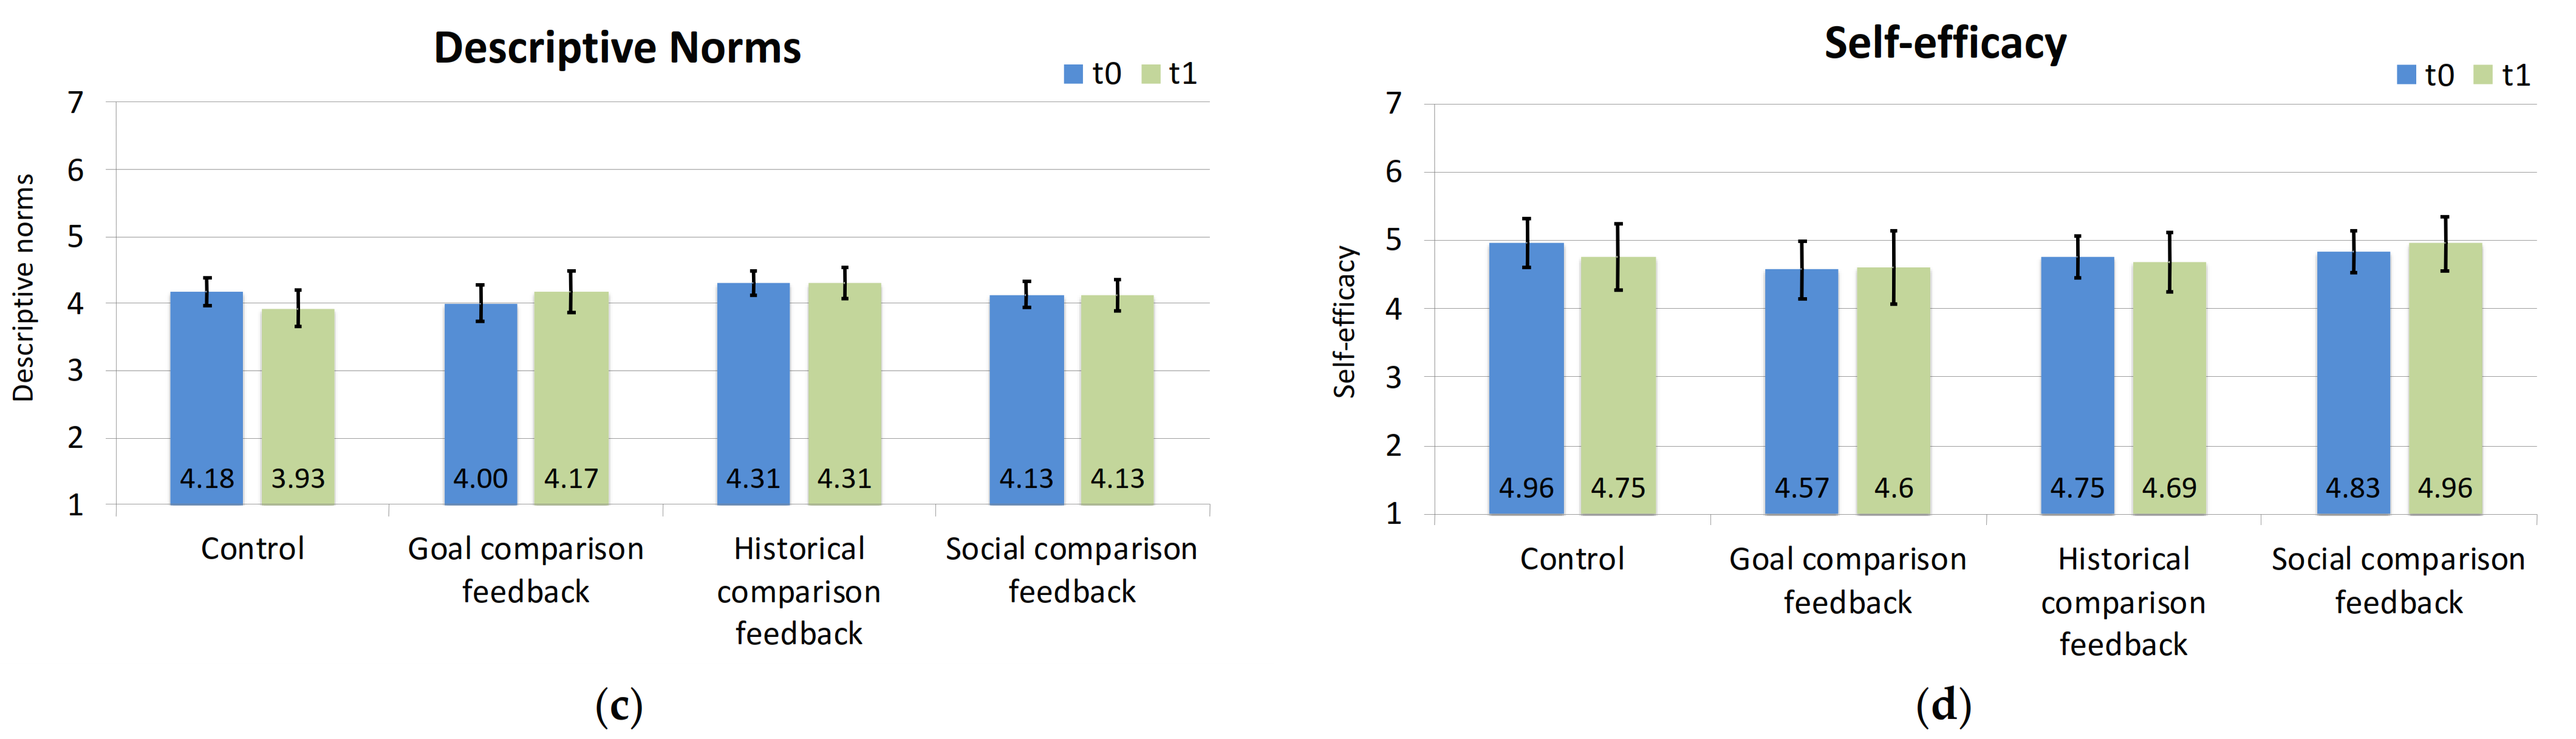
3.3. Effects on Process Variables

Procedural knowledge. In contrast to our expectation we did not find a main effect of time on procedural knowledge (see Table 5). We also did not find a main effect of condition on procedural knowledge. Furthermore, we did not find any significant interaction effects. As can be seen in Figure 5a, procedural knowledge increases in the intervention groups but not in the control group, but these changes are not significant.
Environmental self-identity. We did not find a main effect of time or of condition on environmental self-identity (see Table 5). Also, we did not find the expected significant interaction effects. As shown in Figure 5b, environmental self-identity increases in all groups except the historical feedback group, but the changes are not significant.
Descriptive social norms. We did not find a main effect of time or of condition on descriptive social norms (see Table 5). Furthermore, we did not find any of the expected significant interaction effects. As shown in Figure 5c, the strength of descriptive social norms slightly decreases in the control group and slightly increases in the goal feedback group, but the changes are not significant.
Self-efficacy. We did not find a main effect of time or of condition on self-efficacy (see Table 5). Also, we did not find the expected significant interaction effects. As shown in Figure 5d, self-efficacy slightly increases in the goal feedback group and social comparison group. Self-efficacy slightly decreases in the control group and historical feedback group. Yet, none of the changes are significant.

3.4. Relationship between the Process Variables and Waste

We aimed to test if the change in the process variables was related to the change in waste behaviour. Yet, in contrast to our expectations we did not find that the feedback influenced the process variables. Therefore, we exploratorily tested if the process variables were related to the measures of waste. We examined the correlations between the process variables and the different indicators of waste. Table 6 and Table 7 show the correlations between all process variables and waste variables at t0 and t1, respectively. We found that the actual number of residual waste bags produced by a household is not related to any of the process variables. The results of t0 show that procedural knowledge was only related to self-reported reducing waste. The more knowledge one has on how to reduce residual waste, the more likely participants were to reduce waste. Also, we found that environmental self-identity was related to self-reported residual waste, reducing waste, reusing products and separating waste. The stronger one’s environmental self-identity, the less residual waste the household produces and the more likely they are to reduce, reuse and separate waste. In addition, the results also show that descriptive social norms are related to self-reported reducing waste and separating waste. The more one thinks their neighbourhood reduces residual waste, the more likely someone is to reduce waste and to separate waste. Self-efficacy was not related to any of the self-reported waste behaviours.
The results at t1 show that procedural knowledge was related to self-reported reducing waste and reusing. The more knowledge one has on how to reduce residual waste, the more likely someone is to reduce waste and reuse products. Furthermore, environmental self-identity was found to be related to self-reported reducing, reusing and separating waste. The more one sees oneself as a pro-environmental person, the more likely someone is to reduce, reuse and separate waste. We found that descriptive social norms were related to self-reported reducing and separating waste. The more one thinks their neighbourhood reduces residual waste, the more likely someone is to reduce and separate waste. Finally, self-efficacy is related to self-reported reducing waste. The more one thinks one is able to reduce residual waste, the more likely someone is to reduce waste.

4. Discussion

This study aimed to examine the effectiveness of feedback on waste minimization. Feedback is particularly likely to influence behaviour if one’s performance is compared to a standard. We tested the effectiveness of feedback with different comparison standards, specifically feedback compared to an own set goal (goal comparison), to the behaviour of others (social comparison) and to one’s own historical waste behaviour (historical comparison). We expected all types of feedback to minimize waste compared to a control group that only received information on how to reduce waste. Furthermore, we expected goal comparison feedback to be more effective in minimizing waste, compared to social comparison feedback and historical comparison feedback. Moreover, this study tested environmental self-identity, descriptive social norms and self-efficacy as the underlying mechanisms explaining why feedback may influence behaviour. We argued that goal comparison and historical comparison feedback are most likely to improve waste minimization by influencing environmental self-identity and self-efficacy, while social comparison feedback is more likely to minimize waste through increasing participants’ perceptions of descriptive social norms and to a lesser extent self-efficacy. Overall, we found that participants minimized their actual waste. All groups reduced the number of residual waste bags they bring to an underground container including the control group that received information on how to reduce waste. However, a comparison neighbourhood that did not receive any information did not reduce their number of residual waste bags during the same time period. The results also showed that all groups including the control group improved self-reported reduction of waste during the intervention, but no significant changes in self-reported residual waste, reusing and recycling behaviour were found. In contrast to our expectations, we did not find differences between the different comparison standards in minimizing waste during the intervention. In addition, the feedback did not influence any of the process variables. However, we found that environmental self-identity was related to self-reported waste reduction, reusing and recycling. Descriptive social norms were positively related to reducing and reusing waste. Self-efficacy was only positively related to self-reported waste reduction. Unexpectedly, we did not find relationships between the process variables and actual waste.

4.1. Is Feedback an Effective Strategy to Minimize Waste?

All households produced fewer waste bags during the intervention compared to before the intervention. We did not find significant differences between households in all feedback groups and the control group. However, the graph shows a trend that the feedback groups reduced the number of waste bags from before the feedback intervention to after the feedback intervention more than the control group. Participants were randomly assigned to the intervention groups. Yet, the control group started with a higher number of waste bags compared to the feedback groups. Therefore, it is unclear whether the control group reduced their waste because they started with a large number of waste bags produced. The control group was not a true control group, but received tips on how to reduce their waste. Perhaps, for this group with relatively high waste production, general tips to reduce waste can already help to minimize waste. Furthermore, all participants voluntarily signed up for the intervention and were therefore perhaps already motivated to reduce their waste. In that case, only providing tips may already be sufficient to motivate households to reduce waste. Importantly, we also examined the number of waste bags produced by a comparable neighbourhood that was not exposed to the intervention during the same period and found that this neighbourhood did not reduce the number of waste bags. Research shows that feedback can promote pro-environmental behaviour [6,7,8,9,10]. However, previous research has mostly focused on energy use. Our findings suggest that feedback can also encourage people to reduce waste. However, feedback may not be more effective in reducing waste than providing households with tips. Future research is needed to test if feedback reduces waste compared to a true control group that does not receive any information by randomly assigning participants to an intervention group or the true control group.
We expected goal comparison feedback to be most effective in promoting waste minimization followed by social comparison and historical comparison feedback. Previous research has focused on specific comparison standards and suggests that goal comparison feedback is most effective in changing behaviour [8]. Yet, to the best of our knowledge there is not yet a study comparing the different feedback comparison standards in one study. Our findings suggest that there are no differences between the three comparison standard groups in minimizing waste. However, we did see a small trend that goal comparison feedback may be somewhat more effective in minimizing self-reported waste. However, overall, the results suggest that the comparison standard does not influence the extent to which feedback changes behaviour, which is not in line with the previous findings. A meta-analysis on feedback suggests that goal comparison feedback is most effective in promoting pro-environmental behaviour, followed by social comparison feedback and historical comparison feedback is the least effective strategy [8]. However, variations between the studies included in the meta-analysis, such as the type of target behaviour or target group, may explain why the studies using goal comparison feedback are more effective in changing behaviour than the studies using social comparison feedback or historical comparison feedback. Yet, a study also suggests that feedback can change behaviour, but that the type of feedback is less relevant for its effectiveness [55]. To the best of our knowledge, our study was the first to compare the influence of the feedback standards on pro-environmental behaviour in one study. Therefore, more research is needed to test the influence of the different feedback comparison standards on behaviour.
Importantly, we found that participants changed their actual behaviour, namely they reduced the number of residual waste bags they brought to the underground container. However, we measured the number of waste bags, but we do not know how full the waste bags are. Perhaps some households, for example older inhabitants, bring waste bags to the underground collection system that are not completely full to reduce the weight they have to carry. Furthermore, it is not clear which behaviours households changed when we only look at the number of waste bags, for example, whether they reduced waste by buying differently or whether they reuse more products or separate more waste. Therefore, we also studied self-reported residual waste, reducing, reusing and separating waste behaviour. The participants in all intervention groups and the control group indicated that they reduced their waste, for example by buying differently, more during the intervention compared to before the intervention. We did not find any significant increases in self-reported reusing or separating waste behaviour. However, the graph suggests a trend that the group receiving goal comparison feedback increased their self-reported reusing behaviour. No significant reductions in the self-reported total litres of residual waste were found, which could also be explained by the large variance in self-reported residual waste. The graph shows a trend that the groups receiving goal comparison feedback and social comparison feedback reduced their residual waste while the control and historical feedback group did not. Research has often focused on interventions aiming to increase the separation of waste [12]. However, to reduce environmental problems caused by waste and to move to a circular society, it is crucial to reduce overall waste and not only reuse and separate waste more [4]. Our findings suggest that the intervention reduced waste because participants reduced their amount of waste, for example buying differently and not by reusing or recycling more. More research is needed to test the influence of interventions on different types of waste behaviours, including the reduction of actual waste.
To truly understand the impact of interventions, it is important to study the effects over a long period of time [36]. We tested the impact of our intervention over a period of six months. However, we were not able to monitor waste behaviour after the feedback was removed. Some studies suggest that the effects of interventions may disappear after the intervention has ended [56], while other studies suggest that the effects may continue [5]. Future research should test the impact of intervention strategies over a longer period and specifically examine the effects after the intervention has ended.

4.2. What Is the Underlying Process of Different Types of Feedback?

We examined why the feedback may have influenced waste minimization and found that descriptive social norms, environmental self-identity and self-efficacy did not significantly increase in any of the feedback groups compared to the control group. In contrast to our expectation, descriptive social norms did not increase when individuals received social comparison feedback. An explanation may be that although some participants may have received feedback that their neighbours produce less waste than they do, which may have strengthened their descriptive social norm, other participants may have received feedback that their neighbours produce more waste than they do which may have weakened the descriptive social norm. This effect has been labelled the boomerang effect [57]. Due to privacy concerns, we did not have insight into the specific feedback participants received, and therefore we cannot test whether the boomerang effect occurred. Research suggests that providing injunctive social norms can reduce the boomerang effect [32,57], for example, by including a smiley face to show that it is a good thing that you produce less waste than your neighbours (i.e., the injunctive social norm). We included the injunctive social norm in the feedback to strengthen the effectiveness of the feedback, but we only measured descriptive social norms, not injunctive social norms, in the questionnaire. Future research could test the influence of social comparison feedback on descriptive social norms and injunctive social norms. It has been suggested that social comparison feedback is more effective when the comparison group is socially meaningful [31]. Therefore, future research could also test if social comparison feedback is more effective when the feedback is adapted to the type of household. For example, if the waste of a household is compared to other households with the same household size.
In contrast to our expectation, we did not find that the goal comparison and historical comparison feedback group increased environmental self-identity or self-efficacy. The findings regarding environmental self-identity suggest that receiving feedback on how much waste you produce compared to your goal or your past behaviour may not signal the extent to which you are an environmental-friendly person. Research suggests that environmental behaviour only influences how you see yourself when it clearly signals whether you are a pro-environmental person, for example, by referring to a wide range of past pro-environmental behaviours or to a difficult and unique behaviour [58]. The number of waste bags you produce may not be strong enough to signal how pro-environmental you are, and therefore this feedback may not influence your environmental self-identity. Future research could test the impact of goal comparison and historical comparison feedback on environmental self-identity when the feedback clearly connects the behaviour to its environmental impact, thereby more strongly signalling that you engaged in a pro-environmental behaviour.
Our intervention may not have influenced self-efficacy because individuals were already minimizing their waste to some extent. Self-efficacy does not increase one on one with mastery of the behaviour. A few successes can increase self-efficacy, but a further increase in mastering the task is not likely to increase self-efficacy much more [37]. The participants in our study were likely to already master waste minimization to some extent. For example, for all self-reported waste behaviours, participants scored above the midpoint of the scale. Therefore, it may be difficult to further increase self-efficacy by providing feedback on their improved waste minimization. In addition, it may be more effective to increase self-efficacy by making it easier for individuals to minimize their waste, for example, by improving the facilities to minimize waste. Future research could test whether self-efficacy is more likely to be strengthened when the facilities to minimize waste are improved, and could study the role of other process variables such as personal norms or attitudes.

4.3. Are Descriptive Social Norms, Environmental Self-Identity, and Self-Efficacy Related to Waste Minimisation?

We exploratorily tested the relationships between the process variables and the actual and self-reported waste behaviour. Environmental self-identity was most strongly and consistently related to minimizing waste. Specifically, environmental self-identity was related to a lower amount of residual waste before the intervention took place. Furthermore, a stronger environmental self-identity was related to more reducing, reusing and separating waste behaviour both before and during the intervention, congruent with previous studies which show that environmental self-identity is an important predictor of environmental actions [47,48,49].
Descriptive social norms were less strongly and consistently related to waste minimization. Specifically, the more individuals perceive their neighbours to minimize waste, the more likely they were to reduce waste before and during the intervention. Furthermore, they were more likely to reuse waste after the intervention and more likely to separate waste before the intervention took place. Our findings are in line with studies that show that descriptive social norms may influence environmental behaviour, however that this relationship is not likely to be very strong [36].
Self-efficacy was hardly related to waste minimization. We only found that participants with a stronger self-efficacy were more likely to reduce waste during the intervention, which is not in line with research suggesting that self-efficacy is an important predictor of recycling [46]. We measured self-efficacy on the general level of waste minimization but behaviours were measured on a more specific level. Variables are more strongly related to behaviours when the variables and behaviours are measured on the same level of specificity [59]. Future research could include self-efficacy on the general level of waste minimization as well as on the behaviour specific level (e.g., separating waste and reusing waste) and test if self-efficacy measured on the same level of specificity is strongly related to waste behaviour.
Interestingly, none of the process variables were significantly related to the number of waste bags a household produces, in line with previous research suggesting that psychological variables are more strongly associated with self-reported waste behaviour than actual waste behaviour [46]. Actual behaviour is more likely to be influenced by contextual factors, in this case, for example, the type of house and recycling facilities available. Future research could include these contextual factors as well.

4.4. Limitations

We recruited participants by sending them an invitation letter from their municipality. Furthermore, we distributed posters and information in the neighbourhood and local media. Finally, we distributed prizes among participants who filled out both questionnaires. Yet, only a small percentage (12%) of the inhabitants from the neighbourhood installed the mobile application and thus received the feedback. Furthermore, less than half of those participants filled out one of the questionnaires. Perhaps mostly inhabitants who were already motivated to minimize their waste signed up for our study. Indeed, our sample was not completely representative of the neighbourhood. Specifically, our sample included more men and the average age was higher than in the entire neighbourhood. Therefore, it is unclear if our findings would apply to the entire neighbourhood. Yet, importantly, we did randomly assign participants to one of the feedback groups or the control group.
We provided feedback to participants on the number of residual waste bags they brought to the underground container. However, we could only measure how often households opened the bin. Only one full waste bag fits in the underground container. Yet, it could be the case that some households always bring full waste bags to the underground container while other households bring waste bags to the underground container that are half full. To account for this we also included the self-report measures of waste. Yet, future research could try to use underground containers that measure the weight of waste as well, to provide more meaningful feedback.

4.5. Practical Implications

Our findings suggest that feedback or information on how to reduce waste can minimize waste among households. Furthermore, we found a slight trend that feedback compared to an own set goal may be somewhat more effective in minimizing waste than feedback compared to the behaviour of others or one’s own past behaviour. Therefore, if practitioners aim to minimize waste, they could provide households with feedback on the amount of waste they produce and compare it to a goal set by these households. However, only providing information on how to minimize waste (i.e., tips) may also help to minimize waste. Yet, we found that this was effective among a relatively small percentage of inhabitants who voluntarily signed up for the intervention. It is unclear to what extent our findings would apply to people who do not sign up for such an intervention.
In addition, we found that particularly environmental self-identity was consistently and strongly related to self-reported waste behaviours. Our findings suggest that feedback is not an effective approach to strengthen environmental self-identity. However, research suggests that reminding individuals of their past pro-environmental actions can be an effective strategy to strengthen environmental self-identity and thereby promote waste minimization [49]. Therefore, to minimize waste, practitioners could try to strengthen people’s environmental self-identity by providing them with more information regarding their pro-environmental behaviour.

4.6. Conclusions

To reduce environmental problems households need to reduce their waste. Providing households with information on how to reduce waste and providing them with feedback on their waste can help to reduce waste. However, it is yet unclear why this is the case. Furthermore, more interventions such as structural strategies are needed to further help households reduce their waste.

Author Contributions

E.v.d.W. and C.-Y.L. conceptualized the research model and designed the study. E.v.d.W. collected and analyzed the data. E.v.d.W. and C.-Y.L. wrote the paper and edited it. Both authors have read and agreed to the published version of the manuscript.

Funding

This research received no external funding.

Institutional Review Board Statement

The study was conducted according to the guidelines of the Declaration of Helsinki, and approved by the Ethics Committee of the Faculty of Behavioural and Social Sciences, University of Groningen (protocol code PSY-18044-O approved on 27 September 2018).

Informed Consent Statement

Informed consent was obtained from all subjects involved in the study.

Data Availability Statement

Data are available on request.

Acknowledgments

We would like to thank ROVA for the opportunity to perform this research during and after the “Afval Bewust” project. We would like to thank Maud Groot Beumer, Julia van der Struijf and Lies Rademaker for their help in collecting the data. Finally, we would like to thank all participating households for making this project possible.

Conflicts of Interest

The authors declare no conflict of interest.

References

  1. United Nations Environment Programme. Towards a Pollution-Free Planet Background Report; United Nations Environment Programme: Nairobi, Kenya, 2017. [Google Scholar]
  2. Eurostat Municipal Waste Statistics. 2019. Available online: http://ec.europa.eu/eurostat/statistics-explained/index.php/Municipal_waste_statistics (accessed on 20 April 2020).
  3. Henckens, M.L.C.M.; Driessen, P.P.J.; Worrell, E. Metal scarcity and sustainability, analyzing the necessity to reduce the extraction of scarce metals. Resour. Conserv. Recycl. 2014, 93, 1–8. [Google Scholar] [CrossRef]
  4. Corsten, M.; Worrell, E.; Rouw, M.; Van Duin, A. The potential contribution of sustainable waste management to energy use and greenhouse gas emission reduction in the Netherlands. Resour. Conserv. Recycl. 2013, 77, 13–21. [Google Scholar] [CrossRef]
  5. Van der Werff, E.; Vrieling, L.; Van Zuijlen, B.; Worrell, E. Waste minimization by households–A unique informational strategy in the Netherlands. Resour. Conserv. Recycl. 2019, 144, 256–266. [Google Scholar] [CrossRef]
  6. Osbaldiston, R.; Schott, J.P. Environmental sustainability and behavioral science: Meta-analysis of proenvironmental behavior experiments. Environ. Behav. 2012, 44, 257–299. [Google Scholar] [CrossRef]
  7. Abrahamse, W.; Steg, L.; Vlek, C.; Rothengatter, T. A review of intervention studies aimed at household energy conservation. J. Environ. Psychol. 2005, 25, 273–291. [Google Scholar] [CrossRef]
  8. Karlin, B.; Zinger, J.F.; Ford, R. The effects of feedback on energy conservation: A meta-analysis. Psychol. Bull. 2015, 141, 1205–1227. [Google Scholar] [CrossRef]
  9. Faruqui, A.; Sergici, S.; Sharif, A. The impact of informational feedback on energy consumption—A survey of the experimental evidence. Energy 2010, 35, 1598–1608. [Google Scholar] [CrossRef]
  10. Kluger, A.N.; DeNisi, A. The effects of feedback interventions on performance: A historical review, a meta-analysis, and a preliminary feedback intervention theory. Psychol. Bull. 1996, 119, 254. [Google Scholar] [CrossRef]
  11. Tiefenbeck, V.; Wörner, A.; Schöb, S.; Fleisch, E.; Staake, T. Real-time feedback reduces energy consumption among the broader public without financial incentives. Nat. Energy 2019, 4, 831–832. [Google Scholar] [CrossRef]
  12. Varotto, A.; Spagnolli, A. Psychological strategies to promote household recycling: A systematic review with meta-analysis of validated field interventions. J. Environ. Psychol. 2017, 51, 168–188. [Google Scholar] [CrossRef]
  13. De Young, R.; Boerschig, S.; Carney, S.; Dillenbeck, A.; Elster, M.; Horst, S.; Thomson, B. Recycling in multi-family dwellings: Increasing participation and decreasing contamination. Popul. Environ. 1995, 16, 253–267. [Google Scholar] [CrossRef]
  14. Katzev, R.; Mishima, H.R. The use of posted feedback to promote recycling. Psychol. Rep. 1992, 71, 259–264. [Google Scholar] [CrossRef]
  15. Kim, S.; Oah, S.; Dickinson, A.M. The impact of public feedback on three recycling-related behaviors in South Korea. Environ. Behav. 2005, 37, 258–274. [Google Scholar] [CrossRef]
  16. Timlett, R.E.; Williams, I.D. Public participation and recycling performance in England: A comparison of tools for behaviour change. Resour. Conserv. Recycl. 2008, 52, 622–634. [Google Scholar] [CrossRef]
  17. Dupré, M.; Meineri, S. Increasing recycling through displaying feedback and social comparative feedback. J. Environ. Psychol. 2016, 48, 101–107. [Google Scholar] [CrossRef]
  18. Fischer, C. Feedback on household electricity consumption: A tool for saving energy? Energy Effic. 2008, 1, 79–104. [Google Scholar] [CrossRef]
  19. Liu, A.; Giurco, D.; Mukheibir, P. Motivating metrics for household water-use feedback. Resour. Conserv. Recycl. 2015, 103, 29–46. [Google Scholar] [CrossRef]
  20. Becker, L.J. Joint effect of feedback and goal setting on performance: A field study of residential energy conservation. J. Appl. Psychol. 1978, 63, 428. [Google Scholar] [CrossRef]
  21. McCalley, L.T.; Midden, C.J.H. Energy conservation through product-integrated feedback: The roles of goal-setting and social orientation. J. Econ. Psychol. 2002, 23, 589–603. [Google Scholar] [CrossRef]
  22. Lingard, H.; Gilbert, G.; Graham, P. Improving solid waste reduction and recycling performance using goal setting and feedback. Constr. Manag. Econ. 2001, 19, 809–817. [Google Scholar] [CrossRef]
  23. Brandon, G.; Lewis, A. Reducing household energy consumption: A qualitative and quantitative field study. J. Environ. Psychol. 1999, 19, 75–85. [Google Scholar] [CrossRef]
  24. Burchell, K.; Rettie, R.; Roberts, T.C. Householder engagement with energy consumption feedback: The role of community action and communications. Energy Policy 2016, 88, 178–186. [Google Scholar] [CrossRef]
  25. De Dominicis, S.; Sokoloski, R.; Jaeger, C.M.; Schultz, P.W. Making the smart meter social promotes long-term energy conservation. Palgrave Commun. 2019, 5, 1–8. [Google Scholar] [CrossRef] [Green Version]
  26. Midden, C.J.; Meter, J.F.; Weenig, M.H.; Zieverink, H.J. Using feedback, reinforcement and information to reduce energy consumption in households: A field-experiment. J. Econ. Psychol. 1983, 3, 65–86. [Google Scholar] [CrossRef]
  27. Siero, F.W.; Bakker, A.B.; Dekker, G.B.; Van den Burg, M.T.C. Changing organizational energy consumption behaviour through comparative feedback. J. Environ. Psychol. 1996, 16, 235–246. [Google Scholar] [CrossRef] [Green Version]
  28. Winett, R.A.; Neale, M.S.; Grier, H.C. Effects of self-monitoring and feedback on residential electricity consumption. J. Appl. Behav. Anal. 1979, 12, 173–184. [Google Scholar] [CrossRef] [PubMed] [Green Version]
  29. Aitken, C.K.; McMahon, T.A.; Wearing, A.J.; Finlayson, B.L. Residential Water Use: Predicting and Reducing Consumption. J. Appl. Soc. Psychol. 1994, 24, 136–158. [Google Scholar] [CrossRef]
  30. Schultz, P.W.; Messina, A.; Tronu, G.; Limas, E.F.; Gupta, R.; Estrada, M. Personalized normative feedback and the moderating role of personal norms: A field experiment to reduce residential water consumption. Environ. Behav. 2016, 48, 686–710. [Google Scholar] [CrossRef] [Green Version]
  31. Schultz, W.; Javey, S.; Sorokina, A. Social comparison as a tool to promote residential water conservation. Front. Water 2019, 1, 2. [Google Scholar] [CrossRef]
  32. Nomura, H.; John, P.C.; Cotterill, S. The use of feedback to enhance environmental outcomes: A randomised controlled trial of a food waste scheme. Local Environ. 2011, 16, 637–653. [Google Scholar] [CrossRef]
  33. Kurz, T.; Donaghue, N.; Walker, I. Utilizing a Social-Ecological Framework to Promote Water and Energy Conservation: A Field Experiment. J. Appl. Soc. Psychol. 2005, 35, 1281–1300. [Google Scholar] [CrossRef]
  34. Carrico, A.R.; Riemer, M. Motivating energy conservation in the workplace: An evaluation of the use of group-level feedback and peer education. J. Environ. Psychol. 2011, 31, 1–13. [Google Scholar] [CrossRef]
  35. Schultz, P.W. Changing behavior with normative feedback interventions: A field experiment on curbside recycling. Basic Appl. Soc. Psychol. 1999, 21, 25–36. [Google Scholar] [CrossRef]
  36. Abrahamse, W.; Steg, L. Social influence approaches to encourage resource conservation: A meta-analysis. Glob. Environ. Chang. 2013, 23, 1773–1785. [Google Scholar] [CrossRef]
  37. Bandura, A. Self-efficacy mechanism in human agency. Am. Psychol. 1982, 37, 122. [Google Scholar] [CrossRef]
  38. Bandura, A. The anatomy of stages of change. Am. J. Health Promot AJHP 1997, 12, 8–10. [Google Scholar] [CrossRef] [PubMed]
  39. Earley, P.C.; Gibson, C.B.; Chen, C.C. “How did I do?” versus “How did we do?” Cultural contrasts of performance feedback use and self-efficacy. J. Cross-Cult. Psychol. 1999, 30, 594–619. [Google Scholar] [CrossRef]
  40. Tabernero, C.; Hernández, B. Self-efficacy and intrinsic motivation guiding environmental behavior. Environ. Behav. 2011, 43, 658–675. [Google Scholar] [CrossRef]
  41. Tabernero, C.; Hernández, B.; Cuadrado, E.; Luque, B.; Pereira, C.R. A multilevel perspective to explain recycling behaviour in communities. J. Environ. Manag. 2015, 159, 192–201. [Google Scholar] [CrossRef]
  42. Locke, E.A.; Latham, G.P. Building a practically useful theory of goal setting and task motivation: A 35-year odyssey. Am. Psychol. 2002, 57, 705. [Google Scholar] [CrossRef] [Green Version]
  43. Cialdini, R.B. Descriptive social norms as underappreciated sources of social control. Psychometrika 2007, 72, 263. [Google Scholar] [CrossRef]
  44. Dixon, G.N.; Deline, M.B.; McComas, K.; Chambliss, L.; Hoffmann, M. Using comparative feedback to influence workplace energy conservation: A case study of a university campaign. Environ. Behav. 2015, 47, 667–693. [Google Scholar] [CrossRef]
  45. Bergquist, M.; Nilsson, A.; Schultz, W.P. A meta-analysis of field-experiments using social norms to promote pro-environmental behaviors. Glob. Environ. Chang. 2019, 59, 101941. [Google Scholar] [CrossRef]
  46. Geiger, J.L.; Steg, L.; van der Werff, E.; Ünal, A.B. A meta-analysis of factors related to recycling. J. Environ. Psychol. 2019, 64, 78–97. [Google Scholar] [CrossRef]
  47. Whitmarsh, L.; O’Neill, S. Green identity, green living? The role of pro-environmental self-identity in determining consistency across diverse pro-environmental behaviours. J. Environ. Psychol. 2010, 30, 305–314. [Google Scholar] [CrossRef]
  48. Van der Werff, E.; Steg, L.; Keizer, K. The value of environmental self-identity: The relationship between biospheric values, environmental self-identity and environmental preferences, intentions and behaviour. J. Environ. Psychol. 2013, 34, 55–63. [Google Scholar] [CrossRef]
  49. Van der Werff, E.; Steg, L.; Keizer, K. I am what I am, by looking past the present: The influence of biospheric values and past behavior on environmental self-identity. Environ. Behav. 2014, 46, 626–657. [Google Scholar] [CrossRef]
  50. Gatersleben, B.; Murtagh, N.; Abrahamse, W. Values, identity and pro-environmental behaviour. Contemp. Soc. Sci. 2014, 9, 374–392. [Google Scholar] [CrossRef] [Green Version]
  51. Databank Overijssel. 2018. Available online: https://overijssel.databank.nl/?cat_open_code=c755&presel_code=lp_eco6 (accessed on 21 November 2019).
  52. Cijfers over Zwolle. 2018. Available online: https://www.zwolle.nl/cijfers (accessed on 20 August 2021).
  53. Lauren, N.; Fielding, K.S.; Smith, L.; Louis, W.R. You did, so you can and you will: Self-efficacy as a mediator of spillover from easy to more difficult pro-environmental behaviour. J. Environ. Psychol. 2016, 48, 191–199. [Google Scholar] [CrossRef] [Green Version]
  54. White, K.M.; Smith, J.R.; Terry, D.J.; Greenslade, J.H.; McKimmie, B.M. Social influence in the theory of planned behaviour: The role of descriptive, injunctive, and in-group norms. Br. J. Soc. Psychol. 2009, 48, 135–158. [Google Scholar] [CrossRef] [Green Version]
  55. Castri, R.; Wemyss, D.; Cellina, F.; De Luca, V.; Frick, V.; Lobsiger-Kaegi, E.; Carabias, V. Triggering electricity-saving through smart meters: Play, learn and interact using gamification and social comparison. In Proceedings of the 1st ever Energy-Feedback Symposium—Teddinet 1st Energy-Feedback Symposium “Feedback in Energy Demand Reduction: Examining Evidence and Exploring Opportunities”, Edinburgh, UK, 4–5 July 2016. [Google Scholar]
  56. Porter, B.E.; Leeming, F.C.; Dwyer, W.O. Solid waste recovery: A review of behavioral programs to increase recycling. Environ. Behav. 1995, 27, 122–152. [Google Scholar] [CrossRef]
  57. Schultz, P.W.; Nolan, J.M.; Cialdini, R.B.; Goldstein, N.J.; Griskevicius, V. The constructive, destructive, and reconstructive power of social norms. Psychol. Sci. 2007, 18, 429–434. [Google Scholar] [CrossRef] [PubMed] [Green Version]
  58. Van der Werff, E.; Steg, L.; Keizer, K. Follow the signal: When past pro-environmental actions signal who you are. J. Environ. Psychol. 2014, 40, 273–282. [Google Scholar] [CrossRef]
  59. Ajzen, I. The directive influence of attitudes on behavior. In Psychology of Action; Gollwitzer, P.M., Bargh, J.A., Eds.; Guildford Press: New York, NY, USA, 1996; pp. 385–403. [Google Scholar]
Figure 1. A translated example of the feedback provided via the mobile application.
Sustainability 13 09610 g001
Figure 2. Translated item to measure how full the residual waste bag is.
Sustainability 13 09610 g002
Figure 3. Mean number of waste bags at the pre- and post-measurements per intervention group including the 95% confidence interval.
Sustainability 13 09610 g003
Figure 4. Means of dependent variables over the two measurements per intervention group including the 95% confidence interval: (a) Means of litres of residual waste; (b) Means of reducing waste; (c) Means of reusing; (d) Means of separating waste.
Sustainability 13 09610 g004
Figure 5. Means of process variables over the two measurements per intervention group including the 95% confidence interval: (a) Means of procedural knowledge; (b) Means of environmental self-identity; (c) Means of descriptive norms; (d) Means of self-efficacy.
Sustainability 13 09610 g005aSustainability 13 09610 g005b
Table 1. Overview of the socio-demographic characteristics of the sample.
t0t1
Gender
Male127 (55%)98 (56%)
Female103 (45%)78 (44%)
Age
Range23–81 22–86
Mean (SD)50 (15)54 (16)
Household size
Range1–6 1–6
Mean (SD)2.6 (1.2)2.4 (1.1)
Gross yearly household income
<10,000 euros6 (3%)
10,000–20,00011 (5%)
20,000–30,00034 (14%)
30,000–40,00053 (22%)
40,000–50,00036 (15%)
>50,000 euros48 (20%)
Prefer not to say42 (21%)
Education level
Primary or first years of high school21 (9%)
Vocational education or more than 4 years of high school 89 (38%)
Bachelor degree97 (41%)
Master degree24 (10%)
Table 2. The number of participants per condition.
ConditionInstalled the APP
(n = 723)
Filled out Questionnaire at t0
(n = 230)
Filled out Questionnaire at t1
(n = 176)
Control condition1885842
Social comparison feedback1915757
Goal comparison feedback1555029
Historical comparison feedback1896548
Table 3. Results for the number of waste bags produced over time, per condition and its interaction.
Fixed EffectsWaste Bags
Est.SEt
Intercept43.752.0820.99 ***
Time −11.501.95−5.90 ***
Goal comparison feedback−12.453.07−4.06 ***
Historical comparison feedback−10.052.91−3.45 **
Social comparison feedback−13.332.90−4.59 ***
Time * Goal comparison feedback0.562.870.20
Time * Historical comparison feedback0.672.710.25
Time * Social comparison feedback0.152.710.05
Between individual variance445.2633.55
Measurement variance332.9817.81
Note. Est. = estimate; SE = standard error; * p < 0.05, ** p < 0.01, *** p < 0.001.
Table 4. Results for self-reported residual waste and minimizing waste over time, per condition and its interaction.
Fixed EffectsResidual WasteReducing WasteReusingSeparating Waste
Est.SEtEst.SEtEst.SEtEst.SEt
Intercept1475.18136.2310.83 ***3.710.1721.87 ***3.770.438.86 ***6.210.1062.52 ***
Time −161.37204.18−0.790.520.192.69 **0.350.281.250.180.111.64
Feedback Type
Goal comparison −485.57201.20−2.41 *0.410.251.64−0.190.65−0.290.060.150.40
Historical comparison−341.43188.15−1.820.180.230.790.740.581.270.100.140.76
Social comparison−449.23193.42−2.32 *0.270.241.120.510.600.860.090.140.68
Interaction
Time * Goal comparison−184.14312.69−0.59−0.140.31−0.440.430.440.980.020.180.10
Time * Historical comparison86.40279.380.31−0.010.26−0.05−0.210.38−0.54−0.090.15−0.59
Time * Social comparison−184.20278.16−0.660.050.260.19−0.150.38−0.390.020.150.13
Between individual variance167146.92110183.54 1.390.16 1.090.27 0.480.06
Measurement variance932377.89121834.31 0.530.09 1.420.23 0.180.03
Note. Est. = estimate; SE = standard error; * p < 0.05, ** p < 0.01, *** p < 0.001.
Table 5. Results for process variables over time, per condition and its interaction.
Fixed EffectsProcedural KnowledgeEnvironmental
Self-Identity
Descriptive Social NormsSelf-Efficacy
Est.SEtEst.SEtEst.SEtEst.SEt
Intercept5.220.1830.16 *5.110.1534.52 *4.150.1040.38 *4.870.1728.37 *
Time−0.100.23−0.440.190.190.98−0.200.14−1.41−0.040.19−0.20
Feedback Type
Goal comparison−0.390.26−1.540.140.220.64−0.150.15−0.98−0.380.25−1.51
Historical comparison−0.200.24−0.820.090.200.460.140.141.02−0.170.24−0.71
Social comparison−0.280.24−1.140.140.210.67−0.020.15−0.11−0.090.24−0.37
Interaction
Time * Goal comparison0.480.361.32.090.300.290.380.221.730.240.320.76
Time * Historical comparison0.390.311.25−0.180.26−0.680.230.191.220.000.260.01
Time * Social comparison0.440.311.250.180.260.700.180.190.950.150.270.58
Between individual variance0.920.19 0.680.14 0.280.07 1.380.17
Measurement variance0.910.15 0.660.11 0.360.06 0.540.09
Note. Est. = estimate; SE = standard error; * p < 0.001.
Table 6. Correlations between the process variables and the indicators of waste at t0.
ESISNSEWBRWReduceReuseSeparate
PK0.27 ***0.15 *0.37 ***0.11−0.080.24 ***0.130.11
ESI 0.20 **0.040.07−0.14 *0.41 ***0.26 ***0.26 ***
SN 0.09−0.040.110.19 **0.050.14 *
SE 0.100.120.01−0.02−0.11
WB 0.24 ***−0.14 *−0.09−0.19 **
RW −0.13−0.12−0.24 ***
Reduce 0.46 ***0.39 ***
Reuse 0.27 ***
Note. PK = procedural knowledge, ESI = environmental self-identity, SN = descriptive social norms. SE = self-efficacy, WB = waste bags, RW = residual waste, Reduce = reducing waste, Reuse = reusing products, Separate = separating waste; *** p < 0.001, ** p < 0.01, * p < 0.05.
Table 7. Correlations between the process variables and the indicators of waste at t1.
ESISNSEWBRWReduceReuseSeparate
PK0.48 ***0.150.49 ***0.030.020.29 ***0.32 ***0.11
ESI 0.16 *0.26 **−0.09−0.110.50 ***0.35 ***0.22 **
SN 0.11−0.010.060.19 *0.20 **0.08
SE 0.060.080.18 *0.06−0.02
WB 0.36 ***−0.19 *−0.10−0.08
RW −0.11−0.09−0.08
Reduce 0.46 ***0.34 ***
Reuse 0.09
Note. PK = procedural knowledge, ESI = environmental self-identity, SN = descriptive social norms. GE = goal-efficacy, WB = waste bags, RW = residual waste, Reduce = reducing waste, Reuse = reusing products, Separate = separating waste; *** p < 0.001, ** p < 0.01, * p < 0.05.
Publisher’s Note: MDPI stays neutral with regard to jurisdictional claims in published maps and institutional affiliations.

