Abstract
In this paper, greenhouse gas (GHG) emissions derived from airport surface access of outbound German tourists travelling to the Canary Islands have been estimated. It is argued that carbon footprint estimations in tourism must be improved to incorporate the transport to the airports within the country of origin. To do so, statistical data from the Tourism Expenditure Survey of the Canary Islands have been used. In particular, the postcodes of a large sample of German tourists visiting the archipelago from 2012 to 2014 are used to identify their residence and the distances travelled to their chosen airport. The findings of the paper contribute to the literature on tourism carbon footprints, including an estimate of the share of airport surface access emissions in a typical outbound sun and beach holiday trip. Airport ground access accounted for 8.17% of transport-related emissions. These results have implications for urban planners, transport firms, and tourism management.
1. Introduction
There is wide concern about the emissions associated with tourism and, consequently, increasing interest in reducing the carbon footprint derived from tourism activities [1], which account for 8% of global emissions [2]. These concerns are confirmed in the report released by UNWTO and the International Transport Forum [3], which puts the focus on transport related to tourism.
A carbon footprint is “a measure of the exclusive total amount of carbon dioxide emissions that is directly and indirectly caused by an activity or is accumulated over the life stages of a product” [4] (p. 4). Therefore, a tourism carbon footprint refers to the measurement of the emissions associated with a tourism activity [5,6]. Reflecting the increasing interest in this topic, a search in the Scopus database shows that the term “carbon footprint” first appeared in 2002 with just one item and has increased exponentially over the years, and in 2018, 1857 items were found. The analysis of emissions produced by tourism is a part of the literature on tourism and climate change, which, in fact, has evolved into a knowledge domain [7].
The relevance of carbon footprint comes from the increasing awareness of policymakers regarding responsible consumption resulting in the growing tendency toward environmentally friendly holidays [8,9]. This is because tourism activities make extensive use of resources (transport, lighting, air-conditioning, heating, etc.) resulting in tourism destinations producing higher emissions than other areas [10].
Calculations of tourism carbon footprint have become crucial, as they can help quantify and determine the causes of emissions [9,11], and, thus, they can support environmental policymaking. Currently, such calculations follow different approaches, particularly the production accounting principle (PAP) or the consumption accounting principle (CAP) [12,13]. However, there is a need to refine carbon footprint calculations to improve the accuracy of these measurements [14]. Ground access has also been a topic of interest from the perspective of airport management and sustainability [15]. However, in the case of leisure travel and tourism trips, it has been a somewhat neglected issue.
Land transportation of tourists to their destinations contributes 32% of the emissions associated with tourism [16]. Some studies have centred on rental cars instead of private motor vehicles [5,17]. One notable exception that did focus on analysing private vehicle emissions in tourism was based on estimations from the Tourism Satellite Account (TSA) and household consumption patterns in Australia [18]. Our research, by contrast, is focused on the emissions associated with surface access to airports as part of an outbound tourism trip (i.e., tourists’ journeys from their homes to the airports and vice versa). The issue of airport access has been analysed by Budd, Ison and Ryley [19], who observed that these trips depended heavily on private transport with the corresponding concerns regarding congestion and environmental impacts. Airport ground access has also been analysed from the point of view of transport mode choice [20,21]. Sustainability policies for airport access have been discussed [22], as well as estimations of the carbon dioxide emissions of ground access to Manchester Airport [23]. Finally, the environmental implications of transport modes and the advantages of accessing airports by public transport have also been addressed [24]. The contribution of this paper is to provide a tentative estimation of the distances travelled and the CO2 emissions in a representative case of airport access for holiday purposes. Specifically, the journeys of German tourists between their places of residence and the airports they use when travelling to the Canary Islands, the main European tourism region in terms of hotel nights [25].
From the total amount of 15,975,707 tourists in the Canary Islands in 2017, 3,124,233 (19.6%) were German and they contributed to 22.4% of tourism income in the islands [26]. German tourists constitute the second most important market in terms of arrivals. Concerning the islands in which they stay, 31.8% choose Gran Canaria, 28% stay in Fuerteventura, 24% stay in Tenerife, 10.9% stay in Lanzarote and 3.2% in La Palma [26]. According to the destination marketing organization of the Canary Islands [27], most German tourists arrive in the Canary Islands on a direct flight. Other figures for 2018 show that 75% of them used a package tour, they stayed an average of 10.7 days, 70% had previously visited the Islands, and the most common travel group was travelling as a couple (54%).
2. Carbon Footprint and Its Relation to Transportation, Tourism and Airports
As one of the main worldwide economic activities, tourism has the capacity to enhance the well-being of populations [28,29]. Indeed, it contributed 10.4% to global GDP including direct, indirect and induced impacts [30]. In terms of environmental impact, overall tourism activity contributes 8% to total global CO2 emissions [2], and of these global emissions up to 75% is estimated to be generated by transportation [16]. Tourism is generally an intensive activity in terms of resource use (e.g., transportation to long haul destinations, high consumption of resources in hotels, etc.). In fact, Koçac et al. [31] found, for a panel including the main destination countries, that tourism arrivals have an increasing effect on national CO2 emissions because of their dependence on transportation. This issue has awakened interest among consumers, transport operators and destination managers and is changing the way tourists travel and plan their holidays, as well as the way destinations are managed and promoted.
GHG emissions are at the core of the causes of climate change and, therefore, there is increasing interest in reducing these emissions. Several methods have been used to analyse the carbon footprint related to transport [32]. However, when we deal with tourism trips, there are two main approaches to account for tourism carbon footprint: The production accounting principle (PAP) and the consumption accounting principle (CAP). Whereas PAP considers a destination responsible for the emissions derived from local production within the geographical boundaries of a destination (regardless of whether they are consumed within the region or exported), CAP considers end users’ products and services consumed (regardless of whether they have been produced within the region or imported). In this regard, resulting from each of these mentioned principles, there are two main approaches to calculate tourism carbon footprints: Bottom-up analysis or top-down analysis [5], sometimes called expenditure-based or production-based, respectively [18]. Both approaches provide very useful knowledge about tourism carbon footprints and improve the tourism sector’s sustainability, as they help quantify the impact of an activity [11]. These two main approaches can be extended with two additional accounting approaches [33]. These additional approaches are the Kyoto Protocol Framework, very similar to the PAP, and the Tourism Satellite Account Protocol, which assigns emissions to the country where the tourism activities occur.
The PAP approach used for the study of carbon footprints considers a region responsible for the emissions derived from local production within its geographical boundaries [5]. This is the principle that underlies the Kyoto Protocol in order to reduce nations’ emissions. From the PAP point of view, importance is placed on the production of goods and services regardless of whether they are consumed within the region or exported. With regards to the tourism carbon footprint of a given tourism destination, the PAP measure considers emissions associated with domestic tourism (i.e., residents of a given tourism destination visiting that same tourism destination), inbound tourism (i.e., non-residents of a given tourism destination visiting that tourism destination) and transactions of outbound tourism that take place before departing (i.e., residents of a given tourism destination buying package tours in travel agencies to visit foreign tourism destinations). PAP does not take into consideration emissions related to the rest of activities associated with outbound tourism and imports. This top-down (or production-based) analysis allows the assessment of tourism as a sector within the wider economy [5].
Alternatively, the CAP places the responsibility of emissions on consumers’ consumption patterns without considering the origin of goods and services consumed [33]. In this sense, the tourism carbon footprint of a region using the CAP measure considers emissions associated with domestic tourism (i.e., residents of a given tourism destination visiting that tourism destination) and outbound tourism (i.e., residents of a given tourism destination visiting another tourism destination). Under the CAP measure, all emissions associated with inbound tourism that are considered imports are excluded. CAP provides detailed information on energy end-uses and the main drivers of emissions. Thus, CAP focuses on tourists’ behaviour patterns when they travel [11]. It considers emissions associated with expenditure in a country by foreign and domestic tourists, emissions from air travel by tourists and emissions by outbound residents within their own country prior to or following flights (e.g., internal transport, hotels, etc.). It excludes emissions of outbound flights and outbound tourists outside their country.
Regardless of the approach chosen, there is no universal and accepted method to be followed when calculating the tourism carbon footprint. Moreover, researchers are still refining proposals to improve this measure. For example, Cadarso et al. [14] identified the importance of the emissions associated with tourism investments and refine the calculation of the tourism carbon footprint by incorporating investment emissions. Consequently, there is an explicit call for improving the accuracy of the measurement of the emissions derived from tourism transport, excluding accommodation. As a result, the focus is placed in this study on a specific part of tourists’ trips, which has often been neglected in studies to date.
Most of tourism’s carbon footprint comes from transportation, and specifically from aircraft modes of transportation [34]. Indeed, 75% of tourism emissions are connected to means of transportation [16]. However, there has been much attention placed on the fact that about 40% of total tourism emissions comes from air transportation yet neglects the fact that 32% of this amount comes from car modes of transport. Indeed, one of the main recommendations in order to mitigate emissions suggests a shift from both aircrafts and cars to other modes of transportation [16]. However, in the case of remote islands, it is difficult from an eco-efficiency point of view to reduce impacts concerning the use of aeroplanes. The main reason is that, geographically speaking, potential markets need to access the destination using air transport, and it would be unrealistic to switch to other transportation modes. In addition, tourists also generate CO2 emissions when travelling to the airport, thus strategies can be implemented to try to reduce these emissions. Therefore, the focus of this study is on the estimation of the carbon footprint generated by different means of transport to arrive at the airports of origin.
Fuel consumption by land transport used by tourists during their trips (at destination and origin) produces CO2 emissions. In fact, it generates 32% of total transportation CO2 emissions according to UNWTO, UNEP and WMO [16], while all kinds of transportation generate 23% of total CO2 emissions [3]. The focus on the calculation of the carbon footprint derived from the use of land transportation has often been placed on rental cars used within tourism destinations [5,17], and the access to destinations by car [35]. Nevertheless, little attention has been given to tourism-related domestic mobility to airports in intermodal land–air traffic, as we show in this paper. In this sense, Dwyer et al. [18] calculated the GHG emissions of motor vehicles, other than rental cars, with estimations from the TSA derived from household consumption. Their analysis considered emissions of Australian travel agencies and tour operators, accommodation, restaurants, private car use, transport to the destination and other connected industries to calculate the tourism carbon footprint of Australia from a PAP and a CAP point of view. They considered emissions from tourism-related private motor vehicle use to be 20% of the production-based total tourism carbon footprint, but in this case, the private car was the main mode of tourist transport.
To develop a more accurate measure of tourism GHG emissions from private motor vehicle use for tourism purposes, there is still a need for estimations regarding the use of these vehicles in tourists’ places of residence. Specifically, the impact of tourists’ journeys from their homes to the airports should be analysed. This study argues that this specific part of people’s holidays also contributes to the emissions of the tourism industry and, therefore, its assessment is necessary in order to increase the accuracy of the measurement of tourism carbon footprints.
In the case of airports, there are a number of studies on ground access and/or sustainability, but none are related specifically to tourism. In the systematic literature review on airport sustainability conducted by Greer et al. [36], after analysing 108 contributions from 2009 to 2019, they showed that the topic of ground access has not been a central concern in studies on airport sustainability. However, there are specific contributions on ground access to airports that have been reviewed by Pasha and Hickman [37], who concluded that there is a need for research on passengers’ mode choice to improve sustainable transport planning. There are also several papers that include surveys on airport access aimed at developing multinomial models to understand passenger choices. The contribution of Pasha [21] provides a model of transport mode choice for Brisbane airport. Moreover, interest in access to airports has been recognized within transport studies, and even the National Academies of Sciences, Engineering and Medicine of the United States has published a report on worldwide access to airports [38] that provides a global review of the topic.
The methodological challenges related to measuring airport ground access and footprints have also been addressed by several papers. Postorino and Mantecchini [39] consider that access to the airport must be considered as a piece in a larger puzzle. In fact, the methodology proposed by these authors is focused on the carbon footprint of a transport node, the airport, considering ground access, terminal and landing and take-off operations. Other authors, such as Bud et al. [40], Ryley et al. [22] or Miyoshi and Mason [23] provide very insightful methodological and empirical approaches to airport access and sustainability. This literature mainly focuses on a production accounting approach, based on the airport. Nevertheless, there is still a gap in the literature related to tourist mobility and airport ground access following a consumer accounting perspective, where the research focus is on the tourist throughout the travel cycle, beyond just a transport node, like an airport. The literature shows that aeroplane emissions seem to have taken precedence over those derived from ground access, but there is an opportunity for managing tourism emissions by better measuring, managing and planning of ground access to airports [40].
3. Materials and Methods
The method used tries to estimate the CO2 emissions related to the journeys to the airports and during the flight. Therefore, we follow a consumption accounting principle, as we focus on the consumer during the trip within the origin country when accessing the airport and during the flight to the tourism destination. We consider only the transport-related footprint and no other items such as meals during the trip, etc., and we consider indirect impacts [41] along each mode of transport value chain obtained from a reputed database from the UK Department of Business, Energy and Industrial Strategy and the UK Department for Environment, Food and Rural Affairs [42]. The impacts of ground access to airports are included within the local activity in the departure country by Sun et al. [33] and therefore should be taken into consideration by any of the four accounting approaches used.
The data for this research were obtained from the Tourism Expenditure Survey (TES) that is conducted by the Institute for Statistics of the Canary Islands (ISTAC). The main purpose of the TES is to identify expenditure and consumption patterns of tourists visiting the Canary Islands as well as relevant information concerning their socio-demographic characteristics, the characteristics of the trip and aspects concerning their satisfaction with the holiday experience. This survey obtains statistical data following UNWTO recommendations [43] so that it uses non-probability stratified sampling of flights previously selected to be representative. It is conducted at all international airports of the Canary Islands (the airports of the islands of Lanzarote, Fuerteventura, Gran Canaria, La Palma and the north and south airports of Tenerife) with tourists aged over 16 years old. In the survey, tourists are asked for their home ZIP code, while their flight has been previously selected. The questionnaire is completed on the departure of their flight from the Canary Islands and information about all passengers on the flight is registered. Therefore, it is possible to geolocate tourists’ residence. In the paper, we analyse the behaviour of air passengers who live in Germany and flew directly from Germany to the Canary Islands. Throughout the paper, they are called German tourists, although they do not necessarily need to have German citizenship; they are residents of Germany travelling to the Canary Islands on a direct flight. Only German tourist respondents surveyed between 2012 and 2014 were used to carry out the research (see Table 1), since there were no more available data including ZIP codes when the study was carried out, but this extensive database can provide valuable insights on the topic. Respondents living in Bremen, Mecklenburg-Vorpommern, Saarland and Thüringen Länder have been grouped into Other Länder, as the sample of tourists from these Länder surveyed was low.

Table 1.
German tourists visiting Canary Islands between 2012 and 2014 by NUTS1.
To estimate airport access distances in Germany, we used information on the ZIP codes of places of residence and the geolocation of airports as in the study conducted by Miyoshi and Mason [23]. All districts of the Nomenclature of Territorial Units for Statistics, NUTS (European Commission, 2003), and German airports selected by ISTAC due to their connections with the Canary Islands were geo-located (see Table 2). In this research, we have used the division of NUTS established in 2013, as it is the closest version to the period analysed (2012–2014). In the case of Germany, NUTS1 corresponds to 16 Länder (German federal states), NUTS2 has 39 Regierungsbezirke (German regions) and NUTS3 refers to 401 districts or Landkreise. NUTS3 has been used, as this level of analysis provides more detailed and specific data about tourists’ places of residence. Specifically, the centroids of each district have been used as a proxy to establish tourists’ places of residence. The geo-location of tourists was performed by searching coordinates of each NUTS3 centroid using a geographic information system that uses information provided by the German Federal Agency for Cartography and Geodesy. ISTAC gathers data regarding the airport of origin of all respondents to the survey when travelling to the Canary Islands, which allows this information to be combined with respondents’ place of residence. Therefore, the Euclidean distances between the centroid of each district to 25 main German airports used to travel to the Canary Islands were calculated. In the next step, TES respondents’ ZIP codes were used and, thus, we could assign each tourist of the sample to their corresponding NUTS3. By doing so, an estimation of the total number of tourists living in each area of Germany was obtained. Thus, the average displacement travelled by each tourist from their residence to airports was calculated.
Table 2.
Main German airports with direct flights to the Canary Islands.
Next, the weighted average of the distances people residing in each district would have to travel from the centroid of their respective NUTS3 to the airport used to travel was obtained. This way, we obtained the average journeys made by tourists residing in each district when going to the airport to travel to the Canary Islands. The calculation was made as shown in the following equation, where is the average distance travelled for each resident of the 401 districts in Germany, represents the average distance from the centroid of each NUTS3i to the chosen airportj and represents the number of tourists travelling from each NUTS3i to airportj.
Later, we used the resulting data of all the 401 NUTS3 belonging to each of the 16 NUTS1 to obtain the weighted average distance travelled by tourists from each NUTS1 (federal state) to the airport. Therefore, we define where refers to the district codes belonging to each of the k Länder or federal state, following European Commission [44]; is the distance to the airport of each of the NUTS3 belonging to the Länder k, and are the number of tourists of the i NUTS3 district belonging to the k Länder. Then, the mean journey distances from each of the 16 NUTS1 federal states of Germany (15 federal states and a group of “others” including four federal states) to the airports, were calculated using the average distances between each of the 401 NUTS3 belonging to the 16 NUTS1 and the weight of each district in each federal state.
Note that straight-line Euclidean distances would be an underestimation of distances in origin countries. They have been used for setting the distance between the origin airport and the Canary Islands. However, with the aim of considering actual road distances instead of Euclidean distances, we have followed the recommendations based on previous studies [45] that state that multiplying Euclidean distances by 1.3 is a good approximation to estimate actual travel distances in route networks. Therefore, distances in Table 3 display an estimation of actual average distances travelled by German tourists when going to the airport to fly to the Canary Islands. Again, information regarding Bremen, Mecklenburg-Vorpommern, Saarland and Thüringen has been estimated and grouped into Other Länder, as it was not possible to use the data of the number of tourists from these places because of limitations in the sample. Moreover, this table also contains information regarding the average minimum distance that tourists from each NUTS1 would have to travel to arrive from their NUTS3 of residence to the nearest airport with relevant direct connections to the Canary Islands.
Table 3.
Average distance travelled by tourists from each Länder to the airport.
After this, an estimation of the carbon footprint from tourists’ journeys was obtained by multiplying the number of kilometres travelled per the average CO2 tons emitted by several means of transport per kilometre and passenger. When calculating the carbon footprint of car displacements, we decided to estimate that all tourists were travelling as couples, as this is the most frequent travel group visiting the Canary Islands and the most typical travel group for German tourists [26]. Despite private cars being important to analyse tourist journeys to airports when travelling, we have also considered that tourists use other means of transport.
BEIS and DEFRA [42] provide information regarding the carbon footprint of several means of transport, such as cars, buses, trains or planes, being one of the most-used references. We have used this information to estimate emissions of transport as Miyoshi and Mason [23] use for the case of trains. Regarding using similar assumptions for different German regions and airports, Paramati, Alam and Chen [46] point to tourists from countries with a similar degree of development having similar consumption behaviour and generating a similar carbon footprint, an assumption that may be even more accurate for tourists from the same country of origin. However, figures on mode split to access other European airports actually differ. For example, Ryley et al. [22] for Manchester Airport, or Postorino and Mantecchini [39] for Bologna obtain higher shares of private vehicles than those of German airports shown in Table 4. Moreover, in the case of Brisbane airport, Pasha [38] obtained a figure of 10.5% use of train and bus compared with 27% for German airports reported by the German Aerospace Center and the European Commission [47].
Following Ryley et al. [22], mobility behaviour when going to the airport differs widely from an average situation. Thus, specific data on airport access to German airports are needed. The mode split to access airports has been taken from a report of the German Aerospace Center and the European Commission [47]. Following this document, which provides information about German airports for 2008, 51.6% of airport travellers in Germany use car drop-off or taxi. Following the assumption by Miyoshi and Mason [23], these kinds of vehicles make round trips from and to the origin, so distances and emissions are doubled. From the same source (German Aerospace Center and European Commission), 19.2% use a one-way car trip (rental car or long-term parking), 10.1% use bus and 19.1% use rail. We have considered these percentages as a starting point to calculate the carbon footprint of tourist journeys to airports. Since our research considers 25 airports, there is no available set of information for each airport using a common source and methodology. Some sources provide useful information on access to some individual German airports [38], but we have not used them to avoid ad hoc assumptions.
Given the heterogeneity of airports, the figures of Aerospace Center and European Commission [48] may not be representative of the situation of several German airports. Particularly, the use of train may differ as, for example, Munich Airport reported a higher figure of passengers accessing by train, 38% [48]. Thus, to improve the accuracy of the estimations, we have included more credible assumptions on the mode split to each airport. Thus, we have checked the options of rail access provided by the airports’ webpages and Deutsche Bahn (the national railway company). Consequently, we have considered nine airports that do not have access by rail (Essen/Mülheim, Karlsruhe/Baden-Baden, Memmingen, Münster/Osnabrück, Frankfurt-Hann, Niederrhein, Padrborn/Lippstadt, Saarbrüken and Zweibrüken). The mode split to access these airports has been changed by removing the option of rail and adjusting the rest of the shares as shown in Table 4.
The information regarding CO2 grams emitted by transport means can be seen in Table 4. In the results, data are presented in tons instead of grams, as it is the most frequent measurement used to analyse the carbon footprint. We have included the CO2 emissions of long-haul flights as they are used to travel to the Canary Islands, allowing us to compare the emissions of the ground access to the airport with flight emissions. To obtain CO2 emissions of outbound flights, we use the straight distance between each German airport to the centroid of the Canary Islands as a starting point. However, planes rarely follow the shortest distance, as explained by Dobruszkes [49]. Thus, we include a new assumption supported by the European Environment Agency, EASA and Eurocontrol [50] that shows that actual CO2 emissions in European routes can be estimated increasing the great circle route emissions by 5.8% due to network flight inefficiencies, including route design, a figure that remains stable over the period of study. Thus, we have calculated the carbon emissions generated by applying this figure for excess emissions, which cause an increase of 11.3 g of CO2 per passenger/kilometre. In the case of electric cars, following BEIS and DEFRA [42], they do not generate direct carbon emissions, because they use electricity instead of fuel. However, electricity comes from renewable and fossil sources, and its production does actually generate a carbon footprint. As Helmers and Marx [51] point out, electric cars produce nearly 80% less CO2 emissions than an average car; we have used this information to calculate electric cars’ carbon footprint. For the sake of simplicity, we provide yearly results for the period 2012–2014, and we have only considered the departure trips. However, the figures for the return trip are considered identical to those offered below, while the estimated shares remain constant.
Table 4.
Grams of CO2 emitted by means of transport per passenger and kilometre, and percentage of use of each means of transport.
Table 4.
Grams of CO2 emitted by means of transport per passenger and kilometre, and percentage of use of each means of transport.
| Means of Transport | Grams of CO2 Emitted (pax/km) | Use in Airport Ground Access | Use in Airport Ground Access without Train |
|---|---|---|---|
| Long-haul flight | 195.0 | - | - |
| Excess emissions | 11.3 | - | - |
| Taxi or drop-off | 352.0 | 51.6% | 63.8% |
| Average car | 176.0 | 19.2% | 23.7% |
| Electric car | 35.2 | - | - |
| Bus | 104.0 | 10.1% | 12.5% |
| Domestic rail | 41.0 | 19.1% | 0.00% |
Source: Percentages of excess emissions obtained from European Environment Agency, EASA and Eurocontrol [50], modal split from German Aerospace Center and the European Commission [47] and CO2 emissions from BEIS and DEFRA [42].
In order to compare the current carbon footprint generated by tourists when going to the airport to travel with other possible scenarios, the present study attempts to understand to what extent tourists’ behaviour could reduce or increase the carbon footprint generated. To do so, this study proposes analysing the carbon footprint generated under different scenarios: All tourists use fuel cars to go to airports; all tourists use electric cars; all tourists use public transportation to go to the airport; all tourists travelled from the nearest airport to their residences with direct flights to the Canary Islands; and carbon footprint is reduced by 55%. This last scenario is justified because The European Green Deal proposed by the European Commission attempts to achieve this in 2030 [52]. Therefore, it is interesting to analyse how tourist mobility patterns should change in order to achieve this reduction in airport ground access. We have only considered how electric car use should be promoted as it generates the lowest carbon footprint per passenger (see Table 4). The European Green Deal also attempts to restrict the use of fuel cars by 2050 [53], which justifies the second scenario. In addition, the other scenarios proposed will serve to justify the practical implications derived from this study.
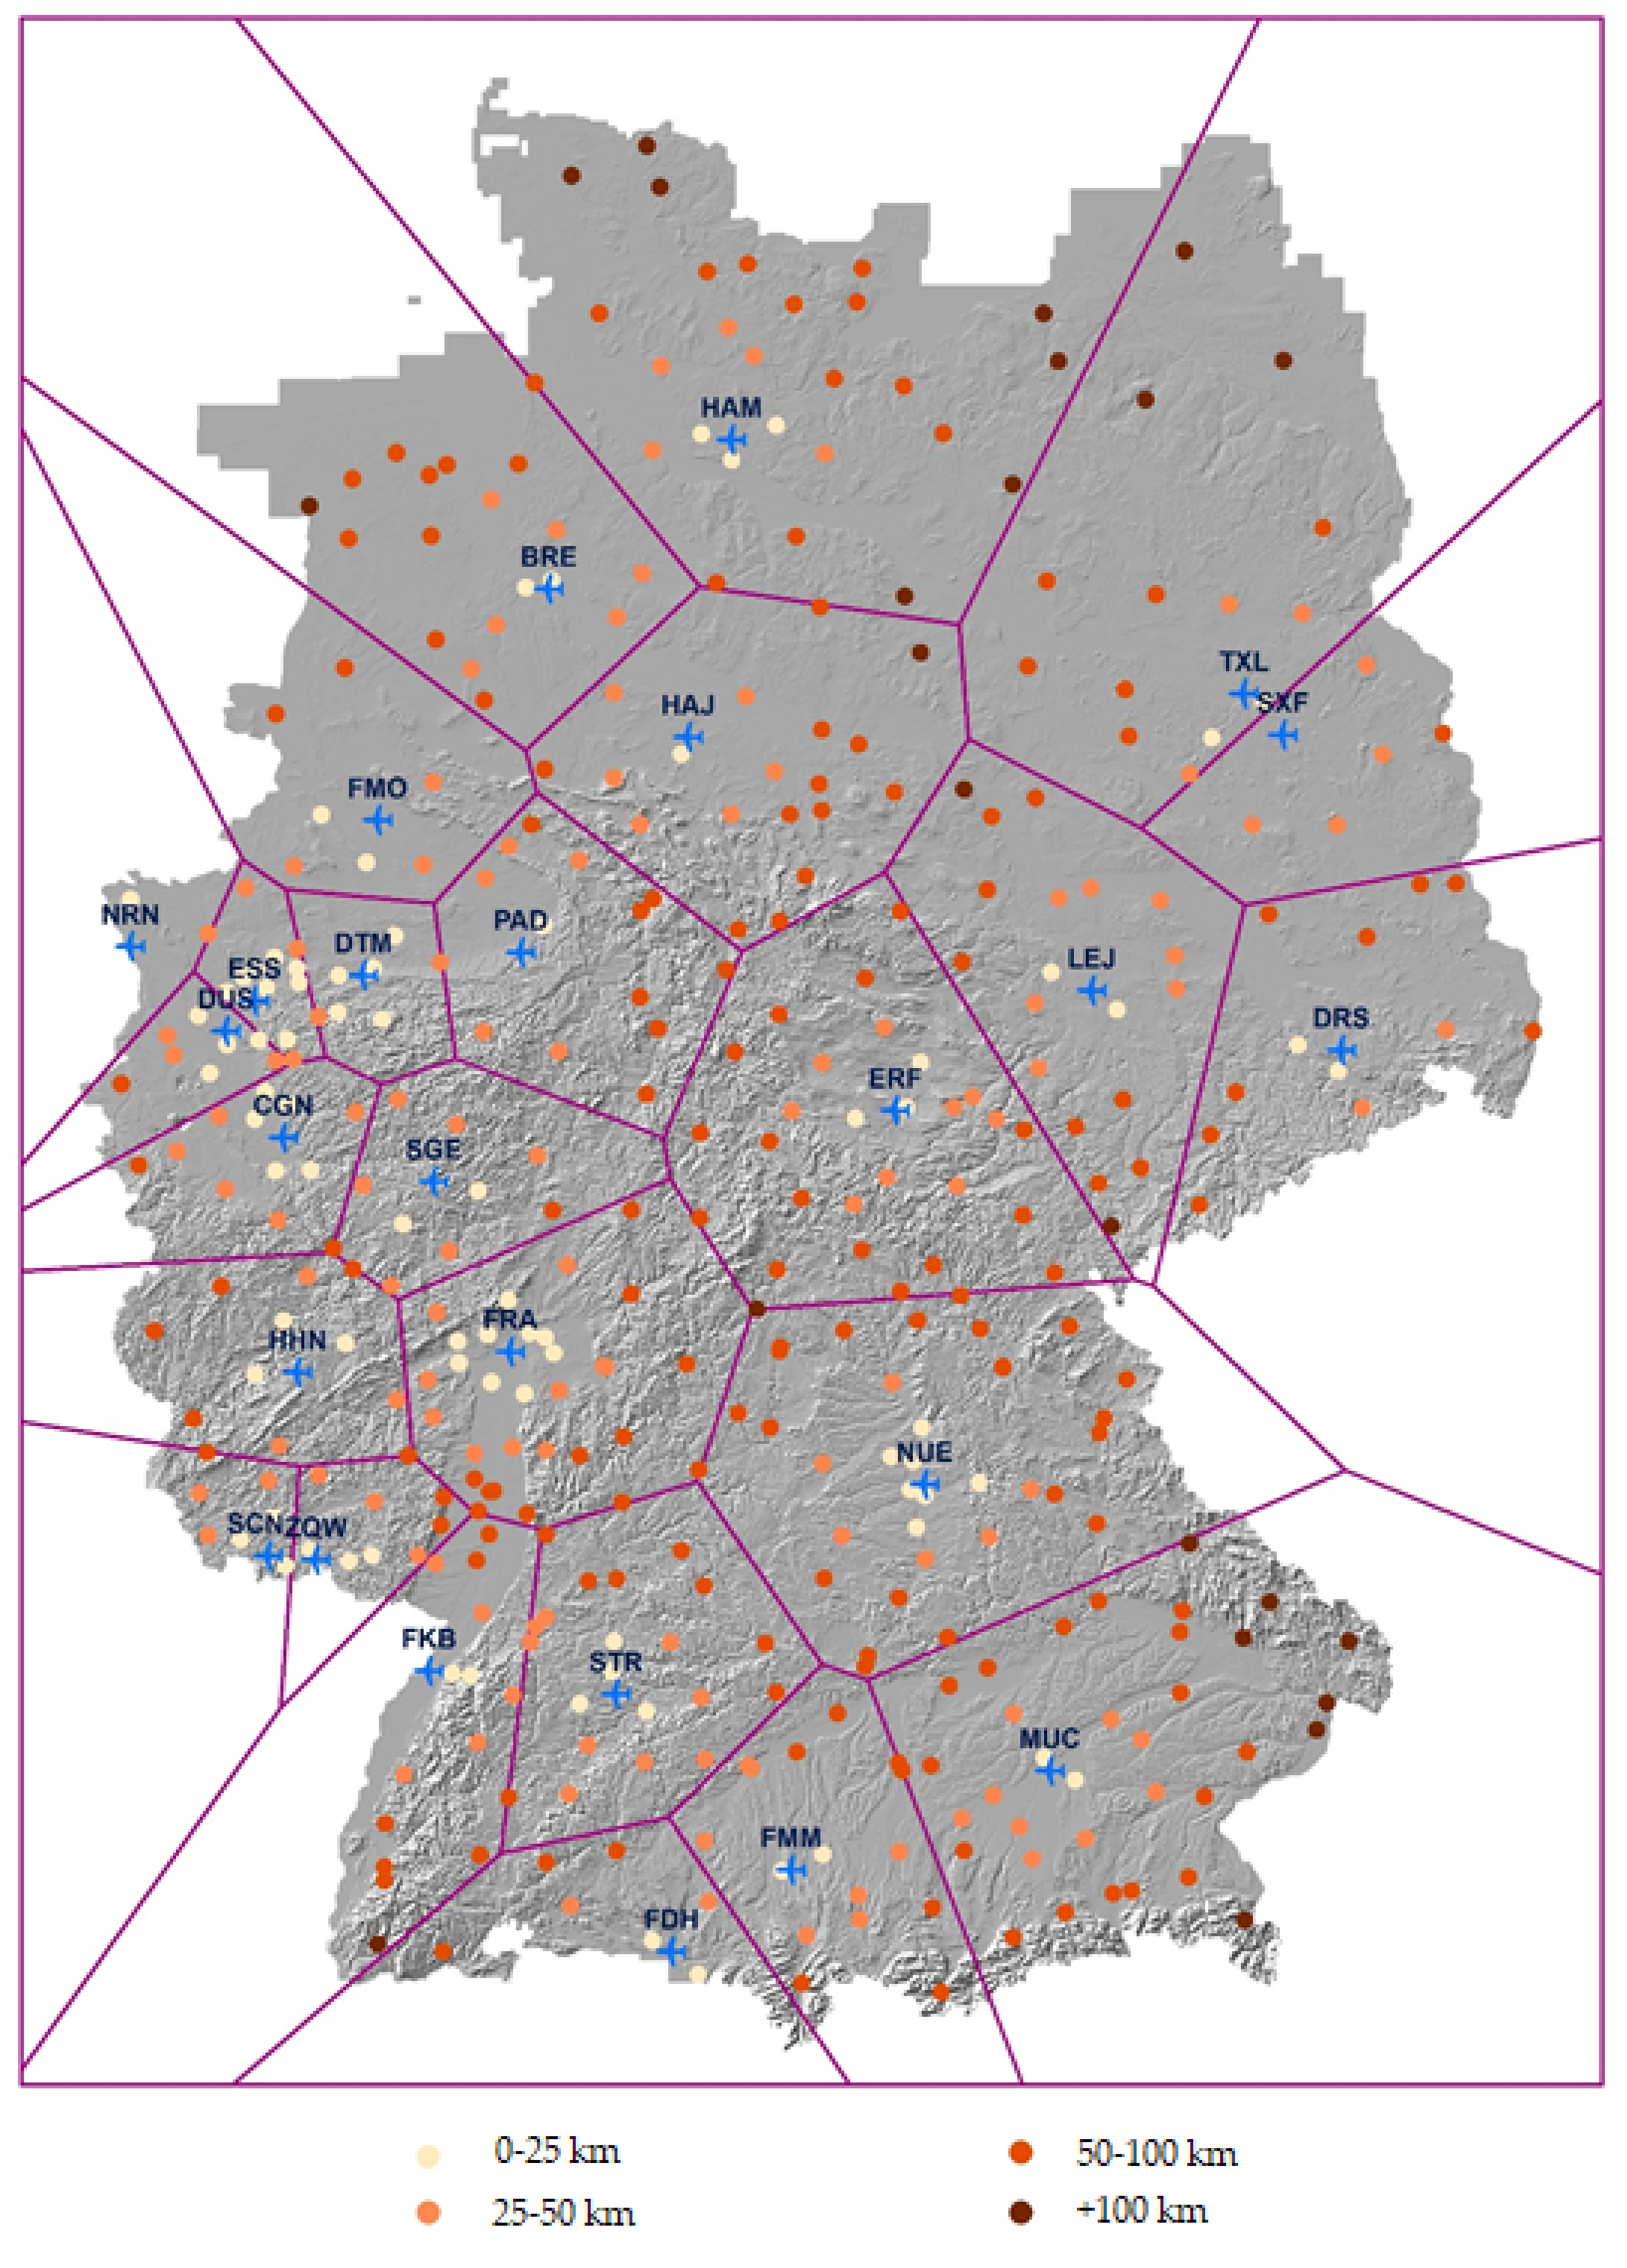
To establish the nearest airport to each NUTS3, the areas of influence of each airport were calculated using Thiessen polygons [53]. In Figure 1, land and maritime borders of Germany have been represented, indicating the geo-located airports and their corresponding areas of influence. Each district has been coloured on the map depending on the distance from their respective centroids to the nearest airport of reference with a scale of four intervals from light “0–25 km distance” to dark “more than 100 km distance”.
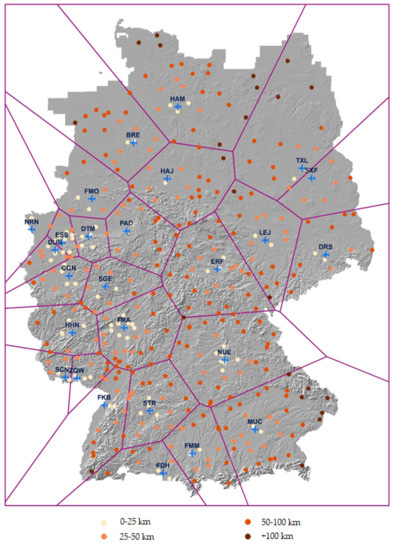
Figure 1.
Image of geographical boundaries of Germany, including airport locations with their areas of influence and location of coloured NUTS3 according to the distance from their centroid to the nearest airport.
4. Results
Table 5 shows the results of the tourism carbon footprint airport surface access of German tourists travelling to the Canary Islands. In addition, Table 6 shows the carbon footprints of the flights of German tourists going to the Canary Islands. Table 7 shows the total carbon footprints generated by German tourists when travelling to the Canary Islands, and it also provides information regarding the impact of each type of journey on the carbon footprint. All the calculations have been made considering a one-way straight-line trip, so the carbon footprint generated by German tourists’ surface distances would be doubled if we consider that they also travel back to their residences from the airport when returning from the Canary Islands.
Table 5.
Carbon footprint of German tourists’ ground access to the airport when travelling to the Canary Islands by Länder between 2012 and 2014.
Table 6.
Carbon footprint of direct flights of German tourists to the Canary Islands by Länder between 2012 and 2014.
Table 7.
Total carbon footprint (journey to airport and flight) generated by the trips of German tourists to the Canary Islands by Länder. Yearly average 2012–2014.
From the information displayed in Table 5, we can identify Berlin as the German Länder where the tourists travel the shortest average distance when going to the airport to travel to the Canary Islands (118 km). On the other hand, tourists residing in Bayern travel the longest distances to the airport (447 km). On average, the results highlight that German tourists tend to travel an average of 258 kilometres from their residences to the airport to travel to the Islands. However, despite tourists living in Berlin tending to travel shorter distances, they generate a larger carbon footprint than tourists living in Brandenburg, as Berlin sends more than double the number of tourists than this other Länder. In this sense, Berlin tourists generate 2.05% of the total carbon footprint generated by German tourists when travelling to the airport to visit the Canary Islands, while Brandenburg tourists generate 1.29% of the total emissions. Tourists living in Bayern not only travel on average the longest distance to the airport but are also the ones generating the largest carbon footprint (23.16% of domestic journeys’ emissions). Despite Nordrhein-Westfalen having the largest number of tourists (almost double that of Bayern), the carbon footprint generated by the access to airports of these tourists is lower than Bayern tourists, as they travel the second shortest distance to the airport of the whole group studied (135 km), generating 11.95% of total CO2 emissions.
In Table 6, we can observe that tourists from southern Länder travel a shorter distance to the Canary Islands than tourists from northern Länder, as the Canary Islands are located south of Germany. Concretely, Saarbrücken Airport is the closest one to the Canary Islands, while Erfurt Airport is the most distant one of the airports studied. In this table, the calculations of the carbon footprint indicate the number of tourists as the variable explaining the carbon footprint generated because those Länder sending larger numbers of tourists are the ones generating larger carbon footprints. The only exception is found in the cases of Rheinland-Pfalz and Other Länder that show very similar results. However, more tourists are travelling from Rheinland-Pfalz than Other Länder, despite the carbon footprint of tourists living in Rheinland-Pfalz being smaller because the airports used by these tourists tend to be nearer to the Canary Islands. Comparing these results with the ones obtained in Table 5, we can observe that both the number of tourists and the distance are relevant to explain the carbon footprint of tourists travelling to the airport, though the number of tourists is the key variable explaining the CO2 generation of outbound flights.
Finally, Table 7 allows us to compare the importance of the CO2 emissions of airport ground access versus air flights to visit the Canary Islands. Results show 91.83% of the carbon footprint generated by German tourists travelling to the Canary Islands is caused by flight fuel consumption, while 8.17% of this carbon footprint is generated by ground access to the airport. In the case of tourists from Bayern, the importance of the journeys to airports in the calculation of the carbon footprint is more important than for the rest of the Länder (13.09%) because tourists from this Länder travel the longest distances to the airport, as seen in Table 5. The opposite occurs with tourists living in Berlin, as only 3.64% of CO2 emissions are caused by their journeys to the airport. Regarding the total CO2 emissions generated by tourists travelling to the Canary Islands (adding the carbon footprint of ground access to airports and outbound flights), those Länder with the largest number of tourists are the ones generating the largest CO2 footprints as shown in Table 6. This can be explained due to the relevance of CO2 emissions of flights in comparison with the relevance of CO2 emissions of domestic journeys to airports.
The results of Table 7 point to German tourists generating 1,653,494.49 tons of CO2 when travelling to the Canary Islands every year from 2012 to 2014. This figure considers both ground access and flight. In the case of ground access, the weight of car drop-off and round trips is high, which helps explain that 8.17% of emissions were caused by the access to the airports, while the other 91.83% were related to the flight. These figures vary between German Länder and are particularly related to the average distance to the airports. In the case of Berlin, the weight of ground access is only 3.64%, while in Bayern, it reaches 13.09%.
Estimations of the carbon footprint of German tourists travelling to the Canary Islands are provided for diverse scenarios. First, we considered the possibility of analysing the changes in the carbon footprint generated if all tourists travelled alone (not in a couple as was calculated before) using an average car. We also wanted to study the effect on the carbon footprint if all tourists travelled using average cars at their maximum capacity (five passengers). We then proposed the same assumption but wondered what would happen if the cars used were electric ones. We also considered analysing the effect of travelling only using public bus and rail transportation. Lastly, we studied how the carbon footprint generated would be affected if all tourists used the nearest airport to their residence (out of the 25 airports considered) to travel to the Canary Islands. The results of these scenarios can be seen below, in Table 8. In this table, we display the effect of each scenario on the modification of CO2 generation of the airport access, the flight to the Canary Islands and the total effect on CO2 emissions.
Table 8.
Diverse scenarios for the estimation of the carbon footprint generated by the access of German tourists to the Canary Islands. Yearly average 2012–2014.
Results of Table 8 show that total CO2 emissions of domestic journeys would only increase in a scenario considering that all tourists were travelling alone in an average car to the airport (an increase of 4.1% in total CO2 emissions). Moreover, the carbon footprint of domestic journeys would also increase in this case by 50.6%. Curiously, if all German tourists to the Canary Islands used completely occupied average cars, they would generate the same carbon footprint as the scenario considering that all tourists were travelling alone to the airport using electric cars. The reason for this is that Helmers and Marx [52] state that electric cars produce nearly 80% fewer CO2 emissions than average cars or, in other words, than average cars shared by five passengers. In both cases, CO2 emissions would be reduced by 69.9% in the case of domestic journeys and the total carbon footprint would be lowered by 5.7%. The best scenario appears when considering that all tourists were using electric cars at maximum capacity (five passengers), as the carbon footprint generated would be reduced by almost 94% in the case of domestic journeys and 7.7% in the case of the total CO2 emissions generated.
When comparing the effect of using public transportation, the figures show that promoting the use of rail transportation to travel to the airport is more effective if governments aim to reduce the carbon footprint generated, as the grams of CO2 generated by this transport is much lower than CO2 g emitted by a bus per passenger and kilometre. The use of the nearest airport to the place of residence, despite being an extreme scenario, is illustrative of the margin to reduce ground access emissions. This scenario would reduce emissions by 80%, while global emissions would be reduced by 5.9%. Surprisingly, this scenario increases the carbon footprint related to the flight, given that the current access patterns promote a higher use of airports that reduce flight distances. Table 8 also shows that reducing airport ground access CO2 emissions by 55% in 2030 as the European Union recommends [52] would imply a global reduction of 4.5% for travel CO2 emissions. To reach this figure, the use of bus, train and electric cars should be promoted, as the results in Table 8 show. It is worth noting that these data do not consider future changes in mobility pattern behaviour or technological improvements that would reduce fuel consumption. Moreover, if the 2050 goal of the European Union is achieved, all fuel cars would be banned, and ground access CO2 emissions could be reduced by nearly 80%.
5. Discussion and Conclusions
Emissions from the tourism activities are difficult to accurately estimate due to the wide range of activities that make up the tourism product as well as the need to incorporate CO2 emissions not previously considered [33], such as the use of private cars for tourism purposes [18]. Furthermore, emissions of journeys from tourists’ places of residence to airports have often been neglected in the tourism carbon footprint literature. However, in the case of German tourists travelling to the Canary Islands, the calculations made estimating these emissions indicate that from 2012 to 2014, German tourists generated yearly more than 135 million tons of CO2 due to their journeys to the airport to travel to the Islands. Calculations of tourism carbon footprints are important if the tourism industry aims to become more eco-efficient from an environmental point of view [54]. This is because different decisions by tourists concerning the way they travel could end up increasing the emissions associated with their holidays [55]. Consequently, the contributions of this paper are valuable for practitioners and policymakers as well as researchers on tourism and transportation.
Results show that tourists coming from certain Länder generate a much lower carbon footprint than others in their journeys to the airport. In this case, tourists from Brandenburg and Berlin generate a much lower impact than tourists living in other Länder. Results show that the average distance travelled to the airport of origin is a key factor explaining carbon footprint generation. However, tourists from Bayern, Niedersachsen, Nordrhein-Westfalen, Baden-Württember and Hessen produce a large carbon footprint. This information is useful for German policymakers and urban planners if they want to reduce the carbon footprint generated by their residents by changing the behaviour of different segments [41]. Indeed, as the number of people interested in travelling is unlikely to reduce since moving within European Union countries is relatively easy and frequent among its residents, managers should focus on implementing policies to increase the use of the nearest airport to travel abroad (reduces carbon footprint by 2.43%) or encourage the use of more eco-efficient means of transport (electric cars or rail transportation) among German residents.
Results show that governments should encourage the use of public transportation to reduce carbon footprints generated by airport ground access related to tourism. In fact, there has been significant international concern in recent decades regarding public transport access to airports [38]. Our study shows that the European Union’s aim to reduce the use of fossil fuel cars in the following years [52] could have a great positive effect on the reduction of CO2 emissions. The results of this research can be also used by public administrations to create or increase private car parking taxes at airports to promote higher car sharing rates for airport ground access and the use of other transport means. It can also serve to promote the use of nearby airports to travel from by increasing highway tolls and the creation of campaigns aimed to increase population awareness regarding the impact of car displacements to airports in increasing carbon emissions.
There is a relevant body of literature on ground access to airports, focusing on the airport and mainly following a production accounting principle. However, this study focuses on airport surface access of a specific group of travellers (tourists), considering most airports of a relevant country (twenty-five German airports), including flight CO2 emissions to a relevant medium haul tourist destination (the Canary Islands) and following a consumer accounting principle (focusing on the demand side). The results obtained show that 8.17% of emissions are related to ground access. This figure contrasts with those obtained in other estimations focusing on airports. Postorino and Mantecchini [22] estimated for Bologna airport in 2012 that airport access accounted for 41.4% of the carbon footprint, while 49.3% was related to take-off and landing of planes, and 9.3% was related to ground support equipment. Despite this being an interesting reference for our paper, its focus is on transport functions related to a specific airport. In the case of Budd et al. [40] or Ryley et al. [22], the focus was on clustering passenger attitudes towards sustainable ground access to airports, but not on making an estimation of emissions nor on considering the trip to the destination.
Some limitations of our study could be considered for future research. Several assumptions can affect the results, particularly at the Länder scale of analysis. Specifically, this study considers that all tourists travelled from the centroid of their NUTS3 to the airport instead of their actual residence, and we used data regarding the straight-line distances multiplied by a factor of 1.3 separating airports and centroids instead of data of the real distances travelled by tourists. Despite this being an approximate figure that has been widely used [45], the distances travelled to access airports could be improved. The mode split for airport access was mainly taken from a report of the German Aerospace Centre and the European Commission [47] that provided information for German airport access in 2008, but results could be improved by obtaining detailed information for each airport. To consider the effect of train access, we divided German airports into two categories, those with rail connections and those without, a strong assumption that does not consider a gradation of situations. In addition, the estimations depend on several assumptions on the emissions produced by each transport mode, the occupancy of vehicles, etc. Moreover, we only considered the journeys to airports made by German tourists flying directly from Germany to the Canary Islands. Despite German tourists tending to fly directly from their country to the Canary Islands, some of them use foreign airports with direct flights or they can, for example, travel from Germany to Madrid or Barcelona, as there are good connections from these cities to the Canary Islands.
The current paper analyses the carbon footprint of airport ground access as part of an outbound tourism trip. Thereby, tourism sustainability research should produce more accurate models and estimations on airport access in the future, taking into consideration more detailed information on the means of transport used [22,23,39]. Thus, new avenues are open to researchers and practitioners to better understand and refine the calculations of the tourism carbon footprint across markets and destinations. Future research should focus on obtaining better data to more precisely calculate the carbon footprint of tourist transport. In addition, this paper has highlighted the need to consider not just the carbon footprint generated by air trips, but also the importance of other transport-related activities before and during the trip to the destination. Studying the tourism carbon footprint has several implications for the sustainable management of both destinations and outbound countries. Flight shame in origin countries, including Germany [56], emerges as an important issue to be addressed, particularly from the perspective of tourist destinations that are only accessible by air. Moreover, future research dealing with the carbon footprint generated by airport ground access should not only consider tourists’ increasing environmental awareness, but also the evolution of consumer behaviour patterns, the future of tourism after COVID-19 pandemic, the development of new energy sources or even the adoption of new transportation regulations and restrictions.
Author Contributions
Conceptualization, R.H.-M. and H.P.-Á.; methodology, R.H.-M. and H.P.-Á.; investigation, R.H.-M. and H.P.-Á.; resources, R.H.-M. and H.P.-Á.; data curation, R.H.-M. and H.P.-Á.; writing—original draft preparation, R.H.-M. and H.P.-Á.; writing—review and editing, R.H.-M. and H.P.-Á. All authors have read and agreed to the published version of the manuscript.
Funding
This paper was supported by the Government of the Canary Islands and the European Social Fund.
Institutional Review Board Statement
Ethical review and approval were waived for this study, due to the use of data gathered by a public institution that asks respondents for permission to use their data. Moreover, ISTAC only gives access to the microdata to third parties after filtering and aggregating data to ensure that no particular individuals can be identified.
Informed Consent Statement
Informed consent was obtained from all subjects involved in the study.
Data Availability Statement
Public microdata from the survey of tourism expenditure of the Canary Islands can be found in http://www.gobiernodecanarias.org/istac/ (accessed on 15 April 2019). However, data about airport of destination and place of residence have been obtained only for research purposes.
Acknowledgments
The authors thank the Institute of Statistics of the Canary Islands for the provision of unpublished data and technical support to the research.
Conflicts of Interest
The authors declare no conflict of interest.
References
- Sun, Y.-Y. Global Value Chains and National Tourism Carbon Competitiveness. J. Travel Res. 2018, 58, 808–823. [Google Scholar] [CrossRef]
- Lenzen, M.; Sun, Y.-Y.; Faturay, F.; Ting, Y.-P.; Geschke, A.; Malik, A. The Carbon Footprint of Global Tourism. Nat. Clim. Chang. 2018, 8, 522–528. [Google Scholar] [CrossRef]
- World Tourism Organization; International Transport Forum. Transport-Related CO2 Emissions of the Tourism Sector: Modelling Results; UNWTO: Madrid, Spain, 2019; ISBN 978-92-844-1666-0. [Google Scholar]
- Wiedmann, T.; Minx, J. A Definition of “Carbon Footprint”; Nova Science Publishers: New York, NY, USA, 2007; ISBN 978-1-60021-941-2. [Google Scholar]
- Sun, Y.-Y. A Framework to Account for the Tourism Carbon Footprint at Island Destinations. Tour. Manag. 2014, 45, 16–27. [Google Scholar] [CrossRef]
- Tang, M.; Ge, S. Accounting for Carbon Emissions Associated with Tourism-Related Consumption—Meiwei Tang, Shouzhong Ge, 2018. Tour. Econ. 2018, 24, 510–525. [Google Scholar] [CrossRef]
- Becken, S. A Review of Tourism and Climate Change as an Evolving Knowledge Domain. Tour. Manag. Perspect. 2013, 6, 53–62. [Google Scholar] [CrossRef]
- Mehmetoglu, M. Accurately Identifying and Comparing Sustainable Tourists, Nature-Based Tourists, and Ecotourists on the Basis of Their Environmental Concerns. Int. J. Hosp. Tour. Adm. 2010, 11, 171–199. [Google Scholar] [CrossRef]
- Sun, Y.-Y.; Pratt, S. The Economic, Carbon Emission, and Water Impacts of Chinese Visitors to Taiwan: Eco-Efficiency and Impact Evaluation. J. Travel Res. 2014, 53, 733–746. [Google Scholar] [CrossRef]
- Kelly, J.; Williams, P.W. Modelling Tourism Destination Energy Consumption and Greenhouse Gas Emissions: Whistler, BC, Canada. J. Sustain. Tour. 2007, 15, 67–90. [Google Scholar] [CrossRef]
- Becken, S.; Patterson, M. Measuring National Carbon Dioxide Emissions from Tourism as a Key Step Towards Achieving Sustainable Tourism. J. Sustain. Tour. 2006, 14, 323–338. [Google Scholar] [CrossRef]
- Turner, K.; Munday, M.; McGregor, P.; Swales, K. How Responsible Is a Region for Its Carbon Emissions? An Empirical General Equilibrium Analysis. Ecol. Econ. 2012, 76, 70–78. [Google Scholar] [CrossRef] [Green Version]
- Zhong, Y.; Shi, S.; Li, S.; Luo, F.; Luo, W.; Xiao, Q. Empirical Research on Construction of a Measurement Framework for Tourism Carbon Emission in China. Chin. J. Popul. Resour. Environ. 2015, 13, 240–249. [Google Scholar] [CrossRef]
- Cadarso, M.Á.; Gómez, N.; López, L.A.; Tobarra, M.Á. Calculating Tourism’s Carbon Footprint: Measuring the Impact of Investments. J. Clean. Prod. 2016, 111, 529–537. [Google Scholar] [CrossRef]
- National Academies of Sciences, Engineering, and Medicine. Airport Ground Access Mode Choice Models; The National Academies Press: Washington, DC, USA, 2008; p. 23106. ISBN 978-0-309-42034-1. [Google Scholar]
- World Tourism Organization; UNEP. Climate Change and Tourism: Responding to Global Challenges; World Tourism Organization: Madrid, Spain, 2008; ISBN 978-92-844-1234-1. [Google Scholar]
- Gössling, S.; Buckley, R. Carbon Labels in Tourism: Persuasive Communication? J. Clean. Prod. 2016, 111, 358–369. [Google Scholar] [CrossRef] [Green Version]
- Dwyer, L.; Forsyth, P.; Spurr, R.; Hoque, S. Estimating the Carbon Footprint of Australian Tourism. J. Sustain. Tour. 2010, 18, 355–376. [Google Scholar] [CrossRef]
- Budd, T.; Ison, S.; Ryley, T. Airport Surface Access in the UK: A Management Perspective. Res. Transp. Bus. Manag. 2011, 1, 109–117. [Google Scholar] [CrossRef] [Green Version]
- Akar, G. Ground Access to Airports, Case Study: Port Columbus International Airport. J. Air Transp. Manag. 2013, 30, 25–31. [Google Scholar] [CrossRef]
- Pasha, M.M.; Hickman, M.D.; Prato, C.G. Modeling Mode Choice of Air Passengers’ Ground Access to Brisbane Airport. Transp. Res. Rec. 2020, 2674, 756–767. [Google Scholar] [CrossRef]
- Ryley, T.; Elmirghani, J.; Budd, T.; Miyoshi, C.; Mason, K.; Moxon, R.; Ahmed, I.; Qazi, B.; Zanni, A. Sustainable Development and Airport Surface Access: The Role of Technological Innovation and Behavioral Change. Sustainability 2013, 5, 1617–1631. [Google Scholar] [CrossRef] [Green Version]
- Miyoshi, C.; Mason, K.J. The Damage Cost of Carbon Dioxide Emissions Produced by Passengers on Airport Surface Access: The Case of Manchester Airport. J. Transp. Geogr. 2013, 28, 137–143. [Google Scholar] [CrossRef]
- Budd, L.; Ison, S.; Budd, T. Improving the Environmental Performance of Airport Surface Access in the UK: The Role of Public Transport. Res. Transp. Econ. 2016, 59, 185–195. [Google Scholar] [CrossRef] [Green Version]
- European Commission; Statistical Office of the European Union. Eurostat Regional Yearbook: 2020 Edition; Publications Office: Luxembourg, 2020. [Google Scholar]
- ISTAC. Encuesta Sobre El Gasto Turístico; ISTAC: Las Palmas de Gran Canaria, Spain, 2018. [Google Scholar]
- Promotur Turismo de Canarias. Perfil Del Turista Alemán Que Visita Las Islas Canarias 2018; Turismo de Islas Canarias: Santa Cruz de Tenerife, Spain, 2019. [Google Scholar]
- Buhalis, D. Marketing the Competitive Destination of the Future. Tour. Manag. 2000, 21, 97–116. [Google Scholar] [CrossRef] [Green Version]
- Dwyer, L.; Kim, C. Destination Competitiveness: Determinants and Indicators. Curr. Issues Tour. 2003, 6, 369–414. [Google Scholar] [CrossRef]
- World Travel & Tourism Council. Benchmarking Research Trends 2019. How Does Travel & Tourism Compare to Other Sectors? World Travel & Tourism Council: London, UK, 2019. [Google Scholar]
- Koçak, E.; Ulucak, R.; Ulucak, Z.Ş. The Impact of Tourism Developments on CO2 Emissions: An Advanced Panel Data Estimation. Tour. Manag. Perspect. 2020, 33, 100611. [Google Scholar] [CrossRef]
- Auvinen, H.; Clausen, U.; Davydenko, I.; Diekmann, D.; Ehrler, V.; Lewis, A. Calculating Emissions along Supply Chains—Towards the Global Methodological Harmonisation. Res. Transp. Bus. Manag. 2014, 12, 41–46. [Google Scholar] [CrossRef]
- Sun, Y.-Y.; Lenzen, M.; Liu, B.-J. The National Tourism Carbon Emission Inventory: Its Importance, Applications and Allocation Frameworks. J. Sustain. Tour. 2019, 27, 360–379. [Google Scholar] [CrossRef]
- Peeters, P.; Schouten, F. Reducing the Ecological Footprint of Inbound Tourism and Transport to Amsterdam. J. Sustain. Tour. 2006, 14, 157–171. [Google Scholar] [CrossRef]
- UNWTO. International Tourism Highlights, 2020 ed.; UNWTO: Madrid, Spain, 2021; ISBN 978-92-844-2245-6. [Google Scholar]
- Greer, F.; Rakas, J.; Horvath, A. Airports and Environmental Sustainability: A Comprehensive Review. Environ. Res. Lett. 2020, 15, 103007. [Google Scholar] [CrossRef]
- Pasha, M.M.; Hickman, M. Airport Ground Accessibility: Review and Assessment. In Proceedings of the 38th Australasian Transport Research Forum (ATRF), Melbourne, VIC, Australia, 16–18 November 2016. [Google Scholar]
- National Academies of Sciences, Engineering, and Medicine. Ground Access to Major Airports by Public Transportation; ACRP report; Transportation Research Board: Washington, DC, USA, 2008; ISBN 978-0-309-09941-7. [Google Scholar]
- Postorino, M.N.; Mantecchini, L. A Transport Carbon Footprint Methodology to Assess Airport Carbon Emissions. J. Air Transp. Manag. 2014, 37, 76–86. [Google Scholar] [CrossRef]
- Budd, T.; Ryley, T.; Ison, S. Airport Ground Access and Private Car Use: A Segmentation Analysis. J. Transp. Geogr. 2014, 36, 106–115. [Google Scholar] [CrossRef] [Green Version]
- Wiedmann, T. Editorial: Carbon Footprint and Input–Output Analysis—An Introduction. Econ. Syst. Res. 2009, 21, 175–186. [Google Scholar] [CrossRef]
- BEIS; DEFRA. Greenhouse Gas Reporting: Conversion Factors 2019; Department for Environment, Food and Rural Affairs: London, UK, 2019.
- United Nations. International Recommendations for Tourism Statistics 2008; United Nations: New York, NY, USA, 2010; ISBN 978-92-1-161521-0. [Google Scholar]
- European Parliament. European Commission Regulation (EC) No 1059/2003 of the European Parliament and of the Council of 26 May 2003 on the Establishment of a Common Classification of Territorial Units for Statistics (NUTS). 2003. Available online: https://eur-lex.europa.eu/legal-content/EN/ALL/?uri=CELEX%3A32003R1059 (accessed on 11 August 2021).
- Boyacı, B.; Dang, T.H.; Letchford, A.N. Vehicle Routing on Road Networks: How Good Is Euclidean Approximation? Comput. Oper. Res. 2021, 129, 105197. [Google Scholar] [CrossRef]
- Paramati, S.R.; Alam, M.S.; Chen, C.-F. The Effects of Tourism on Economic Growth and CO2 Emissions: A Comparison between Developed and Developing Economies. J. Travel Res. 2017, 56, 712–724. [Google Scholar] [CrossRef] [Green Version]
- German Aerospace Center; European Commission. Airport Accessibility in Europe; German Aerospace Center: Köln, Germany, 2010. [Google Scholar]
- Munich Airport Annual Traffic Report 2017; Munich Airport: Munich, Germany, 2018.
- Dobruszkes, F. Why Do Planes Not Fly the Shortest Routes? A Review. Appl. Geogr. 2019, 109, 102033. [Google Scholar] [CrossRef] [Green Version]
- European Environmental Agency; EASA; Eurocontrol. European Aviation Environmental Report 2019; Publications Office: Luxembourg, 2019. [Google Scholar]
- Helmers, E.; Marx, P. Electric Cars: Technical Characteristics and Environmental Impacts. Environ. Sci. Eur. 2012, 24, 14. [Google Scholar] [CrossRef] [Green Version]
- European Commission. The European Green Deal. Communicaton from the Commission to the European Parliament, the European Council, the Council, the European Economic and Social Committee and the Committee of the Regions. 2019. Available online: https://www.eea.europa.eu/policy-documents/com-2019-640-final (accessed on 11 August 2021).
- Brassel, K.E.; Reif, D. A Procedure to Generate Thiessen Polygons. Geogr. Anal. 1979, 11, 289–303. [Google Scholar] [CrossRef]
- Sun, Y.-Y. Decomposition of Tourism Greenhouse Gas Emissions: Revealing the Dynamics between Tourism Economic Growth, Technological Efficiency, and Carbon Emissions. Tour. Manag. 2016, 55, 326–336. [Google Scholar] [CrossRef]
- Becken, S.; Simmons, D.G.; Frampton, C. Energy Use Associated with Different Travel Choices. Tour. Manag. 2003, 24, 267–277. [Google Scholar] [CrossRef]
- Gössling, S.; Humpe, A.; Bausch, T. Does ‘Flight Shame’ Affect Social Norms? Changing Perspectives on the Desirability of Air Travel in Germany. J. Clean. Prod. 2020, 266, 122015. [Google Scholar] [CrossRef]
Publisher’s Note: MDPI stays neutral with regard to jurisdictional claims in published maps and institutional affiliations. |
© 2021 by the authors. Licensee MDPI, Basel, Switzerland. This article is an open access article distributed under the terms and conditions of the Creative Commons Attribution (CC BY) license (https://creativecommons.org/licenses/by/4.0/).