Abstract
Public libraries provide equitable access to information for all citizens, and they play an important role in preserving and promoting culture, formal education and self-education, and enriching leisure time. Accordingly, there has been an increasing amount of research on the use factors and accessibility of public libraries, but research on the accessibility of public libraries in non-Western cities is insufficient compared to the corresponding research on other public facilities. In particular, in high-density cities such as Seoul, the Republic of Korea, it may be desirable in terms of sustainability to focus on the qualitative, rather than the quantitative, expansion of public libraries. In previous studies, the attractive factors on the supply side were analyzed using questionnaire surveys, but in this study, the attractive factors for users were quantified in the form of the library attraction index by means of user-generated contents such as location-based social media, and the accessibility was analyzed based on this. The results showed that many public libraries have high accessibility, with a high library attraction index. Therefore, these findings indicate that the qualitative expansion of public libraries is important for information equality. It is meaningful that this study analyzed the attractive factors on the supply side by analyzing the contents generated by users.
1. Introduction
Public libraries play crucial roles in the pursuit of equitable information access for all citizens [1], and they make an important contribution to the wellbeing of local people, often acting as community hubs that can reduce isolation among the vulnerable members of society by promoting social interaction and supporting the wider needs of local communities [2]. Therefore, public libraries serve an important role in preserving and promoting culture, formal education and self-education, and enriching leisure time [3]. As a result, research on library accessibility has been steadily conducted in the West in the pursuit of information equality by means of library provision, and factors affecting the use of libraries have been examined as well [1,2,4,5,6,7,8,9].
In the Republic of Korea (ROK), each public library is used by 50,000 people, whereas in the United States, the United Kingdom, Japan and Germany, each public library is used by 10,000 to 40,000 people. In 2019, the Korean government defined public libraries as a form of essential infrastructure that is necessary for people’s daily lives, like child-care, welfare, culture and sports facilities; the central government did this as part of its responsibility to implement policies to improve the quality of life and reduce the gaps between regions. However, there has been a lack of studies examining the accessibility of libraries in non-Western areas such as Korea, except for that of Guo et al. [10]. Therefore, this study aims to contribute to the creation of policy decisions regarding public libraries in Korea by analyzing the accessibility of public libraries in Korea. In particular, from a sustainability perspective, in a high-density city such as Seoul, it is effective to increase the perceived accessibility by reinforcing the quality of existing libraries in order to create the concept of a “library where we want to go”, rather than by building more libraries. Therefore, this study used social media data to measure the quality of a library as experienced by its actual users. Unlike research based on conventional data collected in a top-down manner, research conducted using data formalized in the bottom-up manner of location-based social media (LBSM), such as Flickr, Twitter and Foursquare, has a much greater potential for capturing the essence of reality [11]. Accordingly, this study analyzed user-generated contents to quantify the attractiveness of public libraries as a supply factor, then used these contents to assess the accessibility of public libraries. This study was conducted based on the public facility attraction index and accessibility analysis method used in Lee et al. [12]. An additional emotion analysis was conducted in order to evaluate the image of each library displayed on social media. Furthermore, in order to compare how the quality of the library affects spatial accessibility from the perspective of sustainability, the analysis was conducted by dividing the study population into an experimental group and a control group.
The rest of this paper is as follows. Section 2 examines the current research on public library accessibility and how to analyze accessibility in public facilities by setting supply factors. Section 3 shows the datasets and proposes the methodological framework. Section 4 discusses the results, and Section 5 presents the conclusion and ideas for future research.
2. Literature Review
The use of GIS to study spatial inequality can be found in a wide range of disciplines, including geography, public health and urban planning [13,14]. Kinikin et al. [7] analyzed accessibility by counting the number of registrants living within a radius of 1, 2, 3, or 5 miles of a library. They found that most users lived within 2 miles of a library, and that distance is a factor determining access to libraries. Cole and Gatrell [4] calculated access to library facilities by applying the gravity model after using the total book stock, a measure of the service attractiveness of the library (the one within 2 km of the user) as the supply-side data. Ottensmann [8] used the total number of items in each library’s collection as a supply-side parameter representing an attractiveness term for the comparison of libraries and users within a linear distance. Meanwhile, Park [9] generated Thiessen polygons and analyzed service areas in terms of distance based on the road network of the library and the registrants of each library, finding that distance is an important factor in library accessibility, particularly for registrants who used a library near their residence. Higg et al. [2] applied a floating catchment area (FCA), which is an extension of the gravity model, to analyze the change in the accessibility of public libraries, and they found that public libraries play an important role in providing digital services to the public. In another study, Guo et al. [10] implemented spatial accessibility measures for the evaluation of libraries by applying a two-step floating catchment area (2SFCA) in the consideration of geographical scales in Hong Kong, a compact and densely populated non-Western city. Consistent with previous studies conducted in Western countries, they found that inner-city areas such as Hong Kong Island and Kowloon had greater accessibility to libraries than their surrounding areas, and the results were robust according to the geographical scale. In the study examining the spatial accessibility of libraries, 2SFCA was applied for the spatial accessibility analysis because of its understandability and operability. The attractiveness, total book stock, total number of items in each library’s collection and staff levels were used as the supply-side parameters.
In general, similarly to libraries, the spatial accessibility of parks, daycare centers and residential care facilities is mainly influenced by three factors: the supply of service facilities, the population demand for the service, and the travel costs between the demanding populations and the service facilities [15]. In an attempt to alleviate the overestimation of population demand, Wan et al. [16] applied a method of segmenting the catchment area. Luo [17] used the Huff model to clarify the population selection for services and conducted an accessibility analysis considering the demand side. Recently, in recognition of the fact that the analysis unit should be considered when analyzing accessibility, Bryant and Delamater [18] and Wang et al. [19] conducted studies in which the analysis unit was related to the distance at either the macro- or micro-level. In addition, for travel cost, the spatial accessibility of public facilities such as healthcare facilities was assessed either by only making calculations in single-car mode [20,21], or by considering multiple transportation modes [15,22], such as public transportation, cycling and walking as well as traveling by private car. In terms of supply, Tao et al. [23] conducted an accessibility analysis considering hierarchical facilities, such as healthcare, education, emergency, firefighting and logistics facilities; that is, facilities that function in a multi-level system, because facilities at different levels provide heterogeneous services and interact with each other. In particular, accessibility analysis has been conducted while considering attractiveness, a supply-side parameter. Cheng et al. [24] conducted in-depth semi-structured interviews to assess the well-being of older residents in residential care facilities. In a study assessing the accessibility of the park, the attractiveness index was evaluated as a function of the park size and amenities, and a spatial accessibility analysis was conducted with a key indicator—park quality—as a variable in the supply side [25,26]. In particular, Xing et al. [27] considered the attraction coefficient in terms of the size and qualities of parks in order to analyze the spatial accessibility of parks among youths in Wuhan, China. The quality index of parks for youth, which is the key indicator for the evaluation of the supply of parks proposed by Rigolon and Nemeth [26], was given a weight according to visits by adolescents in order to improve the attraction coefficient. Furthermore, using the Huff model, they proposed a supply–demand–improved 2SFCA (SD2SFCA) method integrating youth demand by considering the probability of selection by users. However, they conducted field investigations to calculate the park index in a manner that reflected the characteristics of the relevant young people in terms of supply. Bozorgi et al. [28] applied the weighted 2SFCA to analyze the geo-spatial accessibility of opioid treatment programs (OTP) in South Carolina, the United States. Through this process, they applied Huff Model and developed a facility attractiveness index that quantified the probability of an individual’s preference toward the OPT site. The catchment size was determined with the function of the index.
Based on the literature presented thus far, the spatial accessibility of libraries is significantly related to library use; that is, better spatial accessibility is typically accompanied by increased library use [9]. Although distance is an important factor in the use or access of the library, designing literacy education and assessing the needs of library users are both needed to break down the barriers caused by distance. In other words, a user must visit a library to evaluate its attractiveness, even if that library is far from the user, and a user must do the same in order to assess whether the attractiveness affects the library’s spatial accessibility. Therefore, this study, which targets public libraries in Seoul, ROK, explored the purposes for which users had visited a library from reviews posted on the library’s website by users who had visited that library. Using attractiveness as a variable in the supply side of the library, this study intends to analyze the spatial accessibility of public libraries. The most straightforward measures compare the number of supply points (e.g., libraries) to demand-side characteristics (e.g., population totals or totals for population subgroups) [2]. Therefore, in order to examine the influence of the variable on the supply side of the library, the variable on the demand side was the amount of population per administrative district. In terms of supply, the objective was to analyze spatial accessibility by considering the attractiveness index of a public library’s user, so 2SFCA was applied, because it is simple and works well.
3. Dataset and Method
3.1. Study Area and Data Collection
The National Library Statistics System (NLSS, https://www.libsta.go.kr (accessed on 1 June 2021)), which is operated by the Ministry of Culture, Sports and Tourism (MCST), provides official statistics on the public libraries in each region annually. The area for this study was the public library of the Seoul Metropolitan Government. In order to create an attraction index by measuring the image and preference factors of the library on social media, libraries with relatively high exposure on the web were selected for this study. To this end, rather than examining the entire library system, the top 15 libraries (of the 147 libraries in total) based on the number of visitors provided by the NLSS were selected and studied. One reason for this decision is that, for libraries with few visitors, it is challenging to extract an attraction index from user-generated content, because there is little exposure on the web.
Both structured and unstructured data were used to build each library’s attractiveness index. The reason for using both structured data and unstructured data to build the public library attractiveness index was to measure both quantitative aspects such as the size and number of books of the public library itself, and qualitative aspects such as the images people have of the public library. Most previous studies used structured data alone to yield the public library supply [10]. On the other hand, this study included unstructured data in order to quantify the attractiveness of the public library, which cannot be obtained through statistical data. In the past, there was a limitation because reviews could only be obtained via interview or survey, but due to the rapid spread of social media, this limitation was overcome. The source and structured and unstructured data used in this study are as follows.
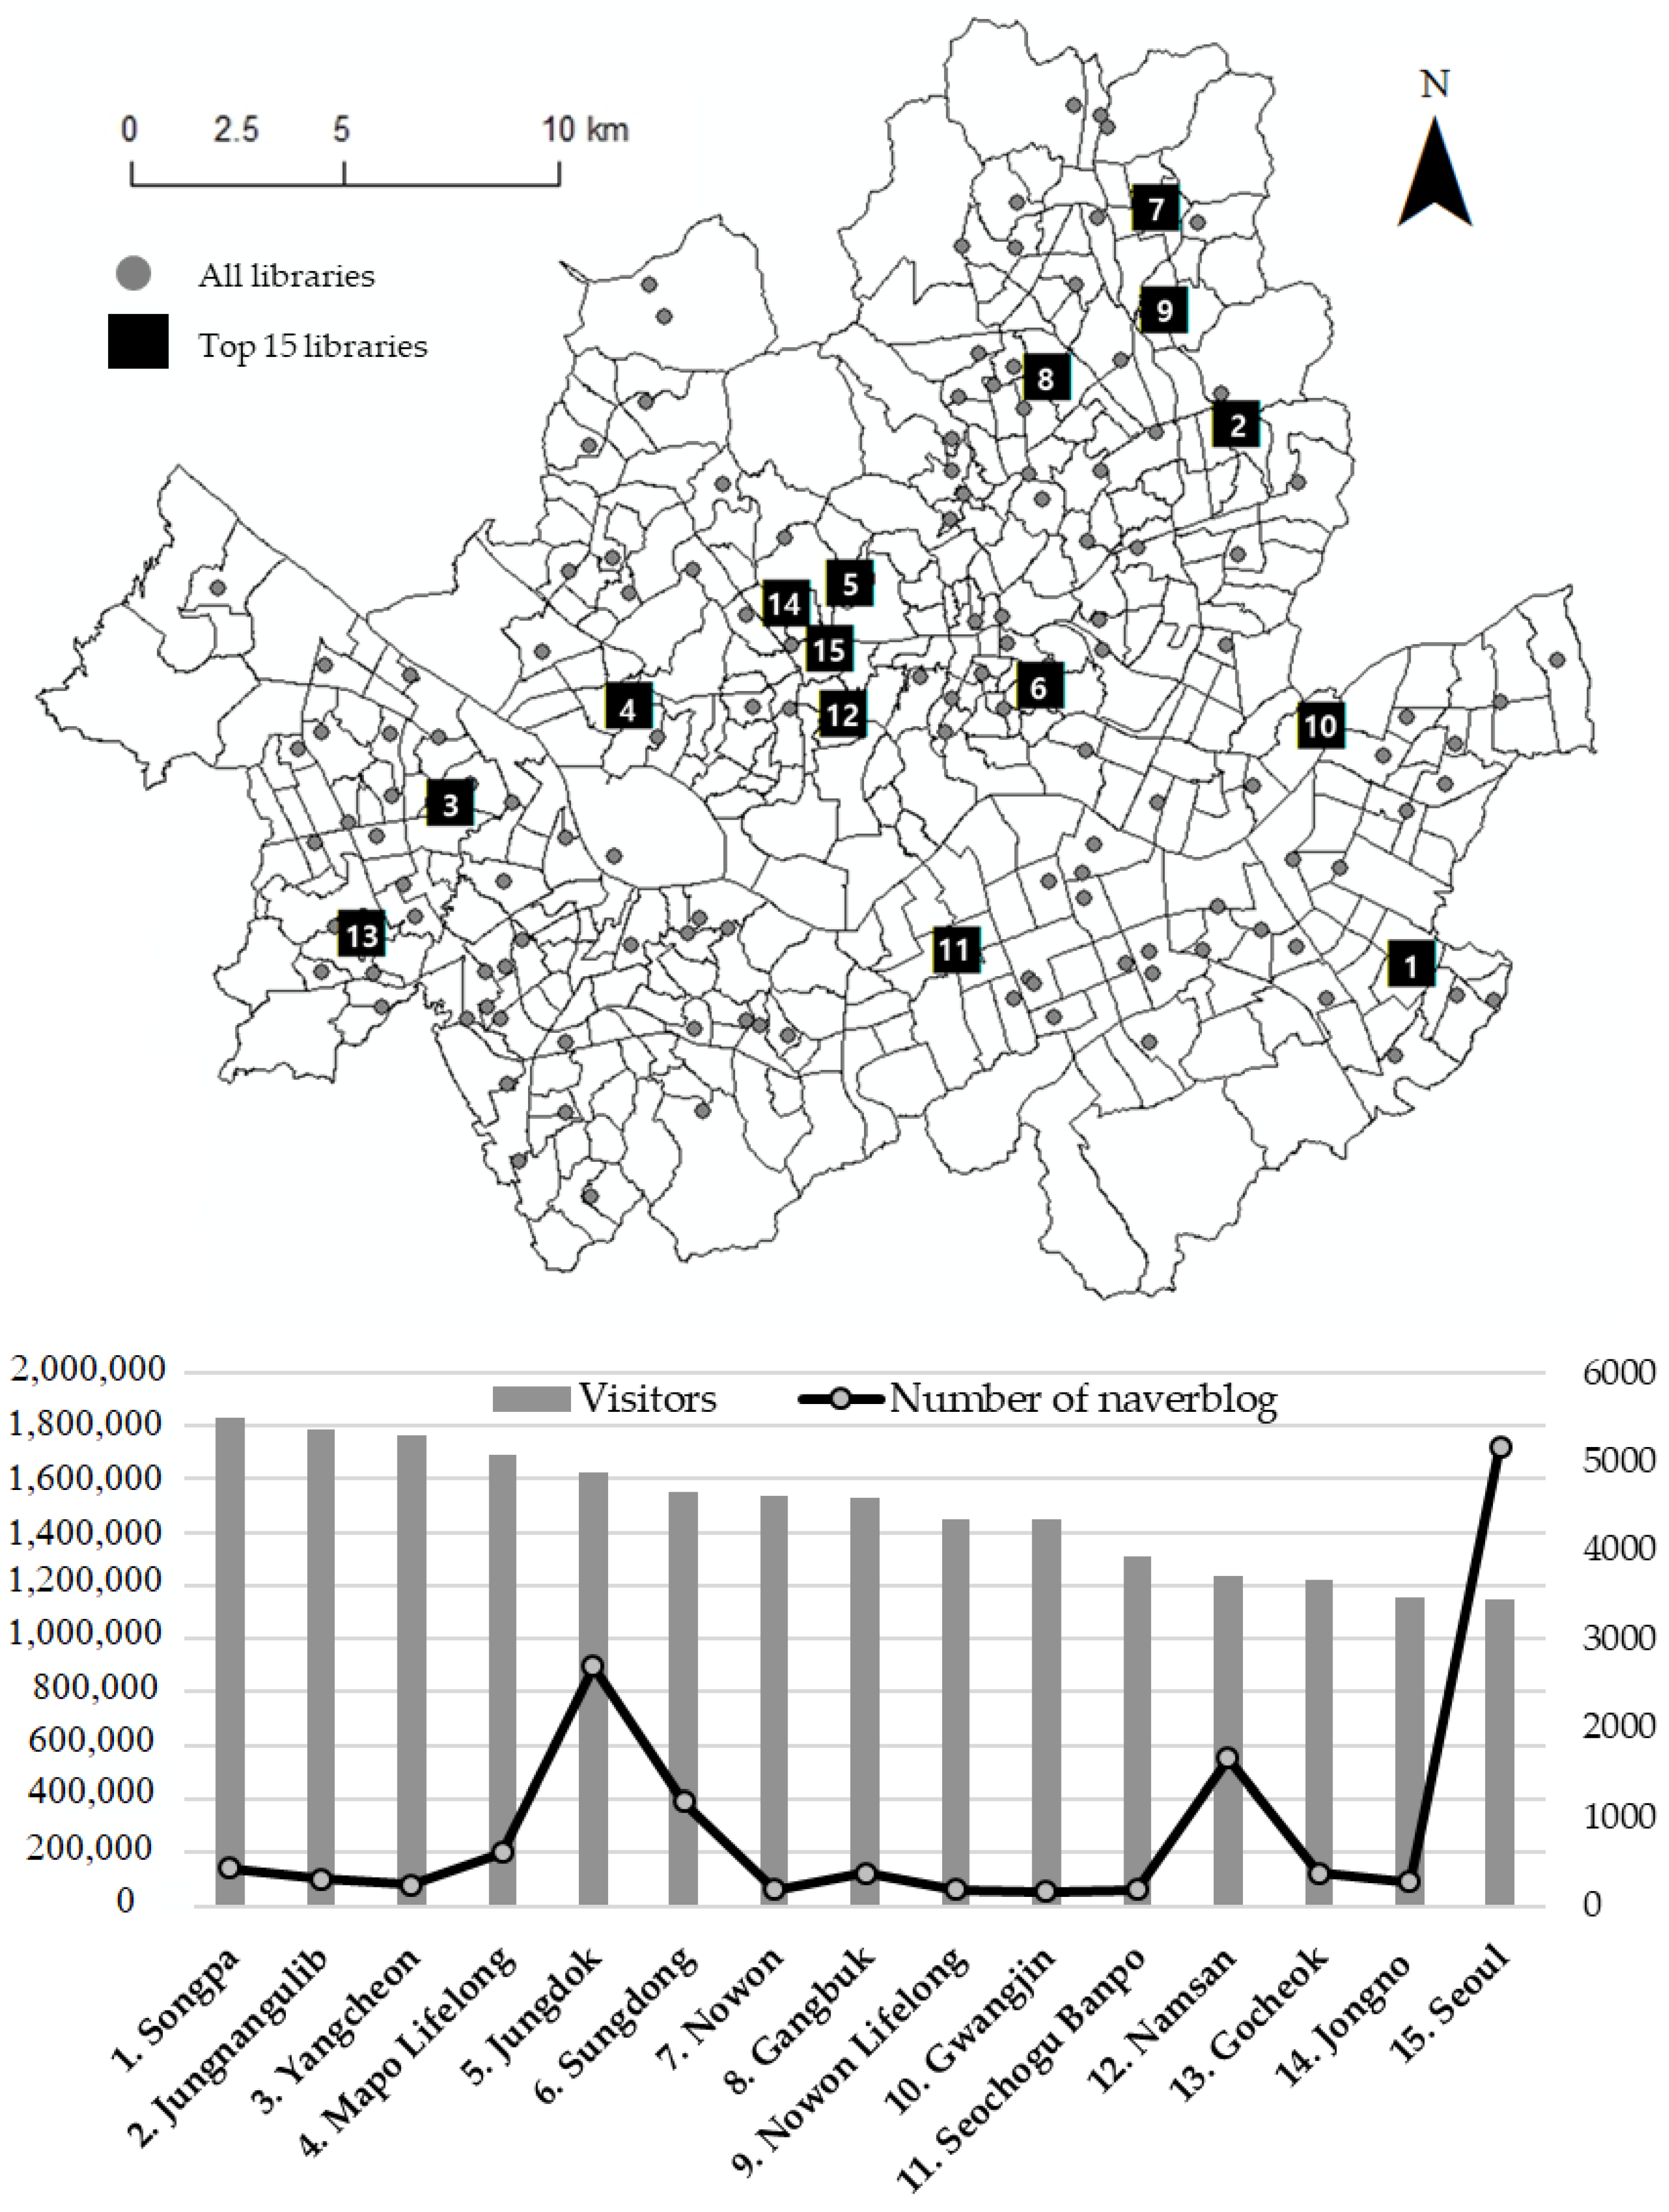
The structured data was made using statistical data provided by NLSS, which included user-related matters, such as the library address, building floor area, number of visitors per year and participation in cultural programs. As unstructured data, social media data from Naver Blog, which is actively used in ROK, were collected by means of the open API. The collection period was limited to one year, from 1 June 2017 to 31 May 2018, with 13,948 cases collected in total. The upper map in Figure 1 indicates the locations of the 147 public libraries in Seoul in terms of Eup, Myeon and Dong, which are the local units of the demand area used for spatial accessibility analysis. The graph below shows the number of visitors to the top 15 public libraries in Seoul and the frequency of exposure in the social media data for each library. Comparing the number of visitors to the frequency of exposure in social media showed that the degrees were not proportional: the Seoul Library, which has the fewest visitors among the top 15 libraries, has the highest number of social-media exposures. The graph detailing the number of visitors shows relatively little variation across the entire library system, but the number of social media exposures is disproportionately concentrated on specific libraries. This study conducted an additional sentiment analysis to consider the social media exposure frequency not only in terms of the size of each library, but also in terms of the quality of each one. Therefore, even for libraries with high social media exposure, if the data exposed on the web is more negative than positive, the overall attractiveness index may be reduced.
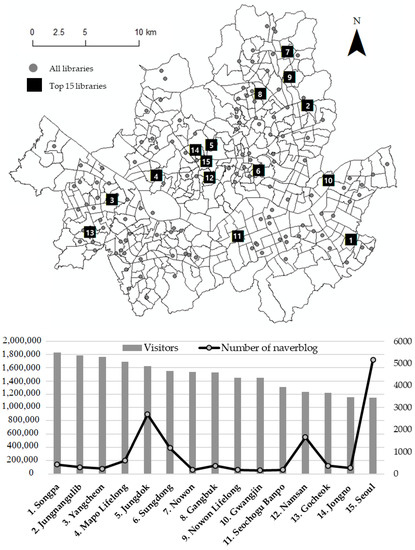
Figure 1.
List of experiments.
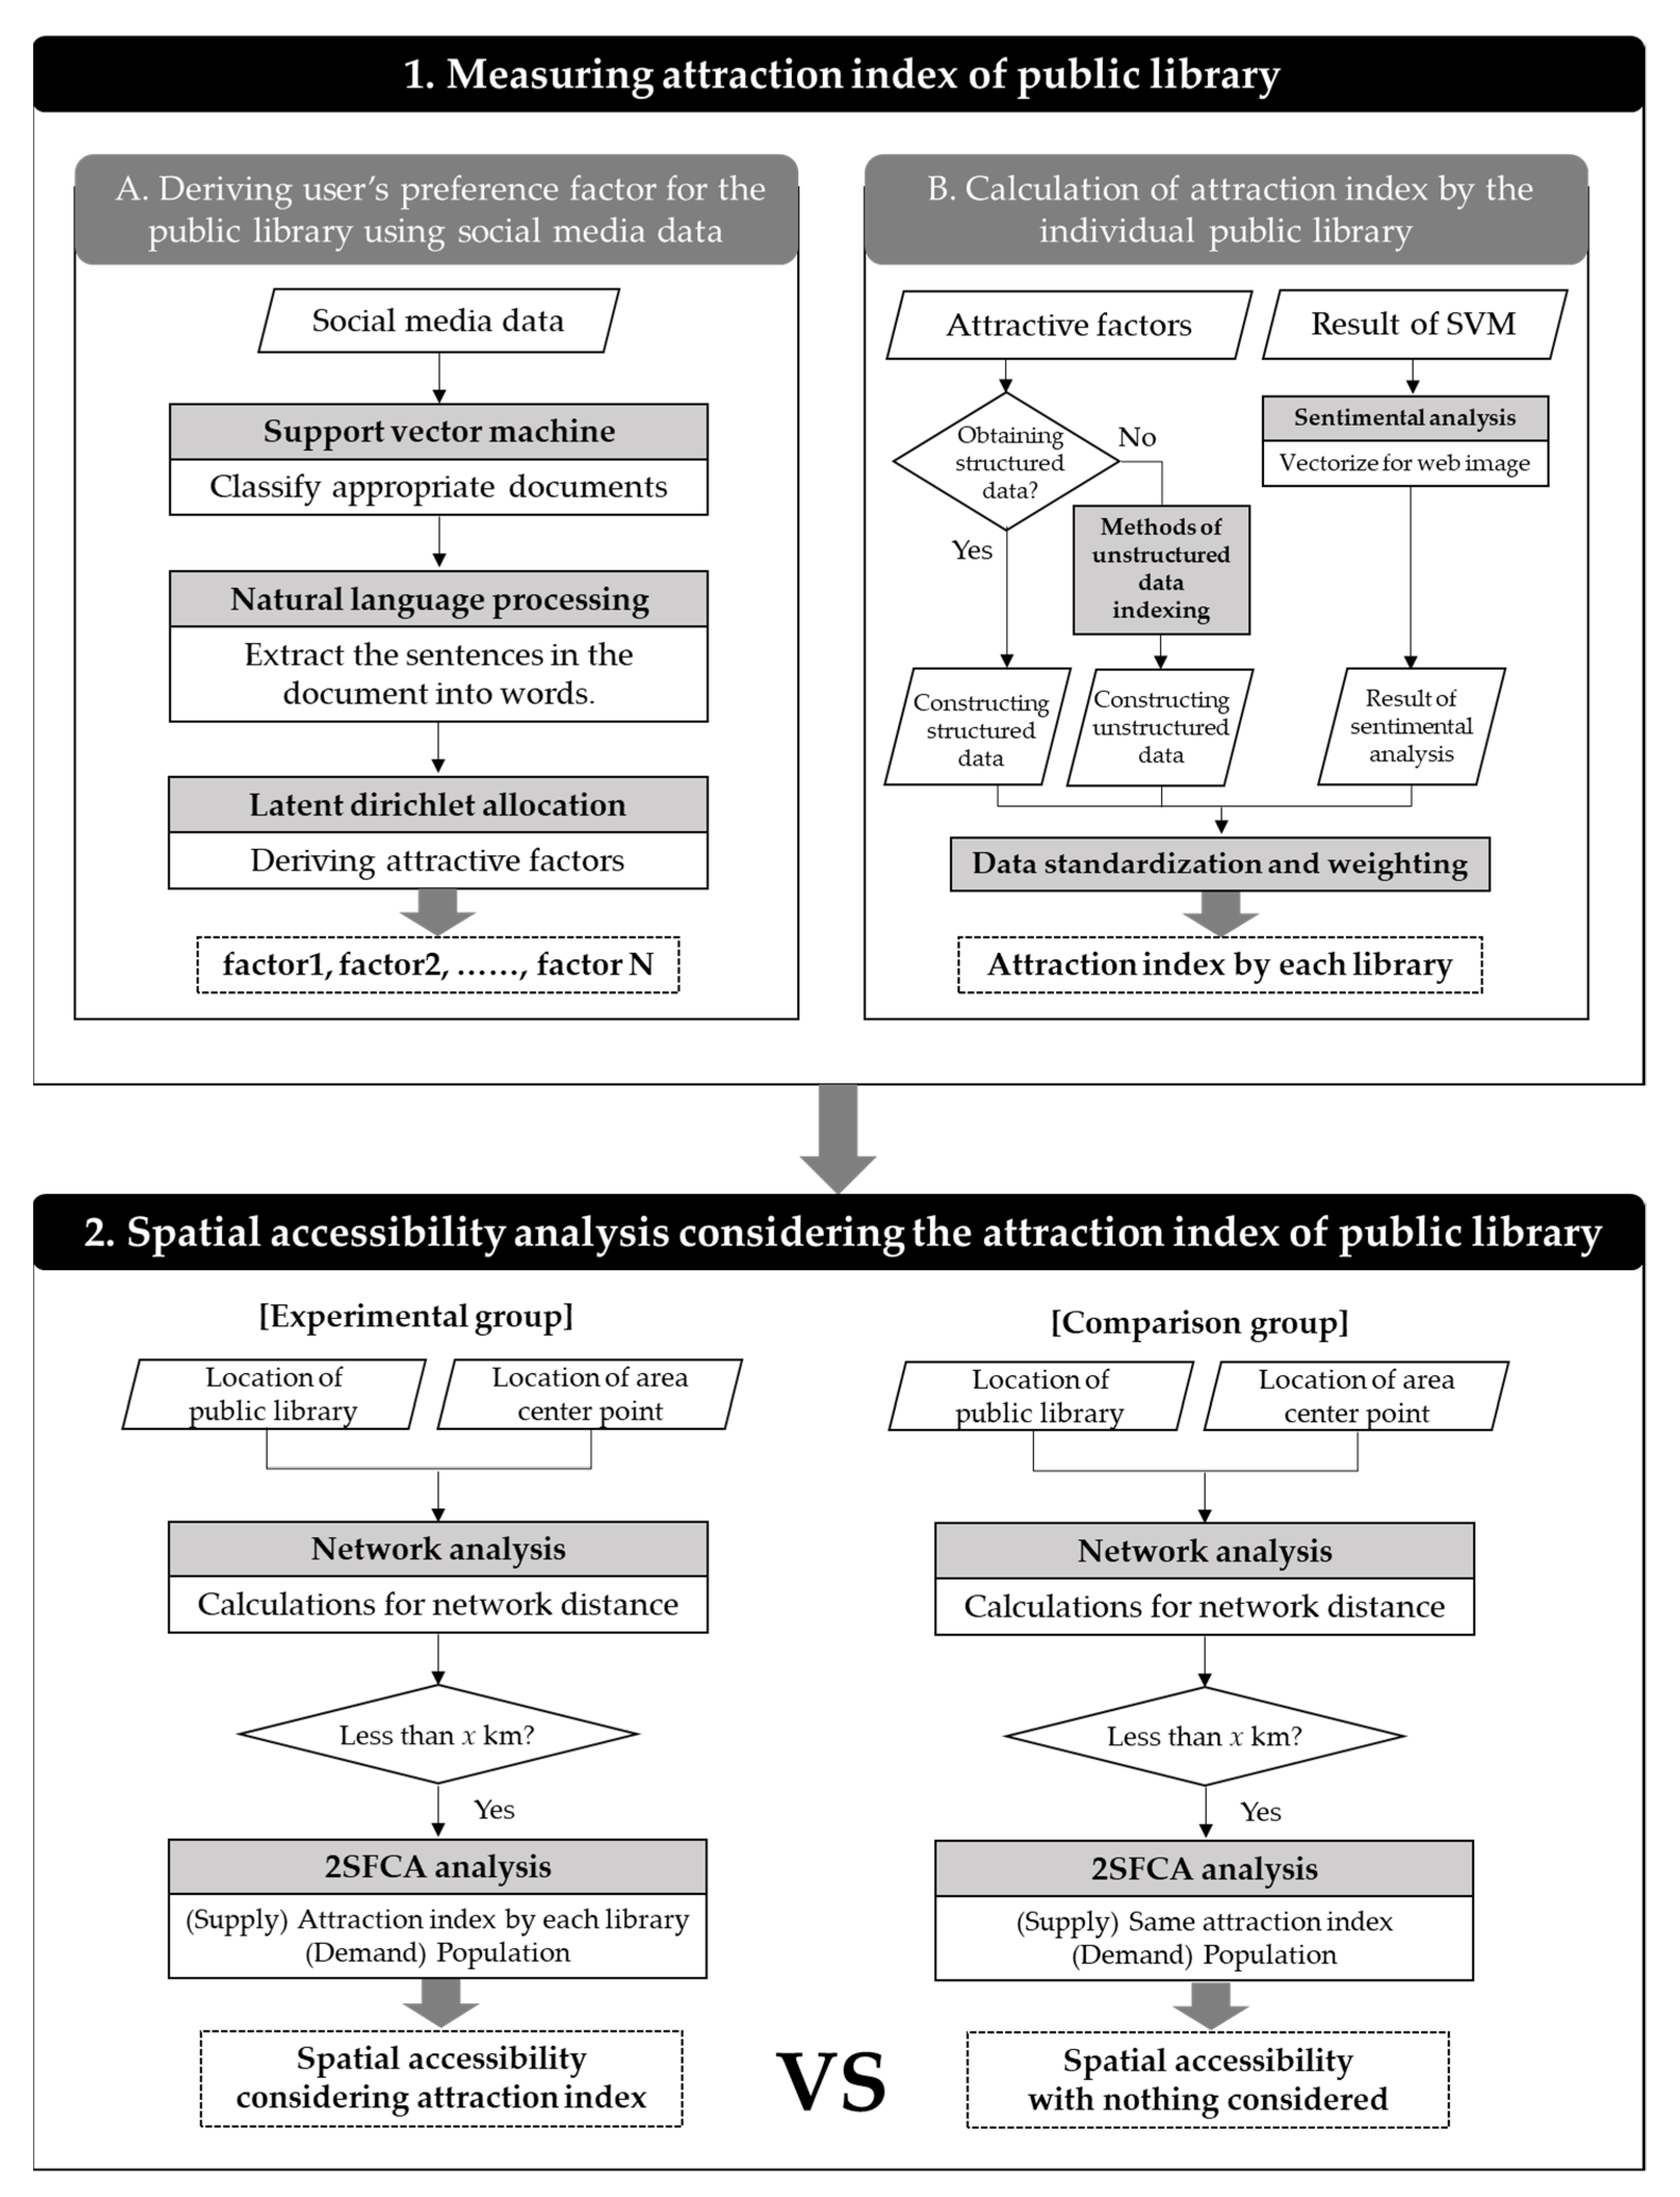
This study can be divided into two main parts: the first aimed to establish an attraction index for each public library. To this end, the preference factors for users appearing on social media needed to be derived first, and an attraction index was then produced based on the factors derived. A method of structured and unstructured data indexing was used to calculate the attraction index, and an additional sentiment analysis was conducted in order to assess each library’s image on the web. Finally, data standardization and weighting methods were used to build these various derived indicators into a single attraction index.
The second step was to measure the spatial accessibility of the entire city by applying the 2SFCA model, which provided the calculated attraction index as a supply factor for individual libraries. In this case, a comparison group was constructed with the same supply factor in order to compare the ways in which spatial accessibility differs with the attraction index’s application. The overall flow chart is depicted in Figure 2.
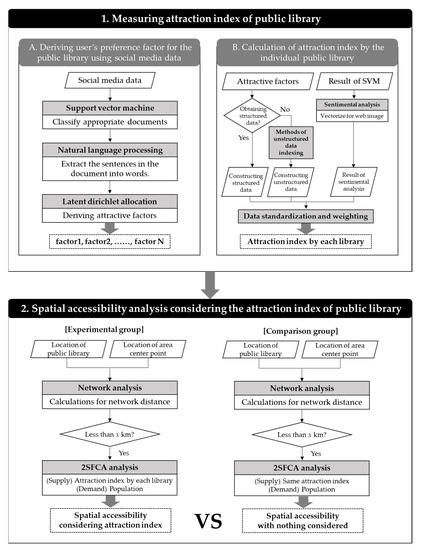
Figure 2.
Study flow chart.
3.2. Measuring the Attraction Index of a Public Library
3.2.1. Deriving the User’s Preference Factor for the Public Library Using LBSM
In this study, social media data is used to derive users’ preference factors for visiting libraries. In related studies, the supply-side preference factor was mainly measured using direct surveys, but this has certain issues, such as limited subjects of investigation or high costs. On the other hand, social media data can provide large amounts of data, but it is challenging to obtain the desired data. Specifically, filtering is vital when many of the documents are long, such as blog posts, rather than short messages like those shared on Twitter. In this study, data was collected from the Naver Blog by setting the library’s name as a search term; blog data was also collected by setting the library name as the primary search term, and more data was found for advertising purposes than for library visits. In order to address this issue, the support vector machine (SVM) technique, a document classification algorithm, was applied. The SVM was developed based on statistical learning theory, and it has proven successful in solving classification problems. Most learning algorithms are based on minimizing empirical risk, and they are applied in various fields because they are easy to generalize to classification problems [29]. After collecting articles about public libraries by means of LBSM data, some of the documents were labeled, specifically by adding 1 for articles related to the use of the library, and −1 for others. This was trained as an SVM, and the learned algorithm was applied to all of the data in order to extract only documents related to the use of public libraries.
The relevant documents were extracted using Natural Language Processing (NLP) to remove the stop words, and the morphemes were analyzed so that only nouns could be extracted. Topic modeling was conducted on the extracted nouns in order to derive the users’ preference factors for public libraries. Topic modeling is a significant tool in text mining as a technique for analyzing large amounts of text to discover topics and classify words into topics. This study used Latent Dirichlet Allocation (LDA), which has a high classification success rate, and which enables more straightforward interpretation than other techniques because it considers prior probabilities during topic modeling [30]. LDA is a probability model that estimates the distribution of words by topic and the distribution of topics in a document. After the topics for the entire document are extracted by means of the LDA analysis, each topic’s weight and the probability distribution of each topic specific word can be obtained. Expression 1 shows the process of the document extraction by means of LDA analysis [31].
where is a distribution over the vocabulary, is the topic proportion for topic k in document d, is the topic assignment for the nth word in document d, and is the nth word in document d, which is an element from the fixed vocabulary.
3.2.2. Calculation of the Attraction Index for the Individual Public Library
Method for the Construction of Indicators According to Preference Factors
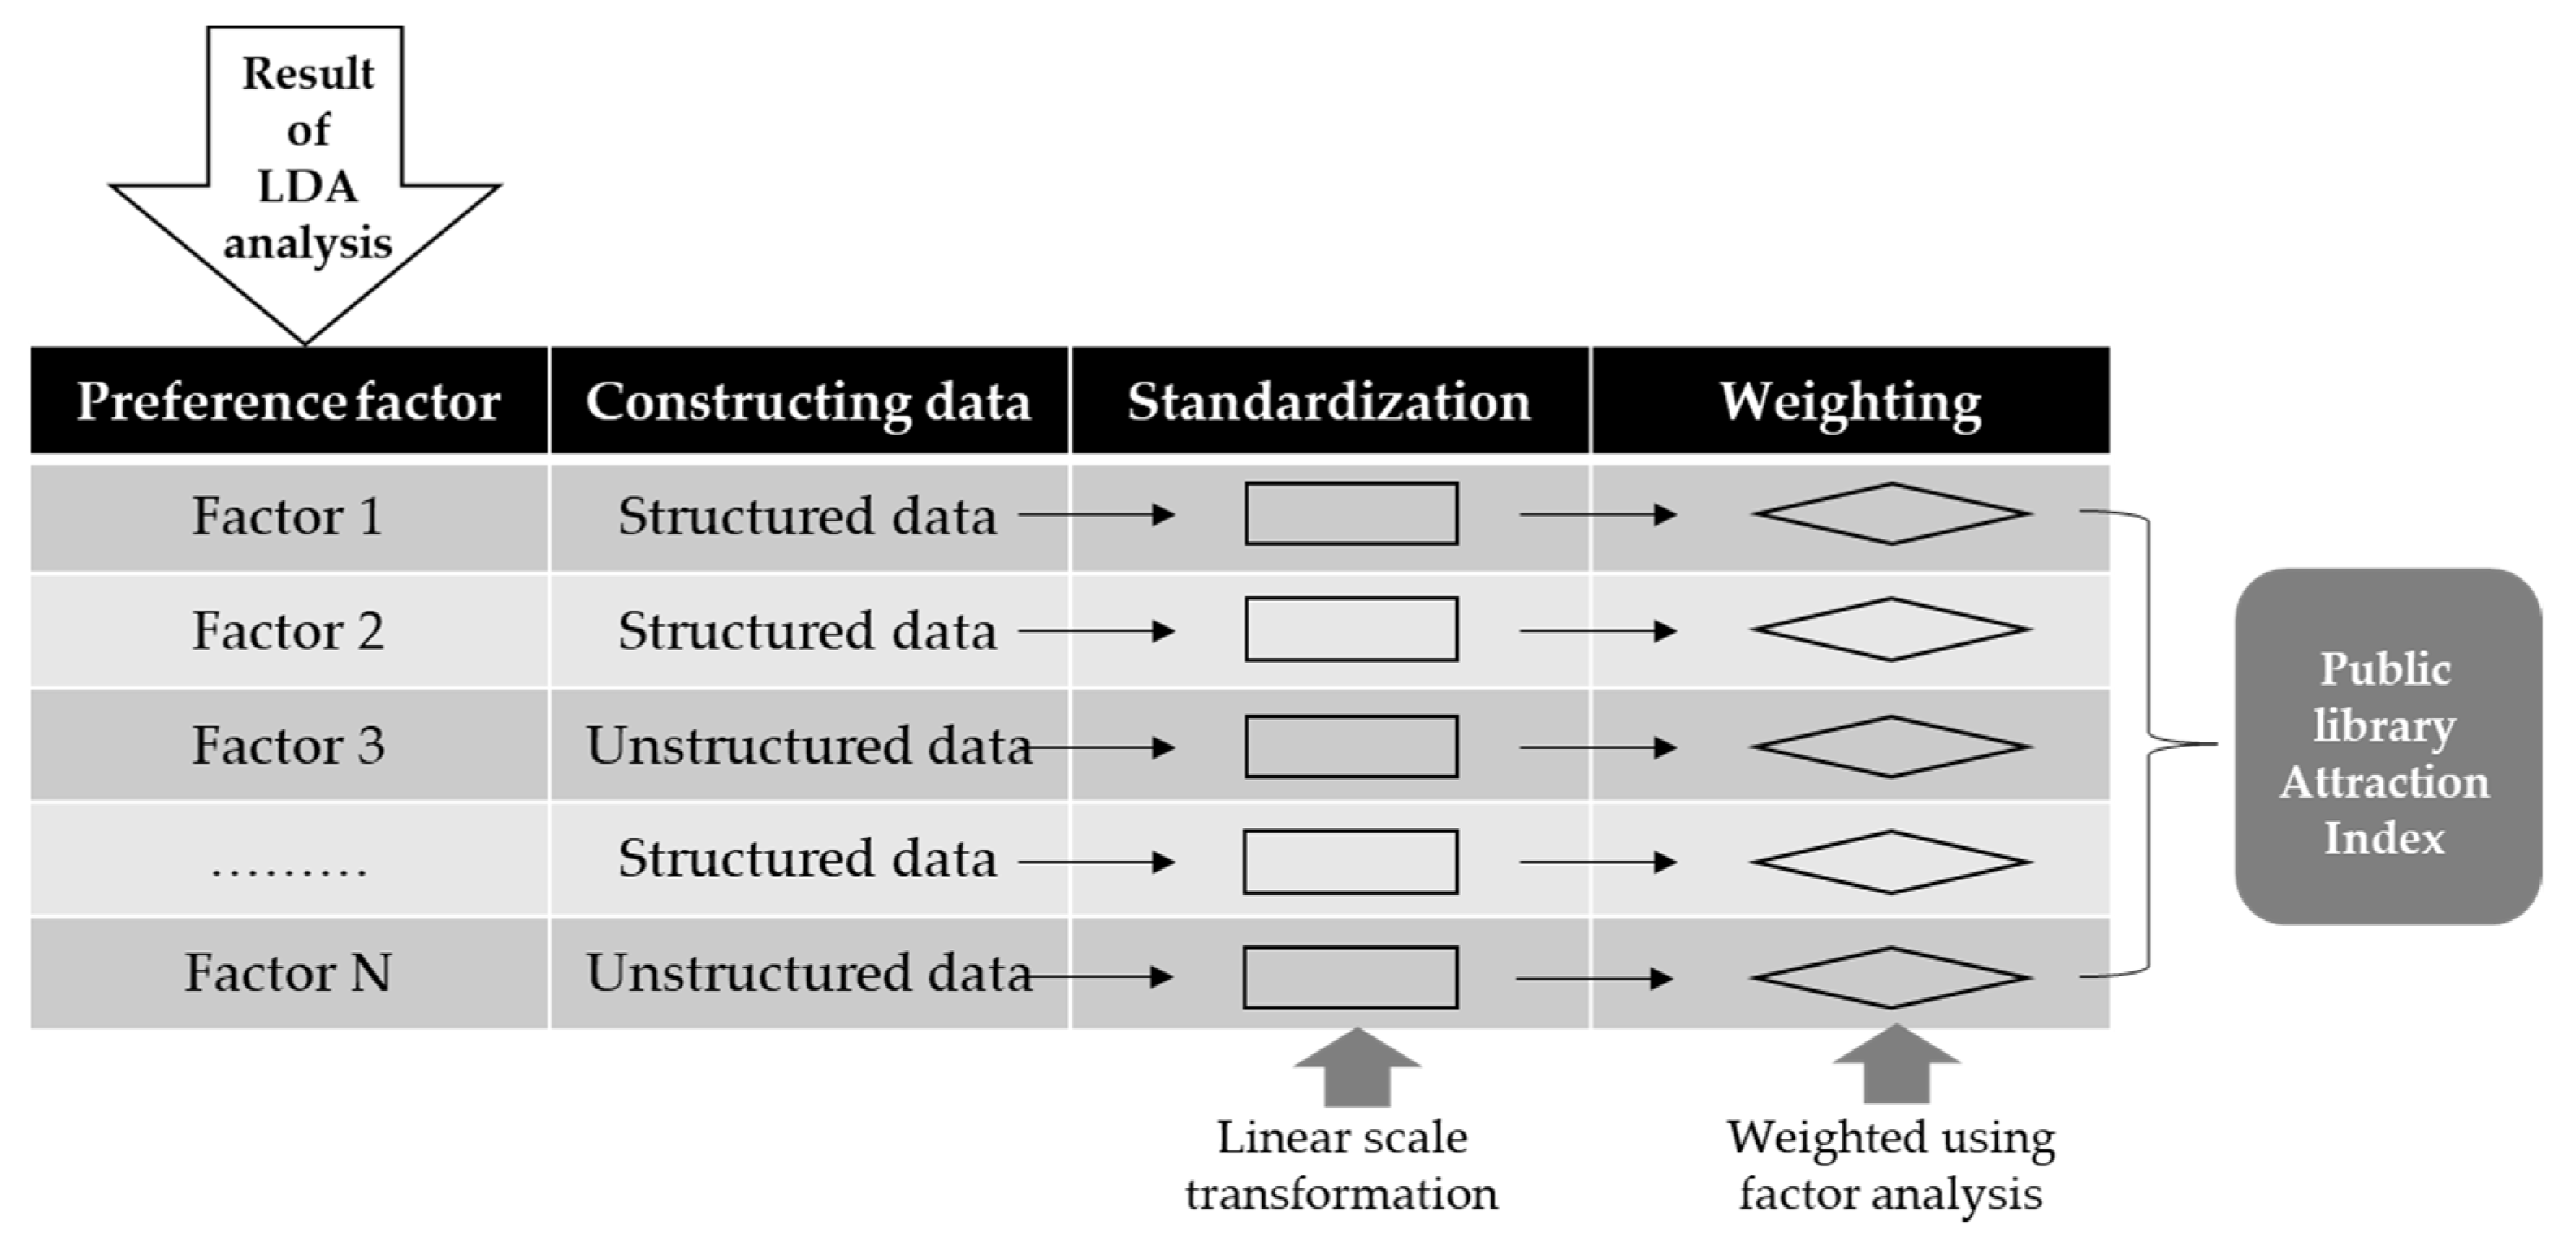
In order to calculate the library attraction index, the indicators that reflect the user preference factors derived in the previous section should first be established. To begin, an index is designed to make it easier to see how certain figures, such as quantity and price, have changed over time, as opposed to looking solely at the specific number itself. By contrast, an indicator represents statistical figures for specific data. Therefore, in creating the index, it is necessary to establish the individual indicators of the derived library preference factors and combine them. At this time, if there are specific structured data, such as statistics, that can indicate the factors, then for each preference factor the data should be established as an indicator. However, if there are no structured data, then the unstructured data should be used to build the indicator. In this study, the statistical data provided by the NLSS were limited to structured data. Figure 3 illustrates the process used to create a public library attraction index by constructing the indicators for each preference factor. First, the indicators are established for each library-use preference factor derived from the LDA results, then the final attraction index is calculated by standardizing and weighting them. The next section will discuss how to build indicators using unstructured data.

Figure 3.
Method for the calculation of the attraction index.
Construction of Indicators Using Unstructured Data
In response to the NLSS’s absence of data, the indicators were constructed using unstructured data, that is, social media data. In order to establish the indicators, the subject-specific word exposure that was obtained from the LDA results derived in the previous section was quantified. Figure 4 shows an indicator construction method for library preference factors by using LBSM data.
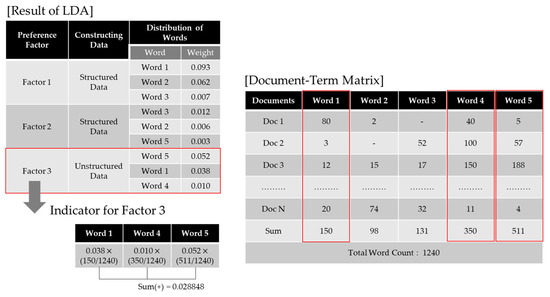
Figure 4.
Method for constructing indicators using unstructured data.
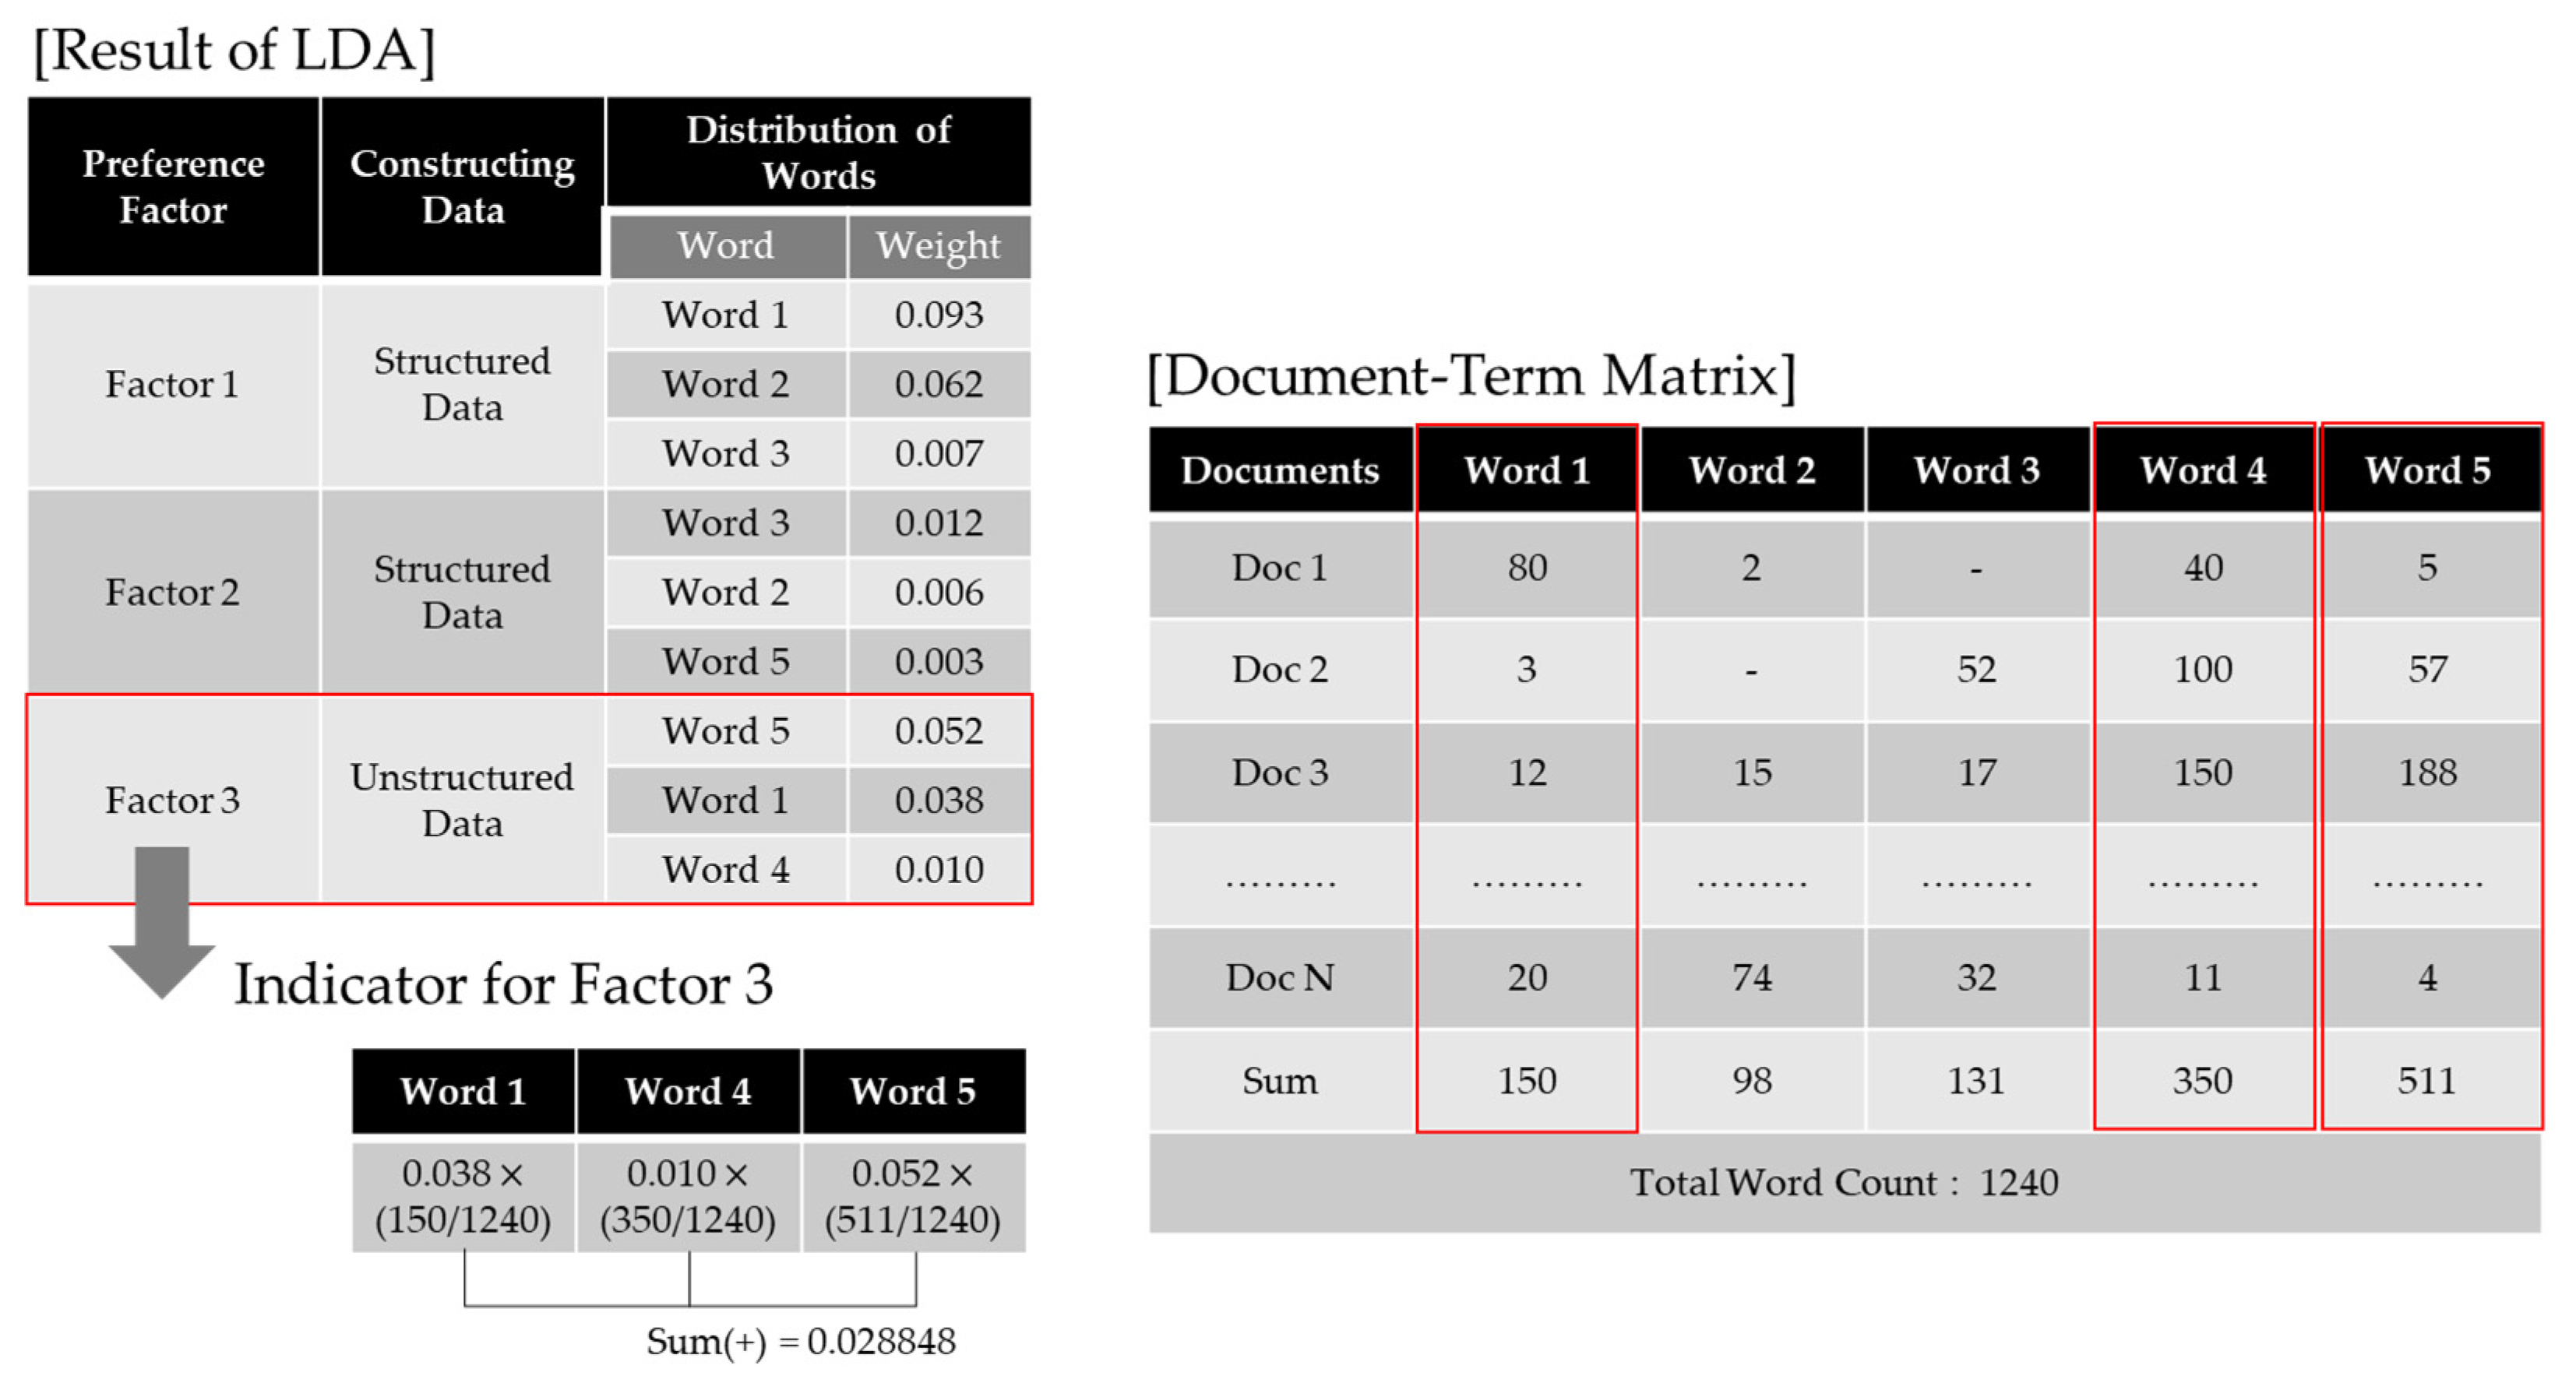
As shown in Figure 4, factor 3 has no associated structured data, so it is necessary to build the indicators from unstructured data. This study considered the weights for keywords obtained by means of LDA results and the frequency of word references built by means of a Document Term Matrix (DTM). For example, factor 3 was the topic of “childcare”, and word 5, word 1 and word 4 extracted as the main words for this topic are “nursing room”, “children” and “stroller”, respectively. To begin with, each library-specific DTM was created for the social media data collected, and then the number of mentions per word was counted. Then, these were combined with the LDA result value, i.e., the word weight. The LDA presents the topics for the whole article as well as the words and word weights that make up the topic. The results showed that, on the topic of “childcare”, “nursing room” has an influence of 0.052, “children” has an influence of 0.038, and “stroller” has an influence of 0.010. The use of unstructured data to establish the indicators of preference factors is shown in Equation (2).
where is the word-by-word weight values for the preference factor, is the number of mentions of that word, and is the total number of words. At this time, the number of mentions was standardized to the total number of words, because there were differences in the amount of social media data between the different libraries. In large public libraries, the exposure on social media is relatively high, so even the same word seems to have a high preference for a particular topic if it is looked at simply in terms of the absolute value. For example, suppose there is far more information on social media about Library A than there is about Library B. In that case, although the “factor 3 (childcare)” of Library B may be more specialized than factor 1 or factor 2, Library B will still produce a lower score for factor 3 than Library A, because the number of mentions of “stroller” related to “childcare” was significantly higher in Library A. Therefore, standardizing the number of mentions allowed this study to identify specialized preference factors for libraries with low social media exposure.
Public Library Image Based on Sentiment Analysis
Next, in order to classify emotions as positive or negative in text documents, a sentiment analysis, which is a field of NLP, was conducted to establish an index for the perceptions of public libraries. This study mainly used supervised machine-learning methods, such as Naïve Bayes, decision trees and SVM [32,33,34,35,36], along with proposed unsupervised lexicon-based methods [37,38]. Recently, sentiment analysis using deep learning consisting of long short-term memory (LSTM), which is a type of convolutional neural network (CNN) or recurrent neural network (RNN), has been increasingly used [39,40,41,42,43,44,45]. Because the Naver Blog data collected in this study has limitations in machine learning or deep learning, the sentiment analysis was performed using the Korean Sentiment Lexicon (http://ling.snu.ac.kr/kosac/lexicon.php (accessed on 2 August 2021)), which provides the polarity of positive words such as clear, cute, amazing, thanks, stunning and so on, and negative words such as annoying, sad, sorrow, debilitated, cry and so on for Korean (Hangul). In Section 3.2.1, nouns, adjectives and verbs were also extracted from the classified documents in order to eliminate stop words and conduct a morpheme analysis. These extracted nouns, adjectives and verbs are compared with the lexicon to determine the matching polarity. In this study, based on the polarity calculated from texts related to public libraries, the image indexes for public libraries were calculated using Equation (3).
here, Pk is the image indicator of the public library(k), SO is the sentiment orientation, SS is the sentiment score, and is the weight for the term frequences of the public library(k). At this time, the sentiment direction, SO, is found to be positive (+1) or negative (−1) by comparing the size of the positive index vector, and the negative index vector, of the public library (k) according to Equation (4). Here, given the user-generated content (i) for public libraries (K), the frequency of mention (), the positive polarity (PT) and the negative polarity (NT), it is calculated as a positive index vector or a negative index vector . The sentiment score, SS, is a value obtained by adding 1 to the size of the sum vector of the positive index vector or a negative index vector of the public library, as shown in Equation (5). In this case, even if the frequency of reference is present, for a neutral case, where the sizes of the positive and negative index vectors are the same, it may be 0, so it is calculated by adding 1. Finally, public libraries with large amounts of user-generated content—that is, public libraries with many mentions—should be given a higher score. Thus, is calculated as shown in Equation (6), so that it has a value close to 2 when there is a lot of user-generated content, and a value close to 1 when there is little user-generated content. At this time, a weight-adjustment factor, —which adjusts the rate of increase of the weight value—was used, and the value was set to 50. If is greater than 0, it is interpreted as positive; if it is 0, it is interpreted as neutral; and if it is less than 0, it is interpreted as a negative image index.
Data Standardization and Weighting
Because each of the previously presented indicators has different units and varying importance between different metrics, this study used the statistical method of the linear weighted sum to produce the final attraction index. Because the values are different for each metric, the standardized score was calculated by dividing the difference between the raw material () and the minimum value by the range of the given criteria (Xmax − Xmin). This is expressed as shown in Equation (7).
Next, factor analysis was used to analyze weights that could indicate the importance of the indicators. Factor analysis binds many of the collected variables that have similar characteristics together and reduces them to a few explanatory and dependent variables. Through the factor analysis applied in this study, the weighting method extracted factors with eigenvalues greater than one from the factor analysis, then set the weight of each indicator in terms of the common variance of each factor. That is, the communality of each variable was divided by the sum of the eigenvalues of the extracted factors. Principal component analysis was used in this study to extract the factors, and varimax was used for the factor rotation. The final public library attraction index was derived by multiplying the weighted results obtained through the factor analysis by the previously standardized indicators, then aggregating the preference factors over all of the indicators.
3.3. Spatial Accessibility Analysis Based on the Attraction Index of Public Libraries
In this study, an analysis was conducted by dividing the study population into an experimental group and a comparison group in order to determine how public library attractiveness affects spatial accessibility. There are several ways to measure spatial accessibility. However, as the main goal in this study was to consider the supply factor of public library attractiveness, a 2SFCA model was used to measure it. Therefore, the experimental group was used to measure spatial accessibility by adding each library’s attraction index—as calculated in Section 3.2—as a source of supply, and the comparison group was given the same attraction index for all of the libraries for analysis. In this study, the 2SFCA was calculated in two stages, with demand around supply facilities measured first, and the accessibility to supply facilities around the demand locations calculated second [46]; Equation (4) represents the first step, while Equation (5) represents the second step.
In Equation (4), represents the PPR, i.e., the provider (supply facility j) to population ratio, where represents the supply capacity of supply facility j. The public library attraction index obtained in the preceding section can be applied to . If the maximum distance to which a supply facility j can provide services is , then refers to the demand amounts within this distance. As took place in previous studies, this study used population indicators as demand . The administrative district’s center point was used to measure the demand, and the network distance was adopted because a straight-line distance is less realistic and accurate when setting the distance [21,47]. The second step aggregates the PPR of the supply facilities available on a demand-site basis. In Equation (5), means the accessibility to the supply facility j available at each demand location as the final result value. It can be obtained by summing the PPR of the supply facility j within the distance that can be reached from the demand site. By comparing the results produced by the experimental and comparison groups, the effect of the attraction index on the spatial accessibility of the entire city to public libraries can be visually checked.
4. Results and Discussion
4.1. Analysis of the User’s Preference Factor of Public Libraries in Seoul, ROK
Among the Naver Blog collection data related to the Public Library in Seoul, the actual library reviews were extracted through SVM. Of a total of 13,948 documents, 3428 were selected as relevant documents. When web-crawling for blog data under the name of a public library was conducted, the data included various forms of advertising, such as sales of nearby apartments and advertisements for restaurants. The programming language used in this study was Python 3.6.0, and the KoNLPy (Korean NLP in Python) package was used for the natural language processing, such as the separation of word units, the elimination of stop words, and the POS (part of speech) tagging.
For the LDA modeling, first, only nouns (NNG) were extracted from the words extracted during preprocessing, and these were organized into a dictionary. Then, a document–word matrix consisting of the term id and term frequency was conducted using the doc2bow method in the gensim library supporting natural language processing. This was tested by changing the parameter values, and this process was repeated 1000 times by designating five topics and five words extracted from the five topics: the surrounding environment, facilities and usage scale, cultural program, childcare, and books and materials. This result is considered to be meaningful because the social media data included topics about the surrounding environment or childcare that were not found as preferred factors during library visits. The preference factors for visits to public libraries and the words representing each factor derived by applying the LDA are listed in Table 1. The number under the extracted word is the word’s weight representing the topic.

Table 1.
Result of the LDA.
The LDA analysis of social media data related to visits to public libraries is as follows.
First, the words “photo”, “building”, “person”, “café” and “cherry blossom” were extracted for the preference factor “surrounding environment”. This result shows that the purpose of the public library visit is not just to borrow books, but also to benefit from external environmental factors, such as taking pictures or visiting nearby cafés. In particular, the results of extracting “cherry blossom” from the word means that libraries that are famous for their cherry blossoms will attract more visitors during that season. However, the smaller weight of the word “cherry blossom” compared to that of “photo” suggests that “cherry blossom” is an indicator for more specific libraries. Second, the words “library”, “use”, “humanity”, “reading room” and “facility” were extracted for the preference factor “facilities and use scale”. Potential users of a library are interested in using the reading room or in the convenience of the facility itself, as well as in the general use of the library. For “humanity”, as interest in humanities has recently increased, related books or facilities are a factor influencing the choice to visit. Third, “culture”, “citizen”, “exhibition”, “space” and “program” were extracted for the preference factor “cultural program”. This suggests that user’s purposes in using libraries are changing from solely accessing books to also accessing cultural elements; the role of the library has expanded to one of a complex cultural space. Fourth, “children”, “time”, “thinking”, “person” and “mom” were extracted for the preference factor “childcare”. This shows that many visitors to the public library are mothers in charge of childcare. If customized support is provided that is informed by the accurate analysis of users when establishing public libraries’ policies in the future, then the policy effect will be maximized. Fifth, “library”, “reading”, “reference room”, “material” and “information” were extracted for the preference factor “books and materials”. This represents the library’s traditional purpose; here, the main reason for visiting the public library is to find books and materials.
4.2. Analysis of the Attractiveness Index of Public Libraries in Seoul, ROK
In this step, related indicators for five preference factors obtained by means of social media analysis were constructed for the 15 public libraries that had the most visitors in Seoul, ROK. In addition, a sentiment analysis was conducted for each library in order to calculate the final public library attractiveness index. The attractiveness of public libraries can be divided into the attractive factors of the facility itself and the factors of the external environment. Here, “facilities and usage scale”, “cultural program” and “books and materials” are attractive factors of the facility itself, whereas the “surrounding environment” is an external element. Meanwhile, “childcare” has a complex perspective. Parenting-related books and convenient facilities in public libraries are attractive factors for the facility itself, but because the number of visitors is increased by meetings led by mothers and by word of mouth as a result of the many child-raising facilities nearby, the external aspect cannot be dismissed. Therefore, in this study, the attractiveness factors of the facility itself were constructed using the data established in the statistical result table of public libraries issued by the NLSS, and the index for the factors that depend on the external environment was constructed using social media data, because the attractiveness factors based on the external environment are not easy to measure with existing indicators. This study analyzed the factors related to “childcare” by setting the external environmental factors to have a greater influence than the facilities themselves, because the focus was on calculating attractiveness using social media data.
First, for the “facilities and usage scale” among the indicators built using structured data, “number of seats” was selected, which is an index that can quantitatively reveal the size of facilities in the library, because the words related to the subject were derived from reading rooms or facilities. For “cultural program”, “number of cultural program courses” was used, which is the most similar data provided by the statistical system. Finally, for the factor related to “books and materials”, “number of reference room users” was selected as the relevant indicator, because the words derived through LDA analysis are mainly related to data or data rooms rather than books. This way of constructing an index using social-media data involves indexing the exposure of images by means of the words on social media. Therefore, the index was constructed by multiplying the mention ratio of the subject words constructed by the preference factor by the weight and then adding them. For example, the score for the “surrounding environment” of Songpa Library was composed of DTM after collecting the blog data about Songpa Library and counting the number of times that a photo, building, person, café, or cherry blossom was mentioned, which represented the extent to which the library was exposed to related topics on social media. Next, the mention rate was applied for all words while taking into account the amount of social media data for each library. Furthermore, in order to apply the weight for each word, the ratio of the total value was adjusted using the LDA value found in the previous section. Finally, for the image analysis by public library, an indicator was built by conducting a sentiment analysis of the collected social media data. Table 2 shows the six indicators that were established.
Table 2.
Constructing indicators by the public library preferred factor.
The results of the indicators constructed for each library are as follows. The surrounding environment indicators according to social media data were high for Jeongdok Library and Namsan Library, which are located in the center of Seoul and are famous for cherry blossom viewing. For the childcare indicator, Songpa Library and Banpo Library were relatively high, because they are located in areas with a high percentage of children in the surrounding area, as well as high educational enthusiasm. Regarding the data built using the structured data of the NLSS, the number of seats indicator index was high in Yangcheon Library, Namsan Library and Songpa Library, and the number of cultural programs was high in Nowon Lifelong Learning Center and Mapo Lifelong Learning Center. The index of the number of reference-room users was high in Jungnangulib Library, Seongdong Library and Gwangjin Library. Finally, analyzing the public library image indicator using social media data showed that the Seoul Library had the best image; this library had a relatively low score in the other indicators. The Seoul Library is operated by Seoul City Hall, and has a good reputation among its users. In addition, in terms of the number of social media collections, Jeongdok Library had far more than Namsan Library, but the actual sentiment analysis showed the opposite result; that is, Namsan Library had a more positive image.
In order to create a single attractiveness index by summing the indexes for the public library preference factors and library image, it is necessary to standardize and weight the index. For the standardization of the indicators, a score range was used among the linear methods that can be used. In the standardization, the maximum and minimum values are 1 and 0. In order to assign weights using factor analysis, a correlation analysis and factor analysis were conducted for the indicators that were first constructed. Table 3 lists the results of the correlation analysis. Overall, there were few variables with high correlations, and only the surrounding environmental indicator and the image-analysis indicator were slightly high, with a Pearson correlation coefficient of 0.593.
Table 3.
Results of the correlation analysis.
Because the correlation between the indicators was not high, a factor analysis was conducted. Table 4 presents the results of this analysis. Two factors with an eigenvalue greater than 1 were extracted: Factor 1 had 34.361% explanatory power and factor 2 had 27.517% explanatory power; together, these two factors explain 61.878% of the total data. Table 5 details the process of deriving the weights for each factor, as well as the resulting values. The weight by factor analysis indicates the degree of variance that explains the individual indicators among the variances in which each factor explains the entire indicator after removing the one factor that is not explained from among the indicators. That is, the index with the highest weight is the one representing the whole. In order to derive weights using factor analysis, the common variance was first obtained by means of the sum of squares of the factor loads for each variable. Then, the sum of the variances explained by the selected factor was calculated by dividing the common variance by this value. Finally, the weights were standardized so that their sum for each preference factor could be 1. The value specified as “Weight_2” in Table 5 is the final weight, and it has a value between 0.12 and 0.21. The indicators related to the surrounding environment had a relatively high weight, meaning that this indicator reflects the attractiveness of the library more than the other indicators.
Table 4.
Results of the factor analysis.
Table 5.
Weighting process and the results for each factor.
After adding the weights to the final standardized values, the attractiveness index for each public library was calculated by summing the six indices. Table 6 presents the attractiveness index of the 15 public libraries with the most visitors. The results show that Jeongdok Library, Songpa Library and Namsan Library all had relatively high attractiveness. This indicates that there is a correlation between the exposure in social media data and the final attractiveness index, and that the weight of what is given from the external environment as well as the attractive factor of the facility itself is increasing. In fact, having received good reviews on social media can act as an important variable for someone deciding whether to visit a particular facility, because they provide a good image of that facility to prospective users who may want to visit in the future. The analysis of public libraries with a high attractiveness index calculated together with the index for each preference factor is as follows: first, Jeongdok Library and Namsan Library, respectively, ranked first and third in the total scores on the indicators related to the surrounding environment; that is, more people visited these two libraries over most others because of their environmental factors. In fact, Jeongdok Library is well known for its beautiful cherry blossoms, so it is counted as a photo spot during the cherry-blossom season, during which it hosts more visitors. Namsan Library stands out as having a sense of place in connection with the surrounding Seoul N Tower, which is why the library is highly exposed by users on social media. Rather than simply reading, users take great pictures of beautiful libraries, or they visit the library as part of a dating course and upload the reviews to their personal social media accounts. For Songpa Library, which ranked second in the number of visitors, the score was high in childcare, which indicates that Songpa-gu is an area with a relatively large population of child-raising families, and the Songpa Library has facilities and books related to child rearing, so it is evaluated on social media as a good library that mothers should visit with their children. This suggests that the role of public libraries should be considered from a wide variety of aspects such as education, culture and environmental factors, rather than simply being seen as places to read books and search for materials.
Table 6.
Calculation of the attraction index.
4.3. Differences between the Original Accessibility and the Accessibility Based on the Attractiveness Index
In order to quantify the perceived effect from the user’s perspective, the spatial accessibility was analyzed by applying the attractiveness index calculated in Section 3.2 to the 2SFCA model. At this time, in order to compare how spatial accessibility changes according to the application of the attractiveness index, a model applying the same supply factor was constructed. In other words, the values presented in Table 6 were applied to the experimental group in order to analyze the proposed model to which the attractiveness index of the public library was applied (experimental group), and the attractiveness index was set to 1 in the accessibility model that did not take it into account (comparative group). It was applied so that the attractiveness of the public library did not affect the accessibility analysis. For the comparative group, the spatial accessibility was calculated by applying the attractiveness index for all public libraries as equal to 1.
This study set the spatial analysis unit to the administrative boundary, Eup, Myeon and Dong, and used the road network distance from the central point of each Eup, Myeon and Dong to the public library. The critical distance was set at 10 km, which is generally considered to be about 20 min by car. In fact, when building a public library, there is a rule that it must be accessible within 20 min (2 km) on foot in urban areas, but that rule may change when public transportation is available [48]. In addition, because the hypothesis of this study is that improving the quality of public libraries is more important than increasing the number of public libraries and also improves the sustainability of welfare facilities in the city, this study considered the distance reachable by car. If a public library with a high attractiveness index is located within 20 min by car, then it is presumed that users are willing to visit, even if not on foot. The distance was calculated between the supply and demand sites from the central point of each Eup, Myeon and Dong to the public library by using the OD cost matrix, one of the network analysis methods in ArcGIS 10.3; only those within 10 km were selected and analyzed. At this time, the quantity of demand was applied to the population in each Eup, Myeon and Dong. For the supply amount , the public library attractiveness index calculated in the previous section was applied to the experimental group, and 1 was applied to the attractiveness index in the comparison group.
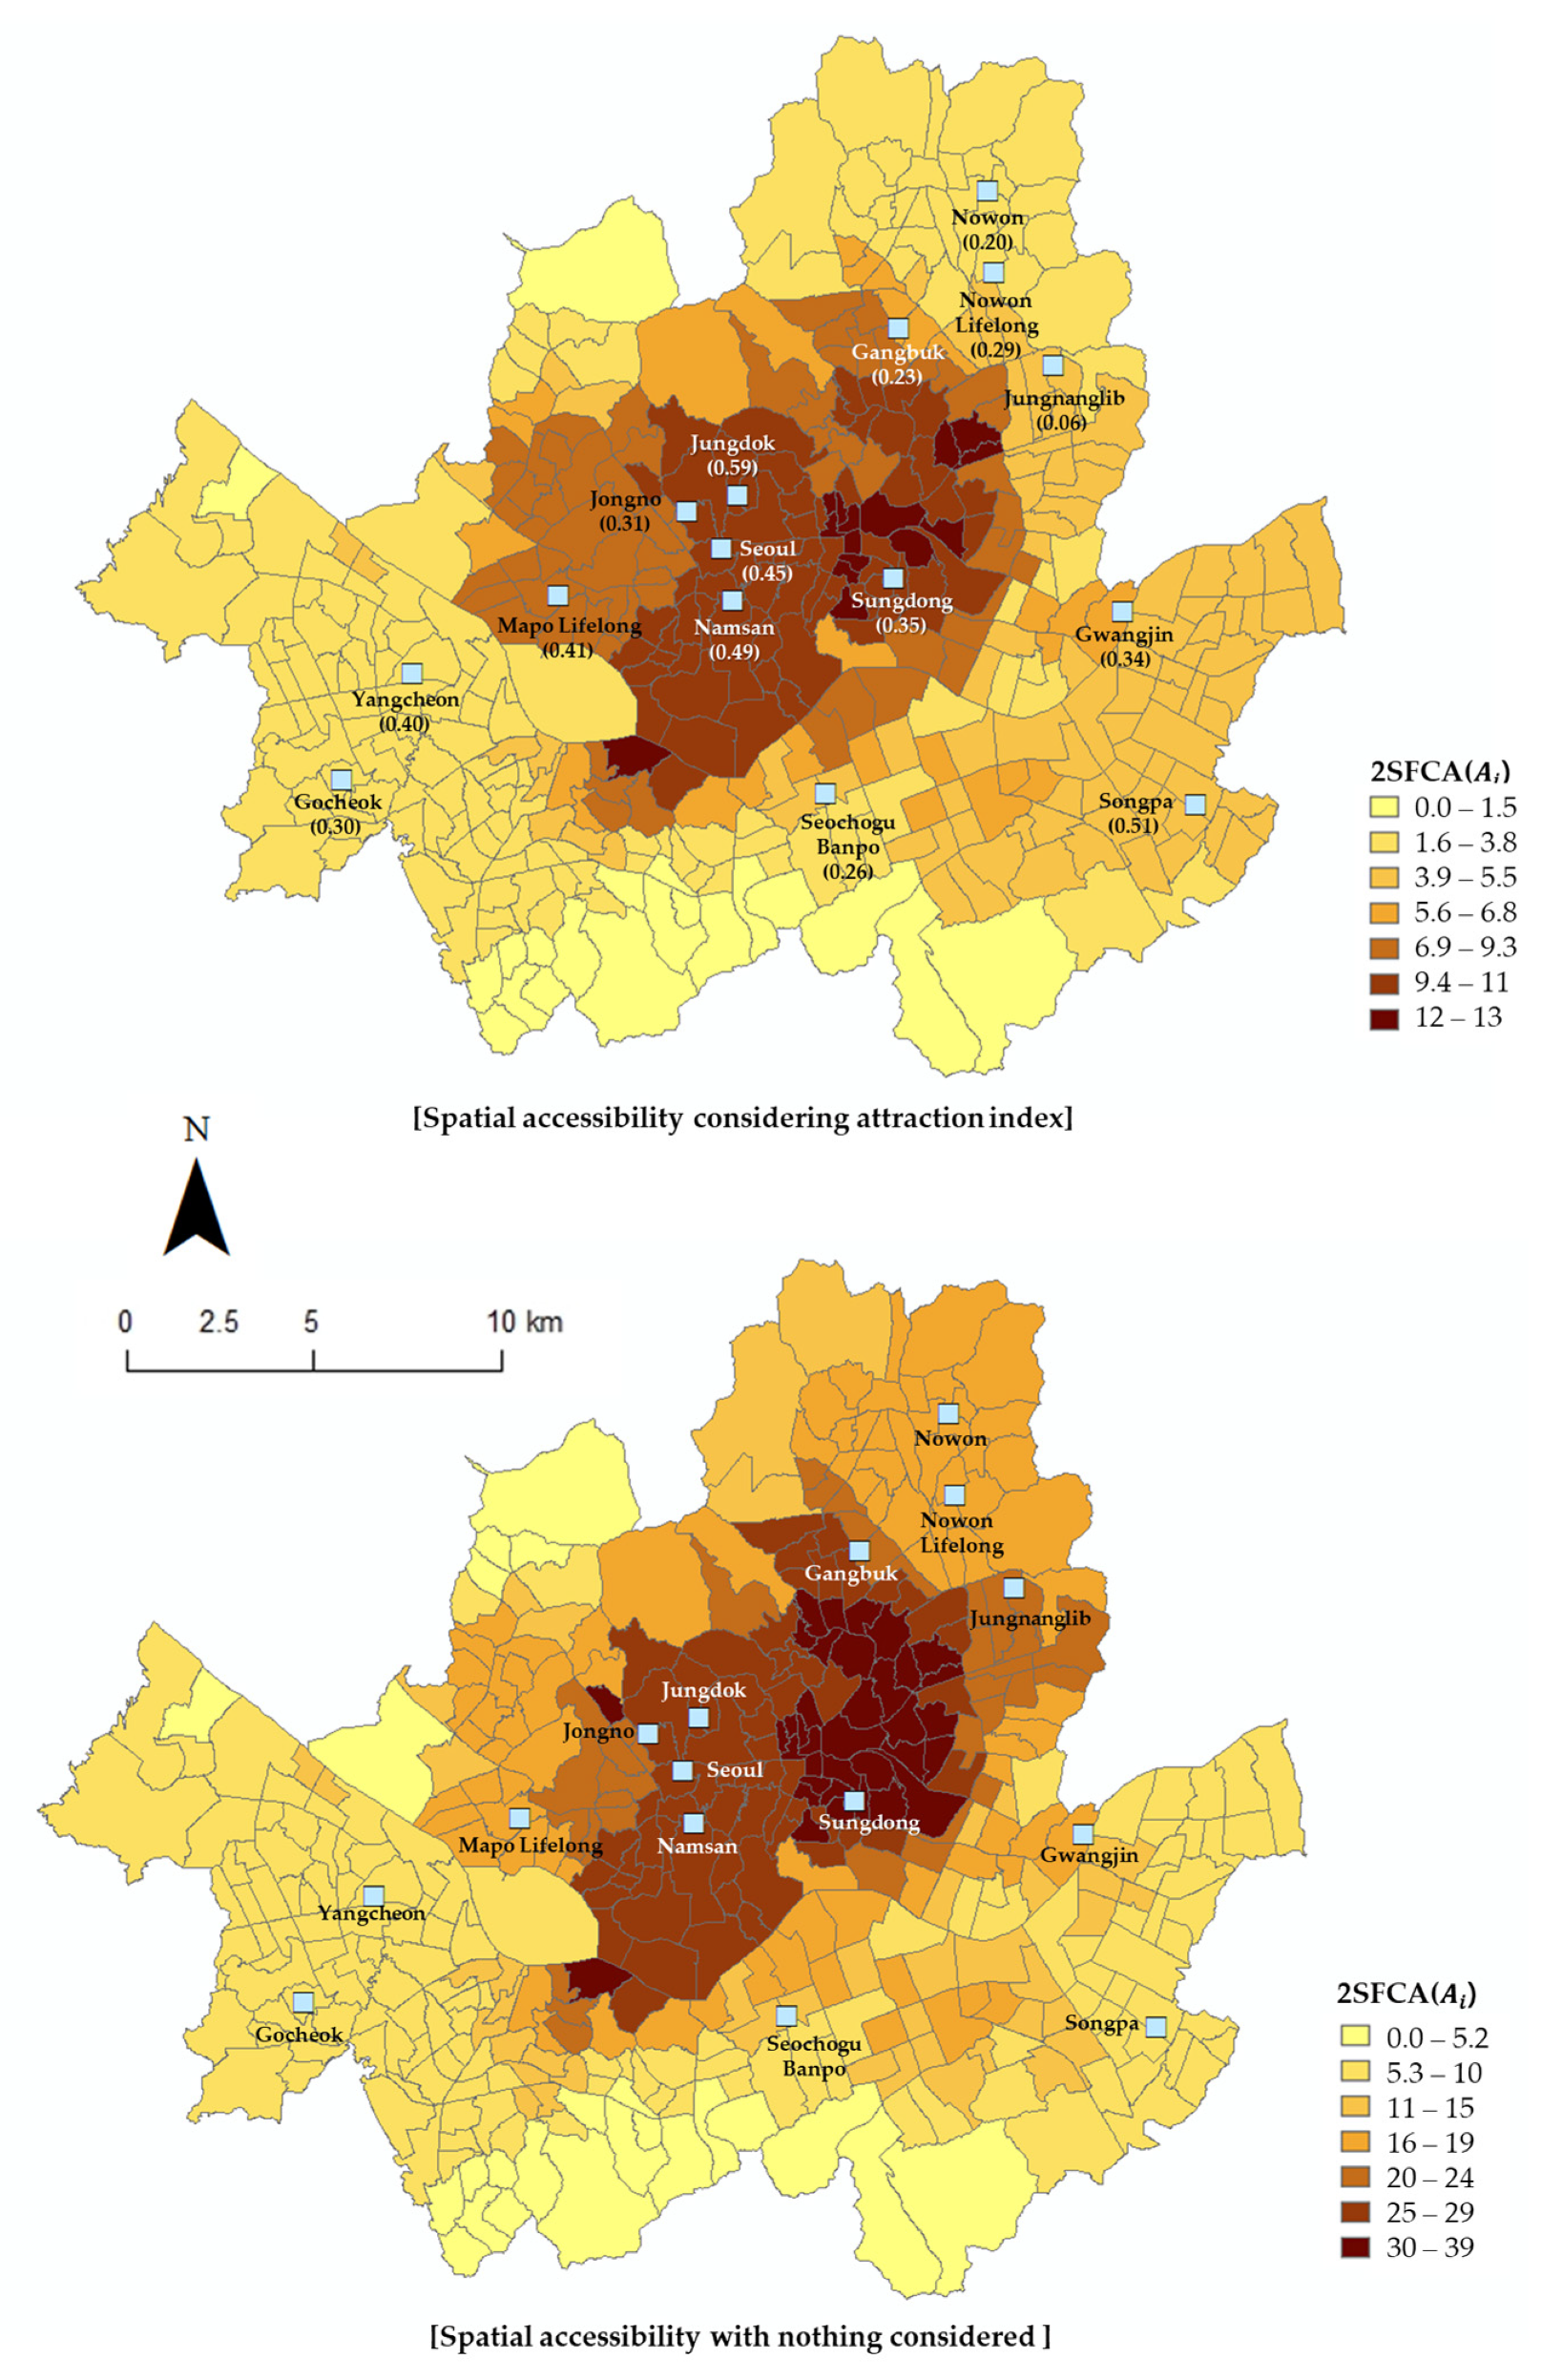
The experimental results are shown in Figure 5. As the final result of the spatial accessibility model, 2SFCA, the accessibility index for public library i was divided into seven sections using natural breaks, and was then mapped. means the access to public libraries available in each Eup, Myeon and Dong. Central Seoul, where many public libraries of the 15 that have the most visitors are located, has good accessibility, but the accessibility decreases as one travels to the outskirts. By comparing the cases in which the public library attractiveness index was applied and not applied, it was confirmed that the quality of the library affects the accessibility of the surrounding spaces.
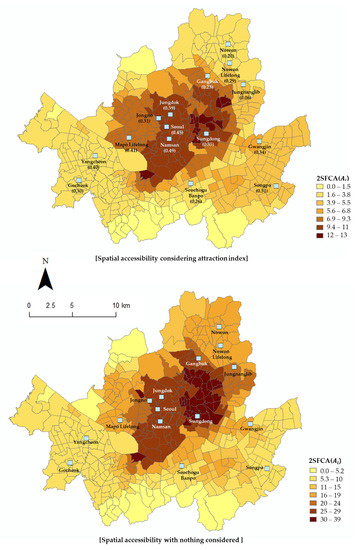
Figure 5.
Results for the spatial accessibility of the public libraries.
The overall patterns of the two pictures in Figure 5 are similar, but the spatial accessibility differs in a specific area. In the figure which does not consider the attractiveness index, the spatial accessibility was obtained simply from the physical distances of the public library. Therefore, the more public libraries located in a particular area, the higher the accessibility of that area. However, as shown in the figure on the left, considering the attractiveness index, the spatial accessibility is relatively high in the southeastern area of Seoul, where Songpa Library, which has a relatively high attractiveness index, is located, as well as in the central-western area of Seoul, where Jeongdok Library and Namsan Library are located. On the other hand, there are many libraries in the northeastern part of Seoul, such as the Nowon Library and Nowon Lifelong Library, which have relatively low attractiveness indices; however, this area had lower spatial accessibility than the comparative group. This is an example that proves the importance of qualitative expansion, considering the attractiveness index of users in terms of the supply of public libraries. Therefore, the experience of actual users can be improved by not only increasing the number of facilities but also by expanding public libraries to provide services that users want. In other words, in addition to the physical public library supply factors, such as books, materials, and the facilities and usage scale, the results of this study confirmed that providing services related to the surrounding environment, cultural programs, childcare, or public library image is important for public library accessibility.
5. Conclusions
5.1. The Accessibility Based on Attraction Index
An accessibility analysis was conducted by considering the attractive factors of public libraries in terms of supply that had been considered by some of the preceding studies on the accessibility of public facilities; this was done because it is more sustainable, in high density cities such as Seoul, ROK, to focus on the qualitative expansion rather than quantitative expansion of public libraries.
For the existing attractive factors, the user opinions were collected using questionnaires, while the attractiveness factors of the users were quantified using user-generated contents such as LBSM, based on which the accessibility of the public libraries was analyzed. For this purpose, this study targeted the top 15 public libraries with a good deal of user-generated contents among the public libraries in Korea. Based on the topics derived using LDA from the user-generated contents, the statistical data of the public libraries, a library image index based on sentiment analysis, and an attractiveness index that fused them were all calculated. In order to evaluate the effect of supply on accessibility, the populations at the Eup, Myeon and Dong level were counted as the demand side; the library supply side was applied as the attractive factor of the public library. Here, in order to evaluate either supply side, the attraction index affects the accessibility of the public libraries when comparing 2SFCA, and the attraction index of the comparison group was set as 1.
By applying this to public libraries in Seoul, the results showed that the accessibility was high in Songpa-gu, where Songpa Library, which only has a few libraries but also has a high attractiveness index, is located. By contrast, Nowon-gu, where Nowon Library and Nowon Lifelong Learning Center are located, has many libraries, but it also has a low attractiveness index and relatively low spatial accessibility. Therefore, this study showed that the important factors in the supply factor of public libraries are not only physical characteristics, such as books, materials and the facilities and usage scale, which have been shown to be important factors in traditional studies, but also the surrounding environment, cultural programs, childcare and public library image. Thus, this study confirmed that the number of public libraries is important for the information equality policy on the use of public libraries, and that it is important to provide various services so that users can access the library through user-generated content.
5.2. Limitations and Future Directions
This study is significant in that the attractive factors of public libraries as a supply factor were found using user-generated content analysis, not simply using questionnaire surveys. However, for the analysis of the accessibility, there is a limitation in that various aspects of supply and demand factors were not considered. Particularly, calculating the attractive factors, used as the supply factors, was difficult because the number of reviews from library users in the LSBM was limited. Nevertheless, according to the result obtained by the analysis which puts the attractive factor as the supply factor, visitors utilize the library with the help of library services. Regarding this, it is necessary to consider the library use due to various types of transportation, such as public transportation, private car, bicycle and so on. In addition, on the demand side, it is necessary to include not only the large-scale public libraries, but also various other libraries managed by the government, such as small neighborhood libraries that provide information and knowledge services to local residents in connection with public libraries, and to conduct analysis that considers not just the size of the population but also the population by age.
Author Contributions
Conceptualization, J.K. and J.L.; methodology, J.K. and J.L.; software, J.K. and J.L.; validation, J.K. and J.L.; investigation, J.K.; writing (original draft), J.K.; writing (review and editing), J.K. and J.L.; visualization, J.K. and J.L.; supervision, J.L.; project administration, J.K. Both authors have read and agreed to the published version of the manuscript.
Funding
This research was supported by the Basic Science Research Program through the National Research Foundation of Korea (NRF), funded by the Ministry of Education (No. 2020R1I1A1A01075363).
Institutional Review Board Statement
Not applicable.
Informed Consent Statement
Not applicable.
Data Availability Statement
Not applicable.
Conflicts of Interest
The authors declare no conflict of interest.
References
- Hertel, K.; Sprague, N. GIS and census data: Tools for library planning. Libr. Hi Tech. 2007, 25, 246–259. [Google Scholar] [CrossRef]
- Higgs, G.; Langford, M.; Fry, R. Investigating variations in the provision of digital services in public libraries using network-based GIS models. Libr. Inf. Sci. Res. 2013, 35, 24–32. [Google Scholar] [CrossRef]
- Soheili, F.D.K.; Khasseh, A.; Amini, M.; Rahimi, S. Investigating the rejuvenation of the children section of public libraries to enhance the attracton of user. Libr. Philos. Pract. 2019, 1–20. Available online: https://digitalcommons.unl.edu/libphilprac/2308 (accessed on 10 August 2021).
- Cole, K.J.G.; Gatrell, A.C. Public libraries in Salford: A geographical analysis of provision and access. Environ. Plan. A 1986, 18, 253–268. [Google Scholar] [CrossRef]
- Hawkins, A.M. Geographical Information Systems (GIS): Their use as decision support tools in public libraries and the integration of GIS with other computer technology. New Libr. World 1994, 95, 4–13. [Google Scholar] [CrossRef]
- Higgs, G.; Jones, S.; Langford, M.; Heley, J. Assessing the impacts of changing public service provision on geographical accessibility: An examination of public library provision in Pembrokeshire, South Wales. Environ. Plan. C Politics Space 2017, 36, 548–568. [Google Scholar] [CrossRef] [Green Version]
- Kinikin, J. Applying geographic information systems to the Weber County library system. Inf. Technol. Libr. 2004, 23, 102–107. [Google Scholar]
- Ottensmann, J.R. Evaluating equity in service delivery in library branches. J. Urban Aff. 1994, 16, 109–123. [Google Scholar] [CrossRef]
- Park, S.J. Measuring public library accessibility: A case study using GIS. Libr. Inf. Sci. Res. 2012, 34, 13–21. [Google Scholar] [CrossRef]
- Guo, Y.; Chan, C.H.; Yip, P.S.F. Spatial variation in accessibility of libraries in Hong Kong. Libr. Inf. Sci. Res. 2017, 39, 319–329. [Google Scholar] [CrossRef]
- Zhu, R.; Zhang, X.; Kondor, D.; Santi, P.; Ratti, C. Understanding spatio-temporal heterogeneity of bike-sharing and scooter-sharing mobility. Comput. Environ. Urban Syst. 2020, 81, 101483. [Google Scholar] [CrossRef]
- Lee, J.W.; Yu, K.Y.; Kim, J.Y. Accessibility analysis method based on public facility attraction index using SNS data. J. Korean Soc. Surv. Geod. Photogramm. Cartogr. 2019, 37, 29–42. (In Korean) [Google Scholar] [CrossRef]
- Donnelly, F.P. Regional variations in average distance to public libraries in the United States. Libr. Inf. Sci. Res. 2015, 37, 280–289. [Google Scholar] [CrossRef]
- Dummer, T.J. Health geography: Supporting public health policy and planning. Can. Med. Assoc. J. 2008, 178, 1177–1180. [Google Scholar] [CrossRef] [Green Version]
- Ni, J.; Liang, M.; Lin, Y.; Wu, Y.; Wang, C. Multi-mode Two-Step Floating Catchment Area (2SFCA) method to measure the potential spatial accessibility of healthcare services. ISPRS Int. J. Geo-Inf. 2019, 8, 236. [Google Scholar] [CrossRef] [Green Version]
- Wan, N.; Zou, B.; Sternberg, T. A three-step floating catchment area method for analyzing spatial access to health services. Int. J. Geogr. Inf. Sci. 2012, 26, 1073–1089. [Google Scholar] [CrossRef]
- Luo, J. Integrating the huff model and floating catchment area methods to analyze spatial access to healthcare services. Trans. GIS 2014, 18, 436–448. [Google Scholar] [CrossRef]
- Bryant, J.; Delamater, P.L. Examination of spatial accessibility at micro- and macro-levels using the enhanced two-step floating catchment area (E2SFCA) method. Ann. GIS 2019, 25, 219–229. [Google Scholar] [CrossRef] [Green Version]
- Wang, D.; Qiao, C.; Liu, S.; Wang, C.; Yang, J.; Li, Y.; Huang, P. Assessment of spatial accessibility to residential care facilities in 2020 in Guangzhou by small-scale residential community data. Sustainability 2020, 12, 3169. [Google Scholar] [CrossRef] [Green Version]
- Mao, L.; Nekorchuk, D. Measuring spatial accessibility to healthcare for populations with multiple transportation mode. Health Place 2013, 24, 115–122. [Google Scholar] [CrossRef]
- Langford, M.; Higgs, G.; Fry, R. Multi-modal two-step floating catchment area analysis of primary healthcare accessibility. Health Place 2016, 38, 70–81. [Google Scholar] [CrossRef]
- Li, Y.; Lin, Y.; Geertman, S.; Hooimeijer, P.; Xu, W. Accessibility-based equity of public facilities: A case study in Xiamen, China. Appl. Spat. Anal. Policy 2021. [Google Scholar] [CrossRef]
- Tao, Z.; Cheng, Y.; Liu, J. Hierarchical two-step floating catchment area (2SFCA) method: Measuring the spatial accessibility to hierarchical healthcare facilities in Shenzhen, China. Int. J. Equity Health 2020, 19, 164. [Google Scholar] [CrossRef]
- Cheng, Y.; Wang, J.; Rosenberg, M.W. Spatial access to residential care resources in beijing, China. Int. J. Health Geogr. 2012, 11, 32–42. [Google Scholar] [CrossRef] [Green Version]
- Delmelle, C.; Delmelle, E. Re-conceptualizing accessibility to parks in multi-modal cities: A variable-width floating catchment area (VFCA) method. Landsc. Urban Plan. 2015, 143, 90–99. [Google Scholar] [CrossRef]
- Rigolon, A. Parks and young people: An environmental justice study of park proximity, acreage, and quality in Denver, Colorado. Landsc. Urban Plan. 2017, 165, 73–83. [Google Scholar] [CrossRef]
- Xing, L.; Liu, Y.; Wang, B.; Wang, Y.; Liu, H. An environmental justice study on spatial access to parks for youth by using an improved 2SFCA method in Wuhan, China. Cities 2020, 96, 102405. [Google Scholar] [CrossRef]
- Bozorgi, P.; Eberth, J.M.; Eidson, J.P.; Porter, D.E. Facility Attractiveness and Social Vulnerability Impacts on Spatial Accessibility to Opioid Treatment Programs in South Carolina. Int. J. Environ. Res. Public Heath 2021, 18, 4246. [Google Scholar] [CrossRef] [PubMed]
- Lee, T.; Hong, T. Integrated sentiment classification model using SVM+ MTL: Application to the customer review of online store. Entrue J. Inf. Technol. 2017, 16, 81–95. Available online: https://kiss.kstudy.com/thesis/thesis-view.asp?key=3543588 (accessed on 10 August 2021).
- Bae, J.H.; Son, J.E.; Song, M. Analysis of twitter for 2012 South Korea presidential election by text mining techniques. J. Intell. Inf. Syst. 2013, 19, 141–156. [Google Scholar] [CrossRef]
- Blei, D.M. Probabilistic topic models. Commun. ACM 2012, 55, 77–84. [Google Scholar] [CrossRef] [Green Version]
- Appel, O.; Chiclana, F.; Carter, J. Main concepts, state of the art and future research questions in sentiment analysis. Acta Polytech. Hung. 2015, 12, 87–108. [Google Scholar] [CrossRef]
- Ferguson, P.; O’Hare, N.; Davy, M.; Bermingham, A.; Sheridan, P.; Gurrin, C.; Smeaton, A.F. Exploring the use of paragraph-level annotations for sentiment analysis of financial blogs. In Proceedings of the WOMAS 209-Workshop on Opinion Mining and Sentiment Analysis, Seville, Spain, 13 November 2009; Available online: http://sites.google.com/site/womsa09/ (accessed on 10 August 2021).
- Lochter, J.V.; Zanetti, R.F.; Reller, D.; Almeida, A.T. Short text opinion detection using ensemble of classifiers and semantic indexing. Expert Syst. Appl. 2016, 62, 243–249. [Google Scholar] [CrossRef]
- Pak, A.; Paroubek, P. Twiter as a corpus for sentiment analysis and opinion mining. In Proceedings of the Seventh International Conference on Language Resources and Evaluation (LREC’10), Valletta, Malta, 17–23 May 2010; Available online: http://www.lrec-conf.org/proceedings/lrec2010/pdf/385_Paper.pdf (accessed on 10 August 2021).
- Pang, B.; Lee, L.; Vaithyanathan, S. Thumbs up? Sentiment Classification using Machine Learning Techniques. In Proceedings of the 2002 Conference on Empirical Methods in Natural Language Processing (EMNLP 2002), University of Pennsylvania, Philadelphia, PA, USA, 6–7 July 2002. [Google Scholar] [CrossRef] [Green Version]
- Liu, B. Sentiment Analysis: Mining Opinions, Sentiments, and Emotions, 2nd ed.; Cambridge University Press: Cambridge, NY, USA, 2020. [Google Scholar]
- Basiri, M.E.; Ghasem-Aghaee, N.; Reza, A. Lexicon-based sentiment analysis in Persian. Curr. Future Dev. Artif. Intell. 2017, 1, 154–183. [Google Scholar] [CrossRef]
- Moraes, R.; Valiati, J.F.; Neto, W.P.G. Document-level sentiment classification: An empirical comparison between SVM and ANN. Expert Syst. Appl. 2013, 40, 621–633. [Google Scholar] [CrossRef]
- Xu, J.; Danlu, C.; Qiu, X.; Huang, X. Cached long short-term memory neural networks for document-level sentiment classification. In Proceedings of the 2016 Conference on Empirical Methods in Natural Language Processing (EMNLP 2016), Austin, TX, USA, 1–4 November 2016. [Google Scholar] [CrossRef] [Green Version]
- Chatterjee, A.; Gupta, U.; Chinnakotla, M.K.; Srikanth, R.; Galley, M.; Agrawal, P. Understanding emotions in text using deep learning and big data. Comput. Hum. Behav. 2019, 93, 309–317. [Google Scholar] [CrossRef]
- Zhou, X.; Wan, X.; Xiao, J. Attention-based LSTM network for cross-lingual sentiment classification. In Proceedings of the EMNLP 2016-Conference on Empirical Methods in Natural Language Processing (EMNLP 2016), Austin, TX, USA, 1–4 November 2016. [Google Scholar] [CrossRef]
- He, R.; Lee, W.S.; Ng, H.T.; Dahlmeier, D. Exploiting document knowledge for aspect-level sentiment classification. In Proceedings of the 56th Annual Meeting of the Association for Computational Linguistics (Volume 2: Short Papers), Melbourne, Australia, 15–20 July 2018. [Google Scholar] [CrossRef] [Green Version]
- Rhanoui, M.; Mikram, M.; Yousfi, S.; Barzali, S. A CNN-BiLSTM model for document-level sentiment analysis. Mach. Learn. Knowl. Extr. 2019, 1, 832–847. [Google Scholar] [CrossRef] [Green Version]
- Basiri, M.E.; Nemati, S.; Abdar, M.; Cambria, E.; Acharya, U.R. ABCDM: An attention-based bidirectional CNN-RNN deep model for sentiment analysis. Future Gener. Comput. Syst. 2021, 115, 279–294. [Google Scholar] [CrossRef]
- Luo, W. Using a GIS-based floating catchment method to assess areas with shortage of physicians. Health Place 2004, 10, 1–11. [Google Scholar] [CrossRef]
- McGrail, M.R.; Humphreys, J.S. Measuring spatial accessibility to primary care in rural areas: Improving the effectiveness of the two-step floating catchment area method. Appl. Geogr. 2009, 29, 533–541. [Google Scholar] [CrossRef]
- MCST. A Manual on Construction and Management for Public Libraries; MCST: Sejong-si, Korea, 2019. (In Korean) [Google Scholar]
Publisher’s Note: MDPI stays neutral with regard to jurisdictional claims in published maps and institutional affiliations. |
© 2021 by the authors. Licensee MDPI, Basel, Switzerland. This article is an open access article distributed under the terms and conditions of the Creative Commons Attribution (CC BY) license (https://creativecommons.org/licenses/by/4.0/).