1. Introduction
A pneumonia outbreak of unknown cause, detected in Wuhan, China, was first reported to the World Health Organization (WHO) Country Office in China on 31 December 2019. By 2 January 2020, 41 admitted patients with confirmed infections by this virus, now named Corona Virus Disease 2019 (COVID-19), had been identified in hospitals in China [
1]. At 10:00 on 23 January 2020, Wuhan New Coronavirus Epidemic Prevention and Control Headquarters announced that the city bus, subway, ferry and long-distance passenger transport were suspended. The airport and train stations were temporarily closed. Wuhan was put into lockdown. Case numbers in China stabilized at around 80,000 by mid-February [
2]. On 12 March 2020, WHO declared COVID-19 to be a global health emergency [
3]. There have been 94,963,847 confirmed cases of COVID-19 globally, including 2,050,857 deaths, reported to the WHO on 20 January 2021 [
4].
Since the beginning of this pandemic, researchers across the world have shown great interest in understanding its influences and driving mechanisms. It is widely acknowledged that saliva, nasal discharge, or airborne particles lead to the spread of COVID-19 [
5,
6,
7], while person-to-person transmission has been proved to be the likely route [
8,
9,
10,
11]. Elderly people and children are at a higher risk of coronavirus infection [
12,
13,
14,
15,
16]. In particular, it has also been found that weather factors, mainly including temperature, wind speed and humidity, are considered as the main predictors of coronavirus disease, due to the viability, transmission and range of spread of the virus [
17].
However, most of those studies address the impact between a single climatic factor and COVID-19 incidences [
18,
19,
20]. The interaction of those climatic parameters with COVID-19 is still unknown. Climatic factors are characterized by regional differences. Each climatic factor does not exist alone, and multiple factors often interact with each other. In addition, Wuhan was the first city where the virus was discovered. However, the spatiotemporal characteristics and climatic factors of COVID-19 in Wuhan have not been explored. Therefore, to fill this research gap, this paper has analyzed in detail the correlation between multiple meteorological factors and COVID-19 in Wuhan, which can hopefully provide new insights for policymakers and medical institutions regarding the real-life situation, to better determine the key intervention measures and the optimal allocation of health care resources accordingly.
The remainder of the paper is organized as follows. Firstly, the related literature is reviewed. Secondly, the spatial correlation and differences of the incidence rate of COVID-19 in Wuhan are analyzed by using global spatial autocorrelation. Thirdly, local Getis–Ord is used to conduct hotspot detection, to analyze its local autocorrelation. Based on this detection, the influence of climatic factors on incidence rate is analyzed by comparing the traditional linear regression model with geographically weighted regression (GWR). Fourthly, the interaction between multiple meteorological factors and COVID-19 is further identified by a geographic detector. Finally, the conclusions of this study are given.
2. Climatic Indicators and COVID-19
Recent literature has demonstrated that different climatic indicators, such as temperature, humidity, and wind speed, can significantly affect the number of COVID-19 cases and mortality [
21,
22].
The majority of studies show that the relationship between temperature and COVID-19 cases is mostly place- and facility-specific [
18]. A significant relationship is found between average and minimum temperatures in COVID-19 cases in New York [
23]. It was observed that the increase of one unit in the daytime temperature range resulted in a decrease in the number of COVID-19 cases by approximately 6.4 times in Italy [
19]. Lower temperature levels are related to the higher number of COVID-19 cases on a particular day, according to the study in Turkey [
21]. A study conducted in 17 different cities of China advocated that a 1 °C increase in ambient temperature and diurnal temperature range was associated with a decrease in the number of daily confirmed cases [
22]. However, in one study conducted in Jakarta, Indonesia, no correlation between temperature and the number of COVID-19 cases was found [
20].
There is also a body of literature that considers humidity as one of the crucial atmospheric factors in predicting the transmission of COVID-19. Humidity is proved to have a negative relationship with the virus outbreak speed [
19]. Another study shows that absolute humidity has significant negative effects on confirmed case counts for four cities in China [
22]. It was suggested that the relation between humidity and the number of COVID-19 cases was the most significant on the particular day of the study in Turkey. This indicates that an increase in humidity results in a decline in the number of COVID-19 cases [
21]); however, no significant association between COVID-19 cases and absolute humidity was found in China [
24].
There is relatively less research on the relationship between wind speed and the spread of COVID-19. The low speed of the wind was observed to be significant [
19]. One study showed that there was no significant correlation between wind speed and the number of COVID-19 cases [
23]. However, it is interesting to find that the average wind speed over 14 days has the highest correlation with the number of COVID-19 cases in Turkey. Higher wind speed was also related to a greater number of cases [
21].
The correlation between rainfall and the number of COVID-19 cases has also been examined in many studies. Evidence shows that rainfall is negatively and weakly correlated with the spread of COVID-19 [
23]. However, some countries with higher rainfall showed an increase in the number of COVID-19 cases. It is advocated that an increase of one inch of rainfall per day was associated with an increase of 56 COVID-19 cases per day [
25]. No correlation between rainfall and the number of COVID-19 cases was found in Iran [
19], which is consistent with the study in Indonesia [
20].
The literature mentioned above has improved our understanding of the spread of COVID-19. However, there are still some gaps that need to be addressed. On the one hand, the existing literature mainly used correlation and regression analysis methods, but geographically weighted regression, which can show spatial distribution characteristics, has been largely neglected. On the other hand, the interaction of those climatic parameters with COVID-19 has barely been studied, which falls short of revealing a deeper understanding of the dynamics of the pandemic. Therefore, in this study, the interaction of those climatic parameters is emphasized by using the geographic detector and GWR model, which contributes to addressing those gaps.
3. The Study Area
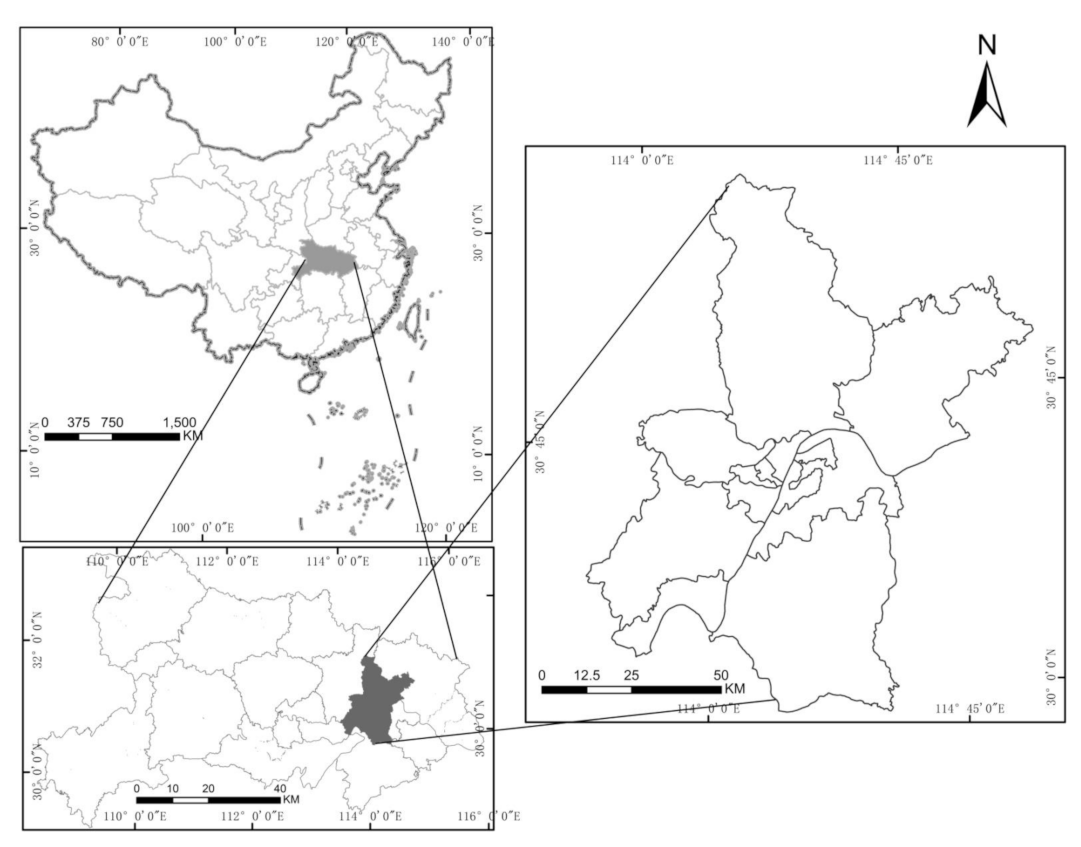
Wuhan is the capital of Hubei Province in central China (
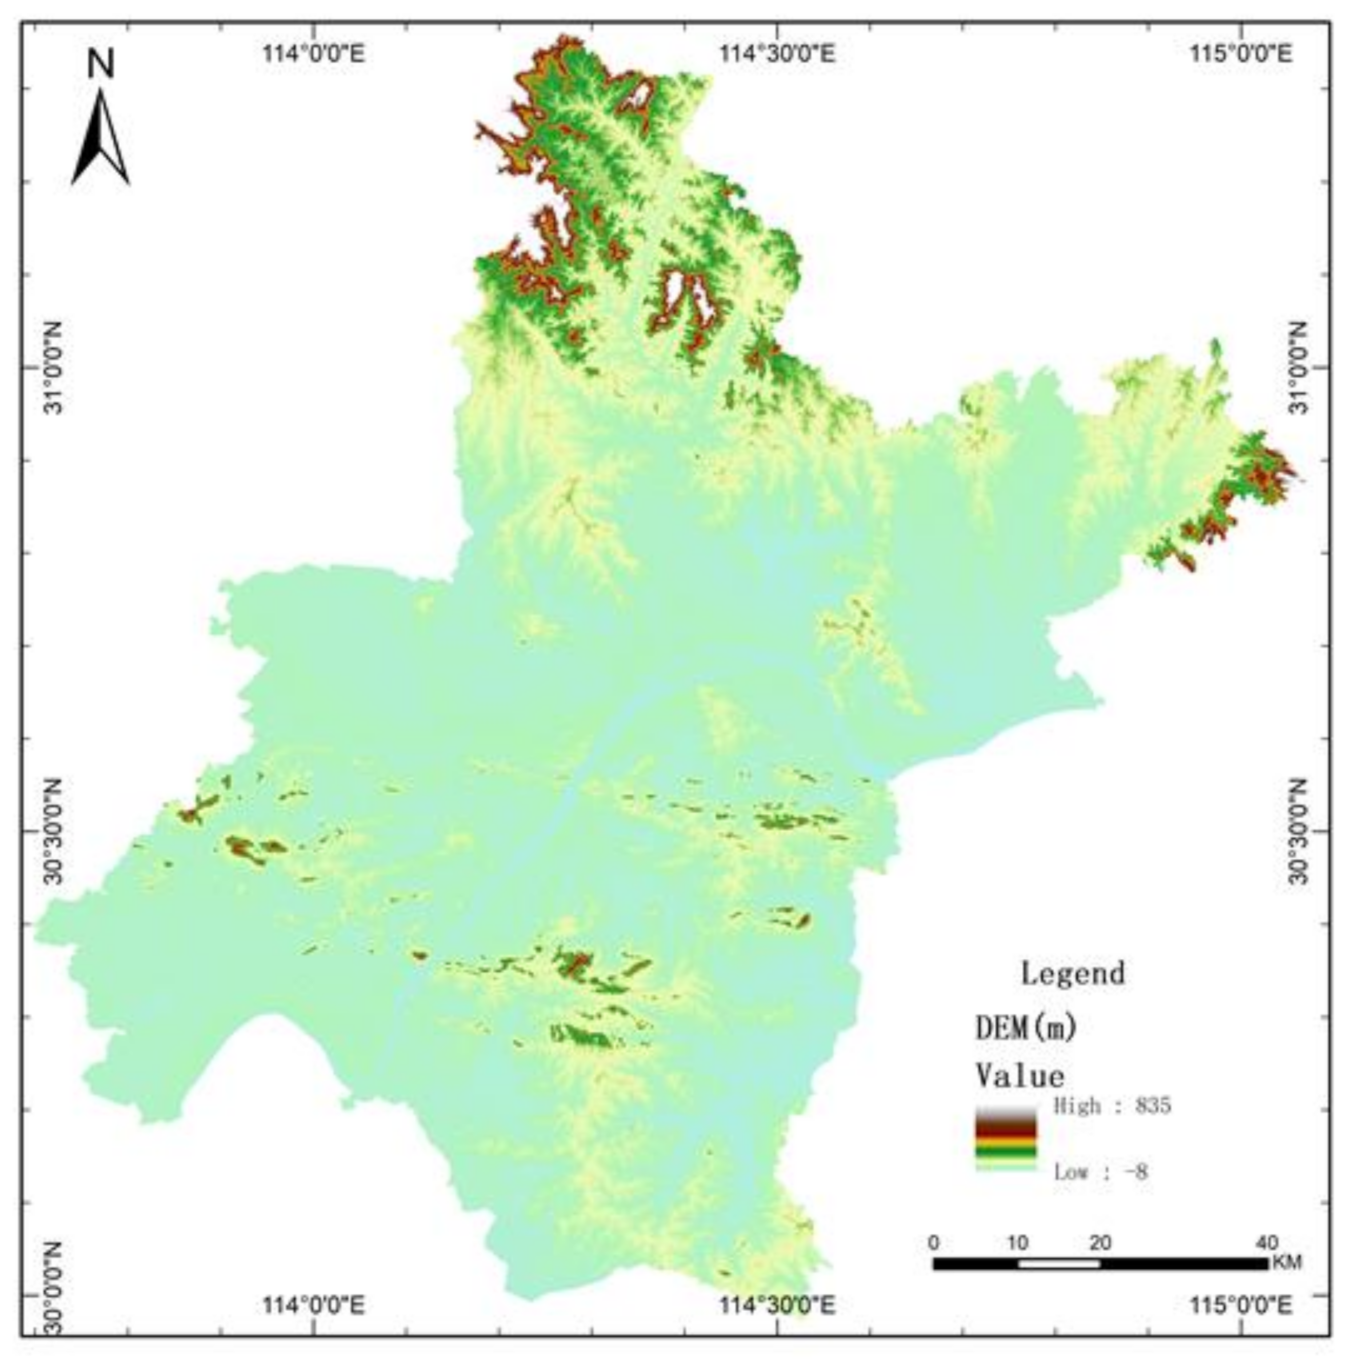
Figure 1). It is located in the east of Hubei Province, at the intersection of the Yangtze River and the Hanshui River. Its geographical location is 29°58′–31°22′ N and 113°41′–115°05′ E. The distance from the east to the west of Wuhan is 134 km, and it is about 155 km from the north to the south at its maximum extent. Wuhan is topographically flat in the central portion, surrounded by hills and ridges to the north and south, and low mountains to the north (
Figure 2). The areas of low mountains, hills, ridges and elevated plains, and flat plains in the city, account for 5.8%, 12.3%, 42.6% and 39.3% of the total land area, respectively. The altitude ranges from 19.2 m to 873.7 m, but most of the area is below 50 m [
26].
Wuhan has a monsoon (humid) climate in the north subtropical zone, which is characterized by abundant rainfall and heat. It has four distinct seasons, with a cold winter and hot summer. The annual average temperature in Wuhan is 15.8–17.5 °C. The annual rainfall is 1150–1450 mm, and the rainfall is concentrated from June to August, accounting for about 40% of the annual rainfall [
26].
Wuhan is divided into 13 administrative districts, comprising Jiang’an District, Jianghan District, Qiaokou District, Hanyang District, Wuchang District, Qingshan District, Hongshan District, Caidian District, Jiangxia District, Huangpi District, Xinzhou District, Dongxihu District and Hannan District [
26]. At the end of 2019, Wuhan had a total area of 8569.15 square kilometers and a population of 11.21 million, including 9.02 million urban residents, accounting for 80.49% of the total population [
27].
4. Data and Methods
4.1. Experimental Data and Pretreatment
4.1.1. Data Regarding COVID-19 and Preprocessing
The data regarding COVID-19 in Wuhan were obtained from the official website of the Hubei Center for Disease Control and Prevention (
http://www.hbcdc.com/ accessed on 22 October 2020. The data includes the number of newly discharged cases, the number of newly fatal cases, the number of suspected cases, the total number of confirmed cases and the number of newly confirmed cases in each district. The time span covered was from 21 February 2020 to 17 March 2020. Using this basic information, the method of geocoding was used to transform it into spatial data that could be used for GIS analysis. Considering the effect of population base differences on the spread of COVID-19, the concept of incidence rate in epidemiology was introduced so that the incidence level could be more accurately reflected [
28]. The incidence rate refers to the proportion of morbidity of the total population in a certain area and within a certain period. Therefore, the district is used as the spatial unit of incidence rate. Meanwhile, in order to avoid an analysis error caused by the insufficient data of small samples, the time unit of incidence rate used in this paper is on a daily scale. The formula for the incidence rate is as follows, and the unit is 1/100,000.
The zero value in the case data was interpolated. Meanwhile, in order to eliminate the effect of heteroscedasticity, the incidence rate was calculated logarithmically [
29]. The population data of each district in Wuhan city was obtained according to the statistical data of the Hubei Provincial Bureau of Statistics in 2020.
4.1.2. Meteorological Data and Preprocessing
The meteorological data used in this paper were from 85 meteorological stations in Hubei Province (
Figure 3). The data provided by each station were by day, including temperature, relative humidity, wind speed, rainfall and air pressure. Relevant studies have shown that there are correlations between meteorological factors, such as temperature, relative humidity, wind speed, and rainfall, and the morbidity of COVID-19 [
24,
25,
30]. Therefore, the above four types of meteorological elements were taken as explanatory variables. In addition, considering the correlation of air pressure with other meteorological factors, these were also taken as explanatory variables. The ordinary Kriging spatial interpolation method is used to process the daily meteorological data, and the grid interpolation results of each meteorological element, with 500 m spatial resolution, were obtained. The average values of meteorological data by day and district were obtained using ArcGIS 10.4 software.
4.2. Research Methods
4.2.1. Geographical Detection
Geographical detection is a method proposed by Wang Jinfeng et al. from the Institute of Geographical Sciences and Resources, Chinese Academy of Sciences [
31], and is mainly used to detect spatial differentiation and reveal the driving forces behind it. The geographical detector includes four detectors, of which the differentiation and factor detector is used mainly to detect the spatial differentiation of a geographical object Y, and the extent to which the detection of the geographical factor X reveals the spatial differentiation of the geographical object Y. The basic idea of differentiation and the factor detector is to divide the research area into several sub-areas. If the sum of the variance of the sub-area is less than the total variance of the area, there is spatial differentiation. Therefore, this method can be used to analyze the overall difference degree between different types of regions in space. The interaction detector is mainly used to identify the interaction between different risk factors (X
S), that is, to evaluate whether the combined action of factors X
1 and X
2 will increase or decrease the explanatory power of the dependent variable Y, or whether the influence of these factors on Y is independent of each other. The evaluation method is to first calculate the
q value of two factors X
1 and X
2 to Y (
q (X
1) and
q (X
2)), calculate the
q value of their interaction (
q (X
1 ∩ X
2)), and compare
q (X
1),
q (X
2) and
q (X
1 ∩ X
2). The specific formula of the geographical detector is as follows:
where
q is a measure of spatial differentiation;
h =1, 2…,
L is the number of classifications;
Nh and
N are the number of sample units in layer
h and the whole region, respectively; and
σh and
σ are the variance of layer
h and the whole region, respectively. The value range of
q is (0,1). The larger the value of
q, the more obvious the spatial differentiation.
4.2.2. Spatial Autocorrelation Analysis
Spatial autocorrelation analysis is used to study whether there is a correlation between the observations of a spatial unit and those of its adjacent units. It is a measure of the aggregation degree of the observations of a spatial unit [
32]. It can be divided into global spatial autocorrelation analysis and local spatial autocorrelation analysis [
33]. Among these, global spatial autocorrelation analysis is used to analyze the average correlation degree, spatial distribution pattern and significance of each unit in the whole study area. Local spatial autocorrelation is used to diagnose whether there are different spatial aggregation patterns in the local spatial region, and to explore the heterogeneity of the data [
34]. In this paper, the Global Moran’s
I index is used to analyze the spatial correlation and difference of the incidence rate of COVID-19 in Wuhan:
In the formula, S2 represents and wij represents a space adjacency matrix. When the entity, I, is topologically adjacent to the entity, J, with a common edge, the value is 1. Otherwise, it is 0. n is the number of units; xi or xj is the new incidence rate of i or j for a certain area unit; is the mean of all regional incidence rates; and W is the spatial weight matrix. The value range of Moran’s I index is [−1,1]. At a given significance level, a positive value represents a positive correlation of the overall distribution. The larger the value, the closer the relationship between the spatial units, and the more similar the property, and vice versa. When Moran’s I index is 0, it means that there is no spatial correlation, and the observation objects are randomly distributed in space.
Local Getis–Ord
is used to detect hotspots, and its local autocorrelation is analyzed. The index can clearly reflect the hotspot distribution of observations in local space. The calculation formula is as follows:
In this formula, s is the standard deviation of the incidence rate in the whole area. The larger the absolute value of , the higher the degree of aggregation of the study area, forming a hot area. When the index is positive, it is an aggregation of high value. Otherwise, it is an aggregation of low value.
4.2.3. Geographically Weighted Regression
Geographically weighted regression is a method to study the quantitative relationship among multiple variables with spatial distribution characteristics, by using the regression principle. As is different from the ordinary linear regression model (OLS), the GWR model can explore the non-stationarity of a spatial relationship according to the change of parameter estimation value with geographical location, by incorporating spatial location information into the regression equation:
where (
ui,
vi) is the coordinate of the sampling point
I;
βk(
ui,
vi) is the regression parameter of
I;
is the intercept of
i, indicating the expected value of the dependent variable when all explanatory variables are zero; and
εi is the residual of
i.
5. Results and Analysis
5.1. Temporal and Spatial Distribution of COVID-19
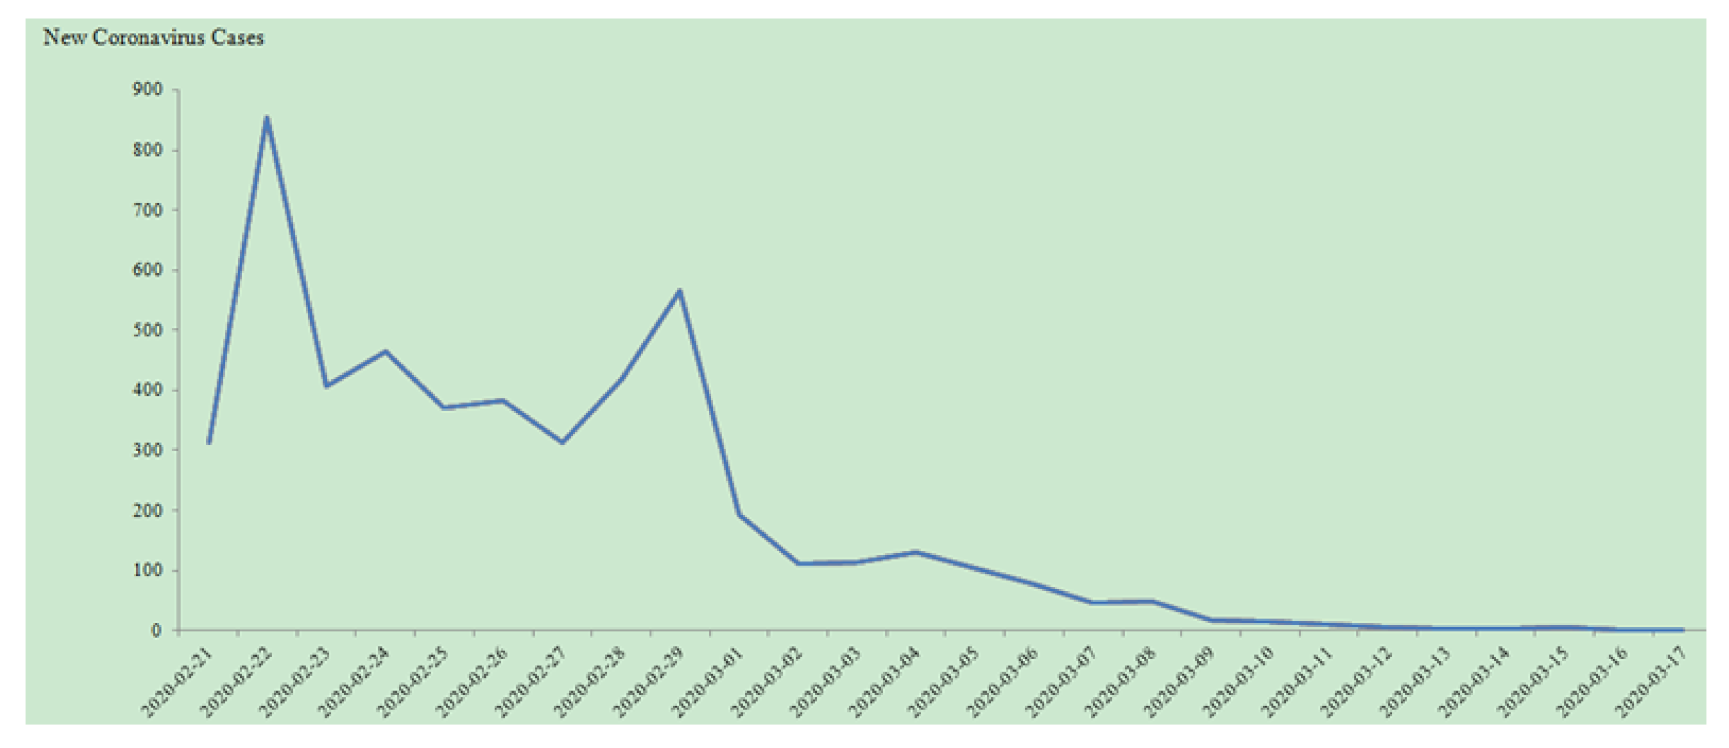
From 21 February 2020 to 17 March 2020, the time sequence of the number of newly confirmed cases in Wuhan is shown in
Figure 4. According to this, the spread of COVID-19 in Wuhan can be divided into four stages. Stage A included 21 February and 22 February 2020, when COVID-19 was still in the outbreak period. At this time, the number of newly confirmed cases was still large, and it then rose sharply, reaching a peak on 22 February 2020. Stage B was from 23 February to 27 February 2020. At this stage, the government strengthened its control, which alleviated the spread of COVID-19 to a certain extent, and the number of newly confirmed cases fell sharply for a short time. Stage C included 28 February and 29 February 2020. At the end of February, the number of newly confirmed cases reached a peak again. Stage D was from 1 March to 17 March 2020. At the beginning of March, the epidemic situation was gradually alleviated with the intervention of human prevention and control measures. Newly confirmed cases continually go down in number.
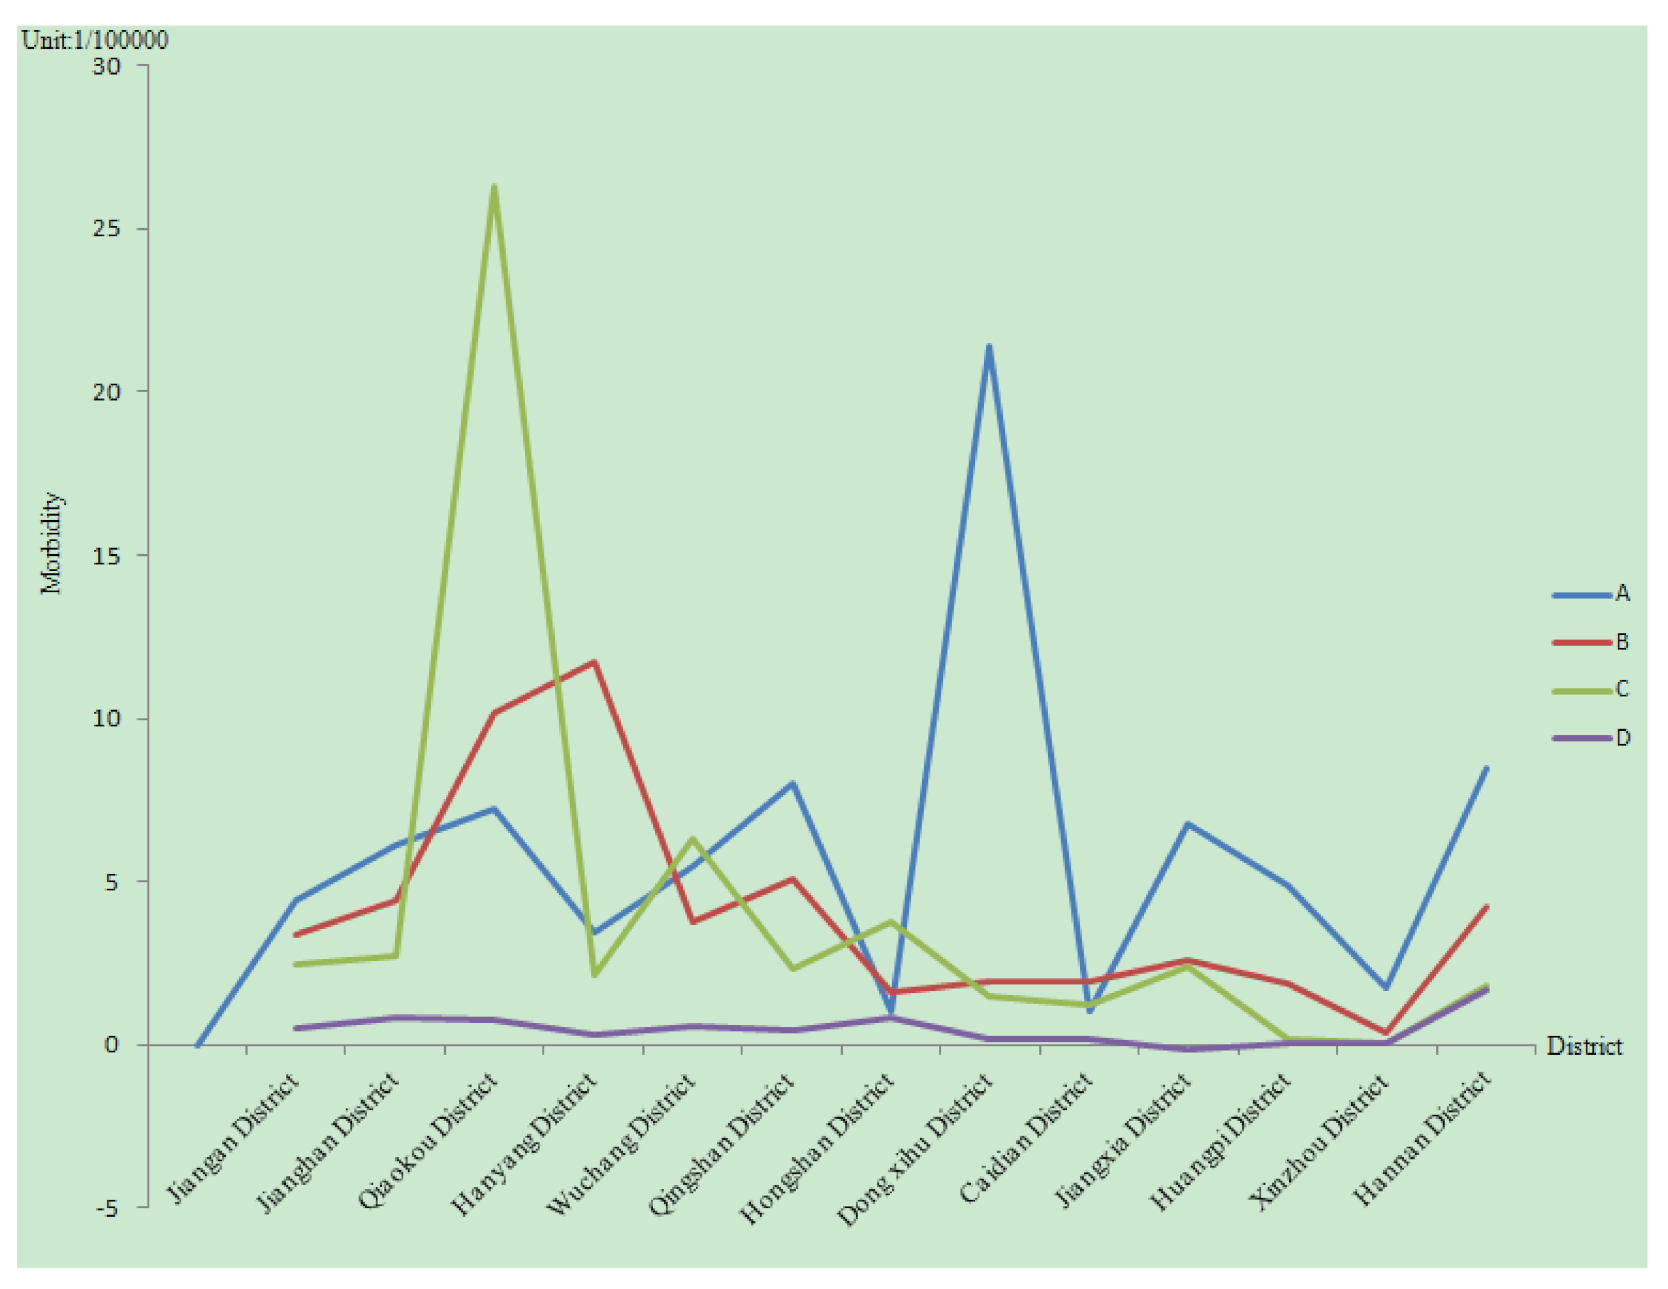
According to the zonal distribution of the morbidity of COVID-19 in Wuhan (
Figure 5), the morbidity of COVID-19 had a strong spatial aggregation, mainly concentrated in the central area of Wuhan City, such as Hanyang District, Qiaokou District and Hongshan District, and scattered in the areas far away from the center.
The average incidence rate of these four stages was calculated. In order to verify whether there are significant differences in incidence rate at these four stages, the geographical detector was used. In the model, Y is the incidence rate of different stages, and X is the number of stages. It is calculated that the q value is about 0.431, and the p-value is 0, which shows that the incidence rate of these four stages shows a strong differentiation and is greatly significant. The morbidity of the COVID-19 in Wuhan was irregular as a whole, but there was a noticeable phenomenon of agglomeration in some areas. The morbidity of the city center was high for a long time, and it was unstable in suburban districts.
5.2. Spatial Distribution of the COVID-19
In order to quantitatively evaluate the spatial aggregation of morbidity of COVID-19, the global Moran’s
I index is calculated and its corresponding significance test for morbidity is carried out in four stages through the global spatial autocorrelation statistical model, as shown in
Table 1. From this, it is known that the spatial distribution of the incidence rate tends to spatial aggregation in the four stages from 21 February 2020 to 17 March 2020. The Moran’s
I index in stage D, which is less than 0.1, is relatively low. The global spatial correlation at this stage is also weaker than at other stages. The Z values of stage B and stage C are greater than 1.96 at a significance level of 0.05, showing statistical significance. The spatial distribution pattern shows aggregation. The Z values of stage A and stage D are less than 1.96, which is not statistically significant. Combined with the spatial distribution characteristics of the incidence rate at different stages, it can be seen that the spatial autocorrelation of the early stage and the last stage of morbidity of COVID-19 in Wuhan is weaker than the later stages. However, on the whole, it presents the characteristics of spatial aggregation.
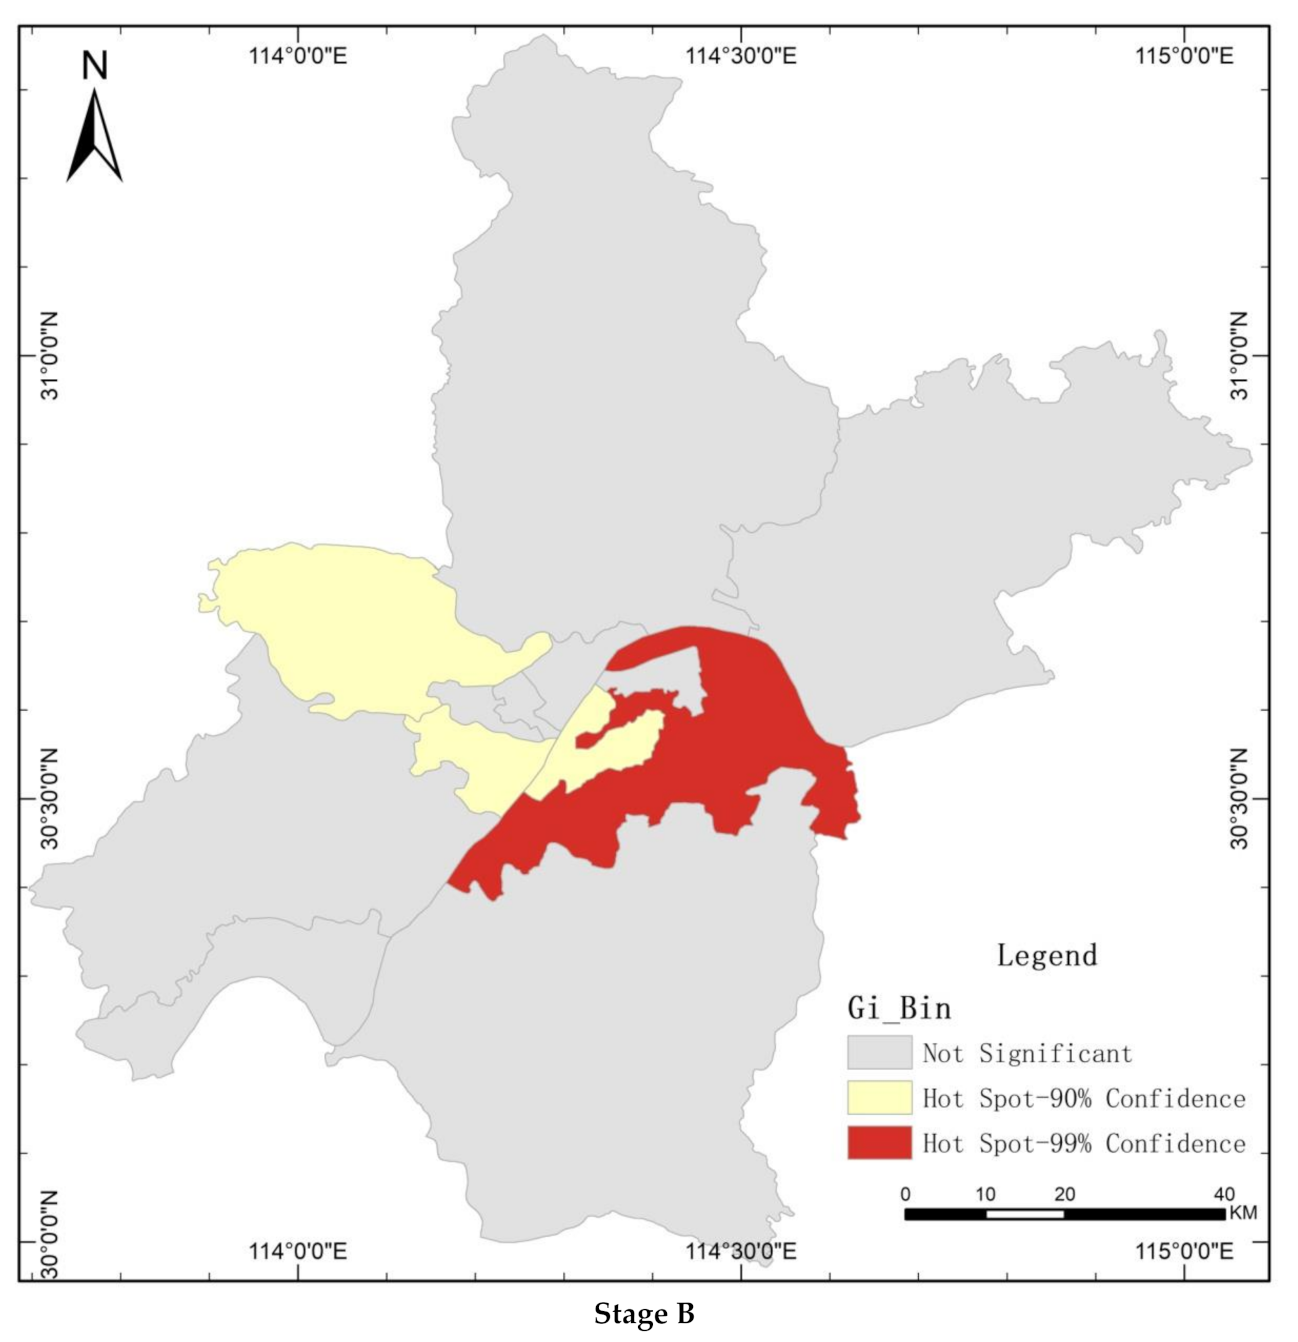
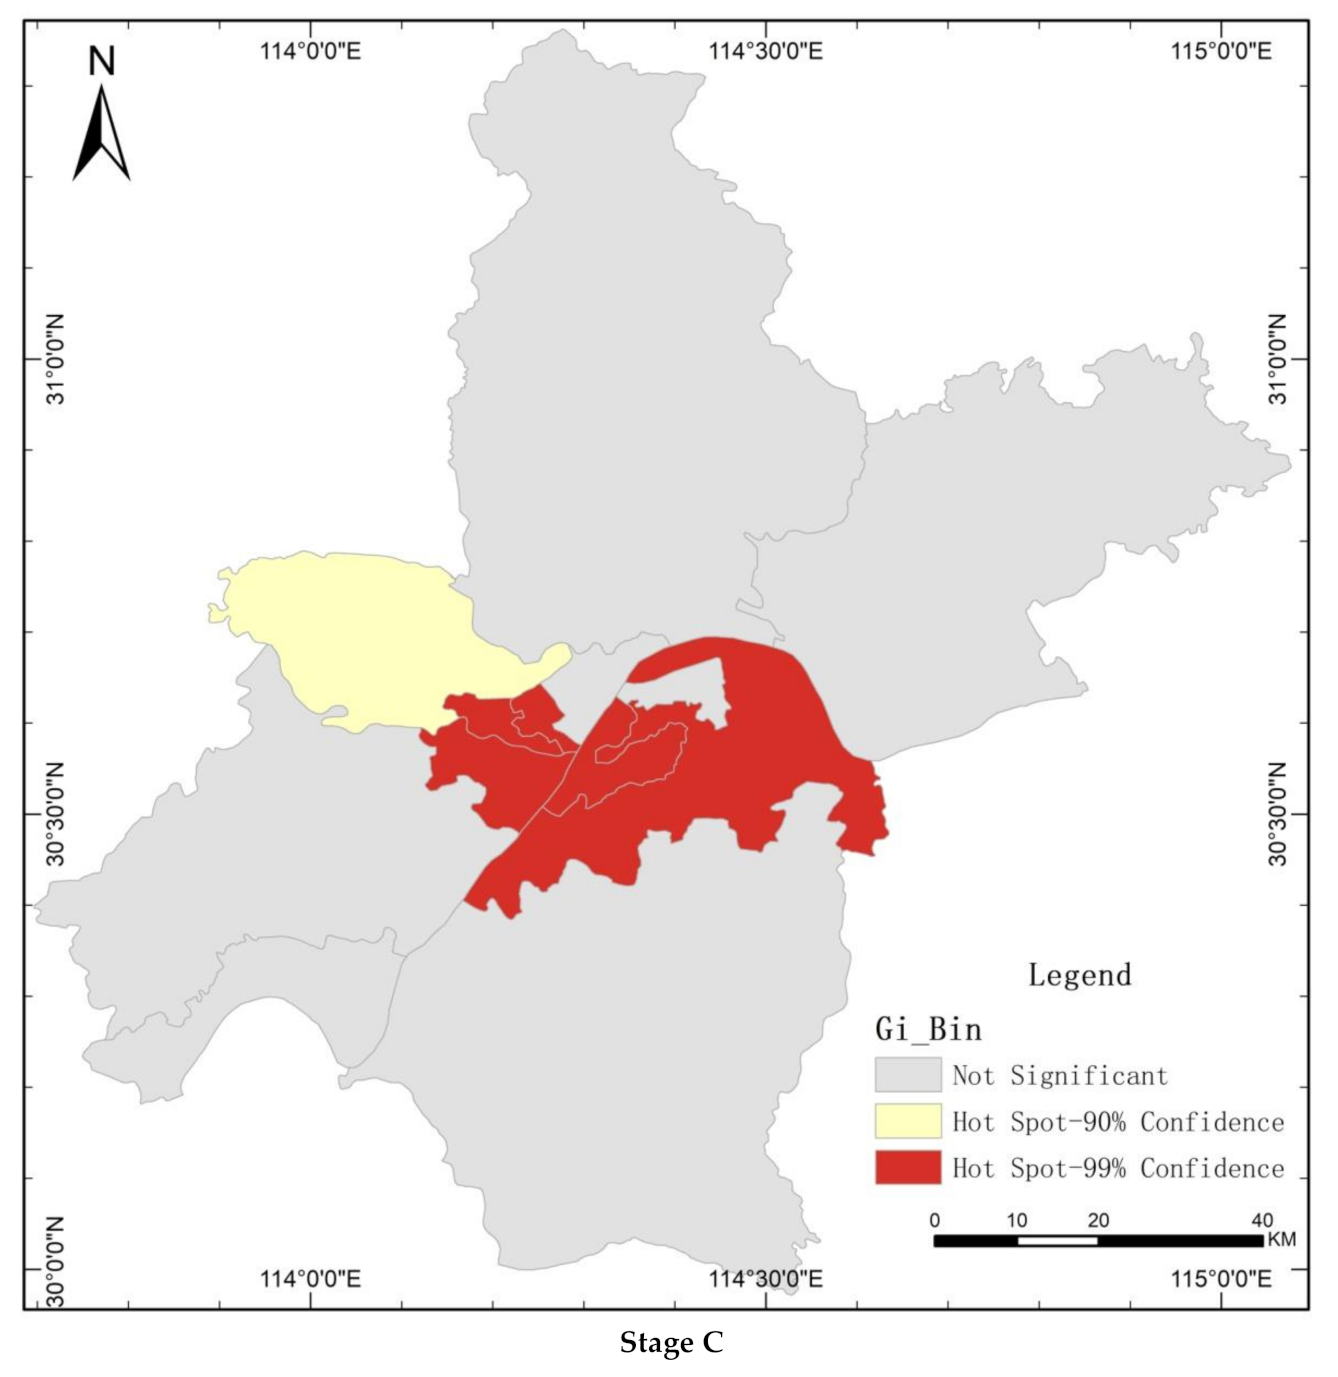
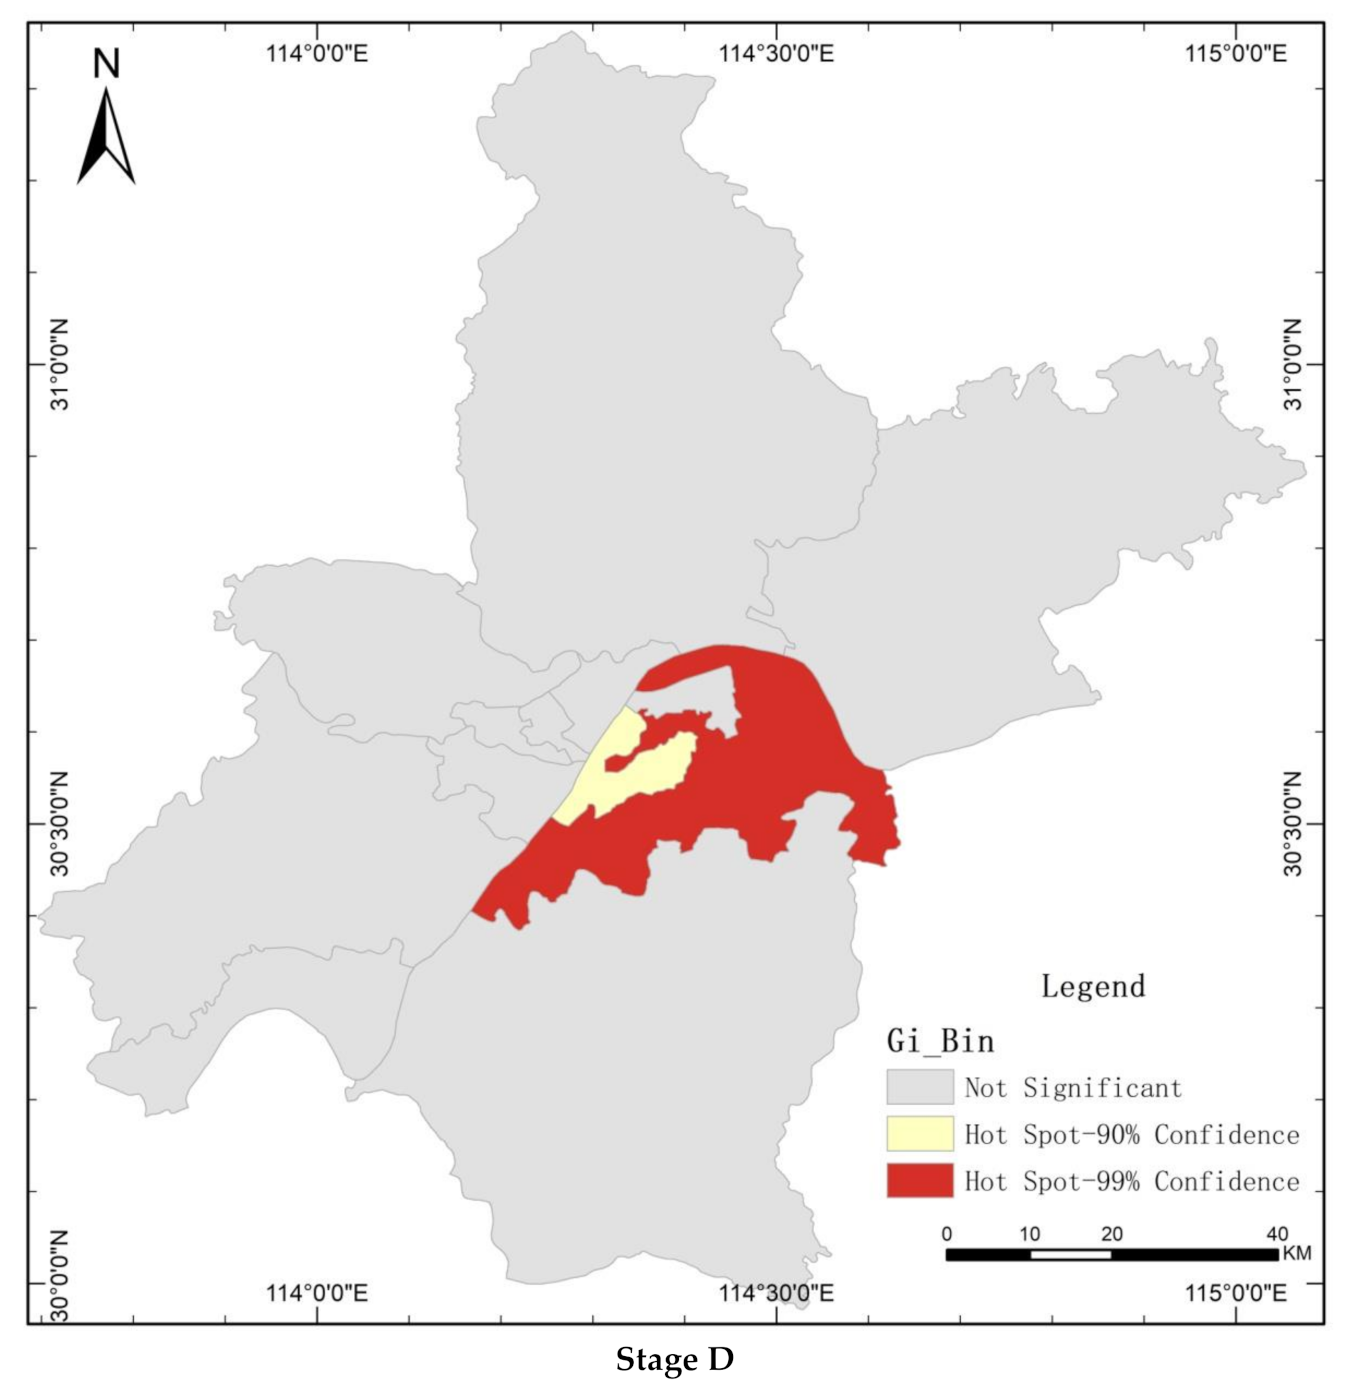
Based on the above global spatial autocorrelation analysis, the incidence rate of localized Getis–Ord hotspots was analyzed, and the visualized results are shown in
Figure 6. During the whole study period, there are clustered areas, except in stage A. There are hotspots with high values in the city centers for most of the time, especially in Hongshan and Wuchang (
Table 2). The incidence rate is strongly concentrated in stage B and stage D. In addition, strong randomness in stage C is shown, with rapidly increasing morbidity.
5.3. Analysis of Climatic Factors Affecting Spatial Differences in the Morbidity of COVID-19
5.3.1. Calculation Results of the Panel Data of COVID-19
Panel data models describe the behavior of COVID-19, both across time and individuals. There are three types of models: the pooled model, the fixed effects model, and the random-effects model. To grasp the global impact of the various climatic factors on the incidence rate, the incidence rate is analyzed based on panel data models. The results are shown in
Table 3 and
Table 4.
According to
Table 4, there are four climatic factors that have a great impact on the incidence rate, under the significant level of 10% and below. According to the absolute value of the coefficient, the order of influence in descending order in the OLS model is air pressure, relative humidity, temperature, and wind speed. The order of influence in descending order in the FE model and RE model is air pressure, temperature, relative humidity, and wind speed. The results demonstrate that the four climatic factors show a significantly positive correlation with the morbidity of COVID-19, but rainfall is not statistically significant.
5.3.2. Results of GWR Model
The spatial distribution of the incidence rate of COVID-19 has significant spatial correlation and spatial heterogeneity. Traditional linear regression models ignore the effect of spatial location on the incidence rate of COVID-19. The GWR model can effectively solve the problem of local variation between dependent variables and independent variables, caused by spatial location [
35]. Therefore, based on the GWR4 software, the incidence rate is taken as the dependent variable and those six climatic factors, including temperature, relative humidity, rainfall, wind speed, and air pressure, are taken as explanatory variables. The bi-square function is selected as the weight function, and a cross-validation method is used.
The average R2 of the GWR model on a daily scale is 0.558, which is higher than 0.2276, the highest goodness of fit of the linear regression model. The GWR model could explain 55.8% of the dependent variable. In addition, on some days, the R2 of the GWR model on a daily scale is above 0.804. It shows that the fitting result of the GWR model is better than that of the traditional regression model, and the interpretation effect is better. On the other hand, in view of the type of data, this result is also acceptable and meaningful.
The daily regression model and the regression coefficient of each explanatory variable are tested. The results show that in all the 26 days of the study period, the corresponding models of 20 days pass the test, accounting for 76.9% of the total number. The failure period is likely to be affected by the quality of the data itself, so the regression coefficient of each explanatory variable in those days would not be tested.
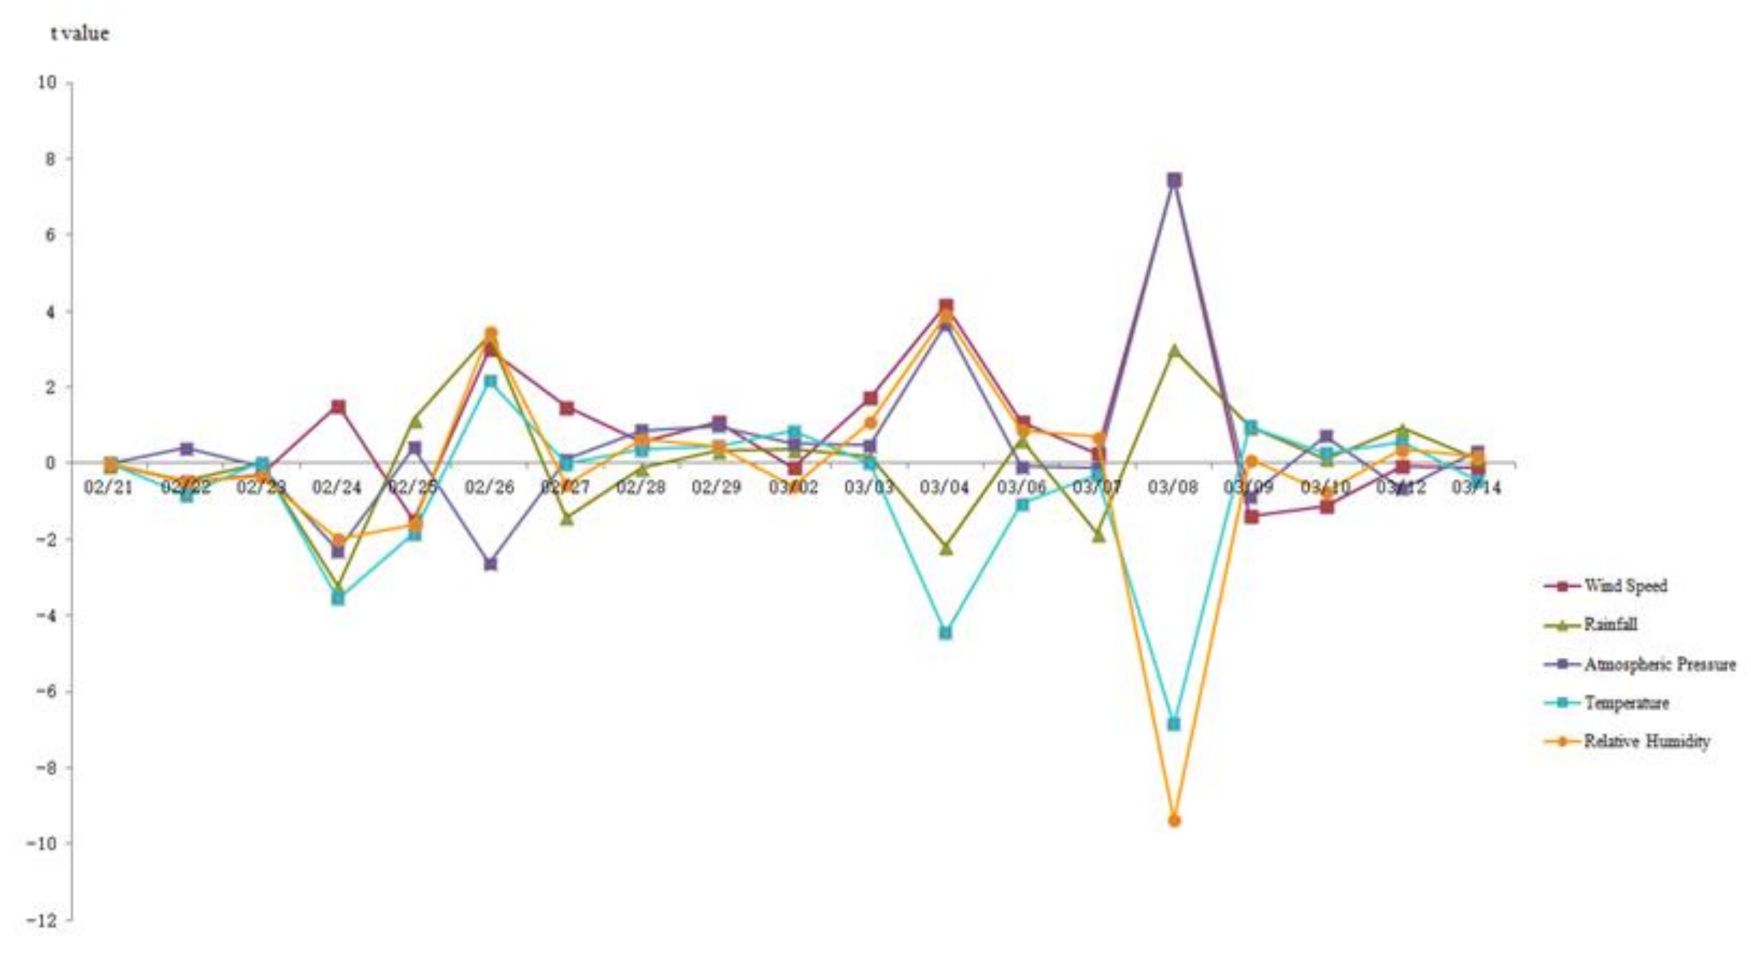
According to
Figure 7, the range of regression coefficients of the variables is very large, and the coefficients of explanatory variables are both positive and negative. It can be seen that the regression coefficient obtained by the traditional regression method can only represent the average level of the variables, thus ignoring some local coefficient characteristics. It can be seen that the incidence rate is not in a stable coefficient relationship with the climatic factors. Due to the actual situation in different regions, different climatic factors lead to strong spatial instability, and change with time.
5.3.3. Analysis Results of the Geographical Detector
The interaction between different climatic elements is further identified by geographical detectors. That is, whether any two climatic factors can increase or decrease the explanatory power of the incidence rate when the combined effects of these two factors are involved, or if the influence of these climatic factors on the incidence rate is independent. The results show that any two variables have greater interaction with the spatial distribution of the incidence rate than any one variable alone (
Table 5 and
Table 6). The meteorological factors have different effects on the spatial distribution of the incidence rate at each stage. For example, the
q value of the geographical detector in stage B is as follows: temperature, wind speed (0.261679) > relative humidity (0.05373) > rainfall (0.024671) > air pressure (0.001552). It is clear that temperature and wind speed are the most important controlling factors of spatial differentiation of the incidence rate of COVID-19. The
q value of the geographical detector in stage D is as follows: air pressure (0.2395) > relative humidity (0.131341) > temperature (0.111868) > rainfall (0.038989) > wind speed (0.000709). It is clear that at this stage, air pressure is the most important controlling factor of spatial differentiation of the incidence rate of COVID-19.
6. Discussions
It can be concluded that wind speed, relative humidity, temperature and air pressure are important meteorological factors affecting the spread of COVID-19. This conclusion is consistent with most of the previous research [
19,
21,
22]. It also shares some similarities with studies on other respiratory diseases, such as the influenza virus [
36,
37,
38], which advocate that meteorological variables such as temperature and air humidity can be treated as risk indicators for an increase in flu cases [
39] and aerosol spread of the influenza virus is dependent upon both ambient relative humidity and temperature [
40].
In addition, this study yields the result that any two variables have greater interaction with the spatial distribution of the incidence rate of COVID-19 than any one factor alone, which reveals a deeper understanding of the pandemic of COVID-19. In reality, relative humidity is affected by the air temperature. Therefore, there is to some extent a relationship between those two variables that makes the situation more complex. Other factors are also yielding the same dilemma. On the whole, among those climatic factors, there is a positive correlation between wind speed and the spread of COVID-19, which is consistent with Bashir’s conclusion [
23]. The influence of relative humidity is more complex, and the results show that there is generally a positive correlation, but the opposite situation appears in a small range. In the related research, mean relative humidity has no significant relationship with the incidence rate of COVID-19 [
23], and some studies also show that the COVID-19 spread is negatively correlated with relative humidity [
22]. Combined with the transmission mechanism of the virus itself, the virus is more infectious when the relative humidity is higher, but the persistence is lower [
41]. It is speculated from the results of this paper that the infectivity and persistence of the virus need to be comprehensively considered. The overall temperature has a negative correlation with the spread of COVID-19, and Liu et al. (2020) reach a similar conclusion, which is also consistent with the long-term epidemic transmission period. That is, epidemic disasters are often more frequent in cold periods, and rare in warm periods [
42]. In one study, it was suggested that the epidemic period lasted approximately 10 weeks for all pandemics. None of the pandemics had its epidemic period before late autumn. The epidemic period of the Asian influenza was preceded by falling temperatures [
36].
It is worth mentioning that although the relationship between air pressure and the spread of COVID-19 is seldom studied, there is similar research on seasonal influenza in Queensland, Australia, which indicates that a 1-hPa increase in air pressure will result in an increase in the monthly influenza cases [
37]. In this study, it is concluded that there is a positive correlation between air pressure and the number of COVID-19 cases. Rainfall is not significantly correlated with COVID-19. However, any interaction of those two factors with other climatic factors will affect the number of COVID-19 cases. All in all, in this study period of Wuhan, wind speed and air pressure are positively related to the spread of COVID-19, while temperature has a negative correlation with it. Those findings are consistent with studies in other regions. In addition, the influence of relative humidity shows a complication factor that can also be seen in other research. It is also interesting to identify the influence of the interaction of any other climatic factors on the newly confirmed cases of COVID-19. Nevertheless, Wuhan embodies a monsoon climate, and climatic factors are characterized by regional differences that still need to be taken into consideration. Those findings not only provide a new insight for key intervention measures and the optimal allocation of health care resources accordingly but also lay a theoretical foundation for disease prevention, disease intervention, and health services globally. In the future, besides the regional factors, the single climatic factor and the interaction of those factors should be taken into consideration for preventing the spread of viruses.
7. Conclusions
To the best of our knowledge, this paper is the first one to explore the correlation between climatic factors and the morbidity of COVID-19 in Wuhan. The interaction of those climatic parameters is emphasized by using the geographic detector and GWR model. It is revealed that the response of the morbidity of COVID-19 to meteorological factors is different at different stages.
On the whole, the morbidity of COVID-19 has a strong spatial aggregation, mainly concentrated in the central area of Wuhan City, for instance, in Hanyang District, Qiaokou District and Hongshan District, and is scattered in the areas far away from the center. In terms of time, meteorological factors have no significant effect on COVID-19 at the initial stage. Before COVID-19 morbidity reached the first peak, the positive influence of wind speed and the negative influence of temperature were the most obvious factors. With the decline in the number of newly confirmed cases, the influence of meteorological factors was relatively weak. The influence of meteorological factors on morbidity may have been weakened due to the intervention of government control, human prevention and other factors. Before the second peak of morbidity of COVID-19, the positive effect of air pressure and the negative effect of relative humidity were more obvious. To sum up, climatic influences on this pandemic spread are of great importance and should be further investigated.
It is worthwhile to mention that this paper also has the following limitations. Firstly, due to the particularity of epidemic control in Wuhan and the limitation of data acquisition, the research period of this paper is limited. Secondly, previous studies have shown that the impact of meteorological factors on the spread of disease is different in different climatic types. Based on the study of the COVID-19 spread in Wuhan, the relevant conclusions can be compared with other similar climatic types. In specific climatic conditions, more targeted analysis is needed.
Author Contributions
Conceptualization, Q.L.; methodology, G.O.; validation, R.W.; writing—original draft preparation, Q.L.; writing—review and editing, Y.L., Y.Z. and Z.D.; funding acquisition, G.O., Q.L. All authors have read and agreed to the published version of the manuscript.
Funding
The project was supported by the Fundamental Research Funds for the Central Universities, China University of Geosciences (Wuhan) (No. CUG190268), National Natural Science Foundation of China (42077432), Sustainable Development Project of Shenzhen Science and Technology Innovation Commission (KCXFZ20201221173413037).
Informed Consent Statement
Informed consent was obtained from all subjects involved in the study.
Acknowledgments
Thanks must be given to Peter Sammonds from the Institute for Risk and Disaster Reduction, University College London, for his suggestions and revision. We are also grateful to the anonymous reviewers for their comments.
Conflicts of Interest
The authors declare that they have no competing interests.
References
- Huang, C.; Wang, Y.; Li, X.; Ren, L.; Zhao, J.; Hu, Y.; Zhang, L.; Fan, G.; Xu, J.; Gu, X.; et al. Clinical features of patients infected with 2019 novel coronavirus in Wuhan, China. Lancet 2020, 395, 497–506. [Google Scholar] [CrossRef] [Green Version]
- European Centre for Disease Prevention and Control (ECDC). COVID-19 Situation Update Worldwide. 2020. Available online: https://www.ecdc.europa.eu/en/geographical-distribution-2019-ncov-cases (accessed on 25 October 2020).
- World Health Organization (WHO). Director-General’s Opening Remarks at the Media Briefing on COVID-19—11 March 2020. 2020. Available online: https://www.who.int/dg/speeches/detail/who-director-general-s-opening-remarks-at-themedia-briefing-on-covid-19—11-march-2020 (accessed on 26 October 2020).
- World Health Organization (WHO). 2020. Available online: https://covid19.who.int (accessed on 26 October 2020).
- Mitra, A.; Chaudhuri, T.R.; Mitra, A.; Pramanick, P.; Zaman, S.; Mitra, A.; Zaman, S. Impact of COVID-19 related shutdown on atmospheric carbon dioxide level in the cityof Kolkata. Sci. Educ. 2020, 6, 84–92. [Google Scholar]
- Ghinai, I.; McPherson, T.D.; Hunter, J.C.; Kirking, H.L.; Christiansen, D.; Joshi, K.; Rubin, R.; Morales-Estrada, S.; Black, S.R.; Pacilli, M.; et al. First known person-to-person transmission of severe acute respiratory syndrome coronavirus 2 (SARS-CoV-2) in the USA. Lancet 2020. [Google Scholar] [CrossRef]
- Yu, Y.X.; Sun, L.; Yao, K.; Lou, X.T.; Liang, X.; Zhao, B.W.; Mu, Q.X.; Du, H.; Zhao, Y.; Zhang, H. Consideration and prevention for the aerosol transmission of 2019 novel coronavirus. Chin. J. Ophthalmol. 2020, 56, E008. [Google Scholar]
- Carlos, W.G.; Cruz, C.S.D.; Cao, B.; Pasnick, S.; Jamil, S. Novel wuhan (2019-nCoV) coronavirus. Am. J. Respir. Crit. Care Med. 2020, 201, P7–P8. [Google Scholar] [CrossRef]
- Chan, J.F.-W.; Yuan, S.; Kok, K.-H.; To, K.K.-W.; Chu, H.; Yang, J.; Xing, F.; Liu, J.; Yip, C.C.-Y.; Poon, R.W.-S.; et al. A familial cluster of pneumonia associated with the 2019 novel coronavirus indicating person-to-person transmission: A study of a family cluster. Lancet 2020, 395, 514–523. [Google Scholar] [CrossRef] [Green Version]
- Li, R.; Pei, S.; Chen, B.; Song, Y.; Zhang, T.; Yang, W.; Shaman, J. Substantial undocumented infection facilitates the rapid dissemination of novel coronavirus (SARS-CoV-2). Science 2020, 368, 489–493. [Google Scholar] [CrossRef] [PubMed] [Green Version]
- Wang, D.; Hu, B.; Hu, C.; Zhu, F.; Liu, X.; Zhang, J.; Wang, B.; Xiang, H.; Cheng, Z.; Xiong, Y.; et al. Clinical characteristics of 138hospitalized patients with 2019 novel coronaviruseinfected pneumonia inwuhan, China. J. Am. Med. Assoc. 2020. [Google Scholar] [CrossRef]
- Fang, L.; Karakiulakis, G.; Roth, M. Are patients with hypertension and diabetes mellitus at increased risk for COVID-19 infection? Lancet Respir. Med. 2020. [Google Scholar] [CrossRef]
- Giannis, D.; Ziogas, I.A.; Gianni, P. Coagulation disorders in coronavirus infected patients: COVID-19, SARS-CoV-1, MERS-CoV and lessons from the past. J. Clin. Virol. 2020, 127, 104362. [Google Scholar] [CrossRef] [PubMed]
- Wu, F.; Zhao, S.; Yu, B.; Chen, Y.-M.; Wang, W.; Song, Z.-G.; Hu, Y.; Tao, Z.-W.; Tian, J.-H.; Pei, Y.-Y.; et al. A new coronavirus associated with human respiratory disease in China. Nature 2020, 579, 265–269. [Google Scholar] [CrossRef] [PubMed] [Green Version]
- Xiao, F.; Tang, M.; Zheng, X.; Liu, Y.; Li, X.; Shan, H. Evidence for gastrointestinal infection of SARS-CoV-2. Gastroenterology 2020, 158, 1831–1833.e3. [Google Scholar] [CrossRef]
- Zhou, F.; Yu, T.; Du, R.; Fan, G.; Liu, Y.; Liu, Z.; Xiang, J.; Wang, Y.; Song, B.; Gu, X.; et al. Clinical course and risk factors for mortality of adult in patients with COVID-19 in Wuhan, China: A retrospective cohort study. Lancet 2020. [Google Scholar] [CrossRef]
- Sindy, S.R.; Leobardo MG, O.; Hariz, I.F. COVID-19 in the environment. Chemosphere 2021, 263, 127973. [Google Scholar]
- Shahzad, F.; Shahzad, U.; Fareed, Z.; Iqbal, N.; Hashmi, S.H.; Ahmad, F. Asymmetric nexus between temperature and COVID-19 in the top ten affected provinces of China: A current application of quantile-on-quantile approach. Sci. Total. Environ. 2020, 736, 139115. [Google Scholar] [CrossRef]
- Ahmadi, M.; Sharifi, A.; Dorosti, S.; Ghoushchi, S.J.; Ghanbari, N. Investigation of effective climatology parameters on COVID-19 outbreak in Iran. Sci. Total Environ. 2020, 729, 138705. [Google Scholar] [CrossRef] [PubMed]
- Tosepu, R.; Gunawan, J.; Effendy, D.S.; Lestari, H.; Bahar, H.; Asfian, P. Correlation between weather and Covid-19 pandemic in Jakarta, Indonesia. Sci. Total Environ. 2020, 725, 138436. [Google Scholar] [CrossRef]
- Şahin, M. Impact of weather on COVID-19 pandemic in Turkey. Sci. Total. Environ. 2020, 728, 138810. [Google Scholar] [CrossRef]
- Liu, J.; Zhou, J.; Yao, J.; Zhang, X.; Li, L.; Xu, X.; He, X.; Wang, B.; Fu, S.; Niu, T.; et al. Impact of meteorological factors on the COVID-19 transmission: A multi-city study in China. Sci. Total Environ. 2020, 726, 138513. [Google Scholar] [CrossRef]
- Bashir, M.F.; Ma, B.; Bilal Komal, B.; Bashir, M.A.; Tan, D.; Bashir, M. Correlation between climatic indicators and COVID-19 pandemic in New York, USA. Sci. Total Environ. 2020, 728, 138835. [Google Scholar] [CrossRef]
- Shi, P.; Dong, Y.; Yan, H.; Li, X.; Zhao, C.; Liu, W.; He, M.; Tang, S.; Xi, S. The impact of temperature and absolute humidity on the coronavirus disease 2019 (COVID-19) outbreak-evidence from China. medRxiv 2020. [Google Scholar] [CrossRef] [Green Version]
- Sobral, M.F.F.; Duarte, G.B.; Sobral, A.I.G.D.P.; Marinho, M.L.M.; Melo, A. Association between climate variables and global transmission oF SARS-CoV-2. Sci. Total. Environ. 2020, 729, 138997. [Google Scholar] [CrossRef]
- Wuhan Government. 2020. Available online: http://www.wuhan.gov.cn (accessed on 22 October 2020).
- Wuhan Bureau of Statistics. Statistics Bulletin of National Economic and Social Development of Wuhan in 2019. 2020. Available online: http://tjj.wuhan.gov.cn (accessed on 22 October 2020).
- Dong, W.; Li, X.; Yang, P.; Liao, H.; Wang, X.; Wang, Q. The Effects of Weather Factors on Hand, Foot and Mouth Disease in Beijing. Sci. Rep. 2016, 6, srep19247. [Google Scholar] [CrossRef] [PubMed] [Green Version]
- Yan, J.; Shu, X.M.; Yuan, H.Y. Relationship between spatial distribution of thief crime and geographical factors. J. Tsinghua Univ. Sci. Technol. 2010, 2, 174–176. [Google Scholar]
- Sajadi, M.M.; Habibzadeh, P.; Vintzileos, A.; Shokouhi, S.; Fernando, M.W.; Amoroso, A. Temperature, humidity, and latitude analysis to predict potential spread and seasonality for COVID-19. SSRN Electron. J. 2020. [Google Scholar] [CrossRef] [PubMed]
- Wang, J.F.; Xu, C.D. Geodetector: Principle and prospective. Acta Geogr. Sin. 2017, 72, 116–134. [Google Scholar]
- Garten, R.J.; Davis, C.T.; Russell, C.A.; Shu, B.; Lindstrom, S.; Balish, A.; Sessions, W.M.; Xu, X.; Skepner, E.; Deyde, V.; et al. Antigenic and genetic characteristics of swine-origin 2009 A(H1N1) influenza viruses circulating in humans. Science 2009, 325, 197–201. [Google Scholar] [CrossRef] [Green Version]
- Shan, K.; Xu, L.Z.; Gai, R.Y.; Wang, X.; Yu, X.; Qi, H.; Cui, Y.; Lu, Y.; Xu, R. Spatial analysis to tuberculosis epidemic in China based on Geography Information System, 2002–2011. Chin. J. Public Health 2014, 30, 388–391. [Google Scholar]
- Li, M.F.; Ou, J.P.; Li, X. Spatio-temporal analysis of influenza A (H1N1) in China during 2009-2013 based on GIS. Geogr. Res. 2016, 35, 2139–2152. [Google Scholar]
- Song, W.X.; Mao, N.; Chen, P.Y.; Yuan, Y.; Wang, Y. Coupling mechanism and spatial-temporal pattern of residential differentiation from the perspective of housing prices: A case study of Nanjing. Acta Geogr. Sin. 2017, 72, 589–602. [Google Scholar]
- Skog, L.; Linde, A.; Palmgren, H.; Hauska, H.; Elgh, F. Spatiotemporal characteristics of pandemic influenza. BMC Infect. Dis. 2014, 14, 378. [Google Scholar] [CrossRef] [Green Version]
- Huang, X.; Mengersen, K.; Milinovich, G.; Hu, W. Effect of Weather Variability on Seasonal Influenza among Different Age Groups in Queensland, Australia: A Bayesian Spatiotemporal Analysis. J. Infect. Dis. 2017, 215, 1695–1701. [Google Scholar] [CrossRef] [PubMed]
- Chowell, G.; Towers, S.; Viboud, C.; Fuentes, R.; Sotomayor, V.; Simonsen, L.; A Miller, M.; Lima, M.; Villarroel, C.; Chiu, M.; et al. The influence of climatic conditions on the transmission dynamics of the 2009 A/H1N1 influenza pandemic in Chile. BMC Infect. Dis. 2012, 12, 298. [Google Scholar] [CrossRef] [PubMed]
- De Arróyabe Hernáez, P.F. Climate, weather and flu diagnoses incidence in the region of Santander (Northern Spain) during the 1999?2000 epidemic diffusion period. Aerobiologia 2004, 20, 223–228. [Google Scholar] [CrossRef]
- Lowen, A.C.; Mubareka, S.; Steel, J.; Palese, P. Influenza virus transmission is dependent on relative humidity and temperature. PLoS Pathog. 2007, 3, e1470–e1476. [Google Scholar] [CrossRef]
- Li, W.; Song, Y.L.; Wang, C.K. Comparability analysis between the climate characteristics of early summer in China and the meteorological conditions during the periods that the A(H1N1) flu spread in America and broke out in Mexico. Sci. Technol. Rev. 2009, 27, 19–22. [Google Scholar]
- Gong, S.S. Changes of the temporal-spatial distribution of epidemic disasters in 770BC-AD1911 China. Acta Geogr. Sin. 2003, 58, 870–878. [Google Scholar]
| Publisher’s Note: MDPI stays neutral with regard to jurisdictional claims in published maps and institutional affiliations. |
© 2021 by the authors. Licensee MDPI, Basel, Switzerland. This article is an open access article distributed under the terms and conditions of the Creative Commons Attribution (CC BY) license (https://creativecommons.org/licenses/by/4.0/).


