
Construction Schedule Risk Assessment and Management Strategy for Foreign General Contractors Working in the Ethiopian Construction Industry


Abstract
:1. Introduction
1.1. Risk Factor Selection and Database Development
1.2. Factor Ranking Using AI
1.3. Comparison and Sensitivity Analysis for Validation
2. Literature Review
2.1. GA
- For each hidden neuron i, multiply the absolute value of the hidden-output layer connection weight by the absolute value of the hidden-input layer connection weight for each input variable j, as presented in Table 2;
- For each hidden neuron, divide by the sum of all the input variables to obtain . For example, for hidden neuron 1, (see Table 3);
- For each input neuron, add all the products formed from the previous computations of . For example, (see Table 3);
- Divide by the sum of all the input variables. The RW of an input variable is obtained as a percentage by multiplying the resulting value after the aforementioned division by 100. For example, the relative importance of input neuron 1 or input factor 1 is (see Table 4).
2.2. Identify the Risk Factors That Cause Schedule Delay
3. Research Methodology
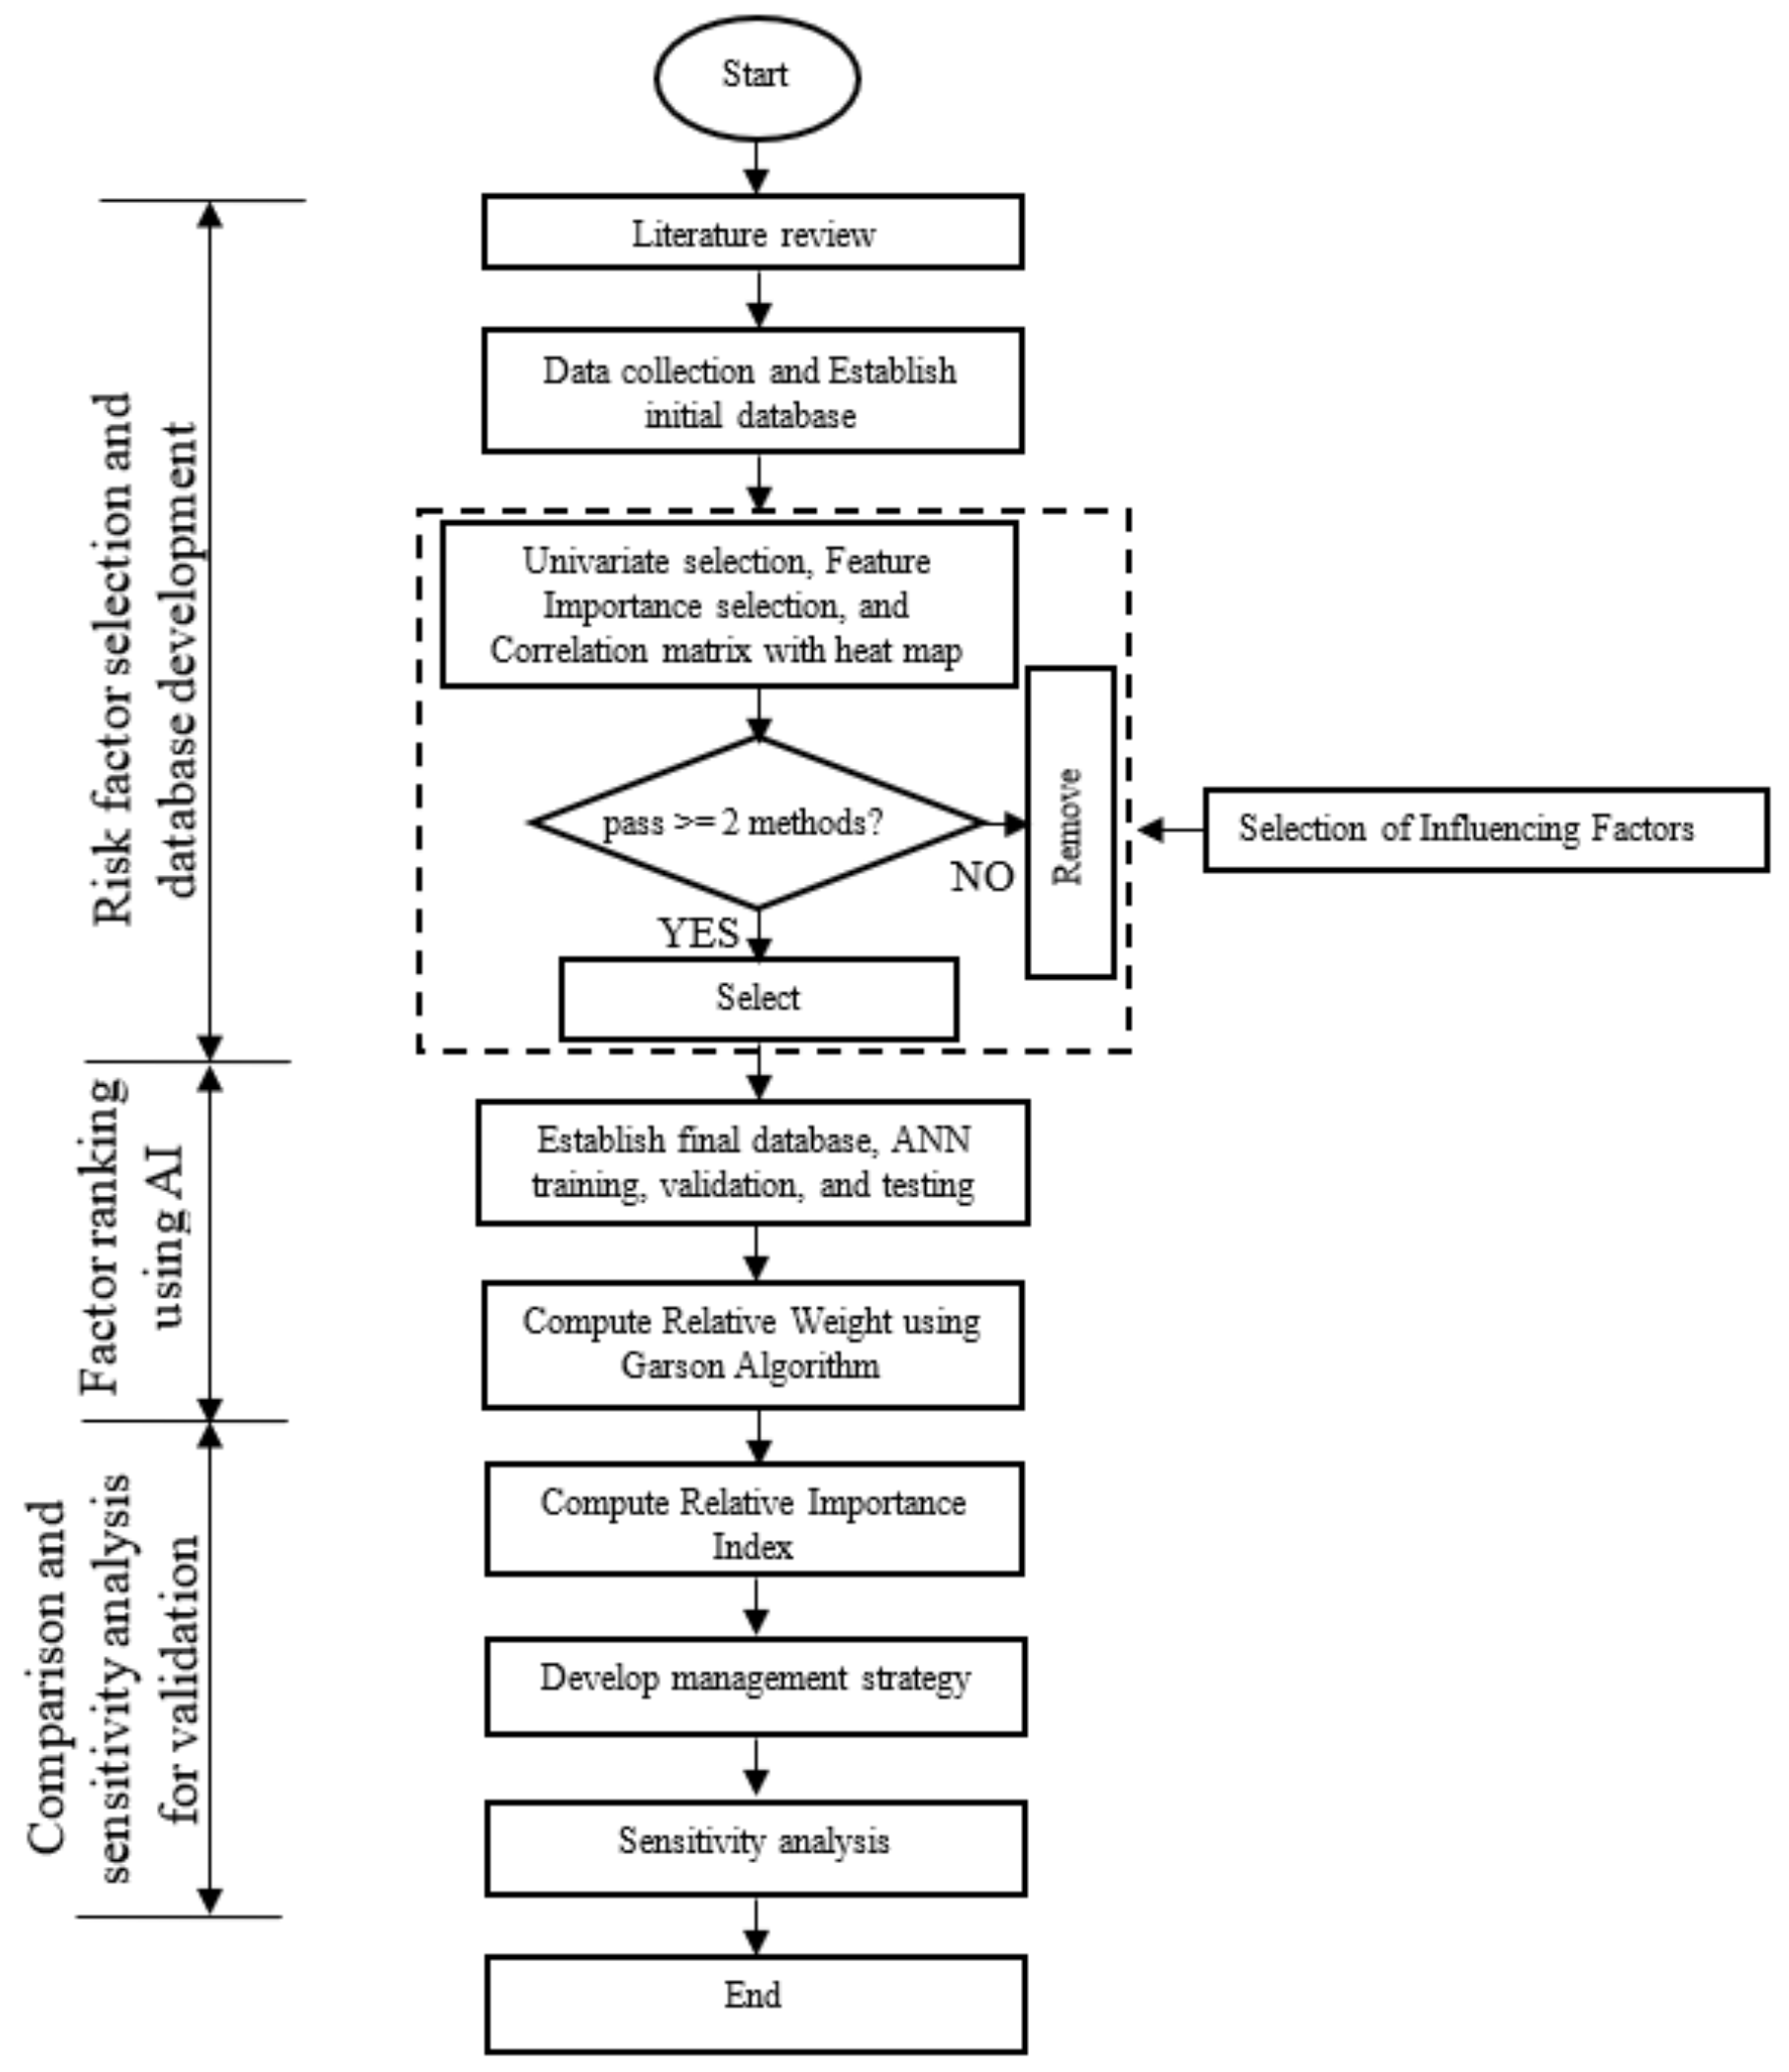
3.1. Research Processes
3.2. Data Collection and Establishment of the Initial Database
Data Preparation to Establish the Initial Database
3.3. Selection of Risk Factors with a Strong Influence on Schedule Delays in Ethiopian Construction Projects
3.4. Establishment of the Final Database as well as ANN Training, Validation, and Testing
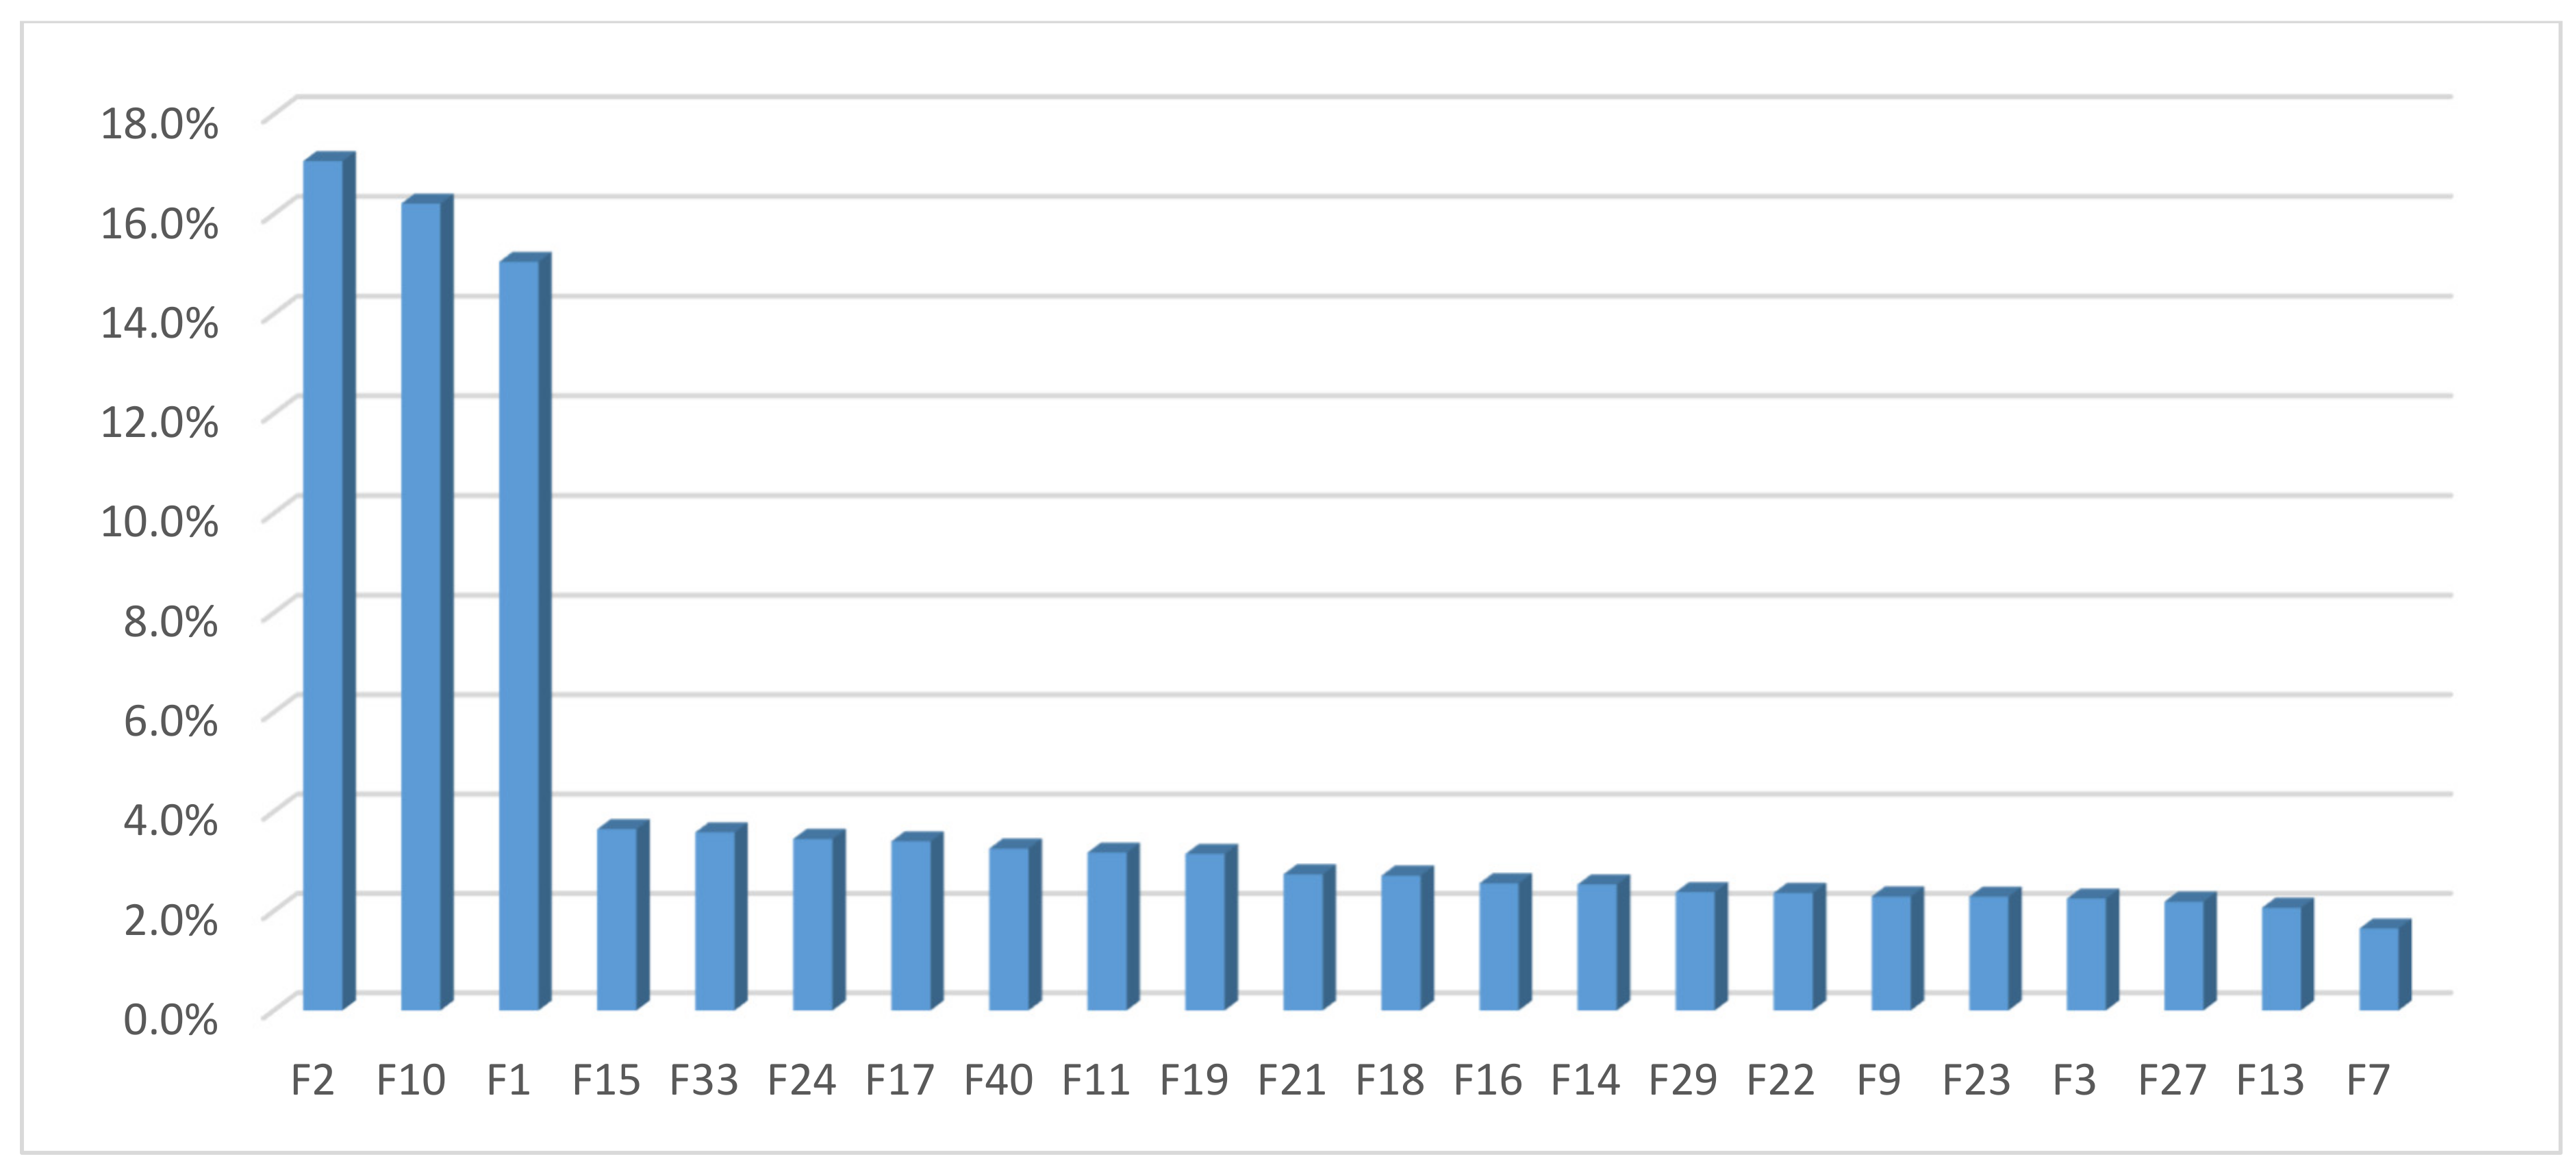
3.5. Computing the RWs of Risk Factors Using GA
- Determine of the selected risk factors by multiplying the absolute values of the hidden-output layer connection weights by hidden-input layer connection weights.
- Then the of the 22 selected risk factors were computed by dividing by the sum of all the input factors; for input factor 1, is calculated as follows:
- The of the risk factor is computed with the following formula, which is calculated from the previous computations of .
- Finally, the input neuron 1 (F1), which is expressed as a percentage, is computed as follows:
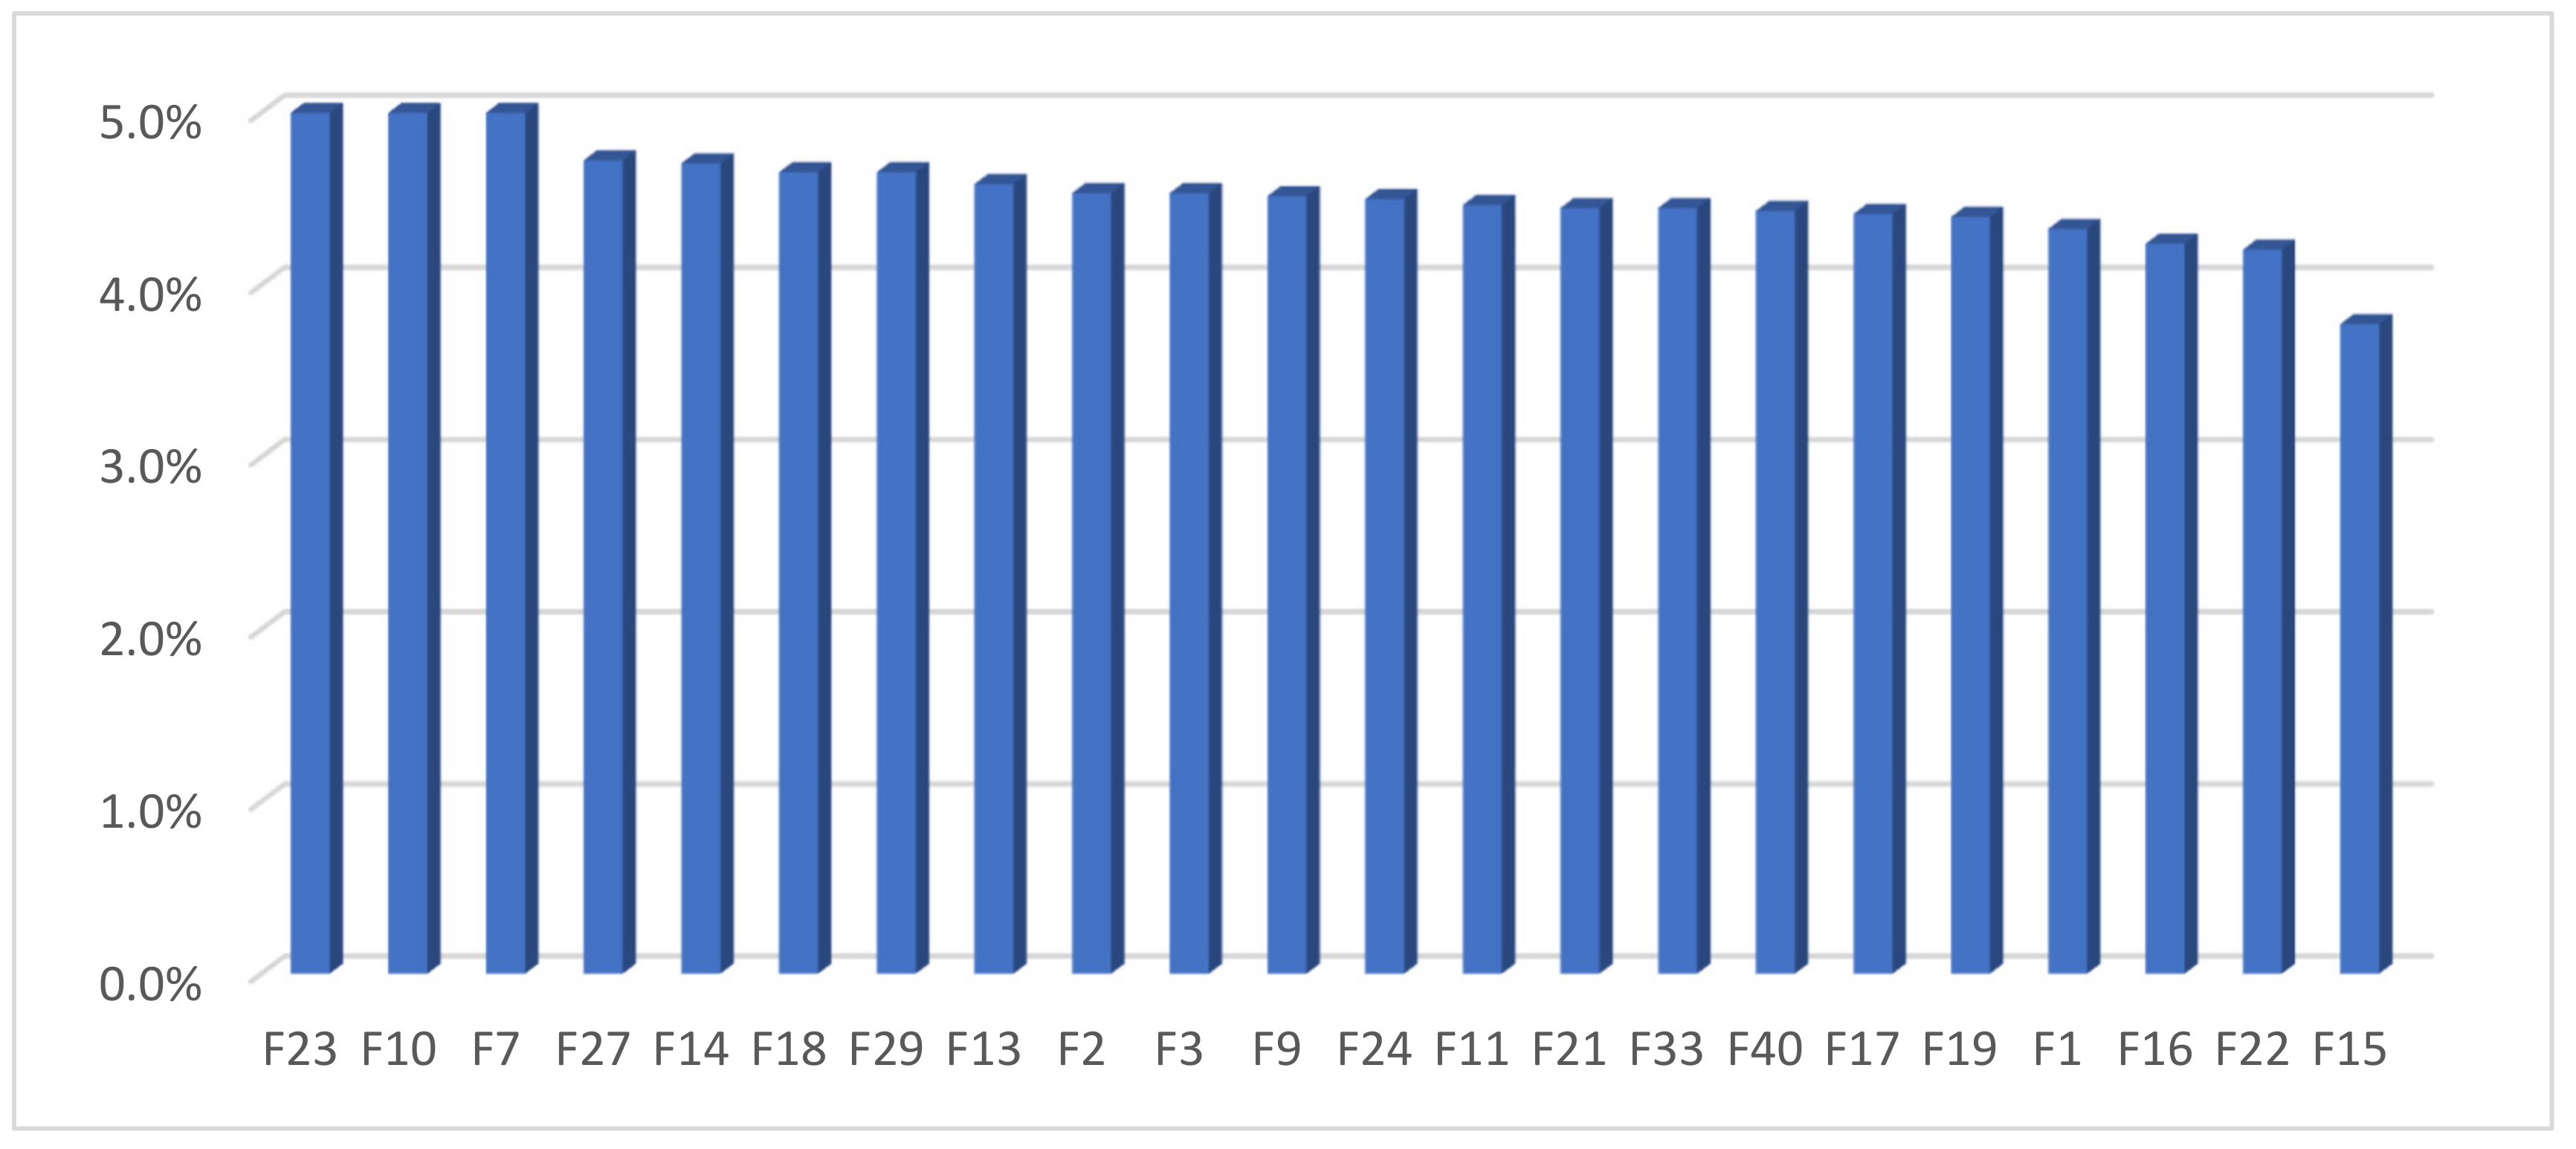
3.6. Determining the RII of Risk Factors
3.7. Development of Management Strategies
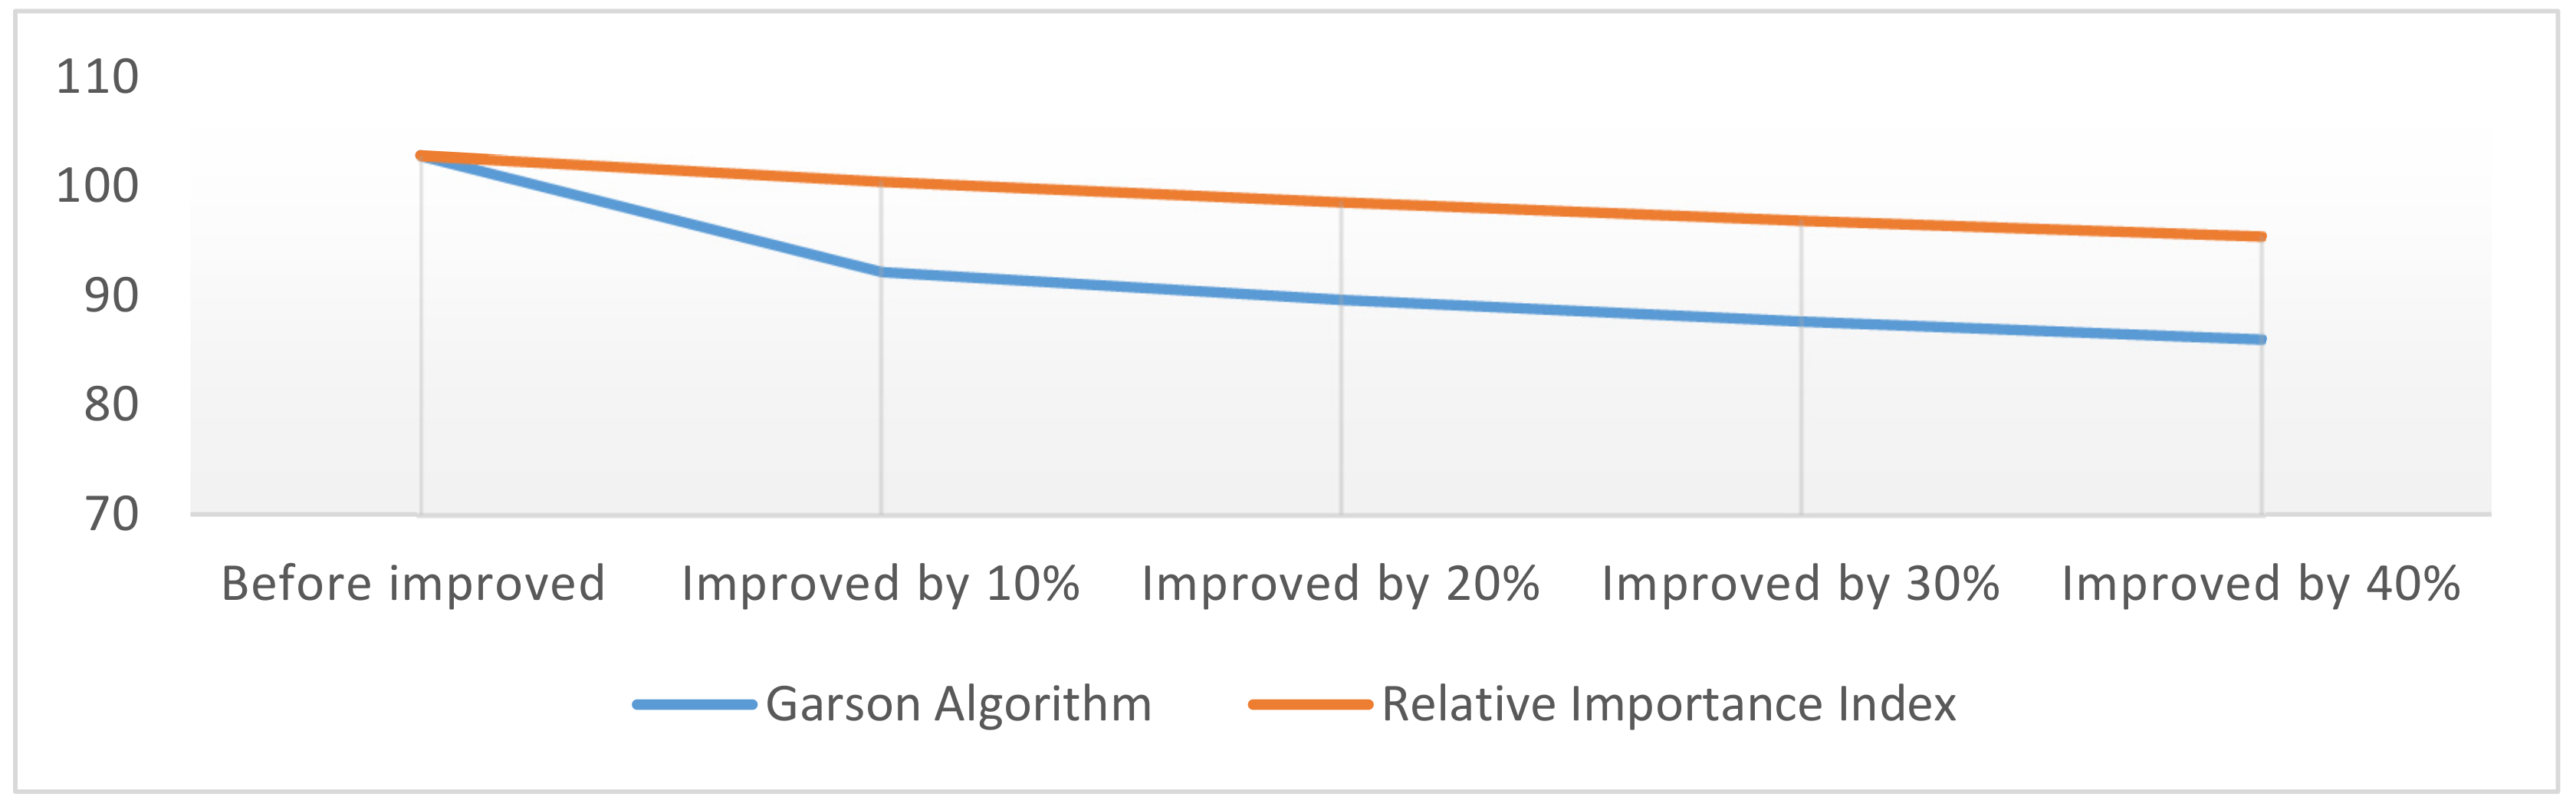
3.8. Sensitivity Analysis
4. Model Implementation
4.1. Calculation of the RWs of the Selected Risk Factors by Using the GA
4.2. Calculation of the RII of the Selected Risk Factors
4.3. Develop Management Strategies for Improving the Top Three Ranked Risk Factors
4.4. Sensitivity Analysis
5. Conclusions
Author Contributions
Funding
Data Availability Statement
Conflicts of Interest
Abbreviations
| AI | Artificial Intelligence |
| ANN | Artificial Neural Network |
| CSRAM | Construction Schedule Risk Assessment Model |
| FGC | Foreign General Contractors |
| A/E | Architectural and Engineering |
| GA | Garson Algorithm |
| RW | Relative Weight |
| RII | Relative Importance Index |
| RMSE | Root Mean Square Error |
References
- Sambasivan, M.; Soon, Y.W. Causes and effects of delays in Malaysian construction industry. Int. J. Project Manag. 2007, 25, 517–526. [Google Scholar] [CrossRef]
- Sweis, G.; Sweis, R.; Abu Hammad, A.; Shboul, A. Delays in construction projects: The case of Jordan. Int. J. Project Manag. 2008, 26, 665–674. [Google Scholar] [CrossRef]
- Orangi, A.; Palaneeswaran, E.; Wilson, J. Exploring Delays in Victoria-Based Australian Pipeline Projects. In Proceedings of the Twelfth East Asia-Pacific Conference on Structural Engineering and Construction Procedia Engineering, Hong Kong, China, 26–28 January 2011; Volume 14, pp. 874–881. [Google Scholar]
- Aziz, R.F.; Abdel-Hakam, A.A. Exploring delay causes of road construction projects in Egypt. Alex. Eng. J. 2016, 55, 1515–1539. [Google Scholar] [CrossRef] [Green Version]
- Koshe, W.; Jha, N.K. Investigating Causes of Construction Delay in Ethiopian Construction Industries. J. Civ. Constr. Environ. Eng. 2016, 1, 18–29. [Google Scholar]
- Tadewos, S.G.; Patel, D. Factors influencing Time and Cost Overruns in Road Construction Projects: Addis Ababa, Ethiopian Scenario. Int. J. Eng. Technol. 2018, 5, 177–180. [Google Scholar]
- Kebede, S.D.; Zhang, T. Enforcement of legal remedies against construction projects time overrun in Ethiopia: A critical appraisal. Heliyon 2020, 6, e05126. [Google Scholar] [CrossRef]
- Zinabu, T.Z. Construction Projects Delay and Their Antidotes: The Case of Ethiopian Construction Sector. Int. J. Econ. Bus. Res. 2016, 5, 113–122. [Google Scholar]
- Al-Momani, A.H. Construction delay: A quantitative analysis. Int. J. Project Manag. 2000, 18, 51–59. [Google Scholar] [CrossRef]
- Odeh, A.M.; Battaineh, H.T. Causes of Construction delay: Traditional contracts. Int. J. Project Manag. 2002, 20, 67–73. [Google Scholar] [CrossRef]
- Assaf, S.A.; Al-Hejji, S. Causes of delay in large construction projects. Int. J. Project Manag. 2006, 24, 349–357. [Google Scholar] [CrossRef]
- El-Razek, M.E.A.; Bassioni, H.A.; Mobarak, A.M. Causes of Delay in Building Construction Projects in Egypt. J. Constr. Eng. Manag. 2008, 134, 831–841. [Google Scholar] [CrossRef] [Green Version]
- Chan, D.W.M.; Chan, A.P.C.; Lam, P.T.I.; Yeung, J.Y.; Chan, J.H.L. Risk ranking and analysis in target cost contracts: Empirical evidence from the construction industry. Int. J. Project Manag. 2011, 29, 751–763. [Google Scholar] [CrossRef] [Green Version]
- Doloi, H.; Sawhney, A.; Iyer, K.C.; Rentala, S. Analysing factors affecting delays in Indian construction projects. Int. J. Project Manag. 2012, 30, 479–489. [Google Scholar] [CrossRef]
- Kazaz, A.; Ulubeyli, S.; Tuncbilekli, N.A. Causes of Delays in Construction Projects in Turkey. J. Civ. Eng. Manag. 2012, 18, 426–435. [Google Scholar] [CrossRef] [Green Version]
- Alinaitwe, H.; Apolot, R.; Tindiwensi, D. Investigation into the Causes of Delays and Cost Overruns in Uganda’s Public Sector Construction Projects. J. Constr. Dev. 2013, 18, 33–47. [Google Scholar]
- Aziz, R.F. Ranking of delay factors in construction projects after Egyptian revolution. Alex. Eng. J. 2013, 52, 387–406. [Google Scholar] [CrossRef] [Green Version]
- Fallahnejad, M.H. Delay causes in Iran gas pipeline projects. Int. J. Project Manag. 2013, 31, 136–146. [Google Scholar] [CrossRef]
- Kuo, Y.-C.; Lu, S.-T. Using fuzzy multiple criteria decision making approach to enhance risk assessment for metropolitan construction projects. Int. J. Project Manag. 2013, 31, 602–614. [Google Scholar] [CrossRef]
- Gardezi, S.S.S.; Manarvi, I.A.; Gardezi, S.J.S. Time Extension Factors in Construction Industry of Pakistan. In Proceedings of the Fourth International Symposium on Infrastructure Engineering in Developing Countries, Karachi, Pakistan, 11–13 December 2013; Volume 77, pp. 196–204. [Google Scholar]
- Marzouk, M.M.; El-Rasas, T.I. Analyzing delay causes in Egyptian construction projects. J. Adv. Res. 2014, 5, 49–55. [Google Scholar] [CrossRef] [Green Version]
- Al-Hazim, N.; Salem, Z.A.; Ahmad, H. Delay and Cost Overrun in Infrastructure Projects in Jordan. In Proceedings of the 7th International Conference on Engineering, Project, and Production Management, Bialystok, Poland, 21–23 September 2017; Volume 182, pp. 18–24. [Google Scholar]
- Gebrehiwet, T.; Luo, H. Analysis of Delay Impact on Construction Project Based on RII and Correlation Coefficient: Empirical Study. In Proceedings of the Creative Construction Conference 2017, CCC 2017, Primosten, Croatia, 19–22 June 2017; Volume 196, pp. 366–374. [Google Scholar]
- Ibrahim, M. Schedule Delay in Saudi Arabia Road Construction Projects: Size, Estimate, Determinants and Effects. Int. J. Archit. Eng. Constr. 2017, 6, 51–58. [Google Scholar]
- Mohammed, R.M.M.; Suliman, S.M.A. Delay in Pipeline Construction Projects in the Oil and Gas Industry: Part 2 (Prediction Models). Int. J. Constr. Eng. Manag. 2019, 8, 37–45. [Google Scholar]
- Xu, M.; Wong, T.C.; Chin, K.S. Modeling daily patient arrivals at Emergency Department and quantifying the relative importance of contributing variables using artificial neural network. Decis. Support Syst. 2013, 54, 1488–1498. [Google Scholar] [CrossRef]
- Zhang, Z.; Beck, M.W.; Winkler, D.A.; Huang, B.; Sibanda, W.; Goyal, H. Opening the black box of neural networks: Methods for interpreting neural network models in clinical applications. Ann. Transl. Med. 2018, 6, 216. [Google Scholar] [CrossRef]
- Ibrahim, O.M. A comparison of methods for assessing the relative importance of input variables in artificial neural networks. JASR 2013, 9, 5692–5700. [Google Scholar]
- Garson, G.D. Interpreting neural network connection weights. Artif. Intell. Expert 1991, 6, 47–51. [Google Scholar]
- Gevrey, M.; Dimopoulos, I.; Lek, S. Review and comparison of methods to study the contribution of variables in artificial neural network models. Ecol. Modell. 2003, 160, 249–264. [Google Scholar] [CrossRef]
- Chen, J.; Chen, W. Diagnostic analysis of a small-scale incinerator by the Garson index. Inf. Sci. 2008, 178, 4560–4570. [Google Scholar] [CrossRef]
- Baruah, D.; Baruah, D.C.; Hazarika, M.K. Artificial neural network based modeling of biomass gasification in fixed bed downdraft gasifiers. Biomass Bioenergy. 2017, 98, 264–271. [Google Scholar] [CrossRef]
- Korteby, Y.; Kristó, K.; Sovány, T.; Regdon, G. Use of machine learning tool to elucidate and characterize the growth mechanism of an in-situ fluid bed melt granulation. Powder Technol. 2018, 331, 286–295. [Google Scholar] [CrossRef] [Green Version]
- Zhang, Y.; Gao, X.; Smith, K.; Inial, G.; Liue, S.; Conil, L.B.; Pan, B. Integrating water quality and operation into prediction of water production in drinking water treatment plants by genetic algorithm enhanced artificial neural network. Water Res. 2019, 164, 114888. [Google Scholar] [CrossRef]
- Zhi, H. Risk management for overseas construction projects. Int. J. Project Manag. 1995, 13, 231–237. [Google Scholar] [CrossRef]
- Ling, F.Y.Y.; Low, S.P.; Wang, S.Q.; Lim, H.H. Key project management practices affecting Singaporean firms’ project performance in China. Int. J. Project Manag. 2009, 27, 59–71. [Google Scholar] [CrossRef]
- Cheng, M.-Y.; Wu, Y.-W.; Syu, R.-F. Seismic Assessment of Bridge Diagnostic in Taiwan Using the Evolutionary Support Vector Machine Inference Model (ESIM). Appl. Artif. Intell. 2014, 28, 449–469. [Google Scholar] [CrossRef]
- Dogan, G.; Alotaibi, N.; Sahin, E.; Ertas, S.S.; Cay, I.; Keskin, S.R.; Heijnen, M.J.; Ricanek, K. Using Artificial Intelligence to Predict Fall-risk During Adaptive Locomotion in Humans. In Proceedings of the International Conference on Artificial Intelligence & Modern Assistive Technology (ICAIMAT), Riyadh, Saudi Arabia, 24–26 November 2020; pp. 1–7. [Google Scholar]
- Cheng, M.-Y.; Cao, M.-T. Accurately predicting building energy performance using evolutionary multivariate adaptive regression splines. Appl. Soft Comput. 2014, 22, 178–188. [Google Scholar] [CrossRef]
- Mrzygłód, B.; Hawryluk, M.; Janik, M.; Wożeńska, I. Sensitivity analysis of the artificial neural networks in a system for durability prediction of forging tools to forgings made of C45 steel. Int. J. Adv. Manuf. Technol. 2020, 109, 1385–1395. [Google Scholar] [CrossRef]


| Hidden Neurons | Weights | |||
|---|---|---|---|---|
| Input 1 | Input 2 | Input 3 | Output | |
| Hidden 1 | −1.67624 | 3.29022 | 1.32466 | 4.57857 |
| Hidden 2 | −0.51874 | −0.22921 | −0.25526 | −0.48815 |
| Hidden 3 | −4.01764 | 2.12486 | −0.08168 | −5.73901 |
| Hidden 4 | −1.75691 | −1.44702 | 0.58286 | −2.65221 |
| Input 1 | Input 2 | Input 3 | |
|---|---|---|---|
| Hidden 1 | 1.67624 × 4.57857 | 3.29022 × 4.57857 | 1.32466 × 4.57857 |
| Hidden 2 | 0.51874 × 0.48815 | 0.22921 × 0.48815 | 0.25526 × 0.48815 |
| Hidden 3 | 4.01764 × 5.73901 | 2.12486 × 5.73901 | 0.08168 × 5.73901 |
| Hidden 4 | 1.75691 × 2.65221 | 1.44702 × 2.65221 | 0.58286 × 2.65221 |
| Input 1 | Input 2 | Input 3 | |
|---|---|---|---|
| Hidden 1 | 0.266445 | 0.522994 | 0.210560 |
| Hidden 2 | 0.517081 | 0.228478 | 0.254441 |
| Hidden 3 | 0.645489 | 0.341388 | 0.013123 |
| Hidden 4 | 0.463958 | 0.382123 | 0.153919 |
| Sum | 1.892973 | 1.474983 | 0.632044 |
| Input 1 | Input 2 | Input 3 | |
|---|---|---|---|
| Relative weight (%) | 47.3 | 36.9 | 15.8 |
| Sn. | Factors | Literatures | ||||||||||||||||||||
|---|---|---|---|---|---|---|---|---|---|---|---|---|---|---|---|---|---|---|---|---|---|---|
| [1] | [2] | [3] | [4] | [5] | [6] | [8] | [14] | [20] | [23] | [11] | [12] | [17] | [21] | [24] | [10] | [22] | [9] | [15] | [16] | Frq. | ||
| 1 | Improper planning and scheduling | ✓ | ✓ | ✓ | ✓ | ✓ | ✓ | ✓ | ✓ | ✓ | ✓ | ✓ | ✓ | ✓ | 14 | |||||||
| 2 | Variation/Change order | ✓ | ✓ | ✓ | ✓ | ✓ | ✓ | ✓ | ✓ | ✓ | ✓ | ✓ | ✓ | ✓ | 13 | |||||||
| 3 | Financial difficulties | ✓ | ✓ | ✓ | ✓ | ✓ | ✓ | ✓ | ✓ | ✓ | ✓ | ✓ | 11 | |||||||||
| 4 | Delays in payment | ✓ | ✓ | ✓ | ✓ | ✓ | ✓ | ✓ | ✓ | ✓ | ✓ | ✓ | 11 | |||||||||
| 5 | Problem/ Poor Site management | ✓ | ✓ | ✓ | ✓ | ✓ | ✓ | ✓ | ✓ | ✓ | ✓ | 10 | ||||||||||
| 6 | Increase of Material price | ✓ | ✓ | ✓ | ✓ | ✓ | ✓ | 6 | ||||||||||||||
| 7 | Defective design/incorrect/error | ✓ | ✓ | ✓ | ✓ | ✓ | ✓ | 6 | ||||||||||||||
| 8 | Equipment availability and failure | ✓ | ✓ | ✓ | ✓ | ✓ | ✓ | 6 | ||||||||||||||
| 9 | Problem in Sub-contractors works | ✓ | ✓ | ✓ | ✓ | ✓ | ✓ | 6 | ||||||||||||||
| 10 | Mistakes and rework | ✓ | ✓ | ✓ | ✓ | ✓ | ✓ | 6 | ||||||||||||||
| 11 | Inadequate contractor experience | ✓ | ✓ | ✓ | ✓ | ✓ | 5 | |||||||||||||||
| 12 | Shortage in material | ✓ | ✓ | ✓ | ✓ | ✓ | 5 | |||||||||||||||
| 13 | Unrealistic contract duration and requirements imposed | ✓ | ✓ | ✓ | ✓ | 4 | ||||||||||||||||
| 14 | Delay in material delivery | ✓ | ✓ | ✓ | ✓ | 4 | ||||||||||||||||
| 15 | Poor labor productivity | ✓ | ✓ | ✓ | ✓ | 4 | ||||||||||||||||
| 16 | Shortage of labor supply | ✓ | ✓ | ✓ | ✓ | 4 | ||||||||||||||||
| 17 | Inflation | ✓ | ✓ | ✓ | ✓ | 4 | ||||||||||||||||
| 18 | Inappropriate type of project bidding and award | ✓ | ✓ | ✓ | 3 | |||||||||||||||||
| 19 | Lack of skilled workers | ✓ | ✓ | ✓ | 3 | |||||||||||||||||
| 20 | lack of effective communication between parties | ✓ | ✓ | ✓ | 3 | |||||||||||||||||
| 21 | Waiting time for approval and inspection | ✓ | ✓ | ✓ | 3 | |||||||||||||||||
| 22 | Management problem | ✓ | ✓ | ✓ | 3 | |||||||||||||||||
| 23 | Slow decision making | ✓ | ✓ | ✓ | 3 | |||||||||||||||||
| 24 | Skill of technical staff problem/unqualified | ✓ | ✓ | ✓ | 3 | |||||||||||||||||
| 25 | Adverse Weather conditions | ✓ | ✓ | ✓ | 3 | |||||||||||||||||
| 26 | Difficulties in obtaining work permit/land acquisition | ✓ | ✓ | ✓ | 3 | |||||||||||||||||
| 27 | Bribe/corruption | ✓ | ✓ | 2 | ||||||||||||||||||
| 28 | Lack of clarity in scope | ✓ |  | ✓ | 2 | |||||||||||||||||
| 68 | Emergency works | ✓ | 1 | |||||||||||||||||||
| 69 | unavailability of utilities at site | ✓ | 1 | |||||||||||||||||||
| 70 | Global financial crisis | ✓ | 1 | |||||||||||||||||||
| Experience (in Years) | Frequency | Educational Level | Frequency |
|---|---|---|---|
| More than 20 | 8 | College graduate | 17 |
| 11 to 15 | 46 | BSc. | 22 |
| 6 to 10 | 15 | MSc. | 25 |
| Less than 5 | 6 | PhD. | 11 |
| Symbol | Risk Factors | Category of Risk Factors | Univariate Selection | Feature Importance | Correlation Matrix | Status |
|---|---|---|---|---|---|---|
| F1 | Delays in payment | FB | ✓ | ✓ | ✓ | O |
| F2 | Variation/Change order | FB | ✓ | ✓ | ✓ | O |
| F3 | Shortage in material | FB | ✓ | ✓ | O | |
| F4 | Problem in sub-contractor work | FB | ✓ | X | ||
| F5 | Mistakes and rework | FB | ✓ | X | ||
| F6 | Waiting time for approval and inspection | FB | ✓ | X | ||
| F7 | Delay in material delivery | FB | ✓ | ✓ | O | |
| F8 | Conflict among parties | FB | ✓ | X | ||
| F9 | Lack of peace and security | FB | ✓ | ✓ | O | |
| F10 | Corruption and Bribery | FB | ✓ | ✓ | ✓ | O |
| F11 | Scarcity of foreign exchange and rate fluctuation | FB | ✓ | ✓ | O | |
| F12 | Disputes on land | FB | ✓ | X | ||
| F13 | Poor implementation of plan (poor performance) | FB | ✓ | ✓ | ✓ | O |
| F14 | Strike, revolution, riot, protest | FB | ✓ | ✓ | O | |
| F15 | Construction methods | FB | ✓ | ✓ | O | |
| F16 | Political insecurity and instability | FB | ✓ | ✓ | O | |
| F17 | Slow decision making | FB | ✓ | ✓ | O | |
| F18 | Defective design/incorrect/error | FB | ✓ | ✓ | ✓ | O |
| F19 | Increase of material price, price fluctuation | FB | ✓ | ✓ | O | |
| F20 | Lack of skilled workers | FB | ✓ | X | ||
| F21 | Poor labor productivity | FB | ✓ | ✓ | O | |
| F22 | Rebellion | FB | ✓ | ✓ | O | |
| F23 | Poor resource management | FB | ✓ | ✓ | O | |
| F24 | Unavailability of utility at site (electricity, water) | FB | ✓ | ✓ | O | |
| F25 | Skill of technical staff problem | FB | ✓ | X | ||
| F26 | Labor absenteeism | FB | ✓ | X | ||
| F27 | Improper planning and scheduling | BB | ✓ | ✓ | O | |
| F28 | Financial difficulties | BB | ✓ | X | ||
| F29 | Unrealistic contract duration and requirements imposed | BB | ✓ | ✓ | O | |
| F30 | Inadequate contractor experience | BB | X | |||
| F31 | Management problem | BB | X | |||
| F32 | Lack of effective communication between parties | BB | ✓ | X | ||
| F33 | Inappropriate type of project bidding and award | BB | ✓ | ✓ | O | |
| F34 | Inflation | BB | ✓ | X | ||
| F35 | Difficulties in obtaining work permits | BB | ✓ | X | ||
| F36 | Transportation problem to site location | BB | ✓ | X | ||
| F37 | Labor culture of work/ attitude | BB | ✓ | X | ||
| F38 | Lack of commitment of general contractor | BB | ✓ | X | ||
| F39 | Problem/ Poor Site management | BB | X | |||
| F40 | Inadequate modern equipment | BB | ✓ | ✓ | O | |
| F41 | Project site location (boundary problem) | BB | ✓ | X |
| Proj # | Input Factors | Output | |||||||||||||||||||||
|---|---|---|---|---|---|---|---|---|---|---|---|---|---|---|---|---|---|---|---|---|---|---|---|
| F1 | F2 | F3 | F7 | F9 | F10 | F11 | F13 | F14 | F15 | F16 | F17 | F18 | F19 | F21 | F22 | F23 | F24 | F27 | F29 | F33 | F40 | Delay% | |
| 1 | 0.50 | 0.40 | 0.00 | 0.33 | 0.33 | 1.00 | 0.90 | 0.50 | 0.00 | 0.50 | 0.50 | 0.50 | 0.50 | 0.50 | 0.00 | 0.00 | 0.00 | 0.50 | 1.00 | 1.00 | 0.00 | 1.00 | 0.63 |
| 2 | 0.50 | 0.30 | 0.40 | 0.33 | 0.33 | 0.40 | 0.20 | 0.50 | 0.30 | 0.20 | 0.20 | 0.30 | 0.10 | 0.50 | 0.40 | 0.20 | 0.00 | 0.40 | 1.00 | 1.00 | 0.00 | 1.00 | 0.88 |
| 3 | 1.00 | 0.10 | 1.00 | 0.00 | 0.00 | 0.30 | 1.00 | 1.00 | 0.00 | 0.00 | 0.50 | 1.00 | 0.50 | 1.00 | 1.00 | 0.00 | 0.00 | 1.00 | 1.00 | 1.00 | 0.00 | 1.00 | 0.35 |
| 4 | 0.40 | 0.20 | 0.30 | 0.00 | 0.00 | 0.40 | 0.10 | 0.40 | 0.00 | 0.00 | 0.00 | 0.10 | 0.20 | 0.30 | 0.30 | 0.00 | 0.00 | 0.00 | 1.00 | 1.00 | 0.00 | 0.00 | 0.67 |
| 5 | 0.10 | 0.00 | 0.30 | 0.44 | 0.44 | 0.30 | 0.10 | 0.10 | 0.90 | 0.10 | 0.50 | 0.10 | 0.20 | 0.20 | 0.00 | 0.90 | 0.00 | 0.20 | 0.00 | 0.00 | 0.00 | 0.00 | 0.50 |
| 6 | 0.30 | 1.00 | 1.00 | 0.22 | 0.22 | 0.40 | 0.20 | 0.30 | 0.00 | 0.10 | 0.20 | 0.50 | 0.60 | 1.00 | 1.00 | 0.00 | 0.22 | 0.80 | 1.00 | 0.00 | 0.00 | 1.00 | 0.50 |
| 7 | 0.00 | 0.30 | 0.00 | 1.00 | 1.00 | 0.00 | 0.00 | 0.00 | 1.00 | 0.90 | 0.90 | 0.30 | 0.00 | 0.00 | 0.30 | 0.20 | 0.00 | 0.00 | 0.00 | 0.00 | 1.00 | 1.00 | 0.34 |
| 8 | 0.50 | 0.40 | 0.00 | 0.33 | 0.33 | 0.00 | 0.50 | 0.50 | 0.00 | 0.50 | 0.50 | 0.50 | 0.50 | 0.50 | 0.00 | 0.00 | 0.11 | 0.50 | 1.00 | 1.00 | 0.00 | 1.00 | 0.50 |
| 9 | 0.50 | 0.50 | 0.50 | 0.00 | 0.00 | 0.10 | 0.00 | 0.50 | 0.00 | 0.50 | 0.50 | 0.50 | 1.00 | 1.00 | 0.50 | 1.00 | 0.00 | 0.00 | 1.00 | 0.00 | 0.00 | 0.00 | 0.44 |
| 10 | 0.30 | 0.30 | 0.30 | 0.00 | 0.00 | 0.40 | 0.10 | 0.30 | 0.10 | 0.20 | 0.00 | 0.30 | 0.10 | 0.10 | 0.20 | 0.20 | 0.00 | 0.20 | 1.00 | 0.00 | 0.00 | 1.00 | 0.75 |
| 11 | 0.10 | 0.20 | 0.20 | 0.22 | 0.22 | 0.20 | 0.20 | 0.10 | 0.10 | 0.00 | 0.10 | 0.10 | 0.10 | 0.20 | 0.20 | 0.10 | 0.00 | 0.20 | 1.00 | 1.00 | 1.00 | 0.00 | 0.34 |
| 12 | 0.50 | 0.60 | 0.00 | 0.00 | 0.00 | 0.50 | 0.00 | 0.50 | 0.00 | 0.00 | 0.00 | 0.00 | 0.20 | 1.00 | 0.20 | 0.00 | 0.22 | 0.30 | 1.00 | 1.00 | 1.00 | 0.00 | 0.50 |
| 13 | 0.50 | 0.60 | 0.00 | 0.00 | 0.00 | 0.50 | 0.00 | 0.50 | 0.00 | 0.00 | 0.00 | 0.00 | 0.20 | 0.90 | 0.20 | 0.00 | 0.44 | 0.30 | 1.00 | 1.00 | 1.00 | 0.00 | 0.32 |
| 14 | 0.60 | 0.40 | 0.00 | 0.00 | 0.00 | 0.20 | 0.00 | 0.60 | 0.00 | 0.00 | 0.00 | 0.00 | 0.20 | 1.00 | 0.40 | 0.00 | 0.33 | 0.80 | 1.00 | 1.00 | 0.00 | 0.00 | 0.50 |
| 15 | 1.00 | 0.90 | 1.00 | 0.44 | 0.44 | 0.40 | 0.60 | 1.00 | 0.60 | 0.00 | 0.60 | 0.30 | 0.10 | 0.10 | 0.20 | 0.20 | 0.11 | 0.20 | 1.00 | 0.00 | 0.00 | 1.00 | 0.34 |
| 16 | 0.00 | 1.00 | 0.50 | 0.56 | 0.56 | 0.20 | 0.00 | 0.00 | 0.00 | 0.20 | 0.20 | 0.20 | 0.50 | 0.50 | 0.00 | 0.50 | 0.33 | 0.50 | 1.00 | 0.00 | 1.00 | 0.00 | 0.75 |
| 17 | 0.50 | 0.50 | 0.50 | 0.56 | 0.56 | 0.80 | 1.00 | 0.50 | 0.50 | 0.50 | 1.00 | 0.50 | 1.00 | 0.50 | 0.50 | 0.50 | 0.11 | 0.50 | 1.00 | 0.00 | 1.00 | 0.00 | 0.75 |
| 18 | 0.50 | 1.00 | 1.00 | 0.33 | 0.33 | 0.90 | 0.50 | 0.50 | 0.30 | 0.30 | 0.50 | 0.30 | 0.90 | 1.00 | 0.50 | 0.20 | 0.56 | 0.20 | 1.00 | 1.00 | 1.00 | 1.00 | 0.75 |
| 19 | 1.00 | 0.00 | 1.00 | 0.56 | 0.56 | 0.80 | 0.10 | 1.00 | 0.50 | 0.50 | 0.50 | 0.50 | 0.80 | 0.10 | 1.00 | 0.50 | 0.22 | 0.00 | 1.00 | 0.00 | 1.00 | 0.00 | 0.75 |
| 20 | 0.50 | 0.50 | 0.50 | 0.00 | 0.00 | 0.70 | 0.00 | 0.50 | 0.00 | 0.50 | 0.50 | 0.50 | 1.00 | 1.00 | 0.50 | 1.00 | 0.56 | 0.00 | 1.00 | 0.00 | 0.00 | 0.00 | 0.50 |
 | |||||||||||||||||||||||
| 91 | 1.00 | 0.70 | 0.00 | 0.00 | 0.00 | 0.90 | 0.00 | 0.30 | 0.00 | 0.00 | 0.10 | 0.10 | 0.20 | 0.00 | 0.00 | 0.70 | 0.00 | 0.00 | 1.00 | 1.00 | 0.00 | 1.00 | 0.48 |
| 92 | 1.00 | 0.10 | 1.00 | 0.00 | 0.00 | 0.20 | 1.00 | 1.00 | 0.00 | 0.00 | 0.50 | 0.10 | 0.50 | 0.00 | 0.00 | 0.00 | 0.11 | 0.10 | 1.00 | 1.00 | 0.00 | 1.00 | 0.05 |
| 93 | 0.60 | 0.50 | 0.00 | 0.00 | 0.33 | 0.20 | 0.00 | 0.60 | 0.30 | 0.20 | 0.00 | 0.00 | 0.20 | 0.20 | 0.40 | 0.00 | 0.22 | 0.10 | 1.00 | 1.00 | 1.00 | 1.00 | 0.44 |
| 94 | 0.50 | 0.60 | 0.50 | 0.00 | 0.33 | 0.70 | 0.00 | 0.50 | 0.30 | 0.50 | 0.50 | 0.50 | 0.10 | 0.50 | 0.50 | 0.60 | 0.78 | 0.00 | 1.00 | 1.00 | 1.00 | 1.00 | 0.75 |
| Weights | |||||||||||||||||||||||
|---|---|---|---|---|---|---|---|---|---|---|---|---|---|---|---|---|---|---|---|---|---|---|---|
| F1 | F2 | F3 | F7 | F9 | F10 | F11 | F13 | F14 | F15 | F16 | F17 | F18 | F19 | F21 | F22 | F23 | F24 | F27 | F29 | F33 | F40 | Output | |
| Hidden 1 | 3.967 | 7.521 | 0.070 | 0.925 | 1.205 | 3.651 | 0.762 | 0.070 | 0.612 | 0.067 | 0.613 | 0.318 | 1.512 | 0.980 | 0.407 | 0.722 | 0.209 | 1.707 | 0.421 | 2.162 | 0.364 | 2.760 | 1.246 |
| Hidden 2 | 3.198 | 2.449 | 0.640 | 0.694 | 0.329 | 4.236 | 0.028 | 0.138 | 0.361 | 0.643 | 1.276 | 1.572 | 0.423 | 0.514 | 1.624 | 0.085 | 0.579 | 0.475 | 0.619 | 0.978 | 0.505 | 0.329 | 1.230 |
| Hidden 3 | 2.992 | 3.455 | 1.982 | 0.057 | 0.568 | 3.866 | 0.518 | 1.781 | 0.180 | 0.093 | 0.566 | 0.219 | 0.999 | 1.210 | 0.697 | 0.814 | 0.618 | 1.183 | 0.542 | 0.752 | 1.437 | 0.056 | 1.807 |
| Hidden 4 | 2.821 | 5.163 | 0.549 | 0.472 | 1.650 | 4.178 | 1.198 | 0.331 | 0.895 | 2.662 | 0.478 | 3.178 | 0.758 | 0.319 | 0.872 | 0.403 | 0.523 | 1.663 | 1.165 | 0.807 | 2.076 | 0.490 | 1.749 |
| Hidden 5 | 4.353 | 3.100 | 0.126 | 0.486 | 0.126 | 4.024 | 0.270 | 0.682 | 0.034 | 1.329 | 0.711 | 0.354 | 0.635 | 0.888 | 0.560 | 0.156 | 2.367 | 1.024 | 0.822 | 0.056 | 2.634 | 0.957 | 1.145 |
| Hidden 6 | 4.064 | 4.252 | 0.546 | 0.203 | 0.782 | 3.037 | 1.283 | 0.531 | 1.190 | 0.950 | 0.708 | 1.017 | 0.347 | 1.088 | 1.624 | 2.514 | 0.394 | 0.488 | 0.086 | 0.145 | 0.692 | 2.188 | 1.739 |
| Hidden 7 | 4.065 | 5.771 | 1.684 | 1.558 | 0.755 | 2.943 | 2.736 | 0.818 | 0.126 | 0.446 | 0.503 | 1.442 | 2.097 | 2.229 | 0.311 | 0.719 | 0.524 | 0.412 | 0.954 | 0.428 | 1.126 | 2.188 | 1.668 |
| Hidden 8 | 4.230 | 3.756 | 0.138 | 0.172 | 1.074 | 3.616 | 1.354 | 1.100 | 2.079 | 3.608 | 1.215 | 0.868 | 0.790 | 1.256 | 1.850 | 0.130 | 1.255 | 2.770 | 1.721 | 0.131 | 0.334 | 1.668 | 2.088 |
| Hidden 9 | 3.288 | 2.304 | 0.026 | 0.196 | 0.084 | 4.117 | 0.363 | 0.319 | 0.364 | 0.330 | 0.438 | 0.413 | 0.013 | 0.091 | 0.135 | 0.002 | 0.018 | 0.248 | 0.317 | 0.365 | 0.254 | 0.020 | 0.064 |
| Hidden 10 | 3.480 | 4.518 | 0.702 | 0.138 | 0.536 | 3.062 | 0.420 | 0.004 | 0.782 | 0.670 | 0.315 | 0.340 | 0.378 | 0.481 | 0.025 | 0.805 | 0.138 | 0.115 | 0.008 | 0.694 | 0.722 | 0.150 | 1.017 |
| Hidden 11 | 3.855 | 5.334 | 0.006 | 0.079 | 0.081 | 5.403 | 0.833 | 0.237 | 0.657 | 0.457 | 0.284 | 0.396 | 0.476 | 0.502 | 0.115 | 0.475 | 0.228 | 0.637 | 0.106 | 0.078 | 0.194 | 0.006 | 0.468 |
| F1 | F2 | F3 | F7 | F9 | F10 | F11 | F13 | F14 | F15 | F16 | F17 | F18 | F19 | F21 | F22 | F23 | F24 | F27 | F29 | F33 | F40 | |
|---|---|---|---|---|---|---|---|---|---|---|---|---|---|---|---|---|---|---|---|---|---|---|
| Hidden 1 | 4.941 | 9.369 | 0.088 | 1.153 | 1.501 | 4.548 | 0.949 | 0.087 | 0.763 | 0.083 | 0.764 | 0.396 | 1.884 | 1.221 | 0.507 | 0.899 | 0.260 | 2.127 | 0.525 | 2.694 | 0.453 | 3.438 |
| Hidden 2 | 3.934 | 3.012 | 0.787 | 0.853 | 0.405 | 5.210 | 0.035 | 0.170 | 0.445 | 0.791 | 1.569 | 1.933 | 0.520 | 0.632 | 1.998 | 0.104 | 0.712 | 0.584 | 0.761 | 1.203 | 0.621 | 0.404 |
| Hidden 3 | 5.405 | 6.242 | 3.580 | 0.103 | 1.025 | 6.984 | 0.935 | 3.217 | 0.326 | 0.169 | 1.023 | 0.395 | 1.804 | 2.186 | 1.260 | 1.471 | 1.117 | 2.136 | 0.979 | 1.359 | 2.596 | 0.100 |
| Hidden 4 | 4.934 | 9.030 | 0.960 | 0.826 | 2.886 | 7.307 | 2.096 | 0.580 | 1.565 | 4.656 | 0.837 | 5.558 | 1.326 | 0.558 | 1.524 | 0.705 | 0.915 | 2.909 | 2.037 | 1.412 | 3.631 | 0.858 |
| Hidden 5 | 4.985 | 3.550 | 0.144 | 0.556 | 0.144 | 4.609 | 0.309 | 0.781 | 0.039 | 1.522 | 0.815 | 0.406 | 0.727 | 1.017 | 0.642 | 0.178 | 2.711 | 1.172 | 0.941 | 0.065 | 3.017 | 1.096 |
| Hidden 6 | 7.067 | 7.393 | 0.949 | 0.354 | 1.359 | 5.280 | 2.230 | 0.924 | 2.069 | 1.651 | 1.232 | 1.768 | 0.603 | 1.891 | 2.823 | 4.371 | 0.686 | 0.848 | 0.150 | 0.252 | 1.204 | 3.804 |
| Hidden 7 | 6.778 | 9.624 | 2.808 | 2.598 | 1.259 | 4.907 | 4.562 | 1.364 | 0.210 | 0.743 | 0.839 | 2.404 | 3.497 | 3.717 | 0.518 | 1.199 | 0.873 | 0.687 | 1.591 | 0.714 | 1.878 | 3.648 |
| Hidden 8 | 8.831 | 7.841 | 0.288 | 0.360 | 2.241 | 7.550 | 2.826 | 2.297 | 4.340 | 7.533 | 2.538 | 1.812 | 1.649 | 2.622 | 3.863 | 0.272 | 2.620 | 5.783 | 3.593 | 0.275 | 0.697 | 3.482 |
| Hidden 9 | 0.209 | 0.147 | 0.002 | 0.013 | 0.005 | 0.262 | 0.023 | 0.020 | 0.023 | 0.021 | 0.028 | 0.026 | 0.001 | 0.006 | 0.009 | 0.000 | 0.001 | 0.016 | 0.020 | 0.023 | 0.016 | 0.001 |
| Hidden 10 | 3.539 | 4.594 | 0.714 | 0.140 | 0.546 | 3.114 | 0.427 | 0.004 | 0.795 | 0.681 | 0.320 | 0.346 | 0.384 | 0.489 | 0.025 | 0.818 | 0.140 | 0.117 | 0.008 | 0.705 | 0.734 | 0.153 |
| Hidden 11 | 1.805 | 2.498 | 0.003 | 0.037 | 0.038 | 2.530 | 0.390 | 0.111 | 0.307 | 0.214 | 0.133 | 0.185 | 0.223 | 0.235 | 0.054 | 0.222 | 0.107 | 0.298 | 0.050 | 0.037 | 0.091 | 0.003 |
| F1 | F2 | F3 | F7 | F9 | F10 | F11 | F13 | F14 | F15 | F16 | F17 | F18 | F19 | F21 | F22 | F23 | F24 | F27 | F29 | F33 | F40 | |
|---|---|---|---|---|---|---|---|---|---|---|---|---|---|---|---|---|---|---|---|---|---|---|
| Hidden 1 | 0.128 | 0.242 | 0.002 | 0.030 | 0.039 | 0.118 | 0.025 | 0.002 | 0.020 | 0.002 | 0.020 | 0.010 | 0.049 | 0.032 | 0.013 | 0.023 | 0.007 | 0.055 | 0.014 | 0.070 | 0.012 | 0.089 |
| Hidden 2 | 0.147 | 0.113 | 0.030 | 0.032 | 0.015 | 0.195 | 0.001 | 0.006 | 0.017 | 0.030 | 0.059 | 0.072 | 0.020 | 0.024 | 0.075 | 0.004 | 0.027 | 0.022 | 0.029 | 0.045 | 0.023 | 0.015 |
| Hidden 3 | 0.122 | 0.141 | 0.081 | 0.002 | 0.023 | 0.157 | 0.021 | 0.072 | 0.007 | 0.004 | 0.023 | 0.009 | 0.041 | 0.049 | 0.028 | 0.033 | 0.025 | 0.048 | 0.022 | 0.031 | 0.058 | 0.002 |
| Hidden 4 | 0.086 | 0.158 | 0.017 | 0.014 | 0.051 | 0.128 | 0.037 | 0.010 | 0.027 | 0.082 | 0.015 | 0.097 | 0.023 | 0.010 | 0.027 | 0.012 | 0.016 | 0.051 | 0.036 | 0.025 | 0.064 | 0.015 |
| Hidden 5 | 0.169 | 0.121 | 0.005 | 0.019 | 0.005 | 0.157 | 0.011 | 0.027 | 0.001 | 0.052 | 0.028 | 0.014 | 0.025 | 0.035 | 0.022 | 0.006 | 0.092 | 0.040 | 0.032 | 0.002 | 0.103 | 0.037 |
| Hidden 6 | 0.145 | 0.151 | 0.019 | 0.007 | 0.028 | 0.108 | 0.046 | 0.019 | 0.042 | 0.034 | 0.025 | 0.036 | 0.012 | 0.039 | 0.058 | 0.089 | 0.014 | 0.017 | 0.003 | 0.005 | 0.025 | 0.078 |
| Hidden 7 | 0.120 | 0.171 | 0.050 | 0.046 | 0.022 | 0.087 | 0.081 | 0.024 | 0.004 | 0.013 | 0.015 | 0.043 | 0.062 | 0.066 | 0.009 | 0.021 | 0.015 | 0.012 | 0.028 | 0.013 | 0.033 | 0.065 |
| Hidden 8 | 0.120 | 0.107 | 0.004 | 0.005 | 0.031 | 0.103 | 0.039 | 0.031 | 0.059 | 0.103 | 0.035 | 0.025 | 0.022 | 0.036 | 0.053 | 0.004 | 0.036 | 0.079 | 0.049 | 0.004 | 0.010 | 0.047 |
| Hidden 9 | 0.240 | 0.168 | 0.002 | 0.014 | 0.006 | 0.300 | 0.027 | 0.023 | 0.027 | 0.024 | 0.032 | 0.030 | 0.001 | 0.007 | 0.010 | 0.000 | 0.001 | 0.018 | 0.023 | 0.027 | 0.019 | 0.001 |
| Hidden 10 | 0.188 | 0.244 | 0.038 | 0.007 | 0.029 | 0.166 | 0.023 | 0.000 | 0.042 | 0.036 | 0.017 | 0.018 | 0.020 | 0.026 | 0.001 | 0.044 | 0.007 | 0.006 | 0.000 | 0.038 | 0.039 | 0.008 |
| Hidden 11 | 0.189 | 0.261 | 0.000 | 0.004 | 0.004 | 0.264 | 0.041 | 0.012 | 0.032 | 0.022 | 0.014 | 0.019 | 0.023 | 0.025 | 0.006 | 0.023 | 0.011 | 0.031 | 0.005 | 0.004 | 0.009 | 0.000 |
| Sum (S) | 1.654 | 1.877 | 0.248 | 0.18 | 0.253 | 1.783 | 0.352 | 0.226 | 0.278 | 0.402 | 0.283 | 0.373 | 0.298 | 0.349 | 0.302 | 0.259 | 0.251 | 0.379 | 0.241 | 0.264 | 0.395 | 0.357 |
| Symbol | Risk Factors | Relative Weight by Garson Algorithm | Relative Importance Index | Rank of Risk Factors by RII |
|---|---|---|---|---|
| F1 | Delays in payment | 15.031% | 0.666667 | 19 |
| F2 | Variation/Change order | 17.062% | 0.698667 | 9 |
| F3 | Shortage in material | 2.249% | 0.698667 | 10 |
| F7 | Delay in material delivery | 1.649% | 0.778667 | 3 |
| F9 | Lack of peace and security | 2.294% | 0.696000 | 11 |
| F10 | Corruption and Bribery | 16.210% | 0.792000 | 2 |
| F11 | Scarcity of foreign exchange and rate fluctuation | 3.174% | 0.688000 | 13 |
| F13 | Poor implementation of plan (poor performance) | 2.065% | 0.706667 | 8 |
| F14 | Strike, revolution, riot, protest | 2.533% | 0.725333 | 5 |
| F15 | Construction methods | 3.647% | 0.581333 | 22 |
| F16 | Political insecurity and instability | 2.559% | 0.653333 | 20 |
| F17 | Slow decision making | 3.401% | 0.680000 | 17 |
| F18 | Defective design/incorrect/error | 2.712% | 0.717333 | 6 |
| F19 | Increase of material price, price fluctuation, | 3.149% | 0.677333 | 18 |
| F21 | Poor labor productivity | 2.738% | 0.685333 | 14 |
| F22 | Rebellion | 2.363% | 0.648000 | 21 |
| F23 | Poor resource management | 2.290% | 0.810667 | 1 |
| F24 | Unavailability of utility at site (electricity, water) | 3.452% | 0.693333 | 12 |
| F27 | Improper planning and scheduling | 2.189% | 0.728000 | 4 |
| F29 | Unrealistic contract duration and requirements imposed | 2.380% | 0.717333 | 7 |
| F33 | Inappropriate type of project bidding and award | 3.583% | 0.685333 | 15 |
| F40 | Inadequate modern equipment | 3.258% | 0.682667 | 16 |
| List of Risk Factors | Possible Causes of the Risk Factors | If Implemented, the Following Can Improve the Risk Factors | ||||
|---|---|---|---|---|---|---|
| Owner | A/E | Contractor | Owner | A/E | Contractor | |
| Change order |
|
|
|
|
|
|
| Corruption or Bribery |
|
|
|
|
|
|
|
| |||||
| Delays in payment |
|
|
|
|
|
|
| Poor resource management |
|
|
|
|
|
|
| Delay in material delivery |
|
|
|
|
|
|
| Top-3 Ranked Risk Factors by | Before Improvement | Improved by 10% | Improved by 20% | Improved by 30% | Improved by 40% |
|---|---|---|---|---|---|
| Garson Algorithm | 102.85 | 92.25 | 89.7 | 87.72 | 86.08 |
| Relative Importance Index | 102.85 | 100.52 | 98.62 | 96.95 | 95.50 |
Publisher’s Note: MDPI stays neutral with regard to jurisdictional claims in published maps and institutional affiliations. |
© 2021 by the authors. Licensee MDPI, Basel, Switzerland. This article is an open access article distributed under the terms and conditions of the Creative Commons Attribution (CC BY) license (https://creativecommons.org/licenses/by/4.0/).
Share and Cite
Cheng, M.-Y.; Darsa, M.H. Construction Schedule Risk Assessment and Management Strategy for Foreign General Contractors Working in the Ethiopian Construction Industry. Sustainability 2021, 13, 7830. https://doi.org/10.3390/su13147830
Cheng M-Y, Darsa MH. Construction Schedule Risk Assessment and Management Strategy for Foreign General Contractors Working in the Ethiopian Construction Industry. Sustainability. 2021; 13(14):7830. https://doi.org/10.3390/su13147830
Chicago/Turabian StyleCheng, Min-Yuan, and Mohammadzen Hasan Darsa. 2021. "Construction Schedule Risk Assessment and Management Strategy for Foreign General Contractors Working in the Ethiopian Construction Industry" Sustainability 13, no. 14: 7830. https://doi.org/10.3390/su13147830
APA StyleCheng, M.-Y., & Darsa, M. H. (2021). Construction Schedule Risk Assessment and Management Strategy for Foreign General Contractors Working in the Ethiopian Construction Industry. Sustainability, 13(14), 7830. https://doi.org/10.3390/su13147830