Abstract
Iran is mainly located in the arid and semiarid climate zone and seriously affected by desertification. This is a severe environmental problem, which results in a persistent loss of ecosystem services that are fundamental to sustaining life. Process understanding of this phenomenon through the evaluation of important drivers is, however, a challenging work. The main purpose of this study was to perform a quantitative evaluation of the current desertification status in the Segzi Plain, Isfahan Province, Iran, through the modified Mediterranean Desertification and Land Use (MEDALUS) model and GIS. In this regard, five main indicators including soil, groundwater, vegetation cover, climate, and erosion were selected for estimating the environmental sensitivity to desertification. Each of these qualitative indicators is driven by human interference and climate. After statistical analysis and a normality test for each indicator data, spatial distribution maps were established. Then, the maps were scored in the MEDALUS approach, and the current desertification status in the study area from the geometric mean of all five quality indicators was created. Based on the results of the modified MEDALUS model, about 23.5% of the total area can be classified as high risk to desertification and 76.5% classified as very high risk to desertification. The results indicate that climate, vegetation, and groundwater quality are the most important drivers for desertification in the study area. Erosion (wind and water) and soil indices have minimal importance.
1. Introduction
Desertification is a global ecological threat, which is defined as the depletion of biological and economic productivity of both rainfed and irrigated agricultural land, rangeland, forest, and shrubland, through a combination of various human and natural factors [1,2,3,4]. The process of desertification occurs in climates with severe humidity deficits, i.e., arid, semiarid, and dry sub-humid areas [5,6]. Studies confirm that between 10 and 20% of arid and semiarid areas in the world [7,8] and approximately 40% of the total Earth’s land surface suffer from desertification [9,10]. According to the Forest, Range, and Watershed Management Organization of Iran, more than 80% of Iran’s land is directly or indirectly affected by desertification [11].
Considering the complexity of interactions between the driving forces of desertification, assessment of land sensitivity to degradation is one of the most important research efforts in different parts of the world [12,13]. During the last decades, various approaches and models have been developed to assess sensitivity of a region to desertification and land degradation [14,15,16]. In some studies, desertification and land degradation were investigated based on the CORINE Data [17], high-resolution satellite data [18], climate change and human activities [19,20], and using remote sensing technology and multi-component GIS framework [21,22,23,24,25]. In this regard, the Mediterranean Desertification and Land Use (MEDALUS) [26] model is one of the most widely used methods to assess desertification risk. Over the last two decades, it has been used in many studies due to its striking advantages including simplicity, flexibility, and swift performance [1,27,28]. In this model, the desertification risk can be analyzed through multifactorial integration of certain environmental variables including soil, vegetation, water, climate, erosion, geology, and human actions [12,29,30]. One of the benefits of this model is that factors can be modified according to basic data availability for each region [31,32].
The MEDALUS model has been used in different Mediterranean regions at the national, regional, and local scales. Sepehr et al. (2007) assessed the desertification sensitivity in southern Iran, and the outcomes revealed valid performance for this technique [33]. In other studies, Hadeel et al. (2010) in the southern part of Iraq [25], Ladisa et al. (2012) in southeast Italy [34], Vieira et al. (2015) in the Brazilian northeast [35], Lahlaoi et al. (2017) in the Oued El Maleh Basin (northern Morocco) [36], Karamesouti et al. (2018) in Greece [37], and Prăvăliea et al. (2020) in Romania [12], desertification risk has been analyzed. However, very few studies have focused on arid and semiarid areas in the central part of Iran, where desertification is a serious problem. In this region, because of the low amount of precipitation, the main source of water for domestic, agricultural, and industrial purposes is groundwater. Hence, the assessment of groundwater quality is one of the most important factors. In addition, physical loss of soil by wind and water erosion is another main problem in this region. Therefore, the main objective of this study was to develop a desertification assessment model for arid and semiarid areas in central Iran, based on the available data on groundwater and erosion from wind and water that are often neglected in assessment of desertification. We also wanted to determine the influence from other factors such as soil, vegetation, and climate. A final objective of this study was to identify the most affected areas by mapping desertification using GIS tools.
2. Materials and Methods
2.1. Study Area
The Segzi plain in Isfahan Province is located in central Iran with an area of 760 km2 between longitude 52°15′ and 52°53′ E and latitude 32°27′ and 32°41′ N (Figure 1). It includes the city of Isfahan, the provincial capital and the second largest industrial, and the third most populated city in Iran. The Segzi plain is characterized by a flat relief from the Central Iranian Plateau. The climate is semiarid with an average temperature of 15 °C and average annual precipitation of 125 mm. The annual potential evapotranspiration is about 2920 mm. The average surface elevation of the area is about 1520 m above mean sea level. The dry period spans from April to August and most of the rain falls from October to February. The Zayandeh-Rud River is the most important surface water source in the Central Plateau of Iran. The main soil orders of the plain are Fluvisols, Regosols, Cambisols, Gypsisols, and Solonchaks [38].
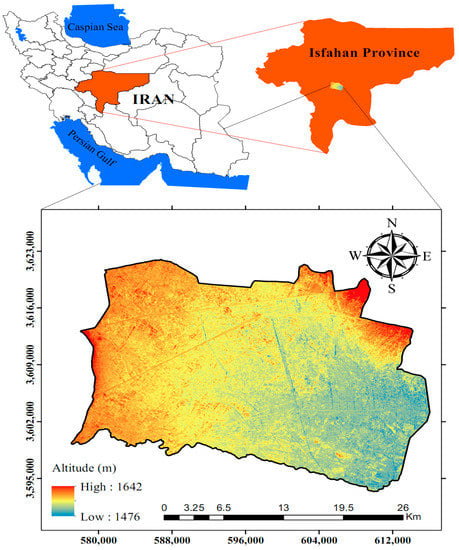
Figure 1.
The Segzi plain located in Isfahan Province, Iran.
2.2. Methodology
2.2.1. General Applied MEDALUS Framework
Desertification is a complex land degradation process that eventually leads to the depletion of land productivity [24]. To assess the sensitivity of desertification, the MEDALUS model was used based on five main quality indices specific to the environmentally sensitive areas (ESAs) including soil, groundwater, vegetation, climate, and erosion. These indices were computed based on a comprehensive data set shown in Figure 2. Based on the modified MEDALUS model, the value of each indicator was determined between 100 and 200, where 100 was assigned to areas of the least sensitivity and 200 to areas with the highest sensitivity to desertification [38]. Each index was categorized into five classes based on sensitivity to desertification including very low, low, moderate, high, and very high (Table 1) [32]. After calculating the indices, ArcGIS software (10.3) (Esri, Redlands, CA, USA) was used to depict the spatial distribution of each index and indicator throughout the study area. Inverse distance weighting (IDW) was applied for interpolation. Finally, the total sensitivity of desertification in the Segzi plain was calculated from the geometric mean of indices, according to:
where SQI is soil quality index, GWQI is groundwater quality index, VQI is vegetation quality index, CQI is climate quality index, and EQI is erosion quality index. The calculation of each index is described below.
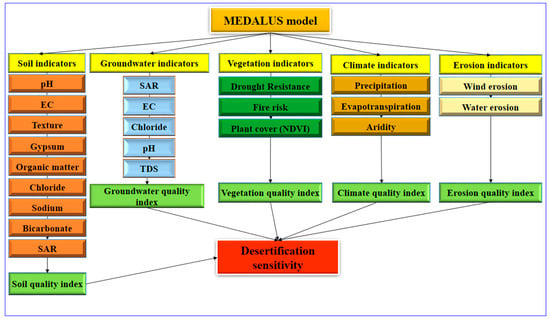
Figure 2.
Flowchart of MEDALUS model methodology based on indices and indicators.

Table 1.
Quantitative scores and qualitative classes of considered indices [32].
2.2.2. Soil Quality Index (SQI) and Indicators
The SQI is a main factor in the desertification process, which affects the soil state due to strength of cohesion between soil particles, water retention capacity, texture, and structure [39,40]. To evaluate SQI, 50 samples in total were collected from a soil depth of 0–20 cm from five different land units (Table 2). The location of soil samples and land units is shown in Figure 3. Next, the SQI was computed based on nine indicators including pH, soil electric conductivity (EC), soil texture (T), soil gypsum (GYP), soil organic matter (OM), chloride (Cl−), sodium (Na+), bicarbonate (HCO3−), and sodium adsorption ratio (SAR).
Table 2.
Characteristics of the physiographic units in the study area [38].
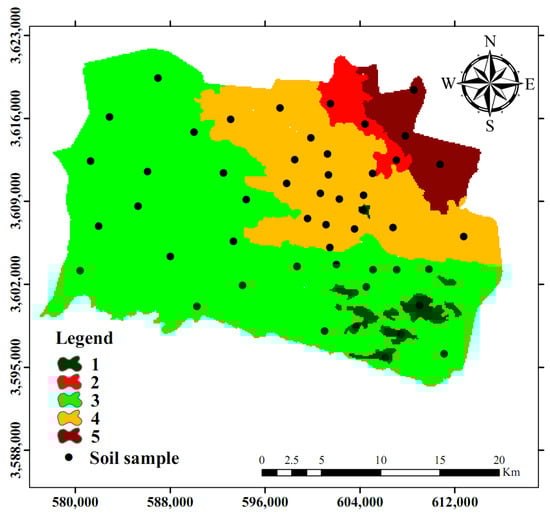
Figure 3.
Physiographical units of the study area (Table 2) and soil sampling.
The SQI was calculated based on the geometric mean of indicators as:
The attributed weights for each soil indicator are presented in Table 3.
Table 3.
Weighted scores and classes of soil indicators [38].
2.2.3. Groundwater Quality Index (GWQI) and Indicators
Groundwater is the primary source of water supply in arid and semiarid regions [41]. Reduced groundwater quality is one of the major causes of land degradation in these regions [42]. The assessment of groundwater quality index can help policymakers to develop sustainable management of semiarid areas. Therefore, to evaluate GWQI, 17 samples in total were collected from wells in the study area. The WGQI was calculated based on five indicators including: sodium adsorption ratio (SAR), electric conductivity (EC), chloride (Cl−), pH, and total dissolved solids (TDS). The GWQI was assessed based on the geometric mean of indicators according to:
The weights attributed to each water indicator are presented in Table 4.
Table 4.
Weighted scores and classes of groundwater indicators.
2.2.4. Vegetation Quality Index (VQI) and Indicators
Vegetation cover is an important biotic land component in the evaluation of desertification in semiarid areas [43]. Vegetation cover reduces runoff by promoting water infiltration. Besides, the vegetation cover enriches the surface soil with organic matter and improves its structure and cohesion, thus providing a high capacity to reduce the intensity of soil erosion [36]. In this study, the VQI was assessed by three different indicators including drought resistance (DR), fire risk (FR), and plant cover (PC). The erosion protection, drought resistance, and fire risk indicators were derived from the land use/land cover map, and the plant cover indicator was extracted from the normalized difference vegetation index (NDVI). The weighted scores and classes of vegetation cover indicators are presented in Table 5. The VQI was calculated by:
Table 5.
Weighted scores and classes of vegetation cover indicators.
2.2.5. Climate Quality Index (CQI) and Indicators
The spatiotemporal distribution of precipitation and evapotranspiration are the most important parameters in hydrology and ecology [44,45]. Precipitation plays a significant role in land degradation and desertification, as it determines runoff and soil water content [43]. The CQI was calculated based on three indicators including: precipitation (P), potential evapotranspiration (ETp), and aridity index (AI). Two climatic stations, located in the study area, were used to assess the precipitation and evapotranspiration indicators. Furthermore, aridity index was computed based on annual precipitation and potential evapo-transpiration. The weighted scores and classes of CQI indicators are presented in Table 6. The CQI was calculated according to:
Table 6.
Weighted scores and classes of climate indicators [35].
2.2.6. Erosion Quality Index (EQI) and Indicators
The EQI was assessed using wind and water erosion indicators. The wind erosion and water erosion indicators were computed using Iranian Research Institute of Forest and Rangelands (IRIFR) [46] and the Pacific South-West Inter-Agency Committee (PSIAC) [47] methods, respectively. To calculate the wind erosion, nine parameters that affect the wind erosion process were considered. These parameters included lithology, morphology, wind velocity, soil characteristics, type and plant cover percentage, wind erosion features, soil moisture, type and distribution of sand dunes, land use, and land management. To evaluate the water erosion, the following parameters were used: lithology, soil, climate, runoff, morphology, vegetation cover, and land use. Then, the wind and water erosion indicators were categorized into five classes as shown in Table 7. Ultimately, the EQI was computed as:
Table 7.
Weighted scores and classes of erosion indicators.
3. Results and Discussion
3.1. Soil Quality Index
The summary statistics of soil parameters such as minimum, maximum, mean, and standard deviation are presented in Table 8. The EC values ranged from 2.5 to 174.7 ds/m in the study area. The Cl−, HCO3−, and Na+ concentrations varied from 17.5 to 2766 meq/L, 5 to 30 meq/L, and 4 to 10,946 meq/L, respectively. The average pH of the soil was 8, which is a weak alkaline soil with a small spatial variation. Moreover, the average organic matter and gypsum of soil samples was 0.5% and 9.5%, and their maximum was 14.6 and 16.5, respectively.
Table 8.
Statistical characteristics of soil indicators.
The spatial distribution of soil indicators and soil quality index based on MEDALUS is shown in Figure 4 and Figure 5, respectively. The results show that 18.9% (143.8 km2), 54.6% (415.1 km2), and 26.5% (201.6 km2) of the study area can be classified into low, moderate, and high sensitivity to desertification, respectively. According to the spatial distribution of soil quality index, the central part of the region has high degradation of SQI due to the accumulation of salts in the soil, and very low content of organic matter (Figure 4h). This area also has a high gypsum content (Figure 4f), which can cause soil to lose its structure and become more susceptible to water and wind erosion [38]. Due to the significant influence of SQI on vegetation growth, this index also indirectly indicates desertification. According to Figure 4, the Na+, EC, Cl−, and SAR have a similar spatial distribution with high values in the central part of the region corresponding to a desert area. However, other districts, especially agricultural fields, are in the southwest of the study area. Moreover, the soil quality indicators show that texture and organic matter with 125 and 157 as mean value, respectively, are the least and the most sensitive indicators to desertification.
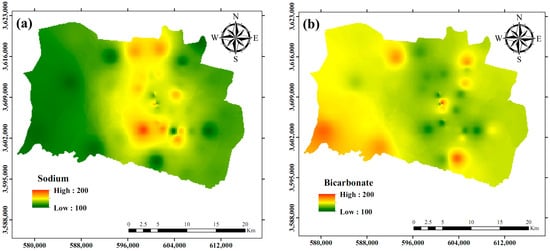
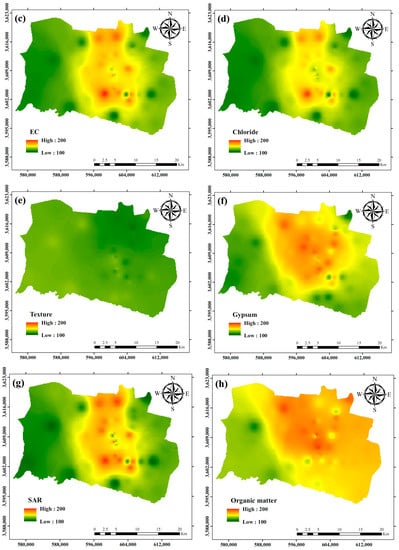
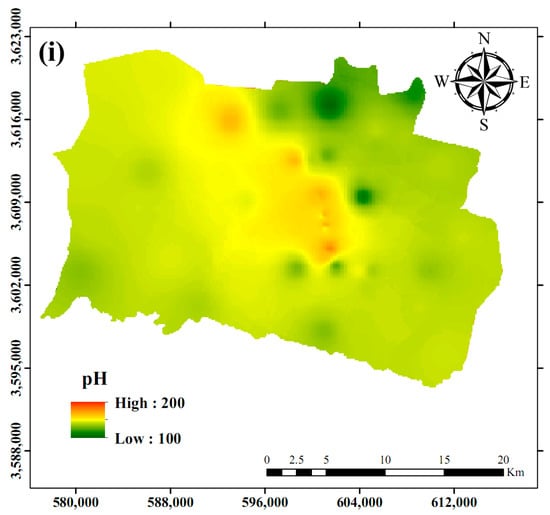
Figure 4.
Spatial distribution of soil quality indicators: (a) Sodium; (b) Bicarbonate; (c) Electric conductivity; (d) Chloride; (e) Texture; (f) Gypsum; (g) Sodium absorption ratio; (h) Organic matter; and (i) pH.
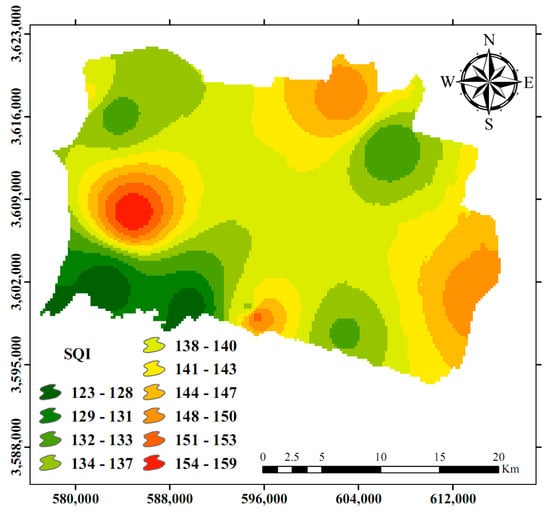
Figure 5.
Spatial distribution of soil quality index.
3.2. Groundwater Quality Index
A summary statistical description of groundwater quality parameters is presented in Table 9. The groundwater in this area is slightly alkaline to neutral, as pH ranges from 7.1 to 8, with a mean of 7.5. The electrical conductivity (EC) varies from 1465 to 12,648 μS/cm, with a mean of 4752 μS/cm. The total dissolved solids ranges from 1025 to 8853 mg/L. The average concentration of Cl− is 32.6 meq/L.
Table 9.
Statistical characteristics of groundwater indicators.
The spatial distribution of groundwater quality index and its indicators are shown in Figure 6 and Figure 7, respectively. The results of GWQI show that groundwater in the area is not in a good condition, as 6.5% (49.5 km2) of the area can be classified as moderate and 90.9% (691.8 km2) as highly sensitive to desertification. A small percentage (2.6%) of the study area is in the very high class based on the GWQI.
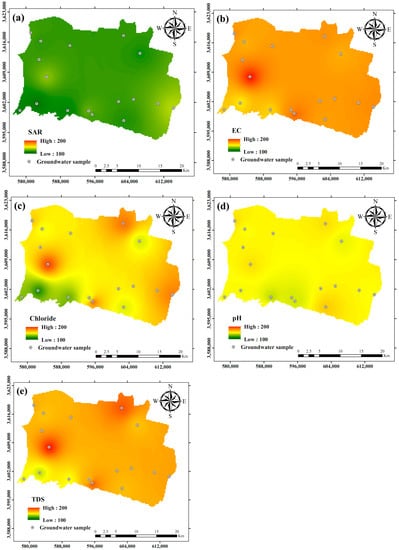
Figure 6.
Spatial distribution of groundwater quality indicators: (a) Sodium absorption ratio; (b) Electric conductivity; (c) Chloride; (d) pH; and (e) Total dissolved solids.
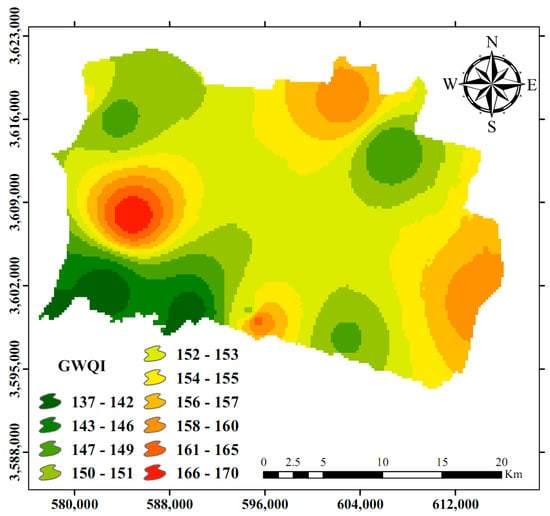
Figure 7.
Spatial distribution of groundwater quality index.
The results demonstrate that almost the whole study area can be classified with high sensitivity to desertification based on groundwater indicators (Figure 7). The EC and TDS have the greatest effect on desertification. The SAR with a mean of 120 mean value has the lowest effect on land degradation in the study area.
3.3. Vegetation Quality Index
Because of the dry climate along with alkalinity and salinity of the soil, the situation for vegetation is not good. The areas in the very high desertification class lack vegetation because of the high amount of saline and alkaline soil. Among the vegetation quality indices, plant cover (mean 194) has the largest impact for the desertification in the area. Fire risk (mean 156) is the least sensitive indicator to desertification (Figure 8).
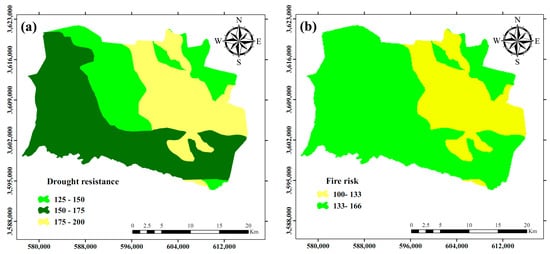
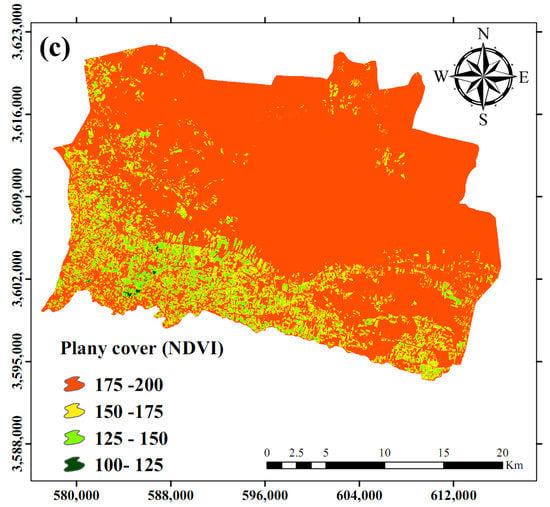
Figure 8.
Spatial distribution of vegetation cover indicators: (a) Drought resistance indicator; (b) Fire risk indicator; and (c) Plant cover indicator.
According to the vegetation map (Figure 9) of this area, 261.2 km2 (34.3%) are in the high class and 483.7 km2 (63.6%) in very high risk of desertification. However, a negligible percentage (2%) of the study area is in the low class for vegetation quality index.
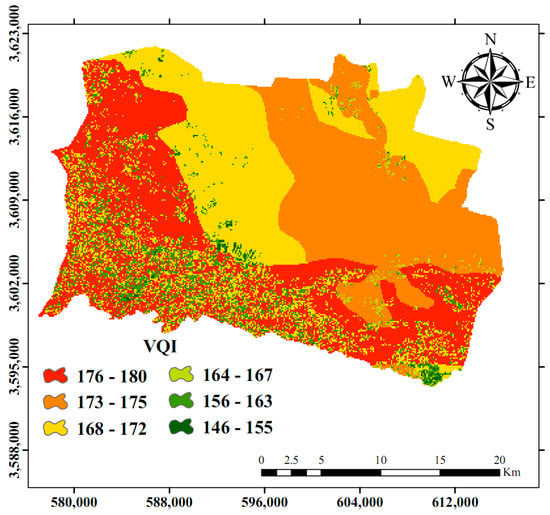
Figure 9.
Spatial distribution of vegetation quality index.
3.4. Climate Quality Index
In terms of climate quality index, the whole area is in the very high class of risk for desertification. Rainfall average in the study area is very small (mean 125.7 mm/year) in relation to potential evapotranspiration (mean 2920 mm per year). The climate indicators (precipitation, potential evapotranspiration, and aridity indicators) for the region, shown in Figure 10, are not significantly different. Figure 11 demonstrates that the entire area is classified as very high in terms of precipitation, potential evapotranspiration, and aridity indicators. Moreover, the results of climate quality indicators show that potential evapotranspiration (mean 197) is the most sensitive indicator to desertification (Figure 10).
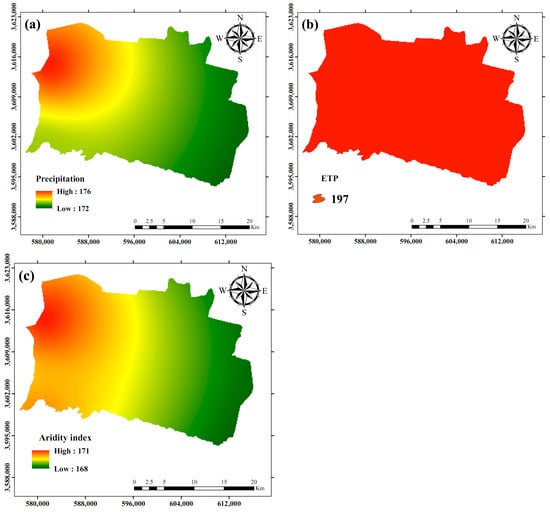
Figure 10.
Spatial distribution of climate indicators: (a) Precipitation indicator; (b) Evapotranspiration indicator; and (c) Aridity Index.
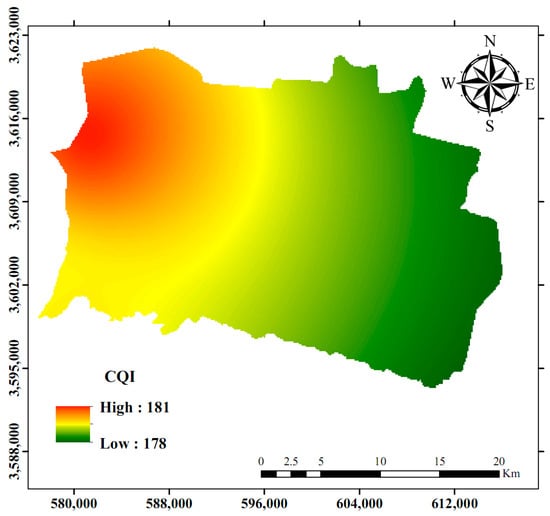
Figure 11.
Spatial distribution of climate quality index.
3.5. Erosion Quality Index
Figure 12 and Figure 13 show maps of erosion indicators and erosion quality index. Based on wind erosion, almost 204 km2 (27%) of the study area are located in the low, 535 km2 (70%) in moderate, and 21 km2 (3%) in the high class of desertification (Figure 12). Moreover, in terms of water erosion indicator, the area classified in very low, low, and moderate is 16.5 km2 (2.5%), 590 km2 (77.5%), and 154 km2 (20%), respectively (Figure 12). About 18.6% (1414.5 km2) of the total area is located in the low class, regarding erosion quality index, and the moderate and high classes each occupy approximately 40% of the study area.
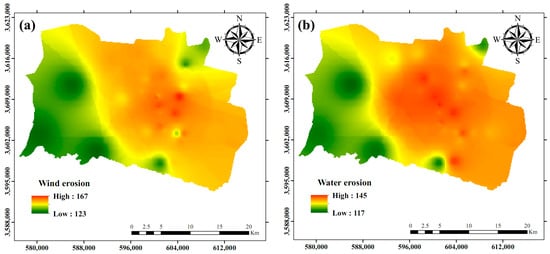
Figure 12.
Spatial distribution of erosion quality indicators: (a) Wind erosion indicator; and (b) Water erosion indocator.
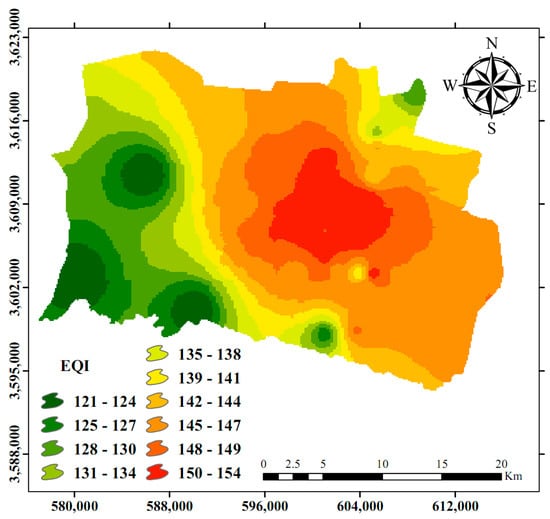
Figure 13.
Spatial distribution of erosion quality index.
3.6. Environmentally Sensitive Areas to Desertification
Based on the results, desertification sensitivity can be described as presented in Table 10.
Table 10.
Ranges and classes of desertification sensitivity index.
After averaging the indices, the desertification sensitivity map was produced based on MEDALUS results. Figure 14 shows the distribution of ESAs in the study area, and the highly sensitive areas to desertification in Segzi plain are found in the central part, where soil, groundwater, and erosion quality are low. The southwest part of the study area is classified as high sensitivity to desertification because it has better quality of soil, water, and vegetation. The result illustrates that approximately 23.5% (178 km2) of the area is located in high and 76.5% (582 km2) in very high class of desertification. The weighted mean intensity of desertification for the total area of Segzi is 156, which is in the very high class of desertification risk. In other words, the entire study area is highly sensitive to desertification. The results illustrate that climate, vegetation, and groundwater quality are the most important indicators affecting the desertification process. Soil and erosion quality has the least impact on desertification in the area, with a mean of 138 and 140, respectively.
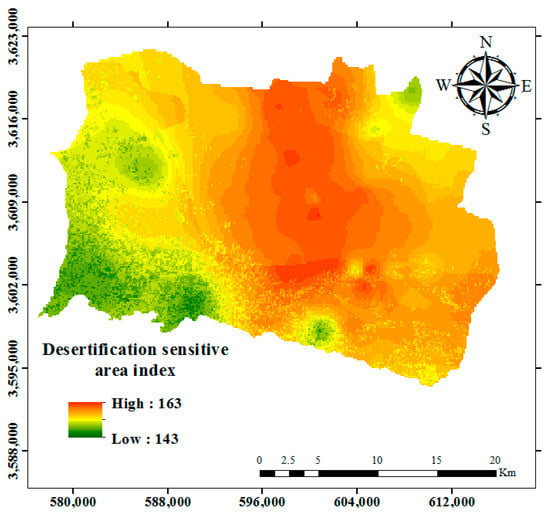
Figure 14.
Environmentally sensitive areas (ESAs) for desertification in the Segzi plain.
Climate quality index is most important for desertification in this region because of high rates of evapotranspiration, along with low precipitation. Similar results were reported by researchers working on desertification in different parts of the world [10,48,49]. High evapotranspiration rates cause salinization of soils. At the same time, soils are easily erodible [50]. The salinity causes decreased vegetation density that further strengthens desertification. Lack of vegetation results in direct wind impact on soil surface, causing faster-drying soil, high amount of soil erosion, and desertification.
The central parts of the area are characterized by excessive soil salinity and alkalinity (mean EC = 79.84 ds/m) with little vegetation. Due to the fine-grade soil, wind erosion occurs during the dry season and water erosion during the wet season. In the northwest, west, and southwest regions, desertification is less intense than in other regions. In these areas, there is slight wind erosion in most years because of agricultural crops. The existing crop cover and decreased wind speed, which directly controls wind erosion, prevent the soil from drying out and indirectly cause erosion control in the region.
In the Segzi plain, the effect of wind erosion is much greater than water erosion. One of the main reasons for this is that the flat area inhibits low water erosion. Instead, strong winds (average 8 m/s) increase wind erosion intensity.
4. Conclusions
Desertification is one of the major environmental problems in arid and semiarid areas. In this study, the modified MEDALUS model was used to improve the understanding of the degradation/desertification process based on a comprehensive set of indices in the Segzi plain. The model is a valuable method to assess the desertification risk in arid and semiarid areas. Five important quality indices including soil, groundwater, vegetation, climate, and erosion were used in the investigation. Each index was weighted and calculated by a combination of sub-indicators. They were then combined to evaluate final desertification sensitivity index.
The results, based on all five quality indices, demonstrated that the study area is highly exposed to desertification processes, especially the central parts of the plain. The results also showed that climate, vegetation, and groundwater are the most important quality indices to describe the desertification processes in the study area. These indices present a high to a very high sensitivity to desertification in 100, 97.9, and 90.9% of the study area. The results are in line with some previous studies [10,27,32,33,36,39,45,51], while several surveys stress that one of the main quality indices to describe desertification processes is the management quality index [3,12,30], which should be considered in future studies. According to the produced desertification map, almost 178 km2 (23.5%) of the area are classified in the high and 582 km2 (76.5%) in the very high classes of desertification risk. Hence, the outcomes demonstrate that the study area is very sensitive to land degradation and desertification. Therefore, the developed model can be used to evaluate the quantity, intensity, and severity of different desertification processes in the study area.
The MEDALUS model is a useful method to evaluate desertification that can help decision makers to support sustainable management of the land that is sensitive to degradation processes like the Segzi plain. Climate variation, vegetation cover, and groundwater quality should be continuously monitored to inform sustainable land management strategies. Therefore, the approach used in this investigation can provide information to help decision makers for the region to combat desertification more effectively. The model can also be used as a useful tool in other regions with similar conditions.
The use of the MEDALUS approach to study desertification processes was delimited by available data such as groundwater quality and erosion from mainly wind and water. The results are representative for arid areas such as in the studied catchment. Future research would benefit from including more data types in the process study such as management systems and socioeconomic data.
Author Contributions
Conceptualization and methodology by A.K. and E.K.M.; software by A.K. and E.K.M.; validation by A.K. and E.K.M.; investigation by A.K. and E.K.M.; formal analysis by A.K. and E.K.M.; writing—original draft preparation, A.K., S.F.A., E.K.M. and R.B.; resources by A.K. and E.K.M.; writing—review and editing by E.K.M. and R.B. All authors have read and agreed to the published version of the manuscript.
Funding
This research received no external funding.
Institutional Review Board Statement
Not applicable.
Informed Consent Statement
Not applicable.
Data Availability Statement
Not applicable.
Acknowledgments
The authors are grateful to the United States Geological Survey (USGS) team for providing the Landsat images via https://earthexplorer.usgs.gov/ (accessed on 13 May 2020). We also would like to thank the Centre for Middle Eastern Studies at Lund University and the Ministry of Science, Research and Technology of the Islamic Republic of Iran. The authors also thank two anonymous reviewers and the journal editor for constructive comments on the manuscript.
Conflicts of Interest
The authors declare no conflict of interest.
References
- Uzuner, Ç.; Dengiz, O. Desertification risk assessment in Turkey based on environmentally sensitive areas. Ecol. Indic. 2020, 114, 106295. [Google Scholar] [CrossRef]
- Tlili, A.; Tarhouni, M.; Cerdà, A.; Louhaichi, M.; Neffati, M. Comparing yield and growth characteristics of four pastoral plant species under two salinity soil levels. Land Degrad. Dev. 2018, 29, 3104–3111. [Google Scholar] [CrossRef]
- Plaiklang, S.; Sutthivanich, I.; Sritarapipat, T.; Panurak, K.; Ogawa, S.; Charungthanakij, S.; Maneewan, U.; Thongrueang, N. Desertification assessment usinf MEDALUS model in upper Lamchiengkrai watershed, Thailand. ISPRS Int. Arch. Photogramm. Remote Sens. Spat. Inf. Sci. 2020, XLIII-B3-2020, 1257–1262. [Google Scholar] [CrossRef]
- Masoudi, M.; Jokar, P.; Pradhan, B. A new approach for land degradation and desertification assessment using geospatial techniques. Nat. Hazards Earth Syst. Sci. 2018, 18, 1133–1140. [Google Scholar] [CrossRef] [Green Version]
- De Pina Tavares, J.; Baptista, I.; Ferreira, A.J.D.; Amiotte-Suchet, P.; Coelho, C.; Gomes, S.; Amoros, R.; Dos Reis, E.A.; Mendes, A.F.; Costa, L.; et al. Assessment and mapping the sensitive areas to desertification in an insular Sahelian mountain region Case study of the Ribeira Seca Watershed, Santiago Island, Cabo Verde. Catena 2015, 128, 214–223. [Google Scholar] [CrossRef]
- Ranjbar, A.; Heydarnejad, S.; Mousavi, S.H.; Mirzaei, R. Mapping desertification potential using life cycle assessment method: A case study in Lorestan Province, Iran. J. Arid. Land 2019, 11, 652–663. [Google Scholar] [CrossRef] [Green Version]
- Akbari, M.; Shalamzari, M.J.; Memarian, H.; Gholami, A. Monitoring desertification processes using ecological indicators and providing management programs in arid regions of Iran. Ecol. Indic. 2020, 111, 106011. [Google Scholar] [CrossRef]
- Okin, G.S.; D’Odorico, P.; Liu, J. A mechanism of land degradation in Turf-Mantled slopes of the Tibetan plateau. Geophys. Res. Lett. 2018, 45, 4041–4048. [Google Scholar] [CrossRef] [Green Version]
- Nkonya, E.; Mirzabaev, A.; von Braun, J. Economics of land degradation and improvement: An introduction and overview. In Economics of Land Degradation and Improvement—A Global Assessment for Sustainable Development; Springer International Publishing: Cham, Switzerland, 2016; pp. 1–14. [Google Scholar]
- Lamqadem, A.A.; Pradhan, B.; Saber, H.; Rahimi, A. Desertification sensitivity analysis using MEDALUS Model and GIS: A case study of the oases of Middle Draa Valley, Morocco. Sensors 2018, 18, 2230. [Google Scholar] [CrossRef] [Green Version]
- Forest, Range, and Watershed Management Organization (FRW). National Action Program for Combating Desertification and Mitigation of Drought Impacts; FRW: Tehran, Iran, 2016.
- Prăvălie, R.; Patriche, C.; Săvulescu, I.; Sirodoev, I.; Bandoc, G.; Sfîcă, L. Spatial assessment of land sensitivity to degradation across Romania. A quantitative approach based on the modified MEDALUS methodology. Catena 2020, 187, 104407. [Google Scholar] [CrossRef]
- Liu, Q.; Liu, G.; Huang, C. Monitoring desertification processes in Mongolian Plateau using MODIS tasseled cap transformation and TGSI time series. J. Arid. Land 2018, 10, 12–26. [Google Scholar] [CrossRef] [Green Version]
- Kairis, O.; Karavitis, C.; Salvati, L.; Kounalaki, A.; Kosmas, K. Exploring the impact of overgrazing on soil erosion and land degradation in a dry mediterranean agro-forest landscape (Crete, Greece). Arid. Land Res. Manag. 2015, 29, 360–374. [Google Scholar] [CrossRef]
- Prăvălie, R.; Patriche, C.V.; Bandoc, G. Quantification of land degradation sensitivity areas in Southern and Central Southeastern Europe. New results based on improving DISMED methodology with new climate data. Catena 2017, 158, 309–320. [Google Scholar] [CrossRef]
- Kamali Maskooni, E.; Kamali, M.A.; Amiri, I.; Zare, M.; Saidi Goraghani, K. Study of desertification status using IMDPAModel with emphasis on water, soil and vegetation criteria (case study: Faryab-Kerman Province). J. Biol. Forum 2015, 7, 1149–1155. [Google Scholar]
- Castanho, R.A.; Gomez, J.N.; Vulevic, A.; Couto, G. The land-use change dynamics based on the CORINE Data in the period 1990–2018 in the European archipelagos of the Macaronesia Region: Azores, Canary Islands, and Madeira. ISPRS Int. J. Geo-Inf. 2021, 10, 342. [Google Scholar] [CrossRef]
- Christian, B.A.; Dhinwa, P.S.; Ajai, P. Long term monitoring and assessment of desertification processes using medium and high resolution satellite data. Appl. Geogr. 2018, 97, 10–24. [Google Scholar] [CrossRef]
- Li, Q.; Zhang, C.; Shen, Y.; Jia, W.; Li, J. Quantitative assessment of the relative roles of climate change and human activities in desertification processes on the Qinghai-Tibet Plateau based on net primary productivity. Catena 2016, 147, 789–796. [Google Scholar] [CrossRef]
- Zhou, W.; Gang, C.; Zhou, F.; Li, J.; Dong, X.; Zhao, C. Quantitative assessment of the individual contribution of climate and human factors to desertification in northwest China using net primary productivity as an indicator. Ecol. Indic. 2015, 48, 560–569. [Google Scholar] [CrossRef]
- Lamchin, M.; Lee, J.-Y.; Lee, W.-K.; Lee, E.J.; Kim, M.; Lim, C.-H.; Choi, H.-A.; Kim, S.-R. Assessment of land cover change and desertification using remote sensing technology in a local region of Mongolia. Adv. Space Res. 2016, 57, 64–77. [Google Scholar] [CrossRef]
- Santini, M.; Caccamo, G.; Laurenti, A.; Noce, S.; Valentini, R. A multi-component GIS framework for desertification risk assessment by an integrated index. Appl. Geogr. 2010, 30, 394–415. [Google Scholar] [CrossRef]
- Dutta, S.; Chaudhuri, G. Evaluating Environmental sensitivity of arid and semiarid regions in northeastern Rajasthan, India. Geogr. Rev. 2015, 105, 441–461. [Google Scholar] [CrossRef]
- Gad, A.; Lotfy, I. Use of remote sensing and GIS in mapping the environmental sensitivity areas for desertification of Egyptian territory. eEarth Discuss. 2008, 3, 41–85. [Google Scholar] [CrossRef] [Green Version]
- Hadeel, A.S.; Jabbar, M.T.; Chen, X. Application of remote sensing and GIS in the study of environmental sensitivity to desertification: A case study in Basrah Province, southern part of Iraq. Appl. Geomat. 2010, 2, 101–112. [Google Scholar] [CrossRef] [Green Version]
- Kosmas, C.; Ferrara, A.; Briassouli, H.; Imeson, A. The Medalus project Mediterranean desertification and land use. Manual on key indicators of desertification and mapping environmentally sensitive areas to desertification. In Desertification in the Mediterranean Region. A Security Issue; Kluwer Academic Publishers: Dordrecht, The Netherlands, 1999; pp. 525–547. [Google Scholar]
- Bedoui, C. Study of desertification sensitivity in Talh region (Central Tunisia) using remote sensing, G.I.S. and the M.E.D.A.L.U.S. approach. Geoenviron. Disasters 2020, 7, 16. [Google Scholar] [CrossRef]
- Ferrara, A.; Kosmas, C.; Salvati, L.; Padula, A.; Mancino, G.; Nolè, A. Updating the MEDALUS-ESA framework for worldwide land degradation and desertification assessment. Land Degrad. Dev. 2020, 31, 1593–1607. [Google Scholar] [CrossRef]
- Jiang, L.; Bao, A.; Jiapaer, G.; Guo, H.; Zheng, G.; Gafforov, K.; Kurban, A.; De Maeyer, P. Monitoring land sensitivity to desertification in Central Asia: Convergence or divergence? Sci. Total Environ. 2019, 658, 669–683. [Google Scholar] [CrossRef]
- Momirović, N.; Kadović, R.; Perović, V.; Marjanovic, M.; Baumgertel, A. Spatial assessment of the areas sensitive to degradation in the rural area of the municipality Čukarica. Int. Soil Water Conserv. Res. 2019, 7, 71–80. [Google Scholar] [CrossRef]
- Taghipour-Javi, S.; Fazeli, A.; Kazemi, B. A case study of desertification hazard mapping using the MEDALUS (ESAs) methodology in southwest Iran. J. Nat. Resour. Dev. 2016, 6, 1–8. [Google Scholar] [CrossRef]
- Capozzi, F.; Di Palma, A.; De Paola, F.; Giugni, M.; Iavazzo, P.; Topa, M.E.; Adamo, P.; Giordano, S. Assessing desertification in sub-Saharan peri-urban areas: Case study applications in Burkina Faso and Senegal. J. Geochem. Explor. 2018, 190, 281–291. [Google Scholar] [CrossRef]
- Sepehr, A.; Hassanli, A.M.; Ekhtesasi, M.R.; Jamali, J.B. Quantitative assessment of desertification in south of Iran using MEDALUS method. Environ. Monit. Assess. 2007, 134, 243–254. [Google Scholar] [CrossRef]
- Ladisa, G.; Todorovic, M.; Liuzzi, G.T. A GIS-based approach for desertification risk assessment in Apulia region, SE Italy. Phys. Chem. Earth Parts A/B/C 2012, 49, 103–113. [Google Scholar] [CrossRef]
- Vieira, R.M.S.P.; Tomasella, J.; Alvalá, R.C.S.; Sestini, M.F.; Affonso, A.G.; Rodriguez, D.A.; Barbosa, A.A.; Cunha, A.P.M.A.; Valles, G.F.; Crepani, E.; et al. Identifying areas susceptible to desertification in the Brazilian northeast. Solid Earth 2015, 6, 347–360. [Google Scholar] [CrossRef] [Green Version]
- Lahlaoi, H.; Rhinane, H.; Hilali, A.; Lahssini, S.; Moukrim, S. Desertification assessment using MEDALUS model in watershed Oued El Maleh, Morocco. Geosciences 2017, 7, 50. [Google Scholar] [CrossRef] [Green Version]
- Karamesouti, M.; Panagos, P.; Kosmas, C. Model-based spatio-temporal analysis of land desertification risk in Greece. Catena 2018, 167, 266–275. [Google Scholar] [CrossRef]
- Khanamani, A.; Fathizad, H.; Karimi, H.; Shojaei, S. Assessing desertification by using soil indices. Arab. J. Geosci. 2017, 10, 287. [Google Scholar] [CrossRef]
- Prăvălie, R.; Săvulescu, I.; Patriche, C.; Dumitraşcu, M.; Bandoc, G. Spatial assessment of land degradation sensitive areas in southwestern Romania using modified MEDALUS method. Catena 2017, 153, 114–130. [Google Scholar] [CrossRef]
- Shokr, M.S.; Abdellatif, M.A.; El Baroudy, A.A.; Elnashar, A.; Ali, E.F.; Belal, A.A.; Attia, W.; Ahmed, M.; Aldosari, A.A.; Szantoi, Z.; et al. Development of a spatial model for soil quality assessment under arid and semi-arid conditions. Sustainability 2021, 13, 2893. [Google Scholar] [CrossRef]
- Emam, A.R.; Kappas, M.; Akhavan, S.; Hosseini, S.Z.; Abbaspour, K.C. Estimation of groundwater recharge and its relation to land degradation: Case study of a semi-arid river basin in Iran. Environ. Earth Sci. 2015, 74, 6791–6803. [Google Scholar] [CrossRef]
- Nyssen, J.; Poesen, J.; Deckers, J. Land degradation and soil and water conservation in tropical highlands. Soil Tillage Res. 2009, 103, 197–202. [Google Scholar] [CrossRef]
- Lee, E.J.; Piao, D.; Song, C.; Kim, J.; Lim, C.-H.; Kim, E.; Moon, J.; Kafatos, M.; Lamchin, M.; Jeon, S.W.; et al. Assessing environmentally sensitive land to desertification using MEDALUS method in Mongolia. For. Sci. Technol. 2019, 15, 210–220. [Google Scholar] [CrossRef] [Green Version]
- Zhu, L.; Meng, J. Study on rainfall variations in the middle part of Inner Mongolia, China during the past 43 years. Environ. Earth Sci. 2010, 60, 1661–1671. [Google Scholar] [CrossRef]
- Saleh, A.; Belal, A.; Jalhoum, M. Quantitative assessment of environmental sensitivity to desertification in Sidi Abdel-Rahman area, Northern West Coast of Egypt. Egypt. J. Soil Sci. 2018, 58. [Google Scholar] [CrossRef] [Green Version]
- Sardo, I.K.; Besalatpour, A.; Bashari, H.; Shirani, H.; Broujeni, I.E. Assessment of IRIFR model capability in simulation of soil loss in different wind geomorphology landforms using wind erosion meter. Arid. Biome 2017, 7, 13–25. [Google Scholar] [CrossRef]
- PSIAC. Factors Affecting Sediment Yield in the Pacific Southwest Area and Selection and Evaluation of Measures for Reduction of Erosion and Sediment Yield; Report No. HY12; Water Management Subcommittee on ASCE: Washington, DC, USA, 1969. [Google Scholar]
- Wijitkosum, S. Factor influencing land degradation sensitivity and desertification in a drought prone watershed in Thailand. Int. Soil Water Conserv. Res. 2021, 9, 217–228. [Google Scholar] [CrossRef]
- Djeddaoui, F.; Chadli, M.; Gloaguen, R. Desertification susceptibility mapping using logistic regression analysis in the Djelfa Area, Algeria. Remote Sens. 2017, 9, 1031. [Google Scholar] [CrossRef] [Green Version]
- Jabbar, M.; Chen, X. Land degradation due to salinization in arid and semi-arid regions with the aid of geo-information techniques. Geo-Spat. Inf. Sci. 2008, 11, 112–120. [Google Scholar] [CrossRef]
- Kadović, R.; Bohajar, Y.A.M.; Perović, V.; Simić, S.B.; Todosijević, M.; Tošić, S.; Anđelić, M.; Mlađan, D.; Dovezenski, U. Land sensitivity analysis of degradation using MEDALUS model: Case study of Deliblato Sands, Serbia. Arch. Environ. Prot. 2016, 42, 114–124. [Google Scholar] [CrossRef]
Publisher’s Note: MDPI stays neutral with regard to jurisdictional claims in published maps and institutional affiliations. |
© 2021 by the authors. Licensee MDPI, Basel, Switzerland. This article is an open access article distributed under the terms and conditions of the Creative Commons Attribution (CC BY) license (https://creativecommons.org/licenses/by/4.0/).