Abstract
Secondary tropical forests and coffee agroforestry systems contain fewer trees than native forests but can positively impact soil hydrological functions, such as water infiltration compared to the pasture land that they replace. However, for both land uses it remains in how far the soil hydraulic characteristics are comparable to that of native forest. Therefore, we investigated the saturated hydraulic conductivity (Ks) and some hydrophysical soil attributes in four land-use types: (i) a shade-grown coffee; (ii) a natural regenerated forest 15 years ago; (iii) a pasture; and (iv) a reference forest, in the municipality of La Jagua de Ibirico, César department, Colombia. We determined historical land use and conducted soil sampling, using the Beerkan method to determine the Ks values. We also measured canopy cover, vegetation height, diameter at breast height and total number of trees in the forest covers. Our results indicate that Ks values were similar for the coffee and the reference forest, reflecting the positive effect of trees on soil hydrological functioning in agroforestry systems. Our results suggest that 15 years of forest regeneration after land abandonment in Sub-Andean Forest, can improve the soil hydraulic attributes. Additionally, soil water repellency was observed for the reference forest soil.
1. Introduction
Agriculture is important for the local livelihoods, the economy, and feeding the world, but it is also a leading cause of environmental damages, including deforestation, biodiversity loss, the spread of invasive species, water pollution and aquifer depletion, soil erosion and land degradation [1,2]. Especially in tropical regions, the use of agroforestry practices has increased over the last decades in order to improve the sustainability of croplands. Agroforestry systems are based on the principle that trees provide benefits to the cropping system [3,4]. In the American tropics, coffee is considered one of the most important economic crops, and is usually produced in agroforestry systems [5]. This is also the case for Colombia, where coffee is the main commercial agricultural crop, generating 12.4% of the total agricultural revenue, moreover, it is estimated that more than half of Colombian coffee is shade-grown [6].
New forests have been emerging in human-impacted landscapes as a consequence of forest restoration actions or natural regeneration [7,8]. These new forests and the shade-grown coffee agroecosystems are important to conserve a large part of the biological diversity of the tropical forests, and also to provide a variety of other ecosystems services (i.e., carbon sequestration, pollination, and production of arboreal biomass) [9,10]. They may also provide hydrological ecosystem services by improving soil infiltration but their physical and hydraulic soil attributes have been poorly studied so far [11,12,13]. For instance, it is not clear how long it takes to recover infiltration after abandonment of the pastures. Also is not clear how similar are the soil properties between transformed ecosystems and native forests.
Our investigation focuses on the soil saturated hydraulic conductivity (Ks) because this variable is particularly sensitive to soil disturbance and is often used as an of the influence of land-use change on infiltration and soil hydrological functioning [10,14,15]. On the other hand, Ks is one of the most variable infiltration parameters, affecting negatively the performance of hydrological models [16,17,18]. Overall, Ks is controlled by spatial factors, such as soil moisture and temperature, channels formed by roots and fauna, fissures between soil aggregates, and vegetation that can create species-specific litter quality [11]. Another main factor that affects infiltration is soil water repellency which is caused by organic compounds. It can reduce infiltration and increase surface soil water erosion. As plant species and corresponding litter, as well as management of forest stands, can significantly cause water repellency [19]. It is important to determine the impact of water repellency for Sub-Andean Forest.
In order to understand the effect of secondary tropical forest regeneration and coffee agroforestry on infiltration, we measured and compared the Ks and wettability (a measure of water repellency) in four land-use types: (i) a shade-grown coffee (CO); (ii) a secondary forest that natural regenerated after land abandonment 15 years ago (NR); (iii) An actively used pasture (PA); and (iv) a reference forest (RF). All four sites are located with in the municipality of La Jagua de Ibirico, César department, Colombia. To the best of our knowledge, no studies have investigated Ks recovery after forest regrowth in the Colombian Sub-Andean Forest and compared the results with pasture and coffee agroecosystem. We hypothesized that mean Ks values would vary with intensity of land-use (RF > NR > CO > PA).
2. Materials and Methods
2.1. Study Area
The study area is located in the municipality of La Jagua de Ibirico, César department, Colombia (Figure 1). The climate in this region is semi-humid according to the Thornthwaite classification, the elevation is approximately 1300 m, mean annual temperature is 24 °C and mean annual rainfall is 2185 mm [20]. The wettest period is from September to November, while the driest is from December to March [21]. The study area is located in the sub-basin of the Tucuy River, which currently faces several environmental threats including loss of vegetation coverage as a result of mining, agriculture and livestock grazing [22]. The native Sub-Andean forest only remains in remnants of different sizes and ages [20]. The area belongs to a morpho-structural unit known as “Guatapurí”, which is characterized by a very pronounced topography [23]. The main soil type in the study area are Entisols (i.e., Typic Udorthents) according to USDA Soil Taxonomy [24]. The soil is shallow and rocky, with a sandy loam texture in the superficial horizon.
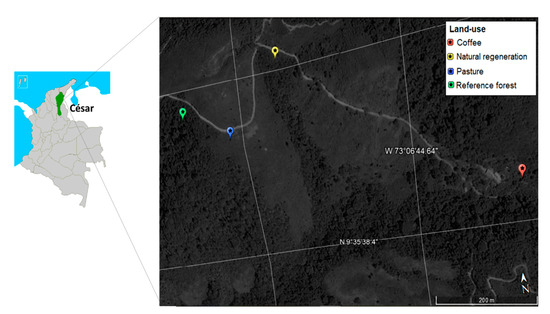
Figure 1.
Map of the study area within the Department of César, Colombia, and the location of the study plots land-uses.
Within the area, we selected four land-use types to measure soil physical and hydraulic properties, and vegetation attributes (Figure 2). In each land-use, we established two circular plots, with an area of 79 m2 each, resulting in eight plots in total. Our study plots were located in a similar landscape position with similar slope (i.e., greater than 20%) and had the same soil type. The size and number of plots were chosen according to previous investigations [14,15].
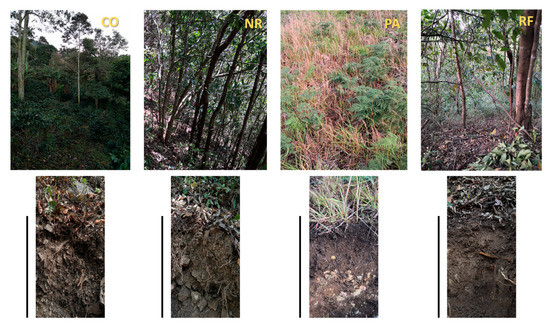
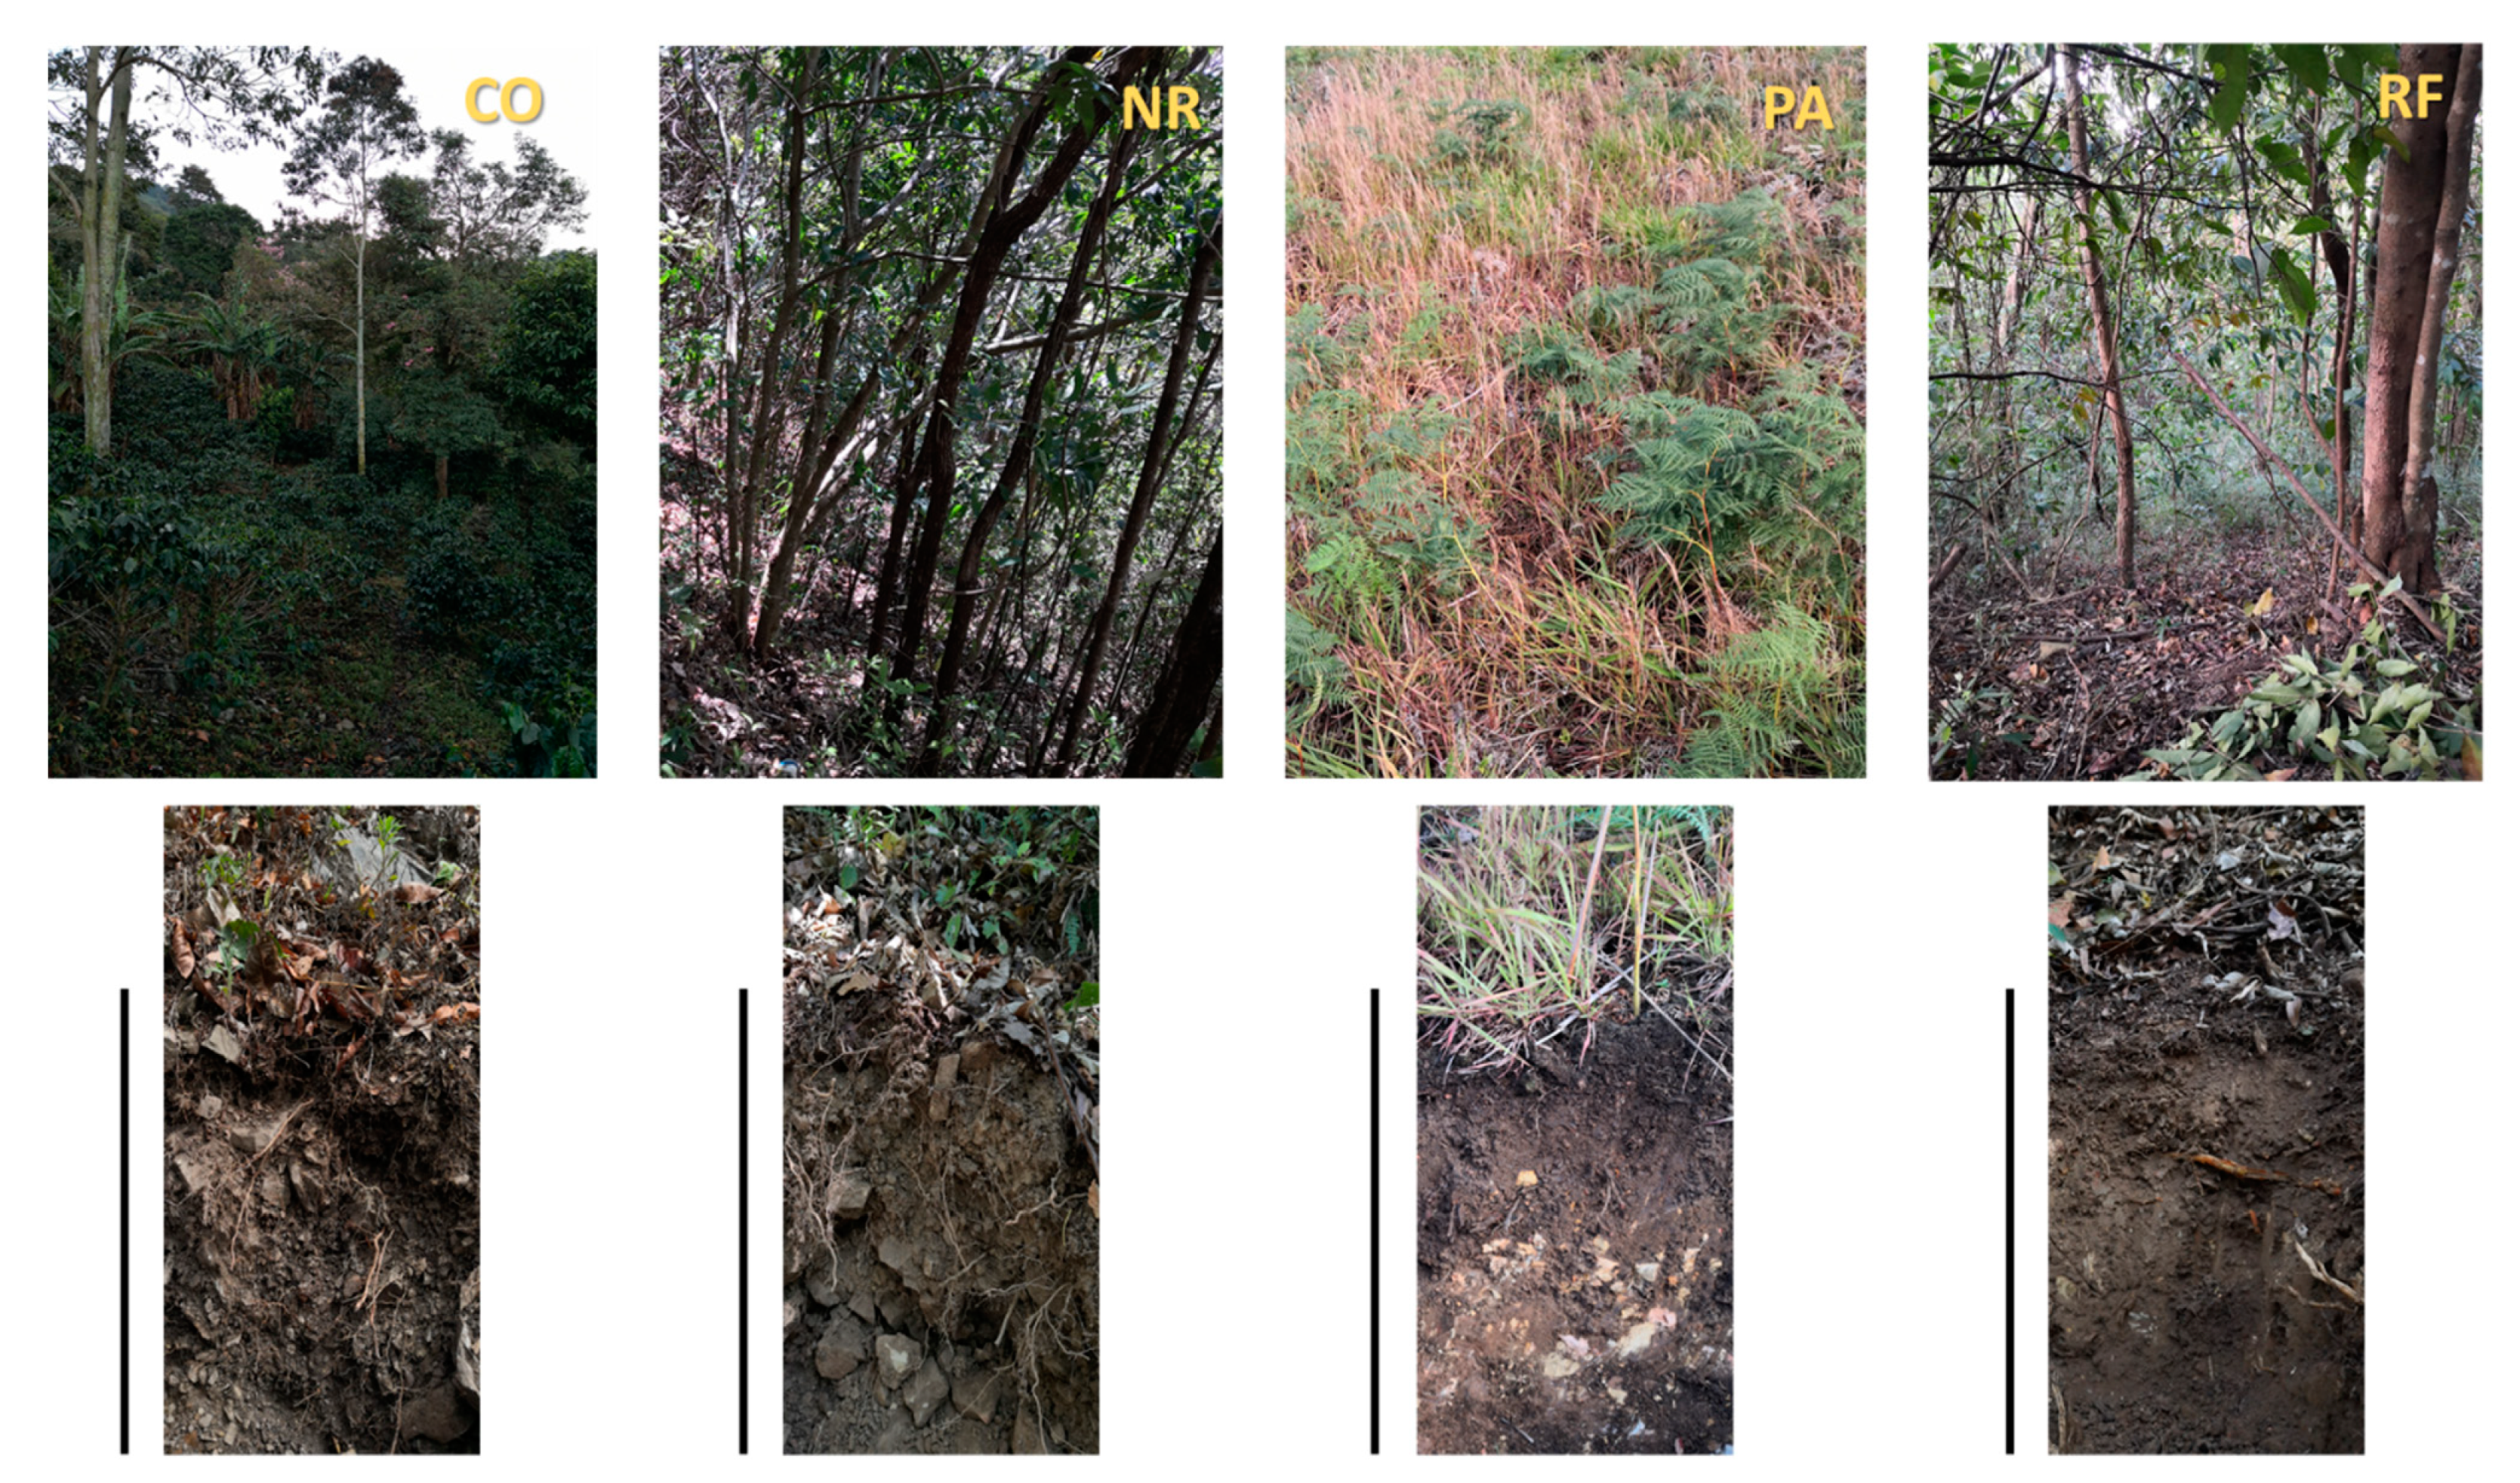
Figure 2.
Pictures showing the vegetation and the top-soil for each study site. The black lines in each top-soil represent 0.2 m scale. CO, shade-grown coffee; NR, Natural regeneration; PA, pasture; RF, Reference forest.
The CO site (9°35′41.27″ N, 73°6′37.16″ W) is a 35-year-old polyculture with a low use of agrochemicals. The coffee plantation was established with a plant density of 5000 trees per hectare. Our CO site is associated with trees species (i.e., Handroanthus chrysanthus, Inga sp., Persea americana and Tabebuia rosea). The measurements at this site represents the effect of a shade-grown coffee plantation.
The NR site (9°35′52.03″ N, 73°6′54.21″ W) was cleared first in 1960 by slash and burn. After 40 years of cattle grazing the land was abandoned in the early 2000’s as a result of the Colombian armed conflict. The area underwent natural reforestation and succession of the vegetation. In this regard, our measurements reflect the effect of 15 years of natural regeneration on soils with an intense land-use history.
The PA site (9°35′46.85″ N, 73°6′58.63″ W), which is the main land-use type in the landscape, was initially a forest that was cleared in the middle of the 20th century. After clearing, the site was heavily grazed for more than 40 years. The area had to be abandoned in the early 2000′s and the vegetation naturally emerged for five years. In 2007 the vegetation was cleared and burned again. Information from landholders revealed that the pasture site has been frequently burned over the last 15 years, but the stocking rate has been low with less than one head of cattle per hectare. At the moment of our field campaign, the PA site was covered by grass species Urochloa brizantha and bracken (Pteridium sp.). Our measurements at this site represent the effect of 15 years of intermittent burning and grazing.
The RF site (9°35′48.83″ N, 73°7′2.22″ W) is a secondary old-growth forest that is more than 50-years-old. The RF site was probably burned, similar to the other study sites and there has been selective cutting of trees. Currently, the RF is affected only by the occasional crossing of cattle. We used the RF site as a control area to assess reference values for soil physical and hydraulic attributes.
A graphical summary of the land-use history for the four land-use types described previously is provided in Figure 3.
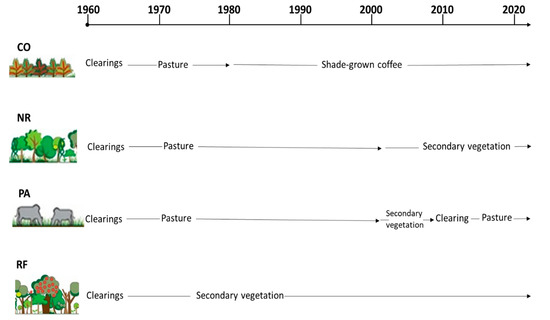
Figure 3.
Land-use history of cover types. CO, shade-grown coffee; NR, Natural regeneration; PA, pasture; RF, Reference forest.
2.2. Vegetation Sampling
In each 79 m2 plot, we measured the following vegetation attributes: (1) canopy cover; (2) vegetation height; (3) DBH; and (4) total number of trees. These are key ecological indicators, useful to evaluate vegetation structure in tropical forest restoration projects [25,26]. In each plot, we surveyed all living trees with diameter at breast height (DBH) > 5 cm. The vegetation height was estimated with a 3 m measuring stick, and the remaining height of trees taller than this was estimated visually. We furthermore measured the percentage of canopy cover three times with the mobile application CanopyCapture, which is a free, accurate and efficient, canopy cover measurement device [27].
2.3. Soil Sampling
We selected five sampling points within each study plot for the infiltration measurements. The distance between sampling points was 2 m. For measuring the infiltration rates we used the Beerkan method [28]. In total 40 Beerkan experiments were carried out in February 2021. We used a PVC ring with an inner diameter of 15.5 cm, which was inserted to a depth of about 1 cm into the soil surface. The location of the insertion of the PVC ring was previously prepared by removing the litter and other materials to expose the soil surface. At each measurement point, a known volume of water (150 mL) was repeatedly poured into the ring. Then, the time for each poured volume to infiltrate was logged. This procedure was repeated until the difference in infiltration time between two or three consecutives trials became negligible.
The values of Ks (mm h−1) were estimated using the Beerkan Estimation of Soil Transfer parameters (BEST) method proposed by Lassabatere et al. [28]. Following Di Prima et al. [29], we used a correction factor to the infiltration model used in BEST to be able to successfully analyze data collected under both hydrophilic (CO, NR, and PA sites) and hydrophobic (RF site) soils. More specifically, it allowed us to account for the rate of attenuation of infiltration rate due to water repellency at the RF site [30].
For three of the five sampling points, we collected undisturbed soil cores (100 cm3) at 0–5 cm depth. For each of these cores, we determined the bulk density, BD (g cm−3), and the initial volumetric soil water content θi (cm3 cm−3). At the end of each infiltration test, a disturbed soil sample was collected to determine the saturated gravimetric water content. The BD was used to calculate the saturated volumetric soil water content, θs (cm3 cm−3). During the soil sampling we observed soil water repellency phenomenon. We therefore used the water drop penetration time (WDPT) test to quantify the extent of repellency, for the three sampling points at each study plot (six for each land-use type). For each sampling point, the litter and leaf residues were gently removed from the soil surface and ten drops (0.05 mL) of distilled water were placed onto the soil surface using a pipette at a small distance (i.e., a few cm) from each other. We measured the time until complete infiltration of each drop. The recorded time was stopped after 3600 s, although some drops did not infiltrate during this time interval. In such cases, a WDPT value of 3600 s was assigned [31]. Thus, we measured the infiltration of 240 drops, 60 for each site. A representative WDPT value was obtained by averaging the 60 WDPT measurements for each site. The average WDPT values were then grouped in five classes from wettable (WDPT < 5 s) to extremely water-repellent (WDPT > 3600 s) according to the classification proposed by Dekker and Ritsema [32].
2.4. Data Analysis
The variables considered in this investigation (Ks, BD, θi, θs, canopy cover, vegetation height and DBH) were summarized by calculating the arithmetic mean and the associated coefficients of variation (CV) or the standard error for the vegetation variables. For each studied variable, we checked the assumptions of homogeneity of variance based on the Kolmogorov–Smirnov test. One-way analysis of variance (ANOVA) was performed considering the land-use type as an explanatory variable. Then, the Tukey test was applied, which compares the means two by two, the related p-values were computed and compared to the level of significance of 0.05. The Ks data were log-transformed prior to analyses, the transformed data were normally distributed according to the Kolmogorov-Smirnov test. Thus, the geometric mean and the associated geometric coefficient of variation were calculated for these variables [33,34]. All analyses were performed in the R software (R Core Team, Vienna, Austria, 2018).
3. Results
The vegetation characteristics at the CO site differ statistically from NR and RF (Table 1). The canopy cover was significantly different between the CO and NR and RF, highlighting the higher similarity between the NR and RF than CO and NR (Figure 4a). Overall, there was a high similarity between the RF and NR, except for the larger number of trees (32) at NR, than RF and CO (Table 1). Moreover, the average DBH for the RF was smaller than for the younger NR site.

Table 1.
Mean vegetation characteristics (±standard error) of the forest sites. Different superscript letters denote statistically significant differences between land-cover types (p < 0.05). CO, shade-grown coffee; NR, Natural regeneration; RF, Reference forest.
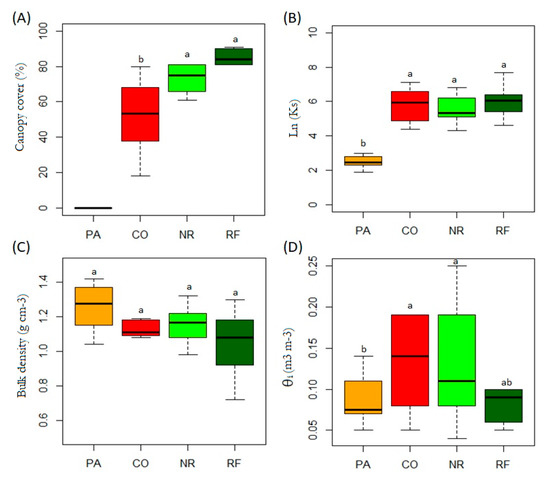
Figure 4.
Boxplot of the (A) vegetation cover (%), (B) the natural log transformed saturated soil hydraulic conductivity (Ks), (C) soil bulk density (g cm−3), and (D) initial volumetric soil water content, θi (m3 m−3), for each land-use type. CO, shade-grown coffee; NR, Natural regeneration; PA, pasture; RF, Reference forest. Different letters represent significant differences at p < 0.05.
The results of the canopy cover and some physical soil attributes are represented using box plot graphics (Figure 4). The canopy cover showed significant differences in CO with NR and RF. We highlight the higher similarity between the NR and RF. The Ks was significantly lower for the PA (range: 7–20 mm h−1) than the other study sites, for which it was similar (range: 71–2127 mm h−1) (Figure 4b and Table 2). The BD ranged from 0.72 to 1.42 g cm−3, there were no significant differences between the plots in terms of BD, although the values were lowest at the RF and the highest at the PA site (Figure 4c). The antecedent moisture content, varied between 0.04 to 0.25 cm3 cm−3 and was moderately low for PA and significantly different from CO and NR. The θs varied between 0.15 to 0.63 cm3 cm−3 with significantly lower average values for NR and RF than the CO and PA sites (Table 2).
Table 2.
Minimum (min), maximum (max), mean, and coefficient of variation (CV) of the saturated soil hydraulic conductivity, Ks (mm h−1), dry bulk density, BD (g cm−3), initial volumetric soil water content, θi (cm3 cm−3), and saturated volumetric soil water content, θs (cm3 cm−3). CO, shade-grown coffee; NR, Natural regeneration; PA, pasture; RF, Reference forest.
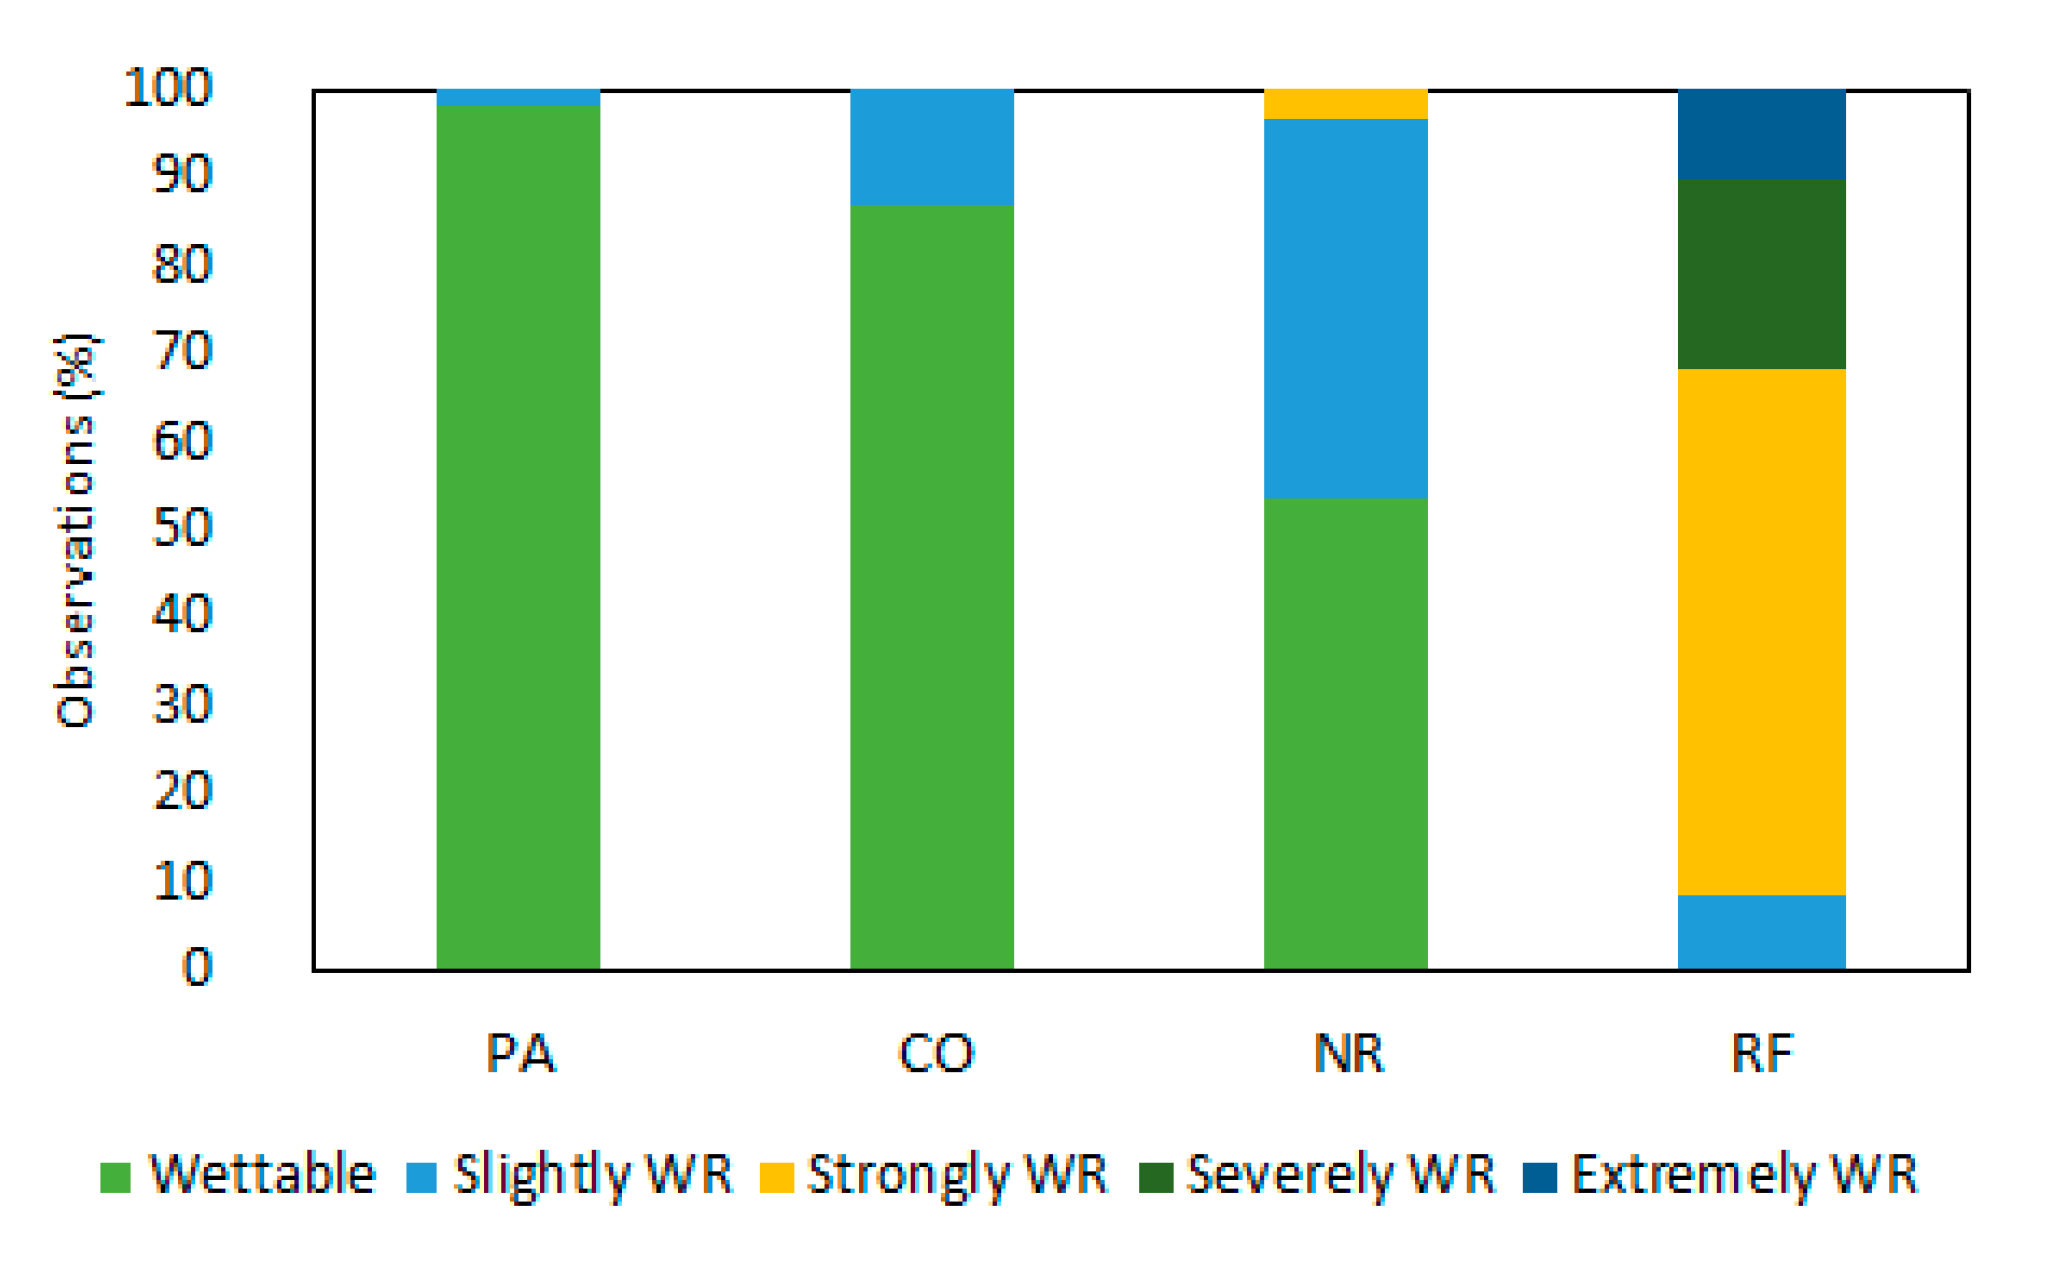
The soil water repellency varied among the different land-use types as well and ranged. The results of the WDPT show the existence of different degrees of soil water repellency ranging from wettable to extremely water repellent. The RF was the only land-use with severe and extreme water repellency, 22% and 10% of all the drops, respectively. Strong water repellence was detected at RF (60%) and NR (3%), and the slightly water repellent-class was observed in all land-use types. The wettable class was dominant at PA (98%) and CO (87%) sites (Figure 5).
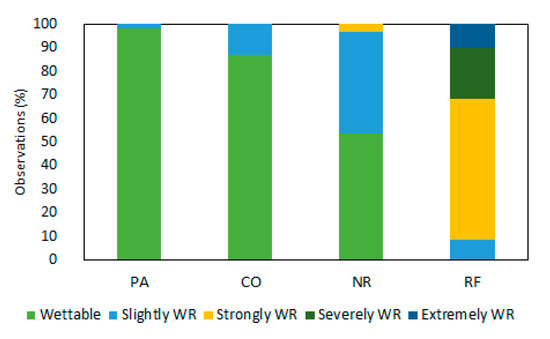
Figure 5.
Distribution of the water repellency (WR) classes for each study site. CO, shade-grown coffee; NR, Natural regeneration; PA, pasture; RF, Reference forest.
4. Discussion
Forest restoration and agroforestry in tropical environments of South America are receiving attention for their ecological, economic and social implications [8,35]. Our investigation, focused on the study of the soil hydraulic properties in Sub-Andean Forest. It revealed that the Ks at the CO plantation was statistically similar to that of NR and RF. The lower Ks at NR did not allow us to fully accept our study hypothesis, namely that averages of the Ks values would vary as follows: RF > NR > CO > PA. Instead, the order is RF = NR = CO > PA, despite the significantly lower canopy cover at CO site. The high Ks at CO plantation can be possibly due to litter thickness [36] and extensive root systems created by the woody coffee plants [37]. Coffee agroecosystems in the topsoil have a greater abundance of medium to fine roots, while the rhizosphere of secondary old-growth forests is dominated by the thick roots of mature trees and greater abundances of medium roots [36,38]. Another important factor that helps to explain the high Ks at CO plantation are the management activities. For example, at our CO site the coffee bushes are pruned regularly, leaving the residues on the topsoil, in according to other studies this practise can favor the hydrophysical soil attributes [37,39]. Moreover, our CO plantation has a low-intensity use, which is characterized by the absence of tillage and soil compaction, the few soil disturbances at CO site are associated mainly with human trampling. In contrast when the intensity of the land-use increases soil infiltration can be negatively affected. Cannavo et al. [40] on Costa Rican Andisols found that the soil infiltration was lower at coffee monoculture with high-intensity use than for shade-grown coffee. These findings emphasize the need to experimentally check the real soil conditions that arise, over time, in agroforestry environments.
The canopy cover at CO site was significantly lower when compared with NR and RF. The low canopy cover in CO can be associated to the few tree individuals (i.e., 5 trees) and bananas (Musa spp.). The shade tree species in the agroecosystems can play an important role for soil water infiltration [41,42]. In particular, leguminous trees (Erythrina spp. and Inga spp.) that are commonly used in coffee plantations can increase soil water infiltration [37,40]. We suggest that more research is necessary to understand tree-species effects on hydrological and environmental services in the coffee agroecosystems.
The shade trees in coffee agroecosystems can provide important benefits such as: (i) decrease the loss of topsoil by reducing erosion [4,37], (ii) limit water loss during the dry season [43,44], (iii) provide nitrogen via litter decomposition [36], (iv) regulate pests and diseases [45], (v) increase carbon sequestration [46], (vi) provide a better quality of coffee beans, and (vii) favor biotic diversity [36,47]. On the other hand, a high canopy cover in agroforestry coffee plantations can affect the yield, representing financial loss for coffee farmers [40]. Thus, the pros and cons of shade-grown coffee in our study area need to be evaluated in future studies, collecting more wide-ranging empirical data.
As expected, the mean Ks value was lower in PA (12 mm h−1) than in forests stands (244–469 mm h−1). This result can be related to the highest BD found in the pasture plots. Also, our result agrees with several other studies [48,49,50]. In tropical pastures, some of the factors that affect Ks negatively are the soil compaction, the intensity of the cattle-grazing, the lower soil faunal activity and organic matter [10,48,51].
Assuming that the Ks of degraded land was similar to the measurements at the PA site prior to the regrowth of the forest, our results show that abandonment and forest regrowth on degraded land can improve the Ks, and that after 15 years the Ks became similar to that of the reference forest. The increase of Ks during the natural regeneration process has been reported by several author before [10,26,51,52,53]. Ziegler et al. [49] suggest that a period of 25 years could be enough to recover Ks after 2–4 years of swidden cultivation in Vietnam. Leite et al. [52] mention that after grazing, the complete recover of the Ks will probably take more than 35 years in the Caatinga ecosystem. Zwartendijk et al. [53] point out that the full hydrological recovery of tropical degraded sites with a natural regeneration process, may take several decades. However, Ks does not always increase during natural regeneration, in some cases the evolution of Ks and hydrological functions can be a relatively slow process [15,50,54,55]. Pereira et al. [15] showed for the Atlantic forest biome that after 42 years the natural regenerated forest still had similar Ks values as the sugarcane site [15]. They attributed the results to the legacy effect of intense land degradation before forest regrowth. Similarly, Ghimire et al. [55] reported for a 25-year-old forest in Nepal similar Ks values as for pasture sites. They explained that removal of litter, grazing and fuelwood harvesting affected Ks recovery. In summary, the soil recovery process after natural regeneration or tree planting depends on many factors and is still not fully understood. The multi-decadal effects of vegetation regrowth has not been captured in most of the studies [56,57].
At our sites, the highest Ks values were found at the RF, which was also the site with the lowest BD and greater values for the vegetation attributes (i.e., canopy cover, vegetation height of tree, DBH and total number of trees). This result can be explained by the more conserved soil conditions and the longer recovery process of the vegetation (i.e., more than 50 years). Many other studies have observed a high Ks for little disturbed tropical forests [53,55,56,58]. Our result thus supports the importance of preserving the forest cover in transformed landscapes in order to maintain infiltration process, soil hydraulic efficiency and, therefore, the regulation of the hydrological cycle. In addition, the Ks values obtained in the RF plots reflect the high spatial variability of the infiltration. Although we did not directly quantify variables such as soil macroporosity, soil biological activity, root biomass, plant diversity, organic matter and topographic variations are generally considered the main drivers of the spatial variability of Ks in forest soils [26,52,53,55,56]. Given the importance of the aforementioned factors, they can be the subject of specific investigations in the future.
Soil water repellency is a transient soil property poorly understood for tropical soils [59,60]. The WDPT allowed to detect a stronger water repellency at the NR and RF sites. Our findings are in agreement with previous studies in tropical ecosystems [61,62,63], which have reported hydrophobicity under forest cover. It is important to highlight that soil water repellency can negatively affect the soil infiltration process and increase soil erosion [48]. Soil water repellency can be attributed to many factors such as amphiphilic molecules produced by plants and organisms, soil conditions after forest fires or dry periods. Soil texture, soil temperature, pH, soil water content and soil organic carbon can affect soil water repellency as well [59,60]. Future research needs to improve the understanding of factors promoting the soil water repellency in tropical forest soils. In Colombia, the soil water repellency has been reported for Andisols with Pinus patula plantation [64], our work reports the first measurements for a Sub-Andean Forest remnant.
5. Conclusions
From this study it can be concluded that agroforestry systems such as the shade-grown coffee in Sub-Andean Forests benefit the hydrophysical soil attributes. Our study also concludes that abandonment and forest regrowth on degraded land can improve the Ks, and that after 15 years the Ks became similar to that of the reference forest. The comparative analysis of Ks in agroforestry use (CO), secondary forests (NR and RF) and pasture (PA) show the similarity in Ks between the land-uses with trees (CO, NR, and RF). Furthermore, the PA site with a higher intense land-use history showed the lowest Ks.
Author Contributions
S.E.L.-B. carried out the data collection and wrote the initial draft; Y.D.-H. and S.D.P. participated in the design of the study. M.C. (Miguel Cooper) and M.C. (Mirko Castellini) revised, discussed, modified, and supplemented the ideas for the final draft. All authors have read and agreed to the published version of the manuscript.
Funding
This research was funded by the Colombian Ministry of Science (grant no. 848) and “Vicerrectoría de Investigaciones, Extensión y Proyección Social” of Universidad del Atlántico.
Acknowledgments
We thank Ilja van Meerveld for her valuable comments on the draft manuscript, Karina Paola Martínez Pérez for the help in the field and the landowners who allowed the forest sampling.
Conflicts of Interest
The authors declare no conflict of interest.
References
- Milder, J.C.; Arbuthnot, M.; Blackman, A.; Brooks, S.E.; Giovannucci, D.; Gross, L.; Kennedy, E.T.; Komives, K.; Lambin, E.F.; Lee, A.; et al. An Agenda for Assessing and Improving Conservation Impacts of Sustainability Standards in Tropical Agriculture: Conservation and Sustainability Standards. Conserv. Biol. 2015, 29, 309–320. [Google Scholar] [CrossRef] [PubMed]
- Foley, J.A. Global Consequences of Land Use. Science 2005, 309, 570–574. [Google Scholar] [CrossRef] [PubMed] [Green Version]
- Cannell, M.G.R.; Van Noordwijk, M.; Ong, C.K. The Central Agroforestry Hypothesis: The Trees Must Acquire Resources That the Crop Would Not Otherwise Acquire. Agrofor. Syst. 1996, 34, 27–31. [Google Scholar] [CrossRef]
- Meylan, L.; Gary, C.; Allinne, C.; Ortiz, J.; Jackson, L.; Rapidel, B. Evaluating the Effect of Shade Trees on Provision of Ecosystem Services in Intensively Managed Coffee Plantations. Agric. Ecosyst. Environ. 2017, 245, 32–42. [Google Scholar] [CrossRef]
- Jha, S.; Bacon, C.M.; Philpott, S.M.; Ernesto Méndez, V.; Läderach, P.; Rice, R.A. Shade Coffee: Update on a Disappearing Refuge for Biodiversity. BioScience 2014, 64, 416–428. [Google Scholar] [CrossRef] [Green Version]
- Ibanez, M.; Blackman, A. Is Eco-Certification a Win–Win for Developing Country Agriculture? Organic Coffee Certification in Colombia. World Dev. 2016, 82, 14–27. [Google Scholar] [CrossRef]
- Chazdon, R.L. Beyond Deforestation: Restoring Forests and Ecosystem Services on Degraded Lands. Science 2008, 320, 1458–1460. [Google Scholar] [CrossRef] [Green Version]
- Brancalion, P.H.S.; Niamir, A.; Broadbent, E.; Crouzeilles, R.; Barros, F.S.M.; Almeyda Zambrano, A.M.; Baccini, A.; Aronson, J.; Goetz, S.; Reid, J.L.; et al. Global Restoration Opportunities in Tropical Rainforest Landscapes. Sci. Adv. 2019, 5, 1–11. [Google Scholar] [CrossRef] [Green Version]
- De Beenhouwer, M.; Aerts, R.; Honnay, O. A Global Meta-Analysis of the Biodiversity and Ecosystem Service Benefits of Coffee and Cacao Agroforestry. Agric. Ecosyst. Environ. 2013, 175, 1–7. [Google Scholar] [CrossRef]
- Zimmermann, B.; Elsenbeer, H.; De Moraes, J.M. The Influence of Land-Use Changes on Soil Hydraulic Properties: Implications for Runoff Generation. For. Ecol. Manag. 2006, 222, 29–38. [Google Scholar] [CrossRef]
- Marín-Castro, B.E.; Geissert, D.; Negrete-Yankelevich, S.; Gómez-Tagle Chávez, A. Spatial Distribution of Hydraulic Conductivity in Soils of Secondary Tropical Montane Cloud Forests and Shade Coffee Agroecosystems. Geoderma 2016, 283, 57–67. [Google Scholar] [CrossRef]
- Gageler, R.; Bonner, M.; Kirchhof, G.; Amos, M.; Robinson, N.; Schmidt, S.; Shoo, L.P. Early Response of Soil Properties and Function to Riparian Rainforest Restoration. PLoS ONE 2014, 9, 1–8. [Google Scholar] [CrossRef]
- Mendes, M.S.; Latawiec, A.E.; Sansevero, J.B.B.; Crouzeilles, R.; de Moraes, L.F.D.; Castro, A.; Pinto, H.N.A.; Brancalion, P.H.S.; Rodrigues, R.R.; Chazdon, R.L.; et al. Look down—There Is a Gap—the Need to Include Soil Data in Atlantic Forest Restoration. Restor. Ecol. 2019, 27, 361–370. [Google Scholar] [CrossRef]
- Lozano-Baez, S.; Cooper, M.; Ferraz, S.; Ribeiro Rodrigues, R.; Pirastru, M.; Di Prima, S. Previous Land Use Affects the Recovery of Soil Hydraulic Properties after Forest Restoration. Water 2018, 10, 453. [Google Scholar] [CrossRef] [Green Version]
- Pereira, N.A.; Di Prima, S.; Bovi, R.C.; da Silva, L.F.S.; de Godoy, G.; Naves, R.P.; Cooper, M. Does the Process of Passive Forest Restoration Affect the Hydrophysical Attributes of the Soil Superficial Horizon? Water 2020, 12, 1689. [Google Scholar] [CrossRef]
- Jačka, L.; Pavlásek, J.; Pech, P.; Kuráž, V. Assessment of Evaluation Methods Using Infiltration Data Measured in Heterogeneous Mountain Soils. Geoderma 2016, 276, 74–83. [Google Scholar] [CrossRef]
- Cullotta, S.; Bagarello, V.; Baiamonte, G.; Gugliuzza, G.; Iovino, M.; La Mela Veca, D.S.; Maetzke, F.; Palmeri, V.; Sferlazza, S. Comparing Different Methods to Determine Soil Physical Quality in a Mediterranean Forest and Pasture Land. Soil Sci. Soc. Am. J. 2016, 80, 1038–1056. [Google Scholar] [CrossRef]
- Di Prima, S.; Bagarello, V.; Angulo-Jaramillo, R.; Bautista, I.; Cerdà, A.; del Campo, A.; González-Sanchis, M.; Iovino, M.; Lassabatere, L.; Maetzke, F. Impacts of Thinning of a Mediterranean Oak Forest on Soil Properties Influencing Water Infiltration. J. Hydrol. Hydromech. 2017, 65, 276–286. [Google Scholar] [CrossRef] [Green Version]
- Zema, D.A.; Plaza-Alvarez, P.A.; Xu, X.; Carra, B.G.; Lucas-Borja, M.E. Influence of Forest Stand Age on Soil Water Repellency and Hydraulic Conductivity in the Mediterranean Environment. Sci. Total Environ. 2021, 753, 142006. [Google Scholar] [CrossRef] [PubMed]
- Rangel-Ch, J.O. Integrated climate of the Perijá massif, Colombia. In Colombia Diversidad Biótica XVIII: Biodiversidad y Territorio de la Serranía de Perijá (César-Colombia); Universidad Nacional de Colombia: Bogotá, Colombia, 2019; pp. 92–128. [Google Scholar]
- Cotes, G.D.A.; Muegue, L.D. Análisis de Las Características Fisicoquímicas de Dos Tipos de Suelos Ubicados En La Vía Becerril, La Jagua de Ibirico En El Departamento Del César. Rev. Agunkuyâa 2018, 2, 5–19. [Google Scholar] [CrossRef]
- Madera, L.C.; Angulo, L.C.; Díaz, L.C.; Rojano, R. Water Quality Evaluation on Some Tributary Points of César River (Colombia) Using Aquatic Macro Invertebrates as Pollution Bioindicators. Inf. Tecnol. 2016, 27, 103–110. [Google Scholar] [CrossRef]
- Camargo, M.F.A. La Transformación del Bosque Seco Desde la Mirada Geográfico-Ambiental, en la Cuenca Hidrográfica del Río César; Universidad de Ciencias Aplicadas y Ambientales: Bogotá, Colombia, 2017. [Google Scholar]
- USDA-Natural Resources Conservation Service. Soil Survey Staff. In Keys to Soil Taxonomy, 12th ed.; USDA-Natural Resources Conservation Service: Washington, DC, USA, 2014. [Google Scholar]
- Viani, R.A.G.; Barreto, T.E.; Farah, F.T.; Rodrigues, R.R.; Brancalion, P.H.S. Monitoring Young Tropical Forest Restoration Sites: How Much to Measure? Trop. Conserv. Sci. 2018, 11, 1–9. [Google Scholar] [CrossRef] [Green Version]
- Lozano-Baez, S.E.; Cooper, M.; Frosini de Barros Ferraz, S.; Ribeiro Rodrigues, R.; Castellini, M.; Di Prima, S. Recovery of Soil Hydraulic Properties for Assisted Passive and Active Restoration: Assessing Historical Land Use and Forest Structure. Water 2019, 11, 86. [Google Scholar] [CrossRef] [Green Version]
- CanopyCapture a Smarter Way to Measure Canopy Cover. Available online: https://nikp29.github.io/CanopyCapture/ (accessed on 9 July 2021).
- Lassabatère, L.; Angulo-Jaramillo, R.; Soria Ugalde, J.M.; Cuenca, R.; Braud, I.; Haverkamp, R. Beerkan Estimation of Soil Transfer Parameters through Infiltration Experiments—BEST. Soil Sci. Soc. Am. J. 2006, 70, 521. [Google Scholar] [CrossRef]
- Di Prima, S.; Stewart, R.D.; Abou Najm, M.R.; Ribeiro Roder, L.; Giadrossich, F.; Campus, S.; Angulo Jaramillo, R.; Yilmaz, D.; Roggero, P.P.; Pirastru, M. BEST-WR: An Adapted BEST Algorithm for the Hydraulic Characterization of Regular and Water-Repellent Soils. Submitted. J. Hydrol. 2021, in press. [Google Scholar]
- Abou Najm, M.R.; Stewart, R.D.; Di Prima, S.; Lassabatere, L. A Simple Correction Term to Model Infiltration in Water-Repellent Soils. Water Res. 2021, 57. [Google Scholar] [CrossRef]
- Buczko, U.; Bens, O.; Hüttl, R.F. Water Infiltration and Hydrophobicity in Forest Soils of a Pine–Beech Transformation Chronosequence. J. Hydrol. 2006, 331, 383–395. [Google Scholar] [CrossRef]
- Dekker, L.W.; Ritsema, C.J. How Water Moves in a Water Repellent Sandy Soil: 1. Potential and Actual Water Repellency. Water Resour. Res. 1994, 30, 2507–2517. [Google Scholar] [CrossRef]
- Reynolds, W.D.; Drury, C.F.; Yang, X.M.; Tan, C.S. Optimal Soil Physical Quality Inferred through Structural Regression and Parameter Interactions. Geoderma 2008, 146, 466–474. [Google Scholar] [CrossRef]
- Kirkwood, T.B.L. Geometric Means and Measures of Dispersion. Biometrics 1979, 35, 908–909. [Google Scholar]
- Strassburg, B.B.N.; Iribarrem, A.; Beyer, H.L.; Cordeiro, C.L.; Crouzeilles, R.; Jakovac, C.C.; Braga Junqueira, A.; Lacerda, E.; Latawiec, A.E.; Balmford, A.; et al. Global Priority Areas for Ecosystem Restoration. Nature 2020, 586, 724–729. [Google Scholar] [CrossRef] [PubMed]
- Marín-Castro, B.E.; Negrete-Yankelevich, S.; Geissert, D. Litter Thickness, but Not Root Biomass, Explains the Average and Spatial Structure of Soil Hydraulic Conductivity in Secondary Forests and Coffee Agroecosystems in Veracruz, Mexico. Sci. Total Environ. 2017, 607–608, 1357–1366. [Google Scholar] [CrossRef] [PubMed]
- Benegas, L.; Ilstedt, U.; Roupsard, O.; Jones, J.; Malmer, A. Effects of Trees on Infiltrability and Preferential Flow in Two Contrasting Agroecosystems in Central America. Agric. Ecosyst. Environ. 2014, 183, 185–196. [Google Scholar] [CrossRef]
- Soethe, N.; Lehmann, J.; Engels, C. Root Morphology and Anchorage of Six Native Tree Species from a Tropical Montane Forest and an Elfin Forest in Ecuador. Plant Soil 2006, 279, 173–185. [Google Scholar] [CrossRef]
- Beer, J.; Muschler, R.; Kass, D.; Somarriba, E. Shade Management in Coffee and Cacao Plantations. Agrofor. Syst. 1997, 38, 139–164. [Google Scholar] [CrossRef]
- Cannavo, P.; Sansoulet, J.; Harmand, J.-M.; Siles, P.; Dreyer, E.; Vaast, P. Agroforestry Associating Coffee and Inga Densiflora Results in Complementarity for Water Uptake and Decreases Deep Drainage in Costa Rica. Agric. Ecosyst. Environ. 2011, 140, 1–13. [Google Scholar] [CrossRef]
- Ilstedt, U.; Bargués Tobella, A.; Bazié, H.R.; Bayala, J.; Verbeeten, E.; Nyberg, G.; Sanou, J.; Benegas, L.; Murdiyarso, D.; Laudon, H.; et al. Intermediate Tree Cover Can Maximize Groundwater Recharge in the Seasonally Dry Tropics. Sci. Rep. 2016, 6, 1–12. [Google Scholar] [CrossRef]
- Ilstedt, U.; Malmer, A.; Verbeeten, E.; Murdiyarso, D. The Effect of Afforestation on Water Infiltration in the Tropics: A Systematic Review and Meta-Analysis. For. Ecol. Manag. 2007, 251, 45–51. [Google Scholar] [CrossRef]
- Lin, B.B.; Richards, P.L. Soil Random Roughness and Depression Storage on Coffee Farms of Varying Shade Levels. Agric. Water Manag. 2007, 92, 194–204. [Google Scholar] [CrossRef]
- Siles, G.; Rey, P.J.; Alcántara, J.M.; Bastida, J.M.; Herreros, J.L. Effects of Soil Enrichment, Watering and Seedling Age on Establishment of Mediterranean Woody Species. Acta Oecol. 2010, 36, 357–364. [Google Scholar] [CrossRef]
- Cerda, R.; Allinne, C.; Gary, C.; Tixier, P.; Harvey, C.A.; Krolczyk, L.; Mathiot, C.; Clément, E.; Aubertot, J.-N.; Avelino, J. Effects of Shade, Altitude and Management on Multiple Ecosystem Services in Coffee Agroecosystems. Eur. J. Agron. 2017, 82, 308–319. [Google Scholar] [CrossRef]
- Albrecht, A.; Kandji, S.T. Carbon Sequestration in Tropical Agroforestry Systems. Agric. Ecosyst. Environ. 2003, 99, 15–27. [Google Scholar] [CrossRef]
- Vaast, P.; Bertrand, B.; Perriot, J.-J.; Guyot, B.; Génard, M. Fruit Thinning and Shade Improve Bean Characteristics and Beverage Quality of Coffee (Coffea Arabica L.) under Optimal Conditions. J. Sci. Food Agric. 2006, 86, 197–204. [Google Scholar] [CrossRef]
- Martínez, L.J.; Zinck, J.A. Temporal Variation of Soil Compaction and Deterioration of Soil Quality in Pasture Areas of Colombian Amazonia. Soil Tillage Res. 2004, 75, 3–18. [Google Scholar] [CrossRef]
- Ziegler, A.D.; Giambelluca, T.W.; Tran, L.T.; Vana, T.T.; Nullet, M.A.; Fox, J.; Vien, T.D.; Pinthong, J.; Maxwell, J.F.; Evett, S. Hydrological Consequences of Landscape Fragmentation in Mountainous Northern Vietnam: Evidence of Accelerated Overland Flow Generation. J. Hydrol. 2004, 287, 124–146. [Google Scholar] [CrossRef]
- Zimmermann, B.; Elsenbeer, H. Spatial and Temporal Variability of Soil Saturated Hydraulic Conductivity in Gradients of Disturbance. J. Hydrol. 2008, 361, 78–95. [Google Scholar] [CrossRef] [Green Version]
- Hassler, S.K.; Zimmermann, B.; van Breugel, M.; Hall, J.S.; Elsenbeer, H. Recovery of Saturated Hydraulic Conductivity under Secondary Succession on Former Pasture in the Humid Tropics. For. Ecol. Manag. 2011, 261, 1634–1642. [Google Scholar] [CrossRef]
- Leite, P.A.M.; de Souza, E.S.; dos Santos, E.S.; Gomes, R.J.; Cantalice, J.R.; Wilcox, B.P. The Influence of Forest Regrowth on Soil Hydraulic Properties and Erosion in a Semiarid Region of Brazil. Ecohydrology 2018, 11, 1–12. [Google Scholar] [CrossRef]
- Zwartendijk, B.W.; van Meerveld, H.J.; Ghimire, C.P.; Bruijnzeel, L.A.; Ravelona, M.; Jones, J.P.G. Rebuilding Soil Hydrological Functioning after Swidden Agriculture in Eastern Madagascar. Agric. Ecosyst. Environ. 2017, 239, 101–111. [Google Scholar] [CrossRef] [Green Version]
- Zimmermann, B.; Papritz, A.; Elsenbeer, H. Asymmetric Response to Disturbance and Recovery: Changes of Soil Permeability under Forest–Pasture–Forest Transitions. Geoderma 2010, 159, 209–215. [Google Scholar] [CrossRef]
- Ghimire, C.P.; Bruijnzeel, L.A.; Bonell, M.; Coles, N.; Lubczynski, M.W.; Gilmour, D.A. The Effects of Sustained Forest Use on Hillslope Soil Hydraulic Conductivity in the Middle Mountains of Central Nepal: Sustained Forest Use and Soil Hydraulic Conductivity. Ecohydrology 2014, 7, 478–495. [Google Scholar] [CrossRef]
- Bonell, M.; Purandara, B.K.; Venkatesh, B.; Krishnaswamy, J.; Acharya, H.A.K.; Singh, U.V.; Jayakumar, R.; Chappell, N. The Impact of Forest Use and Reforestation on Soil Hydraulic Conductivity in the Western Ghats of India: Implications for Surface and Sub-Surface Hydrology. J. Hydrol. 2010, 391, 47–62. [Google Scholar] [CrossRef]
- Lozano-Baez, S.E.; Cooper, M.; Meli, P.; Ferraz, S.F.B.; Rodrigues, R.R.; Sauer, T.J. Land Restoration by Tree Planting in the Tropics and Subtropics Improves Soil Infiltration, but Some Critical Gaps Still Hinder Conclusive Results. For. Ecol. Manag. 2019, 444, 89–95. [Google Scholar] [CrossRef]
- Elsenbeer, H. Hydrologic Flowpaths in Tropical Rainforest Soilscapes? A Review. Hydrol. Process. 2001, 15, 1751–1759. [Google Scholar] [CrossRef]
- Doerr, S.H.; Shakesby, R.A.; Walsh, R.P.D. Soil Water Repellency: Its Causes, Characteristics and Hydro-Geomorphological Significance. Earth Sci. Rev. 2000, 51, 33–65. [Google Scholar] [CrossRef]
- Müller, K.; Deurer, M. Review of the Remediation Strategies for Soil Water Repellency. Agric. Ecosyst. Environ. 2011, 144, 208–221. [Google Scholar] [CrossRef]
- Kajiura, M.; Tokida, T.; Seki, K. Effects of Moisture Conditions on Potential Soil Water Repellency in a Tropical Forest Regenerated after Fire. Geoderma 2012, 181–182, 30–35. [Google Scholar] [CrossRef]
- Johnson, M.S.; Lehmann, J.; Steenhuis, T.S.; Vargem de Oliveira, L.; Fernandes, E.C.M. Spatial and Temporal Variability of Soil Water Repellency of Amazonian Pastures. Soil Res. 2005, 43, 319–326. [Google Scholar] [CrossRef]
- Lozano-Baez, S.E.; Cooper, M.; de Barros Ferraz, S.F.; Ribeiro Rodrigues, R.; Lassabatere, L.; Castellini, M.; Di Prima, S. Assessing Water Infiltration and Soil Water Repellency in Brazilian Atlantic Forest Soils. Appl. Sci. 2020, 10, 1950. [Google Scholar] [CrossRef] [Green Version]
- Jaramillo, J.D.F. Repelencia al Agua En Suelos: Una Síntesis. Rev. Acad. Colomb. Cienc. 2006, 30, 215–232. [Google Scholar]


Publisher’s Note: MDPI stays neutral with regard to jurisdictional claims in published maps and institutional affiliations. |
© 2021 by the authors. Licensee MDPI, Basel, Switzerland. This article is an open access article distributed under the terms and conditions of the Creative Commons Attribution (CC BY) license (https://creativecommons.org/licenses/by/4.0/).