Abstract
The coastal fisheries in Liberia comprise small-scale Kru and Fanti low technology canoes and open boats, as well as industrial trawlers. At the end of the war in 2003, foreign industrial trawlers dominated the coastal fisheries in Liberia. After the war, the industrial fleet declined rapidly from 60 in 2004 to 15 in 2010. Over the same period the local Kru canoes grew from <400 to over 2400 and the motorized Fanti boats increased from <200 to about 800. Since 2010, when the government established a six nautical mile inshore exclusion zone, the industrial fleet has continued to decline, the Fantis have remained fairly constant, but the Kru fleet has continued to expand, reaching 3800 canoes by 2019. This paper analyzes the technical efficiency and productivity of the SSF fleets in Liberia. Data were collected from 46 randomly chosen Kru and 86 Fanti boats. There is a considerable difference between the Kru and the Fanti boats in terms of quantities of inputs used and output produced. Mean efficiency of the Kru canoes was 0.53, while for the Fanti boats it was 0.70, indicating considerable inefficiencies and scope for technical improvement. Vessel length and skipper’s age are the two main factors significantly influencing technical efficiency of the Kru and Fanti boats. The younger Kru operators (≤40 years) using newer and smaller dugout canoes (≤6.1 m) were more efficient than the older fishers in older and larger canoes, while the opposite was true for the Fantis. There were efficient boats and inefficient vessels among the Kru and Fanti but on average they were profitable. However, the design of these vessels offers limited scope to introduce improved fishing technology. To address the current technological regress and increase productivity in the fisheries, it is recommended that the Liberian government explore new harvesting technologies such as fiberglass reinforced plastic in the coastal fisheries.
1. Introduction
Liberia, located on the west coast of Africa, has a coastline of around 590 km and an exclusive economic zone (EEZ) of 246,000 km2, which harbors valuable demersal and pelagic fishery resources. Liberian fisheries are a major source of food and jobs for several thousand Liberians and provides government revenue, accounting for around 10% of the Gross Domestic Product [1]. The marine fishery resources are currently exploited by the offshore and coastal fisheries, which use different vessels and fishing methods [2,3].
The offshore fleet consists of around 40 industrial tuna vessels, operating under a sustainable fisheries partnership access agreement with the EU, deploying purse seines and surface longlines [4]. Their catch, which has been estimated to be 10,000 tons year−1, is not landed in Liberia.
The coastal fisheries consist of industrial and small-scale fisheries (SSF) targeting both pelagic and demersal fish species and crustaceans [4,5]. There are two distinct demersal communities on the continental shelf where the water is permanently stratified, namely above and below the thermocline, which fluctuates between 40–60 m depth [6]. These are referred to as shallow- and deep-water demersals.
The industrial coastal fishery comprises trawlers, averaging around 180 gross registered tonnage, using bottom- and mid-water trawls targeting demersal fish and shrimp stocks [3]. The trawlers are mostly foreign owned and operate through joint ventures with Liberian registered fishing agencies [2,3]. Before the end of the civil war in 2003, 60 such trawlers operated in Liberian waters, but their numbers have declined rapidly after 2004 and have continued to decline following a fisheries management reform by the Government of Liberia in 2010. In 2019, this fleet only counted six vessels (Figure S1) [4,7]. High levels of illegal (unlicensed) fishing activities were observed and reported in the industrial fisheries before the end of the civil war and the economic loss to Liberia has been estimated at around USD 12 million per year [8,9].
Before the end of the war (2001–2003), the estimated catch of the trawlers ranged between 13,464 to 15,560 tons year−1, and averaged around 14,441 ± 1055 tons year−1; from 2010 to 2016, their total catch varied between 75 to 3028 tons year−1 and averaged around 1310 ± 1154 tons year−1 (Figure S2), according to NaFAA statistics. Management of the industrial coastal fisheries is through a range of input controls such as effort, gear and area restrictions, fishing licenses, and output controls such as catch restrictions [10,11]. The catch is landed in Liberia and consumed locally, although a part is exported [2,3].
Since 2010, the SSF have had exclusive access within a six nautical mile inshore exclusion zone (IEZ), although they may also fish further offshore [11]. The majority of SSF consist of non-motorized dugout canoes averaging about 6.7 m with 1–4 crew, operated by local Kru fishers (Figure 1a). However, in practice Kru fishers may be a mix of people comprising Kru, Vai, Bassa, Grebo and other tribes [3].
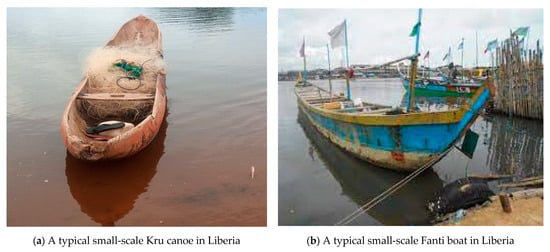
Figure 1.
A typical small-scale Kru canoe and Fanti boat in Liberia.
In 2019, the Kru constituted about 83% of the SSF fleets, having increased from less than 400 in 2004 to 2459 in 2010 and roughly 3815 canoes in 2019 (Figure S1). The Kru mainly use hook and line, longlines, gill nets, cast nets and traps [12]. They primarily target shallow and deep-water demersal species and some crustaceans, mainly crabs and lobsters [4,5].
The Fanti operate larger open wooden boats, averaging 10.1 m and typically powered by 9–40 hp outboard and inboard engines with a crew of 4 to 26 people (Figure 1b) [7]. The number of Fanti boats grew steadily from 168 in 2004 to 737 in 2010. Since then, their number has been fairly stable and in 2019 they numbered 774 (Figure S1). Ring net is the most common gear used to target small pelagics inshore, but some also occasionally deploy other types of gear such as gill nets, set nets, hooks and lines targeting shallow and deep-water demersal species [7,12]. Before the war ended from 2001 to 2003, the SSF total catch varied between 6303 to 6842 tons year−1 and averaged around 6598 tons year−1, but from 2010 to 2016, it ranged between 9700 to 32,298 tons year−1 and averaged around 19,498 tons year−1 (Figure S2), according to NaFAA statistics.
About 11,000 full-time fishers and 22,000 fish processors and traders depend on the SSF for their livelihoods [9]. Between 2004–2016, the total domestic catch averaged around 19,849 ± 7079 metric tons, of which the SSF produced around 67% (Figure S2). Most catch is landed during the dry season in October–April when the weather and fishing conditions are favorable, whereas during the rainy season (May–October), periods of strong ocean currents and heavy storms impede the boats from going out to sea [3].
The coastal small-scale fleets were more profitable than the industrial trawlers and accounted for nearly 99% of the USD 7.2 million total profits generated in the Liberian coastal fisheries in 2016 [4]. The development and composition of the coastal fleets since 2004 have been mostly driven by differences in profitability. The Kru and Fanti boats outperform the industrial trawlers [4].
However, the sourcing of raw materials (i.e., big forest trees) used for building these small-scale traditional fishing vessels has been a major challenge in Liberia, as is commonplace in African SSF and elsewhere [13,14,15]. One of the important features of the SSF in Africa is their use of dugout canoes, the size of which is limited by the availability of suitable trees [13,16]. Over-exploitation of forest resources is commonplace and current harvesting rates are unsustainable [13,16]. Traditional canoe building is at the center of conflicts between forest conservation and traditional boat building in Africa [13]. This certainly has implications for the production performance of small-scale operators, a phenomenon which appears to manifest itself in the SSF in Liberia.
This paper aims to determine and understand the difference in performance within the SSF fleet segments in Liberia, analyzing technical efficiency. To proceed, we asked: What is the current state of the harvesting technology? Are the small-scale fleets in the coastal fisheries technically efficient? The following section presents the data and variables, and a summary of the theory underlying Stochastic Production Frontier (SPF) analysis used to estimate technical efficiency of individual vessels. The results and discussion are provided in Section 3, while the conclusion and policy recommendations are presented in Section 4.
2. Methods
2.1. Study Site and Data
Data for this analysis were collected at three landing sites, Robertsport (Grand Cape Mount), Point four (Montserrado) and Marshall (Margibi) beaches (see, Figure 2). Both Kru and Fanti operated from all three beaches, which are considered representative of the coastal SSF in Liberia [4,5,17].
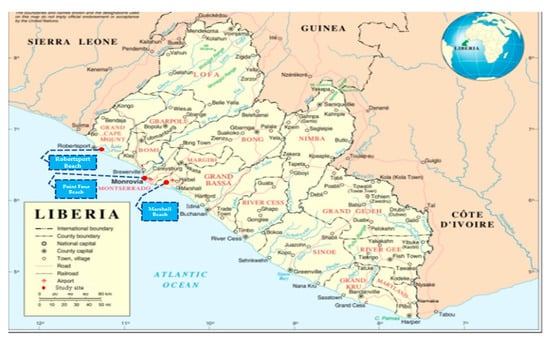
Figure 2.
Map of study area. (FreeMapViewer. Accessed on 06.21.2021).
A total of 48 Kru and 90 Fanti were randomly selected and interviewed at the start of the rainy season during April and May of 2018 using a structured questionnaire (see, SA1). The data collected included landed catch and sales price as well as quantities and cost of inputs including the costs of boats, outboard engines, fuel, fishing gear and bait, and the number of crew. Other operator information collected included skipper’s age and nationality, as well as vessel length. The reliability of the data was evaluated, and outliers removed from the observations [18]. This left valid observations for 46 Kru canoes and 86 Fanti boats for the technical efficiency analysis.
2.2. Stochastic Production Frontier Conceptual Framework
The estimation of technical efficiency is well established in production theory [19,20,21]. Technical efficiency was measured using stochastic production frontier analysis [22,23], where random variability is separated from inefficiency [24,25]. The production frontier is specified as
where qk refers to the catch of vessel k, xki refers to input quantity of input i for vessel k. Transcendental logarithmic (translog) functional specifications are commonly used in applied estimation of SPF due to their flexibility for approximating unknown technology [24,25]. The unknown technology is approximated by a translog function, expressed as
where , and are parameters. The expression further contains a composite error term where is a random error term and uk captures technical inefficiency [26,27]. Technological inefficiency is assumed to be enterprise-specific, non-negative and identically and independently distributed as non-negative truncations of the normal distribution, [19,28]. The error term vk is the statistical noise assumed to be identically and independently distributed and independent of uk. The parameters of the frontier in Equation (1) are estimated using a maximum likelihood method.
Based on Battese and Coelli [24], the technical inefficiency distribution parameter can be extended to include covariates as
where zik are variables of enterprise-specific explanatory variables linked to the technical inefficiency of the kth enterprise, δ refers to the unknown vector of parameters to be estimated, and wk is distributed . The likelihood function is expressed in terms of the variance [24] and, following Battese and Corra [27], Battese and Coelli [26], and Kompas et al. [25], we parameterized the variance terms by substituting and with and . The technical efficiency score for the kth enterprise is specified as
where TEk is the relative technical efficiency of the enterprise, which lies between zero and unity [0 < TE < 1]. The output elasticity of the kth enterprise, which measures the degree of responsiveness of output in response to a percentage change in input, is given as
By centralizing the data at average, the expression simplifies, and the parameters estimate for becomes an estimate of the elasticity at the mean. The elasticity of scale, which measures the percentage change in the expected output due to a relative change in the application of all input variables, is calculated as the sum of the output elasticities for all input variables [29].
2.2.1. Analysis of Technical Efficiency
In this analysis, the output variable ‘catch trip−1’ was elected based on the two main species assemblages ‘shallow-water demersal’ (e.g., Psedotolithus spp., locally referred to as cassava-fish) and the ‘small pelagics’ (Sardinella spp.), given that they were the major target species of the Kru and Fanti boats, respectively. During the survey though, some boats harvested other species. In cases where more than one species assemblages were targeted, catch trip−1 was standardized as a cassava-fish equivalent, using
where qc refers to the aggregate trip-level catch represented in terms of species ‘c’ cassava-fish of a specific boat, qt is catch of other species caught (e.g., grouper or grunter) by that same boat, pt is the average price kg−1 of the species (i.e., grouper or grunter) and pc is the average price kg−1 for cassava-fish of the boat.
2.2.2. Econometric Specification
The catch variable, qk, is the catch weight landed in kg per trip of cassava fish equivalent. The inputs are capital stock (USD) (sum of value of vessel and equipment), labor (the number of crew per boat including the skipper), bait cost (USD per trip for the Kru canoes only), and fuel cost (USD per trip for Fanti boats only). The operators and boat-specific factors in the technical inefficiency parameters for the Kru and Fanti vessels were the overall length, age of the skipper, nationality of skipper, and size of outboard engine. The FRONTIER 4.1, package in R was used to estimate the parameters of 2, 3, and 4. For the Kru canoes, the parameters were capital, labor, and bait in Equation (2), overall length and the skipper’s age in Equation (3), and estimate of technical efficiency in Equation (4). The parameters for the Fantis were capital, labor, and fuel in Equation (2), skipper’s age and nationality, small and medium size engine and small and medium size boat in Equation (3), as well as the estimate of technical efficiency in Equation (4). The translog functional specifications were tested against the simpler Cobb–Douglas definition by a likelihood ratio (LR) test.
3. Results and Discussion
There was considerable heterogeneity in terms of the operational and technical aspects of the small-scale fleets, such as the cost of capital stock, labor, bait, fuel, the skipper’s age, overall length, and the outboard engine (Table 1). The mean catch for the Kru canoes was 16 ± 25 kg trip−1, varying from 1.9 to 123 kg trip−1. Capital stock ranged from USD 136 to USD 600 and averaged 330 ± 89 USD canoe−1. While the crew size averaged 2 ± 1 persons and varied between 1 to 4 people canoe−1 for the Kru, the bait cost trip−1 varied between 1.6 to 8 USD and averaged around 4.5 ± 1.8 USD. The average age of Kru skippers was estimated at 38 ± 11 years, but ranged from 22 to 70 years, while overall length ranged between 3.7 to 10 m, with an average of 6.7 ± 1.5 m (Table 1). Catch for the Fanti boats averaged 166 kg trip−1, varying between 1 to 1287 kg trip−1, while mean capital stock was estimated at 8650 ± 10,775 USD, but ranged between 550 to 60,000 USD boat−1. Crew size ranged between 4 to 26, with an averaged 14 ± 5 boat−1. Fuel cost by the Fanti boats varied from USD 1.8 to 90, averaging 15.3 ± 15.2 USD trip−1. The mean age of Fanti skippers was 41 ± 8 years but ranged from 25 to 60 years, and the overall length varied between 4.6 and 21.6 m, averaging 10 ± 3.9 m (Table 1). The mean cost of the outboard engines was estimated at 3152 ± 896 USD and varied between USD 950 to 4500. The average catch trip−1 and input of labor for the Fantis exceeded that of the Kru canoes, as has been observed elsewhere for motorized and non-motorized boats in SSF [30].

Table 1.
Summary statistics for key variables in the SPF and technical inefficiency models for the Kru and Fanti vessels in Liberia.
Technical Efficiency
There was not sufficient evidence to reject the null hypothesis that technical inefficiency effects are absent in the models (γ = 0 and δi = 0 for all k) for the Kru and Fanti boats. The second null hypothesis that the appropriate functional forms for the SPF models are of the Cobb–Douglas form, imposed by removing the square and cross product terms, was rejected at the 5% significance level for the Kru and at the 1% significance level for the Fanti boats. This indicates that the translog production functions are the most appropriate functional specifications for the analysis of the small-scale Kru and Fanti vessels in Liberia (see, Table S1).
Lastly, the null hypothesis that (when the variance of the inefficiency effects is zero) or that technical inefficient effects are not stochastic, was also strongly rejected at 5% significance level and better for both fleets (see, Table S1). For both estimated models, the results thus indicate that stochastic effects and technical inefficiency are major factors explaining the performance of the Kru and Fantis.
The technical efficiency score for the Kru canoes averaged 0.53 ± 0.12 and seems to follow observation for SSF fishers elsewhere [31]. The efficiency indices for the Kru canoes significantly decreased (p < 0.00) along with an increase in canoe length, which may be attributed to the cost of larger canoes and skipper age (Figure 3a). This suggests that small Kru canoes (≤6.1 m) and younger skippers (≤40 years) are more efficient than larger canoes (>6.1 m) and older skippers (>40 years). About 46% of the observed Kru canoes’ technical efficiency score ranged between 0.41 and 0.60, followed by 28% of the canoes with efficiency indices in the range 0.61–0.80 (Figure 3b), indicating that most of the Kru canoes are inefficient.
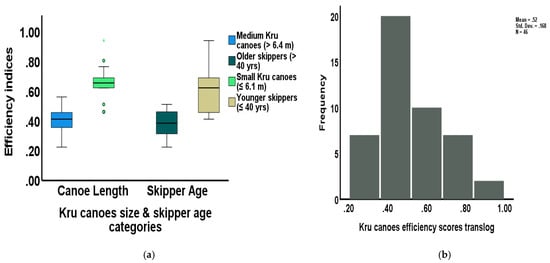
Figure 3.
Differences in technical efficiency and frequency distribution of efficiency: (a) Differences in technical efficiency scores by Kru canoe size and skipper age; (b) Frequency distribution of efficiency indices for small-scale Kru canoes in Liberia.
Technical efficiency score of the Fanti boats averaged 0.70 ± 0.16 and increased significantly with boat length (p < 0.00) and skipper age (Figure 4a). This indicates that larger Fanti boats (>7.6 m) and older skippers (≥40 years) were more efficient than small boats (≤7.6 m) and younger skippers (≤40 years), which is contrary to what was observed with the Kru canoes. It seems, for Kru operators who mostly use hook and lines, that the length of the boat does not matter as much as it does for the Fantis, which mainly deploy large ring nets and require a large crew (manpower) to pull them. Fantis, therefore, cannot operate in the same way a typical small boat does, which might be more important than the skipper’s age. Approximately 44% of the Fanti boats technical efficiency scores were in the interval of 0.61–0.80, followed by 34% with efficiency scores greater than 0.80 (Figure 4b). Based on these estimates, the Fanti boats are on average 17% more efficient than the Kru canoes.
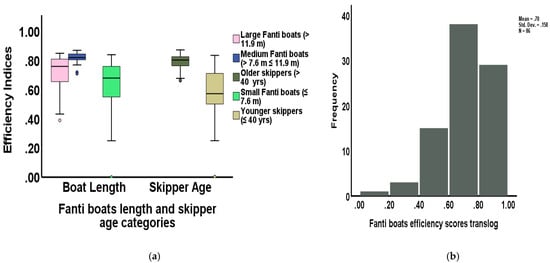
Figure 4.
Differences in technical efficiency and frequency distribution of efficiency: (a) Differences in technical efficiency scores across Fanti boat size and skipper age. (b) Frequency distribution of efficiency indices for small-scale Fanti boats in Liberia.
The parameter estimates evaluated at the sample mean are output elasticities which indicate the magnitude of the responsiveness of output to a percentage change in the models’ endogenous input variables. The output elasticities of capital, labor, and bait for the Kru canoes are 1.45, 0.42, and 0.35, respectively, and the return to scale is estimated at 2.22 at the sample mean (Table 2). The output elasticity is highest for capital but lowest for bait used (Table 2). The coefficient for capital is statistically significant at 1% significance level, while they are insignificant for labor and bait used. The positive signs associated with the coefficients of capital, labor, and bait indicate that these inputs variables have positive effects on the Kru canoes output, as expected (Table 2).
Table 2.
Parameter estimates of the Kru canoes and Fanti boats SPF and technical inefficiency models.
Vessel length overall has significant (p < 0.05) negative effect on technical efficiency of Kru canoes, but the dummy variable “younger skipper” had a positive but not statistically significant effect (Table 2). Gamma (γ) for the Kru canoes model was statistically significant at 5% significance level (Table 2), indicating that all deviations are entirely due to technical inefficiency and random noise but most importantly to technical inefficiencies [24,29].
The Fanti boats output elasticities of capital, labor, and fuel are 0.42, 0.46, and 1.09, respectively, and the elasticity of scale is estimated to be 1.97 at mean-scale (Table 2). The output elasticity is greatest for fuel used per trip, but lowest for capital. The Kru canoes return to scale is relatively higher (0.25) than the Fanti boats. The estimates of elasticities of scales indicate an increasing return to scale (IRS) for both Kru and Fanti vessels. The coefficients of capital and fuel are significant (p ≤ 0.05), but labor is insignificant (Table 2). All coefficients are positive, as expected, indicating that capital, labor and fuel have positive effects on the output of the Fanti boats. The positive signs associated with capital, labor, and fuel (for Fanti) in both Kru and Fanti boat models follow those reported elsewhere [32,33].
Estimates for the Fanti boats inefficiency model indicates that none of the covariates (dummy variables z1–z6) were statistically significant (Table 2). The negative signs linked to the coefficients of dummy variables z1, z3, z5, and z6 indicate that older skippers, small sized outboard engines, and medium and large size boats have positive effects on the production efficiency of Fanti boats (Table 2), whereas foreign skippers and medium sized outboard engines have a negative effect on the technical efficiency of these boats. Gamma in the Fanti boats model is statistically significant (p < 0.00) (Table 2), indicating that both statistical noise and inefficiency are significant in explaining deviations from the SPF, though inefficiency is more significant than noise [24,29].
There are efficient and inefficient Kru canoes and Fanti boats in the SSF in Liberia, but, on average, they are profitable, earning between USD 510 and USD 8000 for a typical Kru and Fanti, respectively [4]. This may explain why there has been a continuous increase in the number of Kru canoes since the end of the civil war and following the introduction of the six nm IEZ policy in 2010 to protect the SSF and control illegal fishing by industrial trawlers (Figure S1) [7]. The number of Fanti boats, however, has been relatively stable since 2011.
This raises the question of why the industrial vessels left the coastal fishery, declining from 60 vessels in 2004 to just 6 in 2019. One plausible explanation for their decline, specifically starting from 2003, could be attributed to the new government policies after a long period of instability. There was a complete lack of governance in the fishing industry, as was generally the case with most sectors in the economy, and harvesting was largely unregulated, resulting in rampant illegal unregulated and unreported fishing [8]. Since 2004, successive governments have focused on governance of the fisheries sector, with a significant fishery reform introduced in 2010 [7]. Another possible reason for the industrial vessels’ departure could be due to the decline of catches (Figure S2), after a prolonged period of high levels of illegal (unlicensed) fishing activities during the civil war that started in 1989 and ended in 2003 [8,9]. Before the civil war ended in 2003, the industrial vessels total catch was on average nearly 11 times what it has been since 2010 (Figure S2) [4].
The departure of the industrial vessels from the coastal fisheries in 2004 coincided with an increase in both the catch and the number of Kru and Fanti boats. For instance, between 2004 and 2016, the average annual total catch of the Kru and Fantis doubled compared to what it was before 2004 when there were around 60 industrial vessels. For this same period, the average number of Kru canoes in the coastal fisheries is approximately 11 times what they were before 2004, whereas for the Fanti boats, it is around 6 times (Figure S1). Although the current number of Kru canoes and Fanti boats together have, on average, increased in the SSF by around 9-fold, their total catch has only doubled over these years (Figure S2). This indicates how inefficient and archaic the harvesting technology employed by the Kru and Fanti boats in Liberia is. This also indicates overfishing due to increased fishing pressure (effort), which has implications for the sustainability of the fishery resources in Liberia. Jueseah et al. [4] and MRAG [5] recently found that, the shallow- and deep-water demersals, the Kru canoes main target species were overfished, and suggested a need for stricter regulations, particularly for the Kru canoes that mostly seem to thrive under open access. It seems that the fishery is characterized by both considerable inefficiency and use of low-level harvesting technology among Kru canoes and Fanti boats in Liberia and unsustainable utilization of the fish stocks [4,5]. In an unregulated fishery, there is an inverse relationship between efficiency and biological sustainability, i.e., the more efficient the vessels are, the less biologically sustainable the fishery becomes [34]. Economic sustainability is, however, positively related to efficiency [34,35]. Improved fisheries management will improve both biological and economic sustainability but will lead to fewer fishers being involved in the sector [34,35,36,37] and might limit the ability of the sector to act as a buffer for unemployed young men, perhaps reducing social sustainability. This is the challenge of fisheries management [34]. Increased efficiency will certainly generate wealth [34,35,36,37]. The overall social impact will depend on government policy and the distribution of benefits. This suggests that any measure to increase the efficiency of the small-scale fleet must also consider all aspects of sustainability of the resources and socio-economic implications.
To keep the number of Kru canoes at sustainable levels, it seems fisheries management measures should be considered to change the current incentive in the SSF, although management of SSF can be quite complicated. Still, substantial benefits could be obtained by introducing proper fisheries management measures for the sustainable utilization of the fishery resources in Liberia [38,39,40].
Jueseah et al. [4] found that all the fish stocks in the Liberian coastal waters, except the shallow-water demersals, were underutilized. This was attributed to the prolonged civil conflict, underinvestment in the coastal fisheries, and the changes in policy in 2010 [4]. After the end of the civil war and the departure of the industrial vessels, the coastal fishery resources in the Liberian coastal waters have mostly been exploited by the Kru and Fanti that seem to be generally inefficient and lacking in appropriate harvesting technology to fully utilize the fish resources in the Liberian coastal waters. During the civil war, there was a long period of underinvestment in new harvesting technology in the coastal fisheries. A considerable proportion of the small-scale Kru and Fanti boats are old (i.e., ≥10 years) (see, Figures S3 and S4) and in bad shape, because they have passed what can be considered their average lifespan (i.e., 6–7 year) [41] and gained extra weight over time by absorbing water, which makes them difficult to paddle. There has been a considerable growth in the Kru fleet, albeit with smaller canoes. The Fanti boats are larger and, given that their keel must be made of a single piece of big forest wood, is a major problem which may explain why there has been no growth in this fleet in recent years [4]. It seems that the investment of small-scale Kru operators over recent years has been in low technology that is not working so well, whereas the Fantis find themselves in a situation where they do not have access to the required raw materials for new boats. This indicates a technical regression which impacts the livelihoods of all those involved in the SSF in Liberia.
However, the limited scope these traditional boats offer to improve harvesting technology indicates a significant need for a technological leap in the SSF in Liberia. Alternative technologies that might be employed in the coastal fisheries that will both improve the profitability and livelihoods of the small-scale operators should be explored. In this case, therefore, it seems advisable for the government to introduce new harvesting technology such as fiberglass reinforced plastic (FRP) vessels comparable to those in Iceland, Nigeria, and elsewhere in the SSF sector [15,42,43,44]. In recent decades, FRP fishing vessels have gradually been introduced into fishing communities globally as alternative material for shrinking forest resources used to build traditional small-scale fishing boats [15,42,43]. FRP boats are reported to have a longer hull life, less maintenance costs, and are 27% lighter than comparable traditional wooden boats [15,42,43]. The question is whether the small-scale operators will be willing to adopt new technology. Small-scale operators’ attitudes toward changes are usually positive if they are convinced that the change will have positive effects on their fishing and livelihoods [44]. Inputs such as capital stock and fuel have significant positive effects on productivity (Table 2). These results could be presented and discussed with operators in the SSF to improve their understanding of efficiency.
4. Conclusions and Policy Recommendation
Analysis of the differences in technical efficiencies of the Kru and Fanti fleets in Liberia indicates considerable heterogeneities in terms of the operational and technical aspects such as the quantity of inputs used and output produced. Input quantities such as capital stock and labor (crew) used, and output produced by the Fantis were on average much higher than their Kru counterparts. The technical efficiency scores of about 28% of the observed Kru canoes ranged between 0.61 and 0.80, whereas approximately 44% of the Fanti boats’ technical efficiency indices falls into the same bracket. A considerable proportion of the small-scale fleets appear to have potential for improvement in their productivity, considering the present low level of technologies and the state of the fishery resources.
There were efficient boats and inefficient boats among the Kru and Fanti, but on average they were profitable [4]. This may be the reason for the growth trend in the Kru fleet at the end of the war and following the Liberian government’s establishment of a zoning policy in 2010, although the Fantis have remained quite constant. The trawlers’ exit from the coastal fisheries after the war and the Liberian government’s zoning policy in 2010 seems to correspond with an increase in both the catch and number of small-scale Kru and Fanti vessels. While the small-scale fleets increased by nine times on average, their catch only doubled for the period, indicating a significant level of inefficiency in the SSF. However, given the traditional dugout construction of these boats, a low-level technology that has not been working very well, and the problem associated with the sourcing of raw materials used for their construction, there is a risk of technological regression in the SSF. This again leads to an ever more limited ability to invest in and adopt improved harvesting technologies. It seems, therefore, that there is a need for a technical leap in the coastal fisheries in Liberia.
Vessel length and skipper age appear to be the two major factors that influence the technical efficiency of the small-scale fleets. The technical efficiency of the Kru canoes decreases significantly with an increase in canoe length and skipper age, whereas for the Fanti boats it increases with an increase in boat length and skipper age. This indicates that younger skippers (≤40 years), employing newer and smaller dugout Kru canoes (≤6.1 m), seem to be more efficient than older operators (>40 years) using older and larger canoes. Although it is possible to fish with hook and line from small canoes, it is more difficult to use small vessels when ring nets are deployed. This is intriguing and suggests it might be easier to operate Kru canoes, since running a typical Kru canoe just requires muscle power to propel, which is why younger skippers do better than older skippers. It is more difficult to run a Fanti boat, therefore experience and the size of the vessel matter.
Capital stock, labor, and bait used had positive effects on the output of Kru canoes, but only capital stock had a significant effect. For the Fanti boats, capital and fuel used had significant positive effects on their output. There seems to be IRS for the Kru and Fanti boats, but the Kru canoes were observed to be 0.25 higher. This indicates that when use of all three input variables (i.e., capital stock, labor, bait or fuel) were to be increased by around 10%, output (i.e., catch trip−1) would increase by around 15%, assuming constant stock abundance.
Jueseah et al. [17] found that Kru operators received a price premium from hoteliers for high quality (fresh) cassava fish landed in Liberia. In order to land high quality fish, the small-scale vessels need space onboard for chillers, but the evolution of Kru and Fanti fleet is moving towards smaller vessels (see, Figures S3 and S4). Larger and more efficient vessels, such as FRP boats, would make it possible to improve the quality of the landed fish and efficiency (profitability). There is, however, a likely trade-off between quantity and quality of the landed fish, that would, in turn, affect prices and profitability e.g., see [45]. For instance, it is possible that the technically most efficient vessel may land large quantity of low-quality fish, but may still be more profitable than a less efficient vessel that lands fish of high-quality and receive better prices e.g., see [45]. This certainly has implications for value-adding and marketing in subsequent links of the value chain [45] and calls for further research when examining alternative fishing vessels and harvesting technologies for the current traditional Kru and Fanti boats in Liberia.
Certain policy interventions might be feasible to improve technical efficiency and profitability of the small-scale fleets in Liberia. For instance, the government could explore, promote, and introduce new harvesting technology such as FRP boats to both increase the productivity and profitability of the SSF. We think such intervention might help to address the current technical regression in the fisheries and utilize the coastal fishing resources better in Liberia. Nevertheless, problems arise when it comes to accepting the socio-economic costs embedded in the technological innovation. For example, a change towards the use of new FRP vessels or increased motorization is not just a question of technically managing the capital stock but also means changing the management of finances in terms of savings for future reinvestment and perhaps altering the labor patterns to maximize the employment of the capital stock [44]. Moreover, it may mean a need to produce (harvest) more and sell most of the catch. It normally leads to modifications in the attitudes towards technological innovations when these hidden features become evident [44].
To deal with the challenge associated with the introduction of a new harvesting technologies, it is best at the pilot level to elect an entrepreneur strategy. The government could select individual boat owners/skippers who, to a certain extent, are marginal in the fishing community [44]. They could be teachers, farmers, carpenters, traders, among others, and they should be allowed to choose their own crew. They must, at the onset, demonstrate clear interests in investing in the fishing industry. This strategy is largely based on the assumption that, as entrepreneurs, individuals (i.e., boats owners/skippers) would typically act economically more easily and in accordance with the requirements of the new harvesting technology [44]. This strategy has been reported to be successful in northern Angola [44]. The government should also endeavor to train Kru and Fanti operators in the technical and business management aspects of their fishing enterprises. Small-scale boat operators require enhanced enterprise management knowledge and skills as fishing becomes more market driven [46]. In this case, the government needs to improve the working environment for the small-scale fleets to operate in, aiming to make them willing and able to invest in new harvesting technologies that improve efficiency and safety.
Supplementary Materials
The following are available online at https://www.mdpi.com/article/10.3390/su13147767/s1, Figure S1: Changes in coastal fleets in Liberia, Figure S2: Catch development of the Liberian coastal fleets, Figure S3: Variability in length by age of Kru canoes, Figure S4: Variability in length by age of Fanti boats, Table S1: Generalized likelihood test ratio tests of hypothesis for parameters of SPF.
Author Contributions
Conceptualization, A.S.J.; Methodology, A.S.J.; Software, A.S.J.; Validation, D.M.K., T.T. and O.K.; Formal Analysis, A.S.J.; Investigation, A.S.J.; Data analysis, A.S.J.; Writing—Original Draft Preparation, A.S.J.; Writing—Review and Editing, A.S.J., D.M.K., T.T. and O.K.; Supervision, D.M.K., T.T. and O.K.; All authors have read and agreed to the published version of the manuscript.
Funding
This research was funded by the National Fisheries and Aquaculture Authority of Liberia, within the framework of the Sectorial Support Program of the Sustainable Fisheries Partnership Agreement between Liberia and the EU and the UNESCO affiliated GRO-Fisheries Training Programme in Iceland.
Institutional Review Board Statement
The study was conducted according to the guidelines of the Declaration of Helsinki, and approved by the Doctoral Committee, School of Social Sciences, University of Iceland (Approval Code Not Applicable).
Informed Consent Statement
Informed consent was obtained from all subjects involved in the study.
Data Availability Statement
The data used in this analysis are available on request from the corresponding author.
Acknowledgments
All the fishermen who provided valuable information through interviews, research assistants, fishery managers (research and statistics division) at NaFAA as well as three anonymous reviewers of an earlier manuscript, are hereby acknowledged.
Conflicts of Interest
The authors declare no conflict of interest.
References
- Belhabib, D.; Sumaila, U.R.; Pauly, D. Feeding the poor: Contribution of West African fisheries to employment and food security. Ocean Coast. Manag. 2015, 111, 72–81. [Google Scholar] [CrossRef]
- Ministry of Agriculture. Fisheries and Aquaculture Policy and Strategies; Ministry of Agriculture: Monrovia, Liberia, 2014. [Google Scholar]
- MRAG. Fisheries Governance Diagnostic Study, Liberia; MRAG: Liberia, West Africa, 2013. [Google Scholar]
- Jueseah, A.S.; Kristofersson, D.M.; Tómasson, T.; Knutsson, O. A Bio-Economic Analysis of the Liberian Coastal Fisheries. Sustainability 2020, 12, 9848. [Google Scholar] [CrossRef]
- MRAG. Fisheries Stock Assessment; Report Produced under WARFP/BNF Contract 11/001; MRAG: Monrovia, Liberia, 2014. [Google Scholar]
- Ssentongo, G.W. Marine Fishery Resources of Liberia: A Review of Exploited Fish Stocks; FAO: Rome, Italy, 1987. [Google Scholar]
- Chu, J.; Garlock, T.M.; Sayon, P.; Asche, F.; Anderson, J.L. Impact Evaluation of a Fisheries Development Project. Mar. Policy 2017, 85, 141–149. [Google Scholar] [CrossRef]
- Braimah, L. Combating IUU Fishing in Liberia: Chatham House; James’s Square: London, UK, 2012. [Google Scholar]
- MRAG. Review of Impacts of Illegal, Unreported and Unregulated Fishing on Developing Countries; MRAG: London, UK, 2005. [Google Scholar]
- FAO. Fisheries Management; FAO Technical Guidelines for Responsible Fisheries 4; Food and Agriculture Organization of the United Nations: Rome, Italy, 1997. [Google Scholar]
- Ministry of Agriculture. Regulations Relating to Fisheries; Fishing and Related Activities for the Marine Fisheries Sector in the Republic of Liberia: Monrovia, Liberia, 2010. [Google Scholar]
- World Bank. Economic, Environmental, and Social Evaluation of Africa’s Small-Scale Fisheries; World Bank: Washington, DC, USA, 2015; p. 95557. [Google Scholar]
- Levenson, E.; Mesaki, S. Traditional Boat Building: An Intersection of Zanzibar’s Culture and Environment; Bowdoin College: 255 Maine St, Brunswick, ME, USA, 2013; Available online: https://digitalcollections.sit.edu/isp_collection/1696/ (accessed on 29 May 2021).
- Olsen, B. Traditional Woodcarving in Elmina: The Creation of a Fishing Canoe. In Independent Study Project (ISP) Collection; Bowdoin College: Brunswick, ME, USA, 2013; Available online: https://digitalcollections.sit.edu/isp_collection/1679 (accessed on 25 May 2021).
- Wibawa, I.P.A.; Birmingham, R.W. Fiberglass Reinforced Plastic as Construction Material for Indonesian Fishing Vessels—Challenges and Future Potential Development. MATEC Web Conf. 2018, 204, 5009. [Google Scholar] [CrossRef] [Green Version]
- Chidumayo, E.N. The Dry Forests and Woodlands of Africa: Managing for Products and Services, 1st ed.; Routledge: Oxfordshire, UK, 2010. [Google Scholar] [CrossRef]
- Jueseah, A.S.; Knutsson, O.; Kristofersson, D.M.; Tómasson, T. Seasonal Flows of Economic Benefits in Small-Scale Fisheries in Liberia: A Value Chain Analysis. Mar. Policy 2020, 119, 104042. [Google Scholar] [CrossRef]
- Belsley, D.A.; Kuh, E.; Welsch, R.E. Regression Diagnostics: Identifying Influential Data and Sources of Collinearity; Wiley Series in Probability and Mathematical Statistics; Wiley: New York, NY, USA, 1980. [Google Scholar]
- Aigner, D.; Lovell, C.; Schmidt, P. Formulation and estimation of stochastic frontier production function models. J. Econ. 1977, 6, 21–37. [Google Scholar] [CrossRef]
- Fried, H.O.; Lovell, C.; Schmidt, S.S. The Measurement of Productive Efficiency: Techniques and Applications; OUP Catalogue; Oxford University Press: Oxford, UK, 1993; Available online: https://econpapers.repec.org/bookchap/oxpobooks/9780195072181.htm (accessed on 20 April 2021).
- Herrero, I. Risk and Strategy of Fishers Alternatively Exploiting Sea Bream and Tuna in the Gibraltar Strait from an Efficiency Perspective. ICES J. Mar. Sci. 2004, 61, 211–217. [Google Scholar] [CrossRef] [Green Version]
- Färe, R.; Grosskopf, S.; Knox Lovell, C.A. Studies in Productivity Analysis. In The Measurement of Efficiency of Production; Springer: Dordrecht, The Netherlands, 1985. [Google Scholar] [CrossRef]
- Fare, R.; Grosskopf, S.; Lovell, C.A.K. Production Frontiers, 1st ed.; Cambridge University Press: New York, NY, USA, 1993. [Google Scholar] [CrossRef]
- Battese, G.E.; Coelli, T.J. A Model for Technical Inefficiency Effects in a Stochastic Frontier Production Function for Panel Data. Empir. Econ. 1995, 20, 325–332. [Google Scholar] [CrossRef] [Green Version]
- Kompas, T.; Nhu Che, T.; Grafton, R.Q. Technical Efficiency Effects of Input Controls: Evidence from Australia’s Banana Prawn Fishery. Appl. Econ. 2004, 36, 1631–1641. [Google Scholar] [CrossRef]
- Battese, G.; Coelli, T. Working paper in econometrics and applied statistics. In A Stochastic Frontier Production Function Incorporating a Model of Technical Inefficiency Effects; University of New England, Department of Econometrics: Armidale, Australia, 1993. [Google Scholar]
- Battese, G.E.; Corra, G.S. Estimation of a Production frontier model: With Application to the Pastoral Zone of Eastern Australia. Aust. J. Agric. Econ. 1977, 21, 169–179. [Google Scholar] [CrossRef] [Green Version]
- Coelli, T.J.; Rao, D.S.P.; Battese, G.E. An Introduction to Efficiency and Productivity Analysis; Kluwer Academic Publishers: Boston, MA, USA, 2005. [Google Scholar]
- Henningsen, A. Introduction to Econometric Production Analysis with R; Leanpub: Victoria, BC, Canada, 2019; Available online: https://leanpub.com/ProdEconR (accessed on 24 April 2021).
- Mpomwenda, V. Productive Performance of the Lake Victoria Fishing Fleet in Uganda: Technical Efficiency and Fishers’ Perspective. Ph.D. Thesis, University of Iceland, Reykjavik, Iceland, 2018. Available online: https://skemman.is/handle/1946/30269 (accessed on 24 April 2021).
- Sesabo, J.K.; Tol, R.S.J. Technical Efficiency of Small-Scale Fishing Households in Tanzanian Coastal Villages: An Empirical Analysis. Afr. J. Aquat. Sci. 2007, 32, 51–61. [Google Scholar] [CrossRef] [Green Version]
- Kirkley, J.E.; Squires, D.; Strand, I.E. Assessing Technical Efficiency in Commercial Fisheries: The Mid-Atlantic Sea Scallop Fishery. Am. J. Agric. Econ. 1995, 77, 686–697. [Google Scholar] [CrossRef]
- Truong, N.X.; Vassdal, T.; Ngoc, Q.; Anh, N.T.K.; Pham, T.T.T. Technical Efficiency of Gillnet Fishery in Da Nang, Vietnam: Application of Stochastic Production Frontier. Fish People 2011, 9, 27–39. [Google Scholar]
- Danielsen, R.; Agnarsson, S. In Pursuit of the Three Pillars of Sustainability in Fisheries: A Faroese Case Study. Mar. Resour. Econ. 2020, 35, 177–193. [Google Scholar] [CrossRef]
- Hilborn, R. Defining success in fisheries and conflicts in objectives. Mar. Policy 2007, 31, 153–158. [Google Scholar] [CrossRef]
- Abbott, J.K.; Garber-Yonts, B.; Wilen, J.E. Employment and Remuneration Effects of IFQs in the Bering Sea/Aleutian Islands Crab Fisheries. Mar. Resour. Econ. 2010, 25, 333–354. [Google Scholar] [CrossRef]
- Gunnlaugsson, S.; Saevaldsson, H. The Icelandic fishing industry: Its development and financial performance under a uniform individual quota system. Mar. Policy 2016, 71, 73–81. [Google Scholar] [CrossRef]
- Hannesson, R. Bioeconomic Analysis of Fisheries: An FAO Fishing Manual, 1st ed.; Wiley-Blackwell: Oxford, UK, 1993. [Google Scholar]
- Scott, A. The Fishery: The Objectives of Sole Ownership. J. Political Econ. 1955, 63, 116. [Google Scholar] [CrossRef]
- World Bank, World. The Sunken Billions Revisited: Progress and Challenges in Global Marine Fisheries; World Bank: Washinton DC, USA, 2017. [Google Scholar]
- Gudbrandsen, O. Canoe in Ghana FAO Report: IDAF/WP/37; FAO: Cotonou, Benin, 1991; Available online: www.fao.org/3/an076e/an076e.pdf (accessed on 20 April 2021).
- Fyson, J.F.; Coackley, N.; Riley, R.O.N.; FAO (Eds.) Building a Fibreglass Fishing Boat; Fishing Boat Construction; FAO: Rome, Italy, 1991. [Google Scholar]
- Shamsuddin, M.Z.B. A Conceptual Design of a Fibre Reinforced Plastic Fishing Boat for Traditional Fisheries in Malaysia, United Nation University-Fisheries Training Programme Final Project, Reykjavik, Iceland. 2003. Available online: https://www.grocentre.is/static/gro/publication/139/document/samsuddin03prf.pdf (accessed on 20 April 2021).
- Tvedten, I.; Hersoug, B. (Eds.) Fishing for Development: Small-Scale Fisheries in Africa; Nordiska Afrikainstitutet; Distributed by Almqvist & Wiksell International Uppsala: Stockholm, Sweden, 1992. [Google Scholar]
- Sogn-Grundvåg, G.; Zhang, D.; Dreyer, B. Fishing Methods for Atlantic Cod and Haddock: Quality and Price versus Costs. Fish. Res. 2020, 230, 105672. [Google Scholar] [CrossRef]
- Severin, R.O. ICT Applications for Fish Enterprise Management: Advance Fisherfolks Management Training Course (AFTC); Rosseagr Services: Aston, PA, USA, 2012. [Google Scholar]
Publisher’s Note: MDPI stays neutral with regard to jurisdictional claims in published maps and institutional affiliations. |
© 2021 by the authors. Licensee MDPI, Basel, Switzerland. This article is an open access article distributed under the terms and conditions of the Creative Commons Attribution (CC BY) license (https://creativecommons.org/licenses/by/4.0/).