Abstract
The growth of passive and socially responsible (SR) investment makes that sustainability indices play an important role in defining what constitutes a sustainable investment. In order to know the suitability of sustainability indices as benchmarks for SR investors, we used different linear regressions to compare the compositions of sustainability indices and their conventional counterparts and to compare the levels of corporate social responsibility (CSR) of both types of indices. We showed that the composition of sustainability indices gradually converged towards their conventional peers. Moreover, the difference between the CSR levels of both type of indices remained the same or even decreased over time. We concluded that a change in the weighting method of sustainability indices such as the equally weighted criterion would significantly increase the difference from their conventional counterparts. However, due to the relationship between CSR and size, this change would penalize the CSR level of the index. These results raise the question of whether SR passive investors will be able to meet their non-financial expectations as a consequence of the convergence.
1. Introduction
In recent years, a growing interest for creating sustainability equity indices has been stated because of the increasing importance of socially responsible (SR) investment. According to the Index Industry Association (IIA), the number of environmental, social and governance (ESG) indices increased by 13.85% in 2019 and 40.20% in 2020.
Different index providers have created sustainable benchmarks referred to different markets (geographical areas) as well as to global scopes. Escrig-Olmedo et al. [1] provide an extensive overview of the growing number of suppliers that have started to provide this information since 2008. This growth is also observed in the number of research studies that uses permanence in sustainability indices as a proxy of high corporate social responsibility (CSR) standards [2,3,4,5]. However, most of the research in the field has focused on the analysis of financial performance of these indices [6,7,8,9]. According to Barnett et al. [10], 5314 researches analyzing the influence of CSR on financial performance were published from 2010 to 2018. These statistics suggest that too many resources have been dedicated to analyzing the effect of CSR on financial performance and too few have been used to study the CSR itself.
As opposed to the dominant research focused on financial performance, some studies have focused on the analysis of the criteria to set up sustainability indices [11,12,13] and on the determinants for a company to be included in or excluded from the benchmarks [14,15,16]. However, Ziegler [17] suggests that the composition of sustainability indices may be influenced by factors that are not directly connected to corporate, environmental, or social activities. In addition, some authors underline that some sustainability indices include companies that have been involved in controversies [18,19]. From our point of view, most of these studies are incomplete, since they could have found similar results, regardless of whether they had applied the same analysis to conventional indices. This study is more comprehensive, considering different geographical areas, as well as analyzing not only several sustainability indices, but also their respective conventional counterparts. Specifically, we analyzed three FTSE conventional indices and their FTSE4Good counterparts from 2008 to 2019.
FTSE is one of the most important index providers, and the FTSE4Good series have been widely used in previous literature [20,21,22]. The FTSE4Good indices are obtained from the constituents of the conventional FTSE series that have high ESG scores. Moreover, similar to other sustainability indices, FTSE4Good indices also exclude companies that are exposed to major controversies and some business activities, such as tobacco or weapons.
According to Oberndorfer et al. [23], sustainability stock indices are considered an appropriate indicator for corporate environmental and social activities. In other words, previous literature considers that the constituents of sustainability indices are substantially different from the constituents of conventional indices. In fact, many studies use the permanence in a sustainability index as a certification of high standards of CSR rather than using ESG ratings [24,25,26]. However, to what extent are these indices different? This study contributes to previous literature that analyzes the financial performance of sustainability indices and the determinants to include or exclude companies from these indices due to the novel analysis of the differences between both types of indices in terms of their constituent weights and in terms of their CSR levels.
Previous studies have not paid enough attention to analyze how SR investments differ from conventional ones. However, the current challenges are to define what a SR investment is (European Union Directive 2020/852 on the establishment of a framework to facilitate sustainable investment) and how these investments are commercialized (European Union Regulation 2019/2088 on sustainability-related disclosures in the financial services sector). This paper aims to help solve these problems by proposing the sustainability share, a straightforward to understand measure derived from the active share of Cremers and Petajisto [27]. The sustainability share identifies to what extend a SR investment differs from its conventional counterpart.
We use the sustainability share to analyze the similarity between sustainability indices and conventional ones due to the growth of passive investment [28] and SR investment [29,30]. Sustainability index providers exercise a great power in defining what constitutes a SR investment and in guiding SR funds towards their constituents [12]. Thus, we should demand the index industry that their sustainability indices measure something different from the current conventional references. Moreover, we should question whether sustainability indices would be fulfilling the expectations of SR investors whether their similarity to conventional indices is high. This fact leads us to examine whether a simple change in the weighting criteria of the FTSE4Good indices, from size-weighted (SW) to equally weighted (EW), would affect the sustainability shares of both types of indices.
This change in the weighted criteria could affect the level of CSR of the index because of the relationship between size and the ESG score documented by previous literature: (1) several studies confirm that a high-rated CSR equity portfolio shows a higher exposure to size than a low-rated portfolio [31,32,33]; and (2) the size is often positive and statistically significant in the studies that use regressions where the dependent variable is a measure of CSR performance [34,35,36]. However, according to Drempetic et al. [37], one of the problems with CSR indicators is that they are excessively influenced by size. Thus, to explore to what extent the SW method affects the CSR level of the index, we analyze whether the SW ESG score of the indices is higher than their EW ESG score and how this difference has changed in the period of analysis.
Finally, as opposed to previous literature focused on whether SR investors outperform conventional ones or not, we try to observe whether passive SR investors meet their non-financial expectations. According to Renneboog et al. [38], SR investors care less about financial performance, because they derive a non-financial utility from investing in companies meeting high environmental and social standards. Borgers and Pownall [39] and Gutsche and Ziegler [40] confirm this hypothesis and show that SR investors are willing to pay or sacrifice returns for investing in SR products. However, to what extent are SR investors meeting their non-financial utility? SR investors do not only seek to invest in SR companies, but also to encourage them to be SR. Thus, we analyze whether the CSR level of sustainability indices is higher than that of conventional indices and how the difference between the CSR levels of both indices changes in the period of analysis.
2. Data and Methodology
2.1. Data
To carry out the study, we considered three FTSE families: FTSE Developed, FTSE Europe, and FTSE US. Specifically, from each family, we analyzed the conventional index and its sustainability counterpart (FTSE4Good). The FTSE4Good indices have been designed to measure the performance of companies utilizing globally recognized ESG standards. Each FTSE4Good index is created from their FTSE conventional counterpart, and each family is composed of companies from different geographical areas: Europe, United States, and developed countries. The Refinitiv database provides the monthly composition and the weight of each company of these FTSE indices. Table 1 provides some information about the indices analyzed such as the geographic area of investment (see Market Column) and the ticker used by Refinitiv for each index.

Table 1.
Description of the equity indices analyzed.
We used the ESG score provided by Refinitiv to measure the level of CSR of each index. The ESG score is an overall rating whose value depends on the company performance in three dimensions (environmental, social, and governance). Although there is no consensus on the inclusion of the governance dimension in CSR [35,41], the FTSE4Good indices employ ESG criteria. Therefore, we argue that, for this study, the ESG score is the best proxy for analyzing the level of CSR of each index. The sample period of the analysis goes from January 2008 to December 2019.
Table 2 shows for each index type (conventional and sustainability) of each of the three families analyzed and for each of the 12 years examined: the monthly average number of constituents in the index (1); the monthly average number of constituents identified by Refinitiv (2); the monthly average number of constituents with scores (3); and the monthly average weight of the constituents with score in each index (4). Although the effect is negligible, for some months, our data provider does not have a company ID, such as ISIN or Datastream code, for all the constituents of the index. This is the reason of the differences in the values of columns 1 and 2 in Table 2. Hence, to calculate the sustainability share, we considered these companies without an identifier as a single company. Finally, to calculate the CSR level of the index, we joined each index constituent with its ESG score. As previously indicated, the average number of constituents with scores in each index is shown in column 3 of Table 2. Moreover, as shown in column 4, for almost every year, we have ESG score information for more than 95% of the index composition.
Table 2.
Descriptive statistics of the indices analyzed.
2.2. Methodology
We measured the similarity between the conventional and the sustainability indices of each FTSE family using the sustainability share, which was derived from the active share of Cremers and Petajisto [27]. While the active share measures the percentage of the fund holdings that is different from its benchmark, the sustainability share measures the percentage of the SR investment holding that is different from its conventional counterpart. Equation (1) allows us to calculate the sustainability share of each FTSE4Good index on a monthly basis:
where f denotes the FTSE family, t is the specific month, s denotes that the index is a FTSE4Good (a sustainability index), c denotes that the index is conventional, w is the weight of company i in a given month t, and N denotes the companies included in either of the two indices (sustainability and conventional).
Specifically, for each FTSE4Good index, we calculated two sustainability share measures: (1) the real sustainability share according to the weight of each company in the FTSE4Good index (SW) and (2) the sustainability share of a hypothetical FTSE4Good index (EW). Figure 1 shows the evolution of the sustainability share for each FTSE4Good index (SW and EW). Specifically, the current sustainability share showed a sharp decreasing trend, reaching values below 20% in the Europe family. In contrast, the second measure presented sustainability share values clearly higher than the first one, reaching values above 50% in the Europe family and above 60% in the remaining families. Hence, the effect of the EW index in the level of the sustainability share is evident.
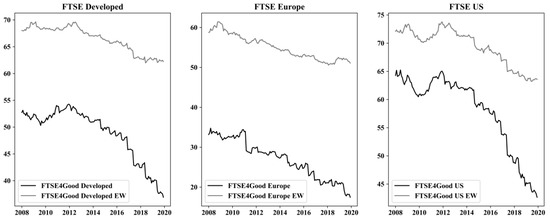
Figure 1.
Evolution of the sustainability share for the FTSE4Good indices. Evolution of the sustainability share from 2008 to 2019 for the 3 FTSE families analyzed, where the black line presents the evolution for the real FTSE4Good index (SW), and the grey line presents the evolution for a hypothetical FTSE4Good index (EW). SW, size-weighted; EW, equally weighted.
Our first hypotheses analyze the sustainability share of the FTSE4Good indices and how this measure depends on the index weighting criteria. Thus, using Equation (2), we tested the following hypotheses:
Hypothesis 1a.
The difference between conventional indices and their sustainability counterparts increases over time.
Hypothesis 1b.
The sustainability share is higher when FTSE4Good indices are EW rather than when they are SW.
Hypothesis 1c.
The difference between the sustainability shares of EW and SW FTSE4Good indices increases over time.
We measured the level of CSR of each index as the average of the ESG score of the companies in the index (EW score) and as the SW average of the ESG score of the companies in the index (SW score) following Equation (3):
where b denotes each benchmark (index) analyzed in the study, t is the specific month, i denotes the different companies included in the index, is the weight that company i represents in the index in month t and, is the ESG score of company i in month t.
Figure 2 shows the evolution of the ESG scores (EW and SW) for each index of each FTSE family. While the ESG score in the SW benchmarks is higher than in the EW pairs, we found a more pronounced increasing tendency in the ESG score of the EW indices. According to Figure 2, the CSR level in the sustainability indices was higher than in their respective counterparts, regardless of the method used to compute the scores.
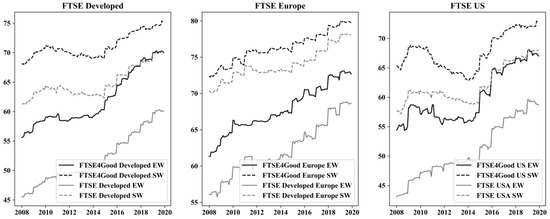
Figure 2.
Evolution of the environmental, social and governance (ESG) scores for the SW and EW FTSE indices of the three FTSE families analyzed.
Our second hypotheses analyze how the ESG score of the index depends on the weighting criteria. Thus, using Equation (4), we tested the following hypotheses:
Hypothesis 2a.
SW ESG scores are higher than EW ESG scores.
Hypothesis 2b.
The difference between SW ESG scores and EW ESG scores increases over time.
Our third hypotheses analyze for each FTSE family how the FTSE4Good label influences the level of CSR. Thus, using Equation (5), we tested the following hypotheses:
Hypothesis 3a.
FTSE4Good indices have higher SW and EW ESG scores than their conventional counterparts.
Hypothesis 3b.
The difference between the SW and the EW ESG scores of FTSE4Good indices and their conventional counterparts increases over time.
3. Results
3.1. Results Related to Hypothesis 1: Sustainability Share
Table 3 shows the coefficients and the standard error of parameters, in parentheses, of Equation (2) that allows us to test the hypotheses 1a, 1b, and 1c for the three sustainability indices. We performed a regression for each index family with 288 observations: 144 from the real FTSE4Good index (SW) and 144 from a hypothetical FTSE4Good index (EW). Table 3 shows negative and statistically significant coefficients for the Time variable of the three indices. This means that the sustainability share of the FTSE4Good indices decreased from 2008. Hence, we rejected hypothesis 1a, because each year the FTSE4Good indices were more similar to their conventional peers. In line with hypothesis 1b, our results also showed that if the FTSE4Good indices were EW rather than SW, the divergence from their conventional peer would be higher, as indicated by the positive and statistically significant coefficient of the EW dummy. Finally, as we suggest in hypothesis 1c, the difference between the sustainability share of EW and SW FTSE4Good indices increased over time. In other words, as indicated by the coefficient Time × EW, the convergence between sustainability and conventional indices was less accelerated in the case of the EW FTSE4Good indices. These results are also observed in Figure 1.
Table 3.
Differences in the evolution of the sustainability share between the SW FTSE4Good and the EW FTSE4Good indices.
3.2. Results Related to Hypothesis 2: SW and EW ESG Scores
Table 4 shows the coefficients and the standard errors of parameters, in parentheses, of Equation (4) that allows us to test hypotheses 2a and 2b for the six indices analyzed. The SW dummy of Table 4 shows that the SW ESG score is higher than the EW ESG score in all sustainability and conventional indices. This finding is in line with the studies that suggests a positive relation between size and ESG score and with the results of Joliet and Titova [42], who find that new inclusions in the portfolio holdings of passive management funds are not related to the ESG score of the company, but to an increase in the company size. However, the Time × SW coefficient shows that the difference between the two scores decreased in the period of analysis. To sum up, the findings of hypotheses 1 and 2 suggest that if sustainability indices are EW, they will be more different from their conventional counterparts at the cost of a loss in the level of CSR. However, this “penalization” in the level of CSR tends to decrease over time.
Table 4.
Differences in the evolution of the ESG score between the SW and the EW methods.
3.3. Results Related to Hypothesis 3: FTSE4Good Criteria
Table 5 shows the coefficients and the standard errors of parameters, in parentheses, of Equation (5). This equation allows us to test hypotheses 3a and 3b for the three FTSE families considering two measures of the CSR level, the SW ESG score and the EW ESG score. In line with hypothesis 3a, the 4Good dummy of Table 5 shows that the FTSE4Good indices had a higher CSR level than their conventional counterparts in both SW ESG score and EW ESG score. However, the Time × 4Good coefficient shows that the difference between the CSR levels of both indices did not increase, even if it tended to decrease, specifically for the FTSE US. Hence, we rejected hypothesis 3b, the difference between the CSR levels of conventional and sustainability indices did not increase over the period of the analysis.
Table 5.
Differences in the evolution of the ESG score between conventional and sustainability indices.
4. Discussion
Conventional and sustainability indices are becoming more and more similar over time, converting sustainability indices into mere copycats of their conventional counterparts. Hence, the studies that use the membership in a sustainability index as a proxy of high levels of CSR should be taken into account with caution. In the European case, for example, the sustainability share of the FTSE4Good Europe was only 15% in 2019. This convergence provokes that the analysis of sustainability indices is becoming less and less useful, since it is basically the analysis of their conventional counterparts. However, the literature continues comparing the financial performance of both types of indices and analyzing the determinants to be included in sustainability indices. This evidence of the increase in the level of similarity between conventional and sustainability indices supports the idea that SR and conventional passive investors are basically allocated in the same stocks with similar weights.
Our results also suggest that the level of CSR increases faster in conventional indices than in sustainability ones. This fact casts doubt on whether passive SR investors meet their non-financial utility. This study has important implications for passive SR investors, because they ultimately invest very similarly to conventional investors. Moreover, their investments in sustainability indices would not achieve a differential increase in the CSR level of the index compared to that achieved by conventional indices. These results put under review the use of the sustainability label as a method of differentiating sustainability indices from their conventional peers.
The fact that the difference between SR investment and conventional investment disappears raises a philosophical problem related to epistemology, called antinomy. From our point of view, the existence of sustainability necessarily requires the existence of unsustainability or conventional indices. Thus, it is important that index providers ensure the differentiation of sustainability indices from the conventional ones. However, other schools of thought, as Thomism philosophy, support that no action would be required because the existence of “good” does not require the existence of “evil”. Therefore, scholars and regulators should wonder whether the convergence between sustainability and conventional indices is positive, and therefore, the efforts of last decades towards the sustainable development are being rewarded. Conversely, if this convergence is negative, the methodology used by index providers to capture sustainability needs to be modified.
5. Conclusions
In this paper, we focused on analyzing to what extent sustainability indices differ from their conventional counterparts, and we investigated the implications of a hypothetical change in the weighting criteria for sustainability indices.
Our results firstly suggest that the sustainability share of sustainability indices considerably decreased over time. This evidence of the increase in the level of similarity between conventional and sustainability indices is mainly caused by the SW criterion that was applied to both types of indices. Secondly, we explored a change in the weighting criteria of sustainability indices from SW to EW. We showed that this change significantly increased the difference between sustainability and conventional indices, although, due to the relationship between CSR and size, this change would penalize the CSR level of the index. These results underline the crucial influence that company size has on both the sustainability share and the CSR level of sustainability indices. Finally, our results also suggest that sustainability indices have a higher level of CSR than their conventional counterparts. However, this difference decreased over time in some FTSE families.
Author Contributions
Conceptualization, J.L.S. and P.V.; methodology, L.A., J.L.S. and P.V.; validation, L.A.; formal analysis, P.V.; data curation, P.V.; writing—original draft preparation, P.V.; writing—review and editing, L.A.; supervision, L.A. and J.L.S. All authors have read and agreed to the published version of the manuscript.
Funding
This research was funded by the Spanish government and the European Union FEDER funds (RTI2018-093483-B-I00).
Conflicts of Interest
The authors declare no conflict of interest.
References
- Escrig-Olmedo, E.; Fernández-Izquierdo, Á.M.; Ferrero-Ferrero, I.; Rivera-Lirio, M.J.; Muñoz-Torres, J.M. Rating the raters: Evaluating how ESG rating agencies integrate sustainability principles. Sustainability 2019, 11, 915. [Google Scholar] [CrossRef] [Green Version]
- Doh, J.P.; Howton, S.D.; Howton, S.W.; Siegel, D.S. Does the market respond to an endorsement of social responsibility? The role of institutions, information, and legitimacy. J. Manag. 2010, 36, 1461–1485. [Google Scholar] [CrossRef] [Green Version]
- Kaspereit, T.; Lopatta, K. The value relevance of SAM’s corporate sustainability ranking and GRI sustainability reporting in the european stock markets. Bus. Ethics Eur. Rev. 2016, 25, 1–24. [Google Scholar] [CrossRef]
- Chatterji, A.K.; Mitchell, W. Do investors actually value sustainability? New evidence from investor reactions to the dow jones sustainability index (DJSI). Strateg. Manag. J. 2018, 39, 949–976. [Google Scholar] [CrossRef]
- Keskin, A.İ.; Dincer, B.; Dincer, C. Exploring the impact of sustainability on corporate financial performance using discriminant analysis. Sustainability 2020, 12, 2346. [Google Scholar] [CrossRef] [Green Version]
- Schröder, M. Is there a difference? The performance characteristics of SRI equity indices. J. Bus. Financ. Account. 2007, 34, 331–348. [Google Scholar] [CrossRef]
- Ortas, E.; Moneva, J.M.; Salvador, M. Do social and environmental screens influence ethical portfolio performance? Evidence from Europe. BRQ Bus. Res. Q. 2014, 17, 11–21. [Google Scholar] [CrossRef] [Green Version]
- Cunha, F.A.F.D.S.; de Oliveira, E.M.; Orsato, R.J.; Klotzle, M.C.; Cyrino Oliveira, F.L.; Caiado, R.G.G. Can sustainable investments outperform traditional benchmarks? Evidence from global stock markets. Bus. Strategy Environ. 2019, 29, 682–697. [Google Scholar] [CrossRef]
- Chiappini, H.; Vento, G.; De Palma, L. The impact of covid-19 lockdowns on sustainable indexes. Sustainability 2021, 13, 1846. [Google Scholar] [CrossRef]
- Barnett, M.L.; Henriques, I.; Husted, B.W. Beyond good intentions: Designing CSR initiatives for greater social impact. J. Manag. 2020, 46, 937–964. [Google Scholar] [CrossRef]
- Chatterji, A.; Levine, D. Breaking down the wall of codes: Evaluating non-financial performance measurement. Calif. Manag. Rev. 2006, 48, 29–51. [Google Scholar] [CrossRef] [Green Version]
- Petry, J.; Fichtner, J.; Heemskerk, E. Steering capital: The growing private authority of index providers in the age of passive asset management. Rev. Int. Political Econ. 2019, 28, 1–25. [Google Scholar] [CrossRef] [Green Version]
- Camilleri, M.A. The market for socially responsible investing: A review of the developments. Soc. Responsib. J. 2020. [Google Scholar] [CrossRef]
- Ziegler, A.; Schröder, M. What determines the inclusion in a sustainability stock index? A panel data analysis for European firms. Ecol. Econ. 2010, 69, 848–856. [Google Scholar] [CrossRef] [Green Version]
- Artiach, T.; Lee, D.; Nelson, D.; Walker, J. The determinants of corporate sustainability performance. Account. Financ. 2010, 50, 31–51. [Google Scholar] [CrossRef]
- Pineiro-Chousa, J.; Romero-Castro, N.; Vizcaíno-González, M. Inclusions in and exclusions from the S&P 500 environmental and socially responsible index: A fuzzy-set qualitative comparative analysis. Sustainability 2019, 11, 1211. [Google Scholar] [CrossRef] [Green Version]
- Ziegler, A. Is it beneficial to be included in a sustainability stock index? A panel data study for European firms. Environ. Resour. Econ. 2012, 52, 301–325. [Google Scholar] [CrossRef] [Green Version]
- Arribas, I.; Espinós-Vañó, M.D.; García, F.; Morales-Bañuelos, P.B. The inclusion of socially irresponsible companies in sustainable stock indices. Sustainability 2019, 11, 2047. [Google Scholar] [CrossRef] [Green Version]
- Arribas, I.; Espinós-Vañó, M.D.; García, F.; Riley, N. Do irresponsible corporate activities prevent membership in sustainable stock indices? The case of the dow jones sustainability index world. J. Clean. Prod. 2021, 298. [Google Scholar] [CrossRef]
- Belghitar, Y.; Clark, E.; Deshmukh, N. Does it pay to be ethical? Evidence from the FTSE4Good. J. Bank. Financ. 2014, 47, 54–62. [Google Scholar] [CrossRef] [Green Version]
- El Ouadghiri, I.; Guesmi, K.; Peillex, J.; Ziegler, A. Public attention to environmental issues and stock market returns. Ecol. Econ. 2021, 180. [Google Scholar] [CrossRef]
- Montoya-Cruz, E.; Ramos-Requena, J.P.; Trinidad-Segovia, J.E.; Sánchez-Granero, M.Á. Exploring arbitrage strategies in corporate social responsibility companies. Sustainability 2020, 12, 6293. [Google Scholar] [CrossRef]
- Oberndorfer, U.; Schmidt, P.; Wagner, M.; Ziegler, A. Does the stock market value the inclusion in a sustainability stock index? An event study analysis for German firms. J. Environ. Econ. Manag. 2013, 66, 497–509. [Google Scholar] [CrossRef] [Green Version]
- Kappou, K.; Oikonomou, I. Is there a gold social seal? The financial effects of additions to and deletions from social stock indices. J. Bus. Ethics 2016, 133, 533–552. [Google Scholar] [CrossRef]
- Gómez-Bezares, F.; Przychodzen, W.; Przychodzen, J. Bridging the gap: How sustainable development can help companies create shareholder value and improve financial performance. Bus. Ethics Eur. Rev. 2017, 26, 1–17. [Google Scholar] [CrossRef]
- Forcadell, F.J.; Aracil, E. European banks’ reputation for corporate social responsibility. Corp. Soc. Responsib. Environ. Manag. 2017, 24, 14–24. [Google Scholar] [CrossRef]
- Cremers, K.J.M.; Petajisto, A. How active is your fund manager? A new measure that predicts performance. Rev. Financ. Stud. 2009, 22, 3329–3365. [Google Scholar] [CrossRef]
- Sushko, V.; Turner, G. The Implications of Passive Investing for Securities Markets. BI Q. Rev. 2018, 113–131. Available online: https://ssrn.com/abstract=3139242 (accessed on 29 June 2021).
- US SIF. Report on US Sustainable, Responsible and Impact Investing Trends 2018. Available online: https://www.ussif.org/files/Trends/Trends%202018%20executive%20summary%20FINAL.pdf (accessed on 29 June 2021).
- EUROSIF. European SRI Study 2018. Available online: http://www.eurosif.org/wp-content/uploads/2018/11/European-SRI-2018-Study.pdf (accessed on 29 June 2021).
- Humphrey, J.E.; Lee, D.D.; Shen, Y. Does it cost to be sustainable? J. Corp. Financ. 2012, 18, 626–639. [Google Scholar] [CrossRef]
- Halbritter, G.; Dorfleitner, G. The wages of social responsibility—where are they? A critical review of ESG investing. Rev. Financ. Econ. 2015, 26, 25–35. [Google Scholar] [CrossRef]
- Yen, M.; Shiu, Y.; Wang, C. Socially responsible investment returns and news: Evidence from Asia. Corp. Soc. Responsib. Environ. Manag. 2019, 26, 1565–1578. [Google Scholar] [CrossRef]
- Ferrell, A.; Liang, H.; Renneboog, L. Socially responsible firms. J. Financ. Econ. 2016, 122, 585–606. [Google Scholar] [CrossRef] [Green Version]
- Liang, H.; Renneboog, L. On the foundations of corporate social responsibility. J. Financ. 2017, 72, 853–910. [Google Scholar] [CrossRef]
- Garcia, A.S.; Orsato, R.J. Testing the institutional difference hypothesis: A study about environmental, social, governance, and financial performance. Bus. Strategy Environ. 2020, 29, 3261–3272. [Google Scholar] [CrossRef]
- Drempetic, S.; Klein, C.; Zwergel, B. The influence of firm size on the ESG score: Corporate sustainability ratings under review. J. Bus. Ethics 2020, 167, 333–360. [Google Scholar] [CrossRef]
- Renneboog, L.; Ter Horst, J.; Zhang, C. Socially responsible investments: Institutional aspects, performance, and investor behavior. J. Bank. Financ. 2008, 32, 1723–1742. [Google Scholar] [CrossRef]
- Borgers, A.C.; Pownall, R.A. Attitudes towards socially and environmentally responsible investment. J. Behav. Exp. Financ. 2014, 1, 27–44. [Google Scholar] [CrossRef]
- Gutsche, G.; Ziegler, A. Which private investors are willing to pay for sustainable investments? Empirical evidence from stated choice experiments. J. Bank. Financ. 2019, 102, 193–214. [Google Scholar] [CrossRef]
- Krüger, P. Corporate goodness and shareholder wealth. J. Financ. Econ. 2015, 115, 304–329. [Google Scholar] [CrossRef]
- Joliet, R.; Titova, Y. Equity SRI funds vacillate between ethics and money: An analysis of the funds’ stock holding decisions. J. Bank. Financ. 2018, 97, 70–86. [Google Scholar] [CrossRef]

Publisher’s Note: MDPI stays neutral with regard to jurisdictional claims in published maps and institutional affiliations. |
© 2021 by the authors. Licensee MDPI, Basel, Switzerland. This article is an open access article distributed under the terms and conditions of the Creative Commons Attribution (CC BY) license (https://creativecommons.org/licenses/by/4.0/).