Abstract
Household harvesting of wild fish and game contributes to food security in indigenous communities across the Arctic, and in some regions plays an important role in cultural identity of indigenous peoples. The degree to which the state regulates harvesting and restricts distribution of country foods varies widely, however, and this intervention in local economies can affect livelihood opportunities. The paper hypothesizes that where state policy has contributed to harvesting remaining a culturally embedded livelihood strategy, its contribution to the quality of life may influence people to remain in rural communities, despite potentially lower material living standards. Lacking such a cultural linkage, harvesting may become the employer of last resort for people unable to find paying jobs or leave declining communities for a better life elsewhere. The paper examines the association between Survey of Living Conditions in the Arctic (SLiCA) respondents’ intent to remain in their community of residence and household harvesting, cash income from work, and other relevant factors. The results include both similarities and differences for residents of arctic Alaska, arctic Canada, Greenland, and Chukotka. Systematic differences found appear consistent with the hypothesis about the role of household harvesting and state policy toward harvest and distribution of country foods.
1. Introduction
Household harvesting of wild fish and game contributes to food security in communities across the Arctic, and plays an important role in cultural identity of many Indigenous peoples [1,2,3,4,5]. The degree to which national and regional governments regulate harvesting and restrict distribution of country foods varies widely, however. In Greenland, for example, harvest managed by the Inuit majority Home Rule government often enters active local and regional markets that distribute wild foods in an apparently seamless continuum between subsistence harvesting and commercial production [6]. Indigenous harvests in Alaska, on the other hand, take place in a decades-old context of contested harvest rights and tight restrictions on market distribution of products [7,8].
Might the effects on local livelihood strategies of these national differences in policy toward harvest and distribution of wild foods be sufficient to affect arctic residents’ attitudes about remaining in small rural communities? If so, they could influence migration decisions, with consequences for population change and community sustainability. The effects of government policies on household harvesting and population movements are likely to be subtle and complex. Addressing effects on mobility, therefore, requires a theoretical framework, as well as data and a statistical approach that can isolate the role of harvesting from other important determinants of attachment to place and associated migration decisions.
The Survey of Living conditions in the Arctic (SLiCA), an international survey of arctic Indigenous households [9], offers a unique empirical opportunity to analyze national similarities and differences in harvesting and migration. This paper develops a model of how state regulation of rural arctic livelihoods could affect migration decisions, and applies the model in a statistical analysis of SliCA data from arctic Alaska, arctic Canada, Greenland, and Chukotka, Russia. It starts with a model of migration as an indicator of place-based well-being. The model becomes a framework for analyzing the role of harvesting in place-based well-being and migration, and effects of state regulation. Then, the paper summarizes data available from SliCA on traditional livelihoods, discussing how one may use the survey data to analyze effects of harvest participation and policies on migration decisions. Next, it presents results of a multivariate statistical analysis associating SLiCA respondents’ intent to remain in their community of residence with opportunities for household harvesting, cash income from work, and other relevant factors. That pattern of results for migration intent among residents of arctic Alaska, arctic Canada, Greenland, and Chukotka appears to align with historical policies toward harvest and distribution rights in these regions.
2. Background
At various times during the early to mid-twentieth century, Indigenous peoples around the Arctic were forced into fixed settlements, disrupting previously semi-nomadic livelihoods built around seasonal foraging and reindeer herding cycles. Residents of all arctic nations are now generally free to move among communities within national borders, and government-sponsored infrastructure and social programs as well as industrial development have created new livelihood opportunities. Understanding the effects of contemporary state policy on mobility of arctic residents requires that we understand the determinants of voluntary moves.
Voluntary decisions to move may result from a complex process that balances livelihood opportunities with an array of place-specific factors related to the quality of life, including public services and infrastructure, local family and social ties, and attachment to homes and landscapes [10]. Migration is, therefore, closely related to place-based well-being; in fact, it can be an indicator of place-based well-being [11].
Figure 1 illustrates how well-being attainable from residing in a place depends on individual and household characteristics such as age, education, and family and social ties, as well as place characteristics such as job opportunities, public safety, and environmental amenities. Information about opportunities and amenities available in other places enables people to project well-being potentially attainable from moving there. The decision to move involves weighing the gain in well-being from residing in a different place against the cost of moving there, which, as Figure 1 shows, is also influenced by household characteristics.
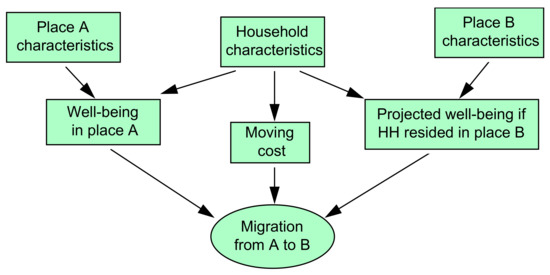
Figure 1.
Migration as an Indicator of Relative Well-Being at the Community Level. Characteristics of places such as livelihood opportunities and amenities determine well-being, along with household and individual characteristics. Well-being potentially available from residing in one place compared to another is typically not observed directly, but may be inferred from information about moving costs and migration choices [11].
The factors that determine well-being in different places may vary among individuals, as influenced by local social and cultural beliefs and practices. Amenities provided by the built and natural environments play a role, to the extent that they influence the perceived quality of life experienced from residing in a particular community. Among all potential determinants, however, livelihood opportunities clearly take center stage for many [12].
Despite settlement into villages, arctic Indigenous peoples continue active participation in traditional livelihoods based on hunting, fishing, and reindeer herding [13]. However, the transition from semi-nomadic life to settled life has meant that foragers and herders now rely on modern technologies to access traditional use areas from settlements [14]. Far more than simply a productive activity, these traditional arctic livelihoods encompass an entire socio-economic system of harvesting, processing, distribution, consumption, and transmission of knowledge, relying on household production [15,16,17,18,19].
Modern technologies as well as consumer goods require cash incomes, so traditional livelihoods now support mixed economies with cash inputs and both non-market and market distribution of outputs to others outside the household [13,15,20]. Cash incomes are typically derived from wage-earning activities and government transfer payments, although sales of food and other products of traditional livelihoods provide additional cash income in some cases. The opportunity to engage in these traditional livelihoods is still linked to identity in the contemporary mixed economy, and may be an important component of place-based well-being to many arctic residents [20,21].
State policy strongly affects the determinants of place-based well-being illustrated in Figure 1 in many different ways. In addition to transfer incomes, government provides community infrastructure, education and other local public services such as healthcare and public safety either by funding it directly, or through grants to local governments and non-governmental organizations. Provisioning of these services creates opportunities for wage employment as well as improvements to the quality of life in the community. A large fraction of earnings in most arctic communities is derived from government spending [22,23,24]. Additional government support for the cash economy comes through subsidies and cross-subsidized (“postage-stamp”) rates for transportation, energy, telecommunications, and other privately provided services. Government subsidies for mass transportation and for transportation infrastructure such as roads and airports also affect moving costs.
While effects of government spending on well-being in arctic communities are transparent, state policy may have a less obvious but potentially profound effect on place-based well-being through regulation of private activities. Environmental regulations may require resource development projects to mitigate effects on local renewable resources and ensure reasonable access to use areas for locals pursuing traditional livelihoods on the land. Fish and wildlife management regulations may restrict who may harvest how much of different species at different times of the year. Additional commercial use and public health regulations may restrict who may distribute what products to whom under what circumstances. All these various regulations may be subject to discretionary interpretation and variable enforcement, with the possibility of shadow harvesting and distribution in an informal and potentially underground economy.
Government policies and institutions that limit access to lands and rights to resources could be described as the political ecology of traditional livelihoods. Policies and institutions that regulate distribution of traditional livelihood products may be considered aspects of the political economy of those livelihoods. The political ecology of subsistence activities is well-known [1,3]. The corresponding political economy is less well understood. Both may mobilize political organizing and indirectly reinforce the role of traditional livelihoods in Indigenous peoples’ identity. Environmental and commercial regulations may affect reindeer herding as well as hunting and fishing-based traditional economies, particularly in western Siberia and the European Arctic [25]. However, Eurasian data from SLiCA available for the current study are limited to Chukotka, Russia, an area where herding had largely been abandoned at the time the survey was conducted there. Consequently, this paper focuses on effects on mobility of the political ecology and political economy of arctic hunting and fishing livelihoods.
In rural Alaska, both political ecology and political economy of fish and wildlife harvests have long been contested. Unlike Greenland and arctic Canada, outside the Yukon, a large and growing population of urban sport hunters since World War II has put increasing pressure on resources. When Alaska achieved statehood in 1959, equal access to fish and wildlife resources was entrenched in the state constitution, effectively prohibiting the state government from protecting Indigenous subsistence livelihoods against settler encroachment [26] (pp. 130–131). The U.S. Congress further set the stage for conflict by leaving aboriginal harvest rights out of the 1971 Alaska Native Land Claims Settlement Act (ANCSA) [27]. The US Supreme Court later interpreted ANCSA as having extinguished aboriginal rights in Alaska [7,8,28], but not before Alaska Native interests persuaded Congress to provide a partial remedy by guaranteeing subsistence harvest rights for rural residents on federal lands in the Alaska National Interest Lands Conservation Act (ANILCA) [29]. Given the contradiction with the state constitution, this clause led to a situation whereby the federal government protects a rural preference on some lands while the state government prohibits it on other lands.
Alaska state law generally prohibits sale of wild game other than furbearers and requires a commercial license for sales of fish. The state’s Limited Entry program, adopted by constitutional amendment in 1976, placed a potentially costly barrier to access to markets for many rural salmon fishermen accustomed to selling subsistence harvest surpluses [20]. Harvests of marine mammals, on the other hand, are covered by the Marine Mammal Protection Act (MMPA) [30], which permits Indigenous taking of animals that are otherwise protected under co-management regimes, and allows market sales among Alaska Natives but not between Natives and non-Natives [31]. History, therefore, presents a convoluted regulatory landscape to Alaska Native residents wishing to continue engaging in traditional livelihoods, while continuing conflicts remind aboriginal residents of the tenuous nature of their rights.
In Canada, potential conflict between resource development and subsistence livelihoods [32], as well as an intent to avoid the conflicts observed in neighboring Alaska, led Indigenous groups to negotiate access and harvest rights as part of land claims agreements [33]. Consequently, the level of conflict over subsistence rights is low relative to Alaska. Nevertheless, the relatively recent conclusion of the land claims settlement process—the last Inuit lands agreement (Nunatsiavut)—took effect at the end of 2005 and engenders among Canadian arctic Indigenous people a similar sensibility about the importance of vigilance to protect these rights. Canadian law generally permits sales of wildlife products. However, the volume of long-distance distribution is low, driven by the remoteness of the arctic lands from population centers. A large survey found commercial sales largely limited to caribou, musk ox, and arctic char [34].
Across the Bering Strait from Alaska, the demise of the Soviet planned economy brought an end to subsidies for remote arctic regions. This turn of events still hangs heavily over residents of the Chukotka region of Russia. Indigenous residents who had continued traditional reindeer herding after being forced to settle in communities lost their livelihoods along with access to their herds, after state farms could no longer support helicopter transportation. Many of the non-Indigenous residents who had been lured to the region by wage premiums and subsidies for energy, housing, and food left as the subsidies propping up the local wage economy evaporated. Those that stayed were often too poor to leave, facing not only a scarcity of jobs but issues with basic food security, leading many to turn to wild food for sustenance. In this context, Indigenous residents retaining household harvesting knowledge and skills had somewhat of an advantage, a turnaround in social status from Soviet times [35]. Despite possible elevation in regard locally, Chukotka Indigenous people have gained no effective political rights [36]. Harvest is nominally regulated by the state, although the state has limited enforcement capacity. Markets, while generally unregulated, realize low prices for most wildlife products, due to low local purchasing power and remoteness from larger population centers (K. Klokov, personal communication, 31 October 2009).
Greenland stands in contrast to the contested history in North America. As a trading culture rather than a frontier settler culture, Denmark tightly restricted entry to Greenland until after the Second World War, and non-Indigenous people remained a minority as Greenland moved progressively toward autonomy [37]. The relatively low population density limited competition for wildlife resources after the end of commercial whaling, and Greenland’s remoteness and limited agricultural potential encouraged local and regional markets for wild foods to flourish as the population grew in larger communities. Subsistence and artisanal commercial fishing for local markets coexists with industrial-scale fishing developed for export markets [6]. Thus, household harvesting of local renewable resources continues to provide a basic source of food for all Greenlanders, providing a significant source of income for residents of small communities. Regulation by the Inuit-dominated Home Rule government has ensured that conflicts over harvest or distribution rights for those wishing to maintain traditional livelihoods remain at a low level compared to North American counterparts.
On the other hand, Greenlanders’ rising political aspirations for a modern nation-state have been accompanied by a waning interest in pursuing traditional culture and associated livelihoods as an expression of Greenlandic identity. Dahl [38] described the changing discourse since the formalizing in August 2009 of a self-rule agreement with Denmark as “... a remarkable transformation in the notion of identity from one based on tradition, culture and ethnicity to one rooted in a political discourse with Greenland as a nation.” [10] (p. 125). One practical consequence of the changing cultural and political climate is abandonment of the policy of price harmonization across communities, which effectively subsidized small remote settlements at the expense of larger towns. This raises doubt as to whether small settlements and the traditional livelihoods they support can continue [6].
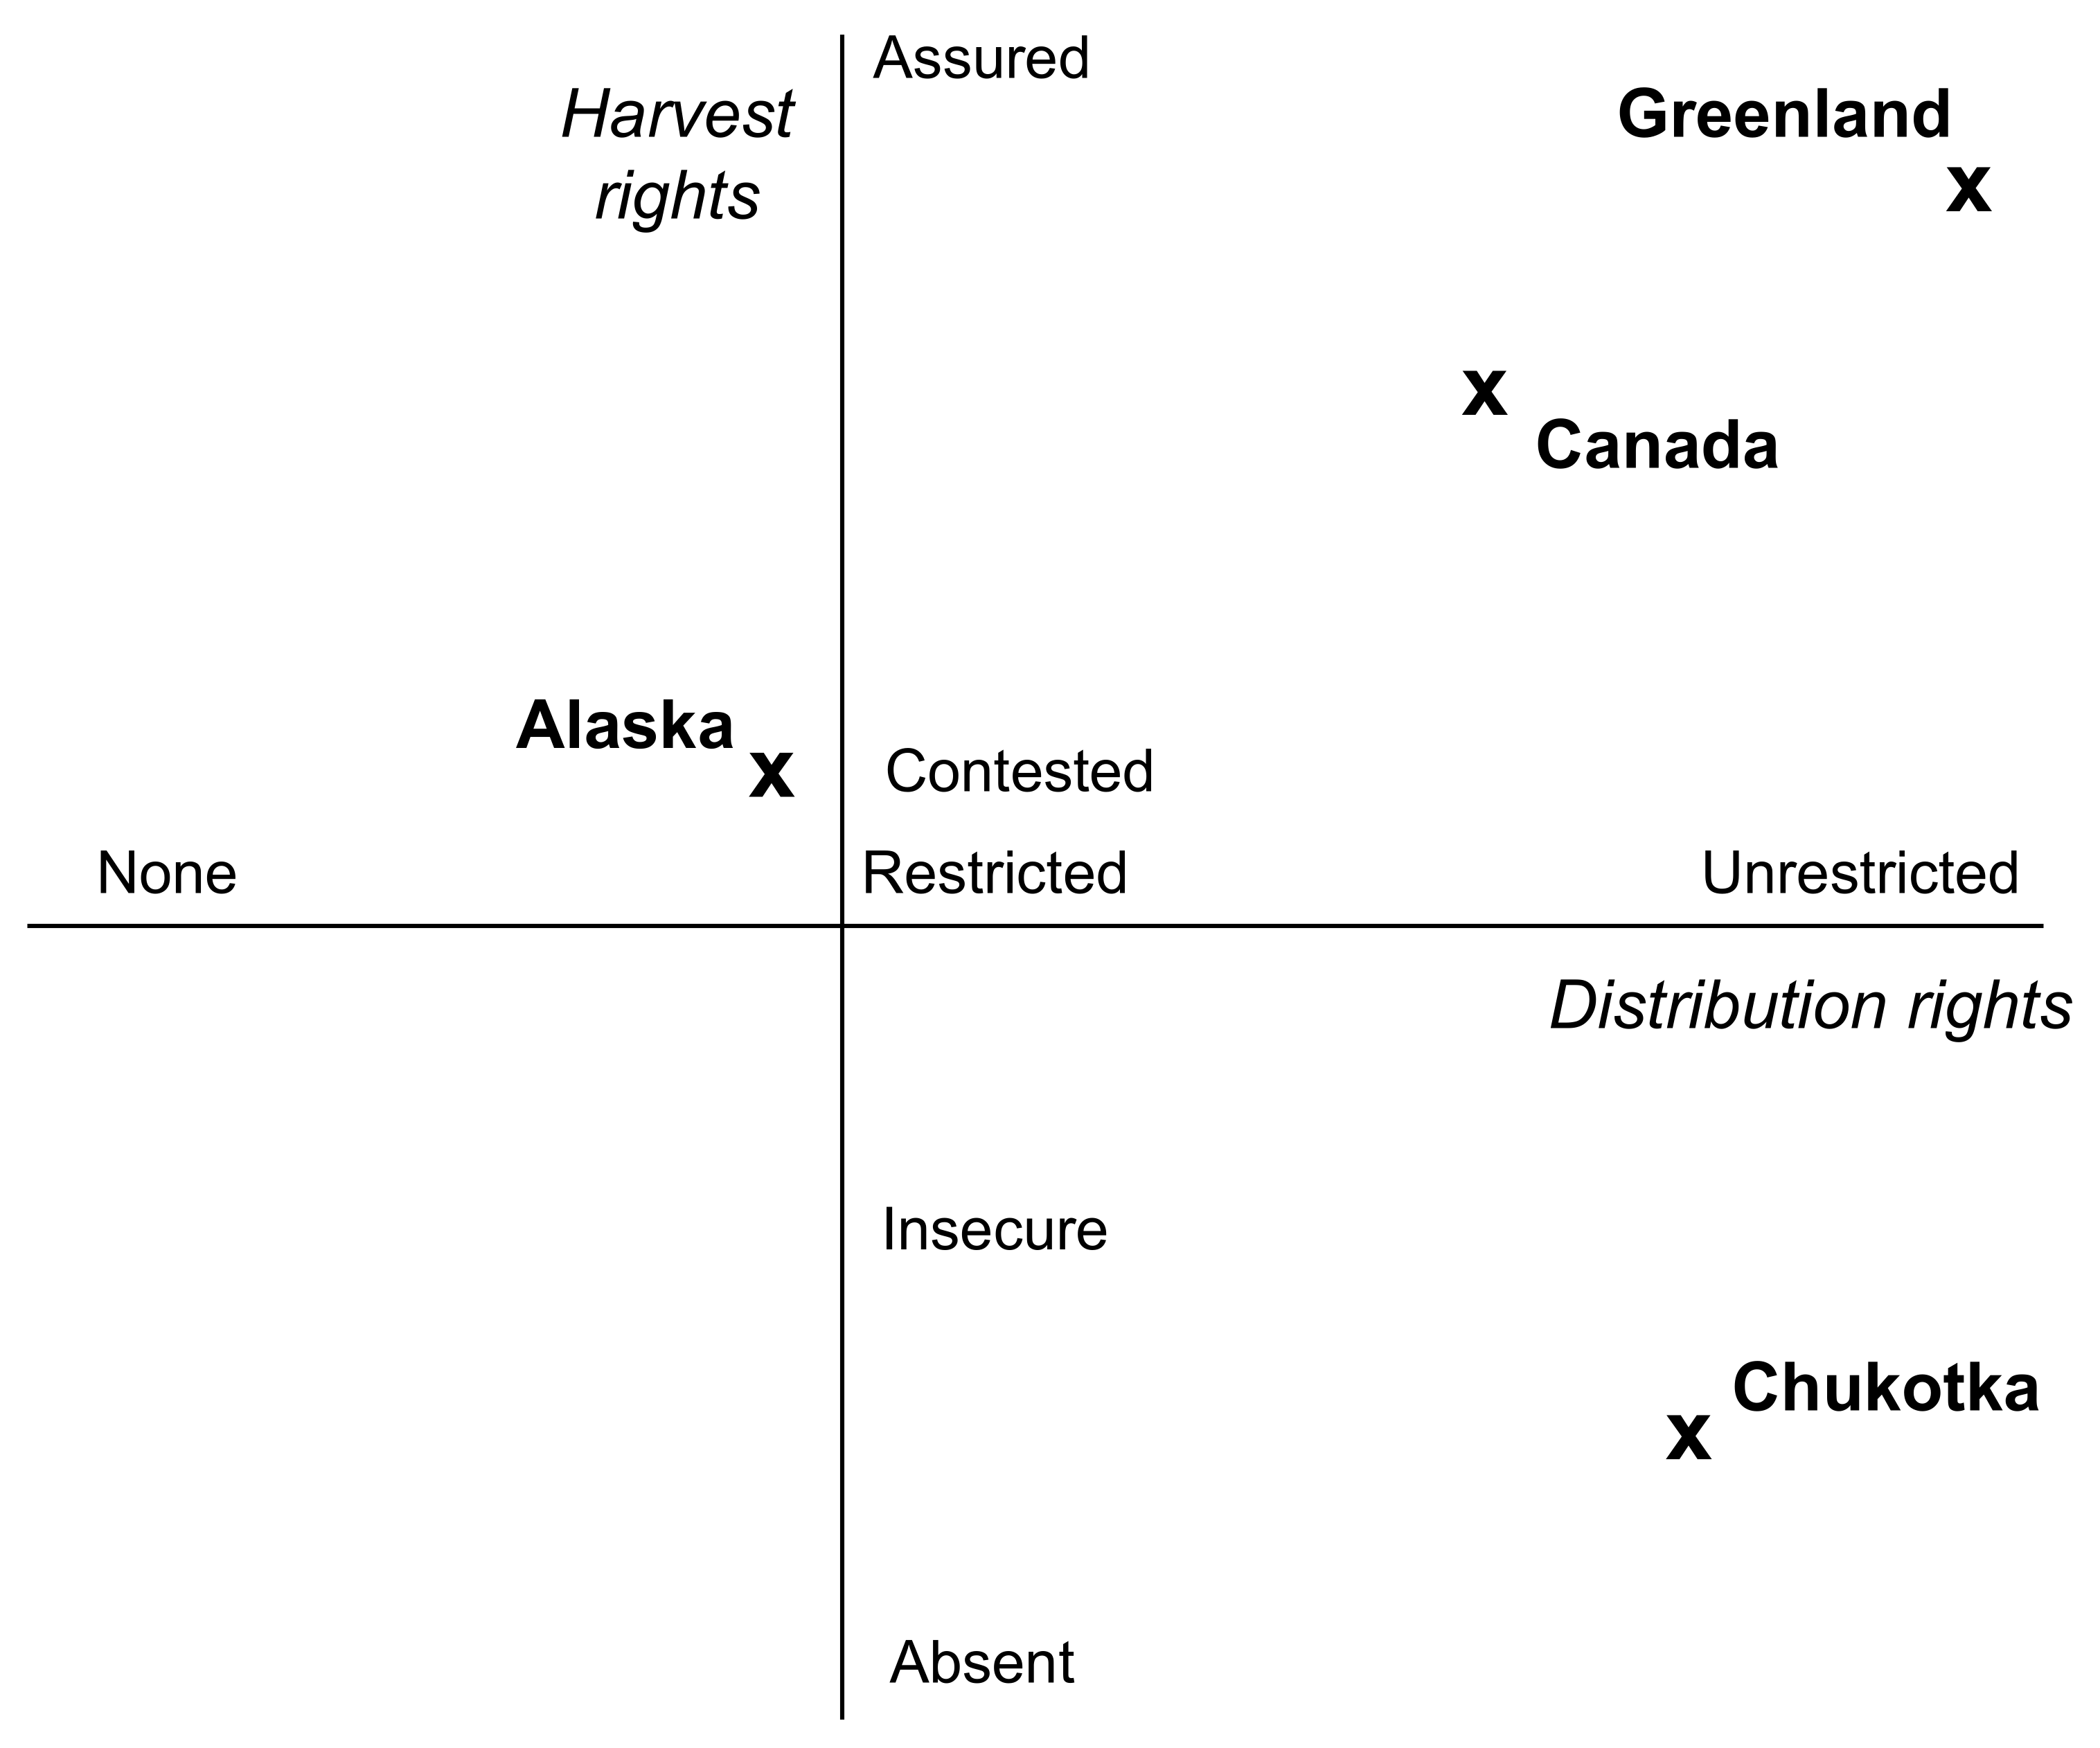
Figure 2 summarizes the comparative political ecology and political economy of Indigenous harvesting among the four arctic regions. The vertical axis represents the political ecology of harvesting, showing rights over land use and harvest by level of security, which ranges from absent to insecure to contested to assured. The horizontal axis represents rights to distribute products of traditional harvests: the political economy of harvesting. These rights range from none (distribution beyond the harvesting household prohibited) to restricted to unrestricted. The figure shows Alaska in the middle (contested and insecure), with Greenland the most secure and unrestricted. Harvest rights in Canada are less restricted than in Alaska but not as free as for Greenlanders. Chukotka differs from the others by its relative lack of security for Indigenous land use and harvest rights.

Figure 2.
Political Ecology vs. Political Economy of Household Production of Country Foods: Comparison of Four Arctic Regions. Rights over land use and harvest range from assured to absent, with contested and insecure serving as intermediate levels of security. Rights to distribute products of traditional harvests range from unrestricted to none (distribution prohibited beyond the harvesting household), with restricted rights serving as an intermediate category.
The different histories of Indigenous peoples’ relations with the state regarding traditional livelihoods raise several research questions on the effects of state policy on arctic community dynamics. First, what role does subsistence harvesting play relative to wage employment and other factors in motivating arctic Indigenous people to stay or move from their communities? Second, what individual, household, and community characteristics are associated with success in subsistence harvesting and cash earnings, and to what extent do similarities and differences emerge regarding the effects of local economies and other influences on migration in different nations and regions of the Arctic? Finally, to what extent can the observed similarities and differences be associated with different state policies affecting local economies, aspirations for autonomy of Indigenous peoples, and state responses?
State policy, therefore, may support or undermine a distinction between culturally embedded harvesting and market-oriented production. We hypothesize that where state policy has contributed to harvesting remaining a culturally embedded livelihood strategy, its contribution to the quality of life may influence people to remain in rural communities, despite potentially lower material living standards. Lacking such a cultural linkage, harvesting may become the employer of last resort for people unable to find paying jobs or leave declining communities for a better life elsewhere. The following sections attempt to test the hypothesis using data from household records from the Survey of Living Conditions in the Arctic (SLiCA) for arctic Alaska, arctic Canada, Greenland, and Chukotka. After discussing the advantages and limitations of SLiCA, the analysis examines the statistical association between respondents’ intent to remain in their community of residence and household harvesting, cash income from work, and other relevant factors.
3. Survey of Living Conditions in the Arctic (SLiCA)
SLiCA was a household survey of living conditions among Indigenous residents of arctic communities. Designed by an international team of scientists and arctic Indigenous residents, the survey intended to assess the status of traditional household-based livelihoods and well-being around the Circumpolar Arctic [9,13,17]. Survey data were collected in all nations with arctic Indigenous minority population, with samples large and robust for statistical analysis obtained between 2001 and 2004 from Alaska (663 households), Canada (4735 households), Greenland (1062 households), and Chukotka (520 households). SliCA surveys were also conducted in Sami areas of Norway, Sweden, and Finland; however, data from these nations are not included here due to the differences between the largely commercial traditional Sami reindeer herding livelihood and the mixed cash-subsistence foraging livelihoods of Inuit peoples. While the SLiCA survey instrument varied somewhat among nations, a core questionnaire asked similar questions about livelihoods and mobility in all countries. In all countries except Canada, SLiCA was conducted privately, financed by research grants. In Canada, Statistics Canada fielded SLiCA as an addendum to the 2001 Aboriginal Peoples Survey, trading off a somewhat reduced questionnaire in exchange for a large sample of households.
SLiCA data have a number of advantages for testing hypotheses about the role of livelihood activities in household mobility decisions. The household data contain some information on activities of all household members, not just the survey respondent. Several different questions were asked on subsistence activities, wage work, and mobility. The large sample contains significant geographic variation for identifying place determinants of livelihood and mobility choices—at least twenty communities sampled in each country—as well as international differences. Questions on health status and disability (except in Canada), and questions on perceived quality of life factors provide additional information on household, individual, and place determinants of well-being. Another important factor is the overwhelmingly Inuit ethnicity of respondents, along with a few Yupik residents in Alaska and several ethnic groups among small peoples of the North in Chukotka. The common Inuit cultural heritage of the population reduces likelihood that differences among nations reflect ethnic differences rather than differences in national livelihood opportunities and policies.
Limitations of SLiCA data are more of a practical character. Subsistence harvest success is available only in four categories (none, less than half, half, more than half of household meat and fish), while Canada data contain information on participation and consumption, but not harvest. Only limited information on work time—full-time work, part-time work, not working—was collected for household members other than the respondent, and income from work is available only for the household as a whole. Consequently, it is not possible to calculate an accurate measure of subsistence productivity (harvest per unit of time) from the ratio of two categorical variables, or even a reliable hourly wage rate. Measures of human capital in the form of educational attainment and acquisition of traditional skills are available for the respondent but not for other household adults.
Perhaps the most important limitation of SLiCA is that respondents are asked about changing their community of permanent residence, other than lifetime mobility, only as whether they have “considered moving away within past five years?” As a measure of migration intent—specific thoughts about leaving one’s community of residence—answers to this question do not indicate a specific plan or decision to move, or identify individuals who have recently moved. However, De Jong [39] found it a strong determinant of future mobility, while Manski [40] found consistency of intentions to move and actual moves. In reviewing the earlier literature on attitude-behavioral relations, Ajzen and Fishbein [41] found that the more closely any type of attitudinal question matched the specific behavioral response, the higher the correlation between attitudes and behavior. At the least, the response to the SLiCA question on migration intent represents a subtle but powerful indicator of place-based well-being and satisfaction with living conditions: that is, it indicates attachment to place.
Results from SLiCA show broad similarities in livelihood strategies, material well-being, and migration intent among the four countries, although there are some notable differences. Table 1 shows that household participation in traditional economies was high in all regions [39]. Alaska has the highest level of participation, with 61 percent of households reporting that more than half of meat and fish consumed came from local harvests. Thirty-six percent of Alaska respondents reported that members of their own household harvested more than half of meat and fish consumed. Chukotka households had the lowest participation, with 28 percent of households reporting more than half of meat and fish consumption derived from local traditional foods and 17 percent reporting that household members harvested more than half of all meat and fish consumed. Canada, where information on production was not reported, and Greenland lay in the middle, with about 40 percent reporting that local traditional foods provided more than half of meat and fish consumed.

Table 1.
Harvests, Earnings, Livelihood Preferences, and Migration Intent for Indigenous People in Four Arctic Regions: Results from the Survey of Living Conditions in the Arctic (SLiCA).
Cash earnings from wage work summarized in Table 1 were relatively high and fairly similar across Alaska, Canada, and Greenland. Somewhat higher living costs in Greenland, not reflected in the figures, approximately cancel out the apparently higher incomes. Relative poverty in Chukotka offers a striking contrast to other arctic regions. When SLiCA respondents were asked if they would prefer to make a living in traditional harvesting or herding activities or in wage jobs if both were available, more than half in Greenland and four out of ten in Chukotka said they preferred wage jobs. About 30 percent in each of the two regions preferred traditional livelihoods. Alaska offered a strong contrast: more than three out of four expressed a preference for a livelihood involving both harvesting and at least part-time or seasonal wage employment.
Table 1 also shows that more than one-fourth of respondents in each region had considered moving away from their community within the past five years. Migration intent was highest in Alaska (44 percent) and lowest in Canada (28 percent), with Chukotka and Greenland in between. Except for the comparison of Greenland to Chukotka, these regional disparities reflect statistically significant differences. Gender differences are not shown in the table, but Poppel et al. [42] (p. 110) noted that women were from two to ten percent more likely than men to express an interest in moving. These migration intent results from SLiCA are three to four times higher than actual mobility rates reported in census data, perhaps reflecting the discouraging effect of high moving costs from these remote communities. When asked an open-ended question about reasons for staying in their community, 23 percent of Alaska respondents mentioned subsistence as a reason for staying, while only 10 percent mentioned it in Canada [42] (p. 110). The question was not asked in the other countries.
The summary results suggest that there may be important differences among Indigenous people in the four arctic regions in the role of traditional and modern livelihoods in well-being. The next sections discuss methods and results of a statistical analysis of the effects of harvest participation and policies on migration decisions, following the general migration model of Figure 1.
4. Statistical Methods
The multivariate statistical analysis associates SLiCA respondents’ intent to remain in their community of residence with opportunities for household harvesting, cash income from work, and other relevant factors. Specifically, the model assumes, following [40], that expectations for attaining valued goals in the home vs. alternative locations along with family characteristics predict intention to move, which in turn predicts subsequent migration decisions.
Testing whether international differences in state policy affect migration intent follows a two-stage process. The first step is to estimate equations predicting household subsistence harvests and household earnings from individual, household and place characteristics. In the second step, predicted harvest and earnings, along with household and individual characteristics and indicators of moving costs predict the probability that a person will have recently considered moving from the community: an indicator of place-specific well-being.
In addition to individual and household data from SLiCA, the 2000 U.S. Census, 2001 Canada Census, 2003 Russia Census, Statistics Greenland, and other published sources provided characteristics of places relevant to traditional and modern livelihoods. Main individual characteristics hypothesized to determine earnings include age, gender, and education level. Subsistence skills represent an index of different traditional skills the respondent learned as a child, hypothesized to increase household subsistence harvests. Disability might adversely affect both subsistence and earnings, while the social support offered by strong family ties—represented here by an index of subjective SLiCA questions—may positively affect them both. Household characteristics available from SLiCA include the number of adults by gender, number of teens, elders, children under sixteen and children under five in the household, whether an Indigenous language was used at home, and whether the household included a non-Indigenous member. Households with more adults may more have more flexibility to allocate time to subsistence, wage work, and childcare. Households speaking the Indigenous language at home and households with children may have more interest in maintaining harvesting traditions. Households with more children and elders may be less mobile, while younger respondents may be more mobile, other things equal.
Appendix A contains additional details about the variables, statistical procedures, and the complete set of statistical results.
5. Results
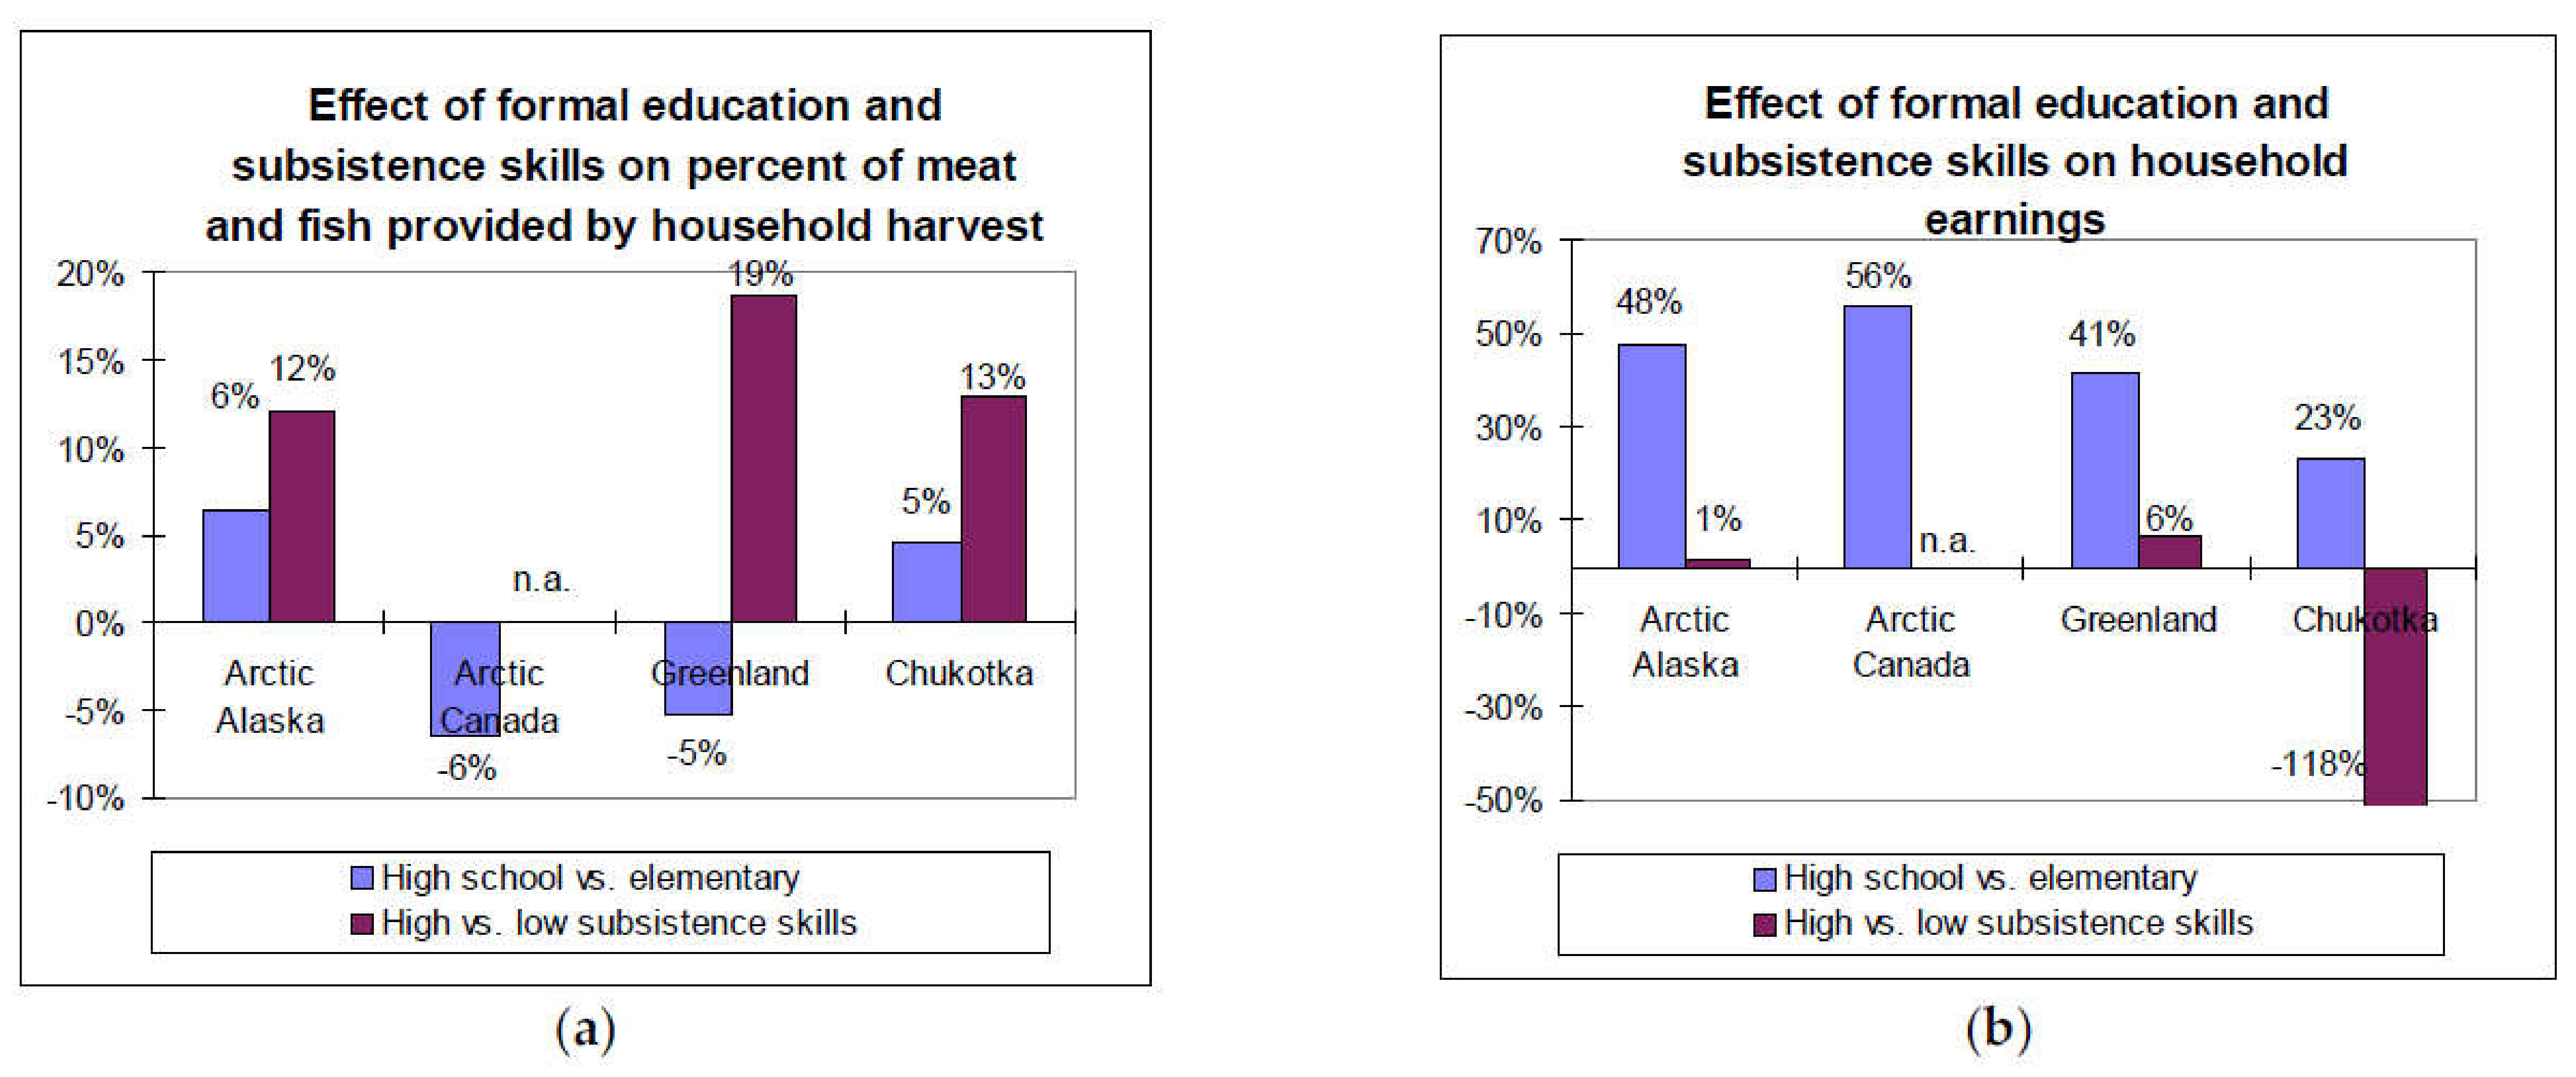
As expected, individual characteristics representing human capital are strongly associated with household success in both traditional and modern livelihoods. Figure 3 displays the magnitude of the effects of subsistence skills and formal education. Being taught subsistence skills as a child contributes significantly to harvest success in all countries where it is available. Formal education makes the biggest contribution to average household earnings of all factors. Figure 3b shows that having one adult (respondent) in the household with a high school degree instead of an elementary education increases household earnings by over 40 percent in all regions except Chukotka, where the effect is still a robust 23 percent. Interestingly, a household with a respondent with high subsistence skills earn much less in Chukotka, other things equal, perhaps reflecting the devastating effect of the loss of subsidies to state farms in the region.
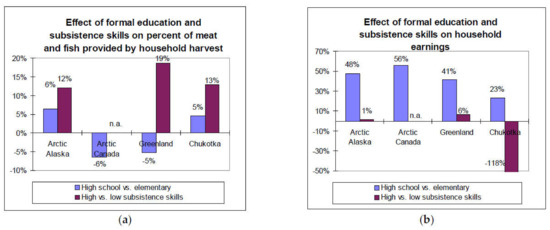
Figure 3.
Determinants of Participation: Human Capital. Bars represent the estimated percentage change in the amount of meat and fish provided by one’s own household harvest (a), or total household earnings (b), associated with differences in educational attainment and subsistence skills. Source: calculated from Appendix A Table A1, Table A2 and Table A3.
Characteristics representing social capital have mixed effects on livelihood success. Figure 4 shows that earnings in households whose respondents reported strong family ties are higher in Alaska and Greenland, perhaps reflecting the importance of family connections in obtaining high-paying jobs. Use of an Indigenous language at home—signaling ease of transfer of traditional knowledge—appears favorable to harvest success in all regions except Greenland, where there are few households that do not use the Greenlandic language. Use of Native language at home is unfavorable for earnings in all regions except Alaska. In addition to the effects of human and social capital on livelihood success summarized in Figure 3 and Figure 4, certain demographic characteristics also have significant effects on livelihood success, as expected. The effect of age on harvests and earnings differs widely among regions. In general, both harvests and earnings increase with age up to a point, then decline. The age curve shows the sharpest rise and decline of earnings in Greenland, while there appears to be no significant age effect on harvest in Chukotka. Effects of differing household configurations appear to have differing effects in different countries, which are difficult to explain.
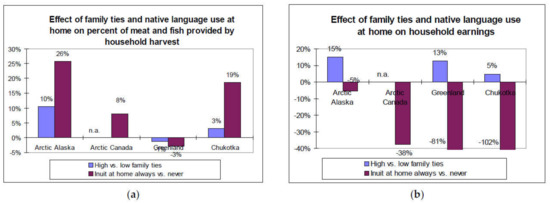
Figure 4.
Determinants of Participation: Social Capital. Bars represent the estimated percentage change in the amount of meat and fish provided by one’s own household harvest (a), or total household earnings (b), associated with strong vs. weak family ties and whether or not Inuit language always vs. never spoken at home. Source: calculated from Appendix A Table A1, Table A2 and Table A3.
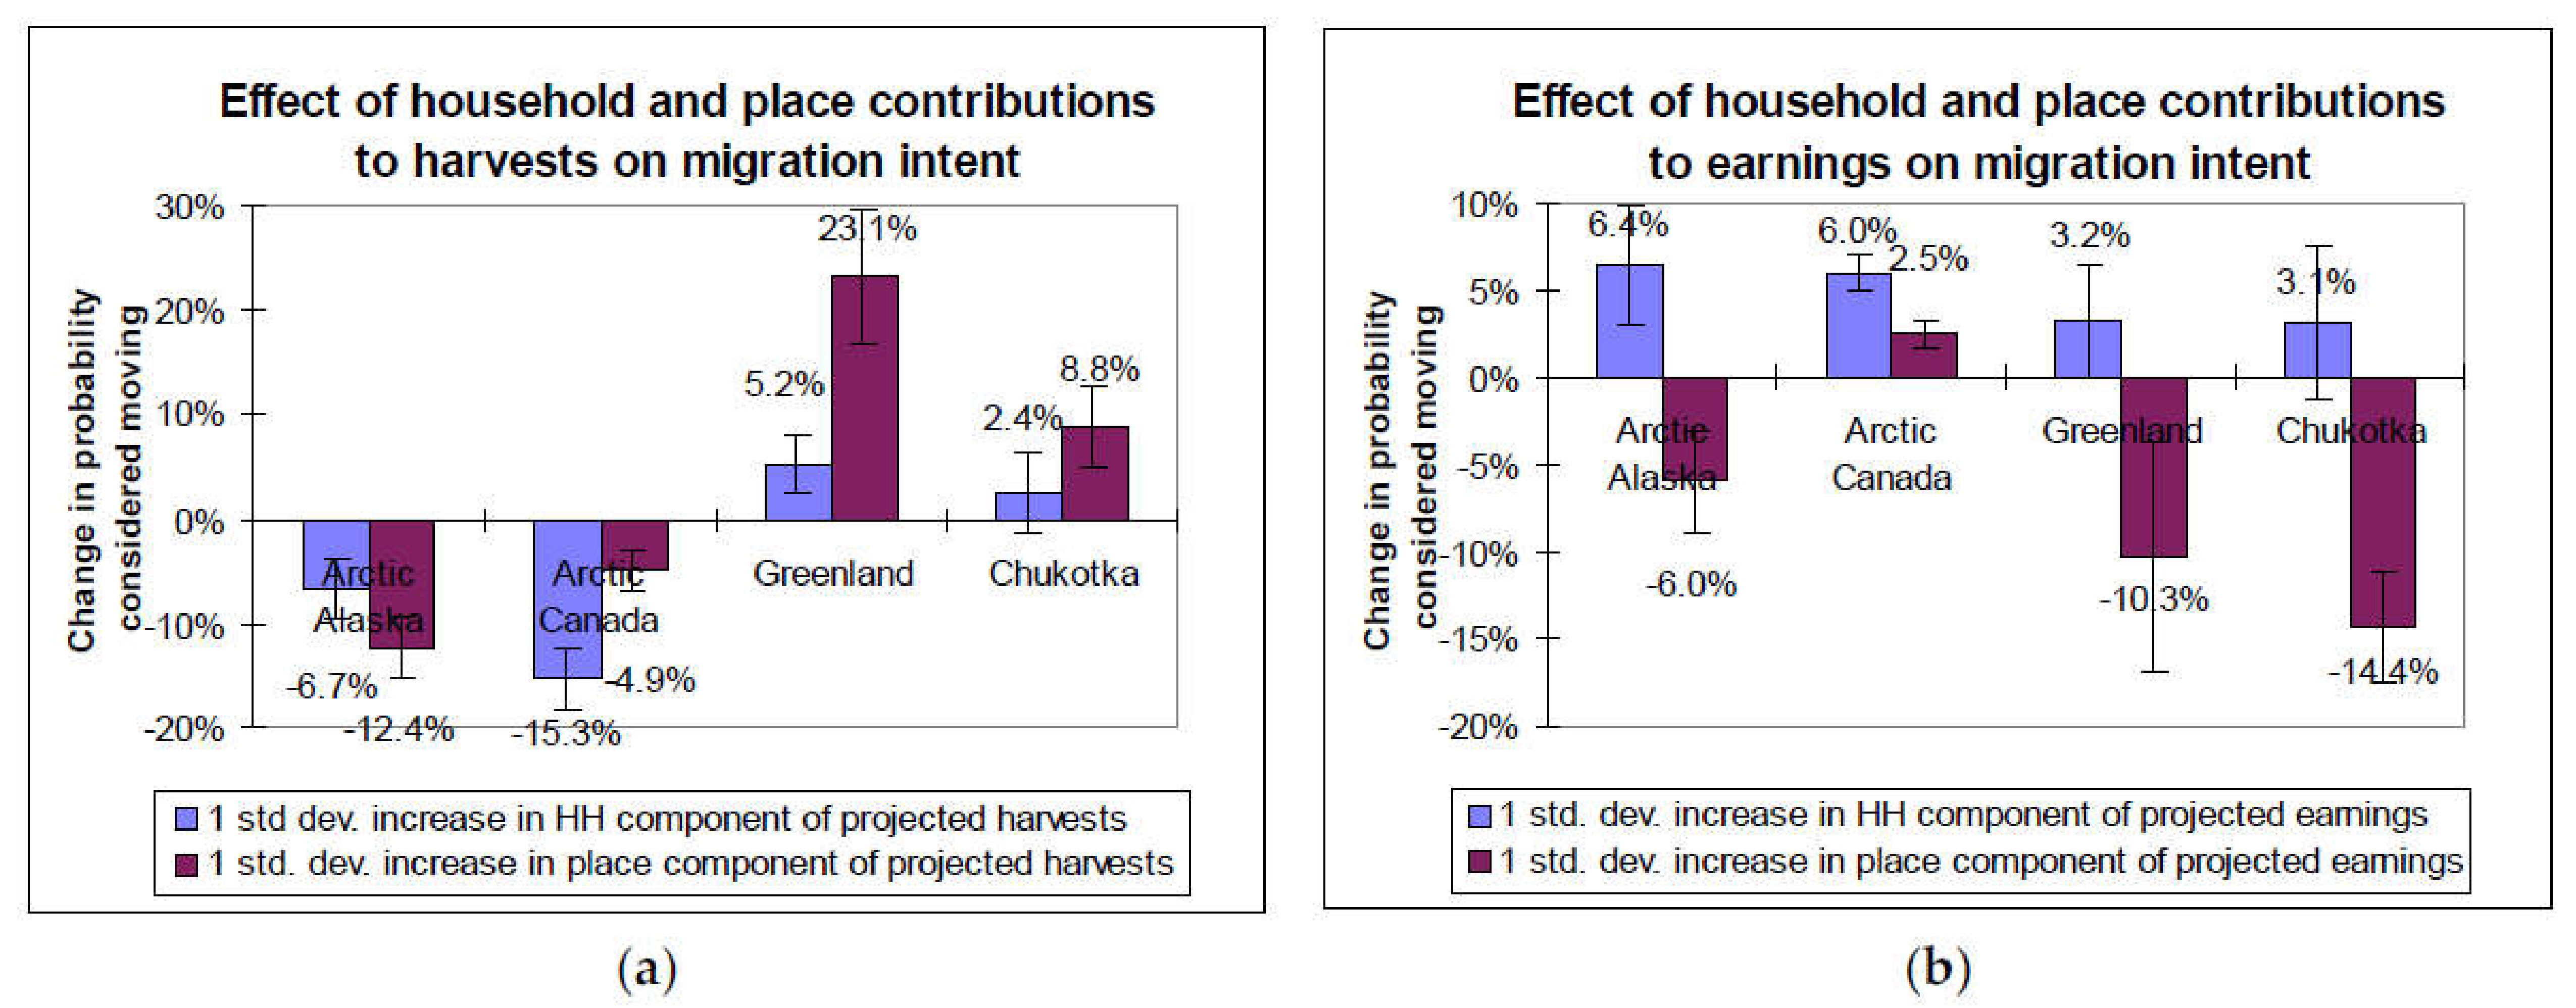
Figure 5 summarizes the effects of household earnings and harvesting expectations on migration intent, based on the equation results displayed in Appendix A Table A4. Colored bars represent the estimated percentage change in the probability that the respondent indicated a desire to leave the community that is associated with the projected percentage change in the amount of meat and fish provided by one’s own household harvest and projected total household earnings. Since the equations that predict expectations of harvest success and earnings, shown in Appendix A Table A2 and Table A3, are linear expressions, it is possible to divide the projections into two components: a component reflecting the linear combination of effects of individual and household characteristics, and a component representing the linear combination of effects of place characteristics (Appendix A contains definitions of place characteristics and individual and household characteristics). Estimating the two component effects separately provides additional detail about migration decisions and well-being, with different policy implications. For example, transfer income as well as earnings from work may affect cash income, but transfers are generally determined by individual and household characteristics, rather than by location.
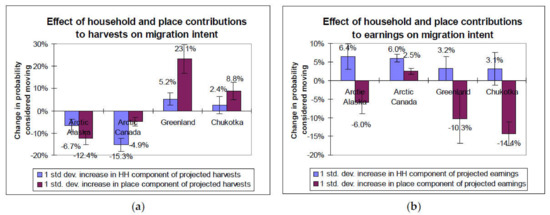
Figure 5.
Determinants of Migration Intent: Harvesting and Earning Opportunities. Colored bars represent the estimated percentage change in the probability that the respondent indicated a desire to leave the community, associated with the projected percentage change in the amount of meat and fish provided by one’s own household harvest, or total household earnings. Source: Appendix A Table A4. Error bars represent standard errors of effects.
Households with favorable characteristics for success in traditional livelihoods were less likely to want to move in Alaska and Canada but more mobile in Greenland and Chukotka (although the effect in Chukotka is not statistically significant). Places with favorable opportunities for subsistence attract people to stay in Alaska and arctic Canada communities, but apparently push people to consider leaving Greenland and Chukotka. The effect in Greenland is surprisingly strong, with a one standard deviation increase in the place component of expecting household harvests increasing migration intent by 23 percentage points.
The effects summarized in Figure 5 suggest that households with characteristics associated with higher earnings—typically households with better-educated respondents—were more mobile in all regions, although the effect is only statistically significant in Alaska and Canada. Places with more favorable earnings opportunities reduce the probability that the respondent considered moving, except in arctic Canada, where better job opportunities are associated with a small but significant increase in migration intent. The effect of better job opportunities is strongest in Chukotka—14 percent reduction in migration intent for a one-standard-deviation increase in expected earnings—where paying jobs are particularly scarce.
Besides the factors related to livelihood opportunities displayed in Figure 5, factors related to household demographics and quality of life in a place significantly affect migration intent in one or more regions. After controlling for the effect of household earnings potential and household characteristics, female respondents are significantly more interested in leaving their home communities in Chukotka, and significantly less mobile in arctic Canada. Older people are generally less inclined to have considered moving, as expected, but effect in Canada is quantitatively small and only one fifth as strong as that of any other region. Recent crime victims are significantly more likely to express interest in moving in Alaska and Greenland. (This effect could not be tested in Canada, where the victimization questions were not asked). Poor housing was significantly associated with migration intent in Alaska (crowding) and Canada (high percentage of old housing in the community). There was insufficient variation in availability of schooling to test whether this had an effect. High cost of living was strongly associated with moving intent in Canada (the only region where good data were available). In Greenland, where only larger communities have airports and some communities are iced-in and not accessible by boat most of the year, moving costs provided a significant deterrent to migration intent.
6. Discussion
Despite its limitations, SLiCA data produce interesting results on the role of subsistence in migration decisions, and by implication, household well-being. Among arctic Indigenous residents, the data suggest that Alaskans are most likely to have considered moving away from their communities and Canadians least likely. Alaskans also have highest level of subsistence participation and overwhelmingly prefer to pursue a mixed livelihood strategy including both harvesting and wage work. Harvesting opportunities and projected harvesting success provide a significant deterrent for migration intent for Alaska and Canada Inuit, with the effect strongest in Alaska. However, both household and place components of projected harvest are associated with increased intention to move for Greenland and Chukotka residents, with the place component very strong in Greenland. Higher earnings opportunities are also negatively associated with migration intent among Canada Inuit, while residents of communities in other regions with relatively better job opportunities are less likely to want to leave.
Might these differences among countries reflect indirect effects of government policies toward Indigenous harvesting rights and arctic development? In Canada, harvesting rights have recently been formally protected in Indigenous land claims. In Alaska, such rights are protected in federal legislation but contested by the state government. Indigenous harvesting rights are weak in Chukotka, and while not contested in Greenland, appear irrelevant to Greenlanders’ aspirations for a modern nation-state. Government policies in Alaska that protect rural harvesting rights highly restrict market distribution of subsistence products. In other regions, sales of products are generally permitted, but remoteness keeps markets mainly local. In Greenland, there appear to be few substantive differences between commercial and subsistence harvesting activities, effectively merging traditional and modern livelihoods. In Chukotka, where jobs are scarce, the most important role of harvesting may be to increase food security. Putting together all these empirical strands of evidence, one is left with the impression that harvesting may function more as the employer of last resort in Greenland and Chukotka, while functioning as a source of ethnic pride and identity in Canada, and especially in Alaska.
State policies toward infrastructure, public safety, and subsidized living costs also appear to have consequences for migration intent among arctic Indigenous people. In addition, education policies that result in higher high-school graduation rates generally increase individual earnings potential, which increases migration intent. This enhancement to mobility can be offset by better local job prospects, which typically also largely reflect government policies toward arctic community development [23,24,37,38]. While these findings relate to migration intent rather than actual moves, studies have found that migration intent reflects more than just an indicator of attachment to place, and does presage actual moves [40,41]. One could argue, therefore, that contemporary mobility of Indigenous people may largely result from the indirect effects of a variety of government policies related to Indigenous rights and arctic community development.
7. Conclusions
This study conducted a comparative empirical analysis of survey records from Indigenous, mostly Inuit, households in four arctic nations to test the association between respondents’ intent to remain in their community of residence and household harvesting, cash income from work, and other relevant factors. Results of a multivariate statistical analysis appear entirely consistent with the hypothesis that state policy plays a fundamental role in shaping mobility aspirations. Where policies directly or indirectly link harvesting livelihoods to expression of cultural identity, harvesting opportunities appear to attract people to remain in remote rural communities, just as job opportunities do. Policies that improve community quality of life also appear important in several instances.
The findings suggest some potential implications related to vulnerability of arctic communities to environmental change and shifting public policies. For example, North American rural arctic communities may be more vulnerable to climate change that might adversely affect harvesting opportunities than communities in Greenland and Chukotka, where harvesting may be considered more as a mediocre-at-best livelihood option. In Canada, where harvesting rights appear to have been protected permanently in land claims agreements, it remains an open question whether the deterrent effect on mobility of local harvest opportunities will subside over time compared to Alaska, where such rights are still contested. These and other findings of course only reflect statistical patterns across scores of arctic communities and may not hold for particular communities or households. Nevertheless, the findings suggest fertile opportunities for ethnographic investigations to ascertain the extent that they apply, and how local residents and migrants describe and interpret their own experiences.
Funding
The author gratefully acknowledges research support from the National Science Foundation, grants #0639211 and #0457662. This research was conducted as part of the Understanding Migration in the Circumpolar North project, a component of the Boreas program, organized and supported by the European Science Foundation. The Danish Research Council and Social Sciences and Humanities Research Council Canada also contributed funding to the project along with the U.S. National Science Foundation.
Institutional Review Board Statement
Not applicable.
Informed Consent Statement
Not applicable.
Data Availability Statement
Not applicable.
Acknowledgments
The author would like to thank Jack Kruse, Stephanie Martin, Chris Southcott, Birger Poppel, Statistics Canada Research Data Centre program, and the people of Arctic Alaska, Canada, Greenland, and Chukotka for the opportunity to work with the SLiCA survey household records.
Conflicts of Interest
The authors declare no conflict of interest.
Appendix A. Statistical Tests of the Effect of State Policy on Migration Intent
The first step estimates equations for household subsistence harvests and household earnings as functions of predetermined individual, household, and place characteristics. The fitted values for the harvest and earnings equations form instrumental variables representing expectations of future livelihood success in that community. The instrumental variables, along with household and individual characteristics and indicators of moving costs, explain migration intent in the second stage. The second-stage equation estimates the probability that a person will have recently considered moving from the community as a linear combination of expected subsistence harvest, cash income, and other place amenities such as housing quality and public safety, and moving costs, given individual and household characteristics.
Since the equations that predict expectations of harvest success and earnings are linear expressions, it is possible to divide the projections into two components: a component reflecting the effect of individual and household characteristics, and a component representing the effect of place characteristics. Estimating the component effects separately provides additional detail about migration decisions and well-being, with different policy implications. For example, transfer income as well as earnings from work may affect cash income, but transfers are generally determined by individual and household characteristics, rather than by location.
One should note that although the equations for harvest and earnings are linear expressions, the sum of the two components, plus the constant term, does not exactly equal the predicted value for an individual observation. That is due to the fact that the harvest and earnings equations are estimated as censored regressions, which generate nonlinear predictions, especially near the censoring level (zero harvest or earnings). Consequently, the two components should best be considered as quantitative indexes of expected household harvest and earnings.
Appendix ATable A1 lists the complete set of variables, with the precise definition and sample means for each country. A blank in the table cell for a particular variable and region indicates the data were not available or, in the case of place characteristics, not relevant for that region. Table A2 and Table A3 display the complete results for censored regression (tobit) equations estimated to explain variation in household subsistence harvests and household earnings per adult, respectively. Due to the extreme income disparities prevalent in Chukotka, estimating an earnings equation for the natural logarithm of household earnings per adult provided a better fit for that region. Table A4 shows the full results for the equation for migration intent, estimated as a probit equation with a binary (yes or no) dependent variable.
Table A1.
Variable Definitions and Sample Means.
Table A1.
Variable Definitions and Sample Means.
| Variable Name | Definition | Arctic Alaska | Arctic Canada | Greenland | Chukotka |
|---|---|---|---|---|---|
| Dependent variables | |||||
| HH subsistence harvest | Percent of meat and fish from household’s own harvest, grouped: 0 = none, 0.25 = less than half, 0.5 = about half, 0.75 = more than half | 0.449 | 0.455 | 0.356 | 0.375 |
| HH earnings per adult | Total HH wage and self-employment earnings (local currency) per HH member aged 16–64 | 20,630 | 20,718 | 143,213 | 225,946 |
| Migration intent | Have you considered moving away from the community in the past five years? (1 = yes, 0 = no) | 0.444 | 0.282 | 0.351 | 0.381 |
| Respondent characteristics | |||||
| Female | Female respondent | 0.554 | 0.503 | 0.526 | 0.534 |
| Age | Respondent age, in years | 41.8 | 34.7 | 42.2 | 40.2 |
| Age squared | Square of respondent age | 2008 | 1445 | 1989 | 1782 |
| Education level | 10 categories: 0 (no school) through 9 (post-graduate degree) | 4.01 | 3.17 | 2.78 | 3.14 |
| Subsistence skills | Number out of a list of 20 of skills learned while growing up | 11.7 | 8.9 | 19.8 | |
| Disabled | Hampered in daily activities by chronic condition (in Chukotka: self-assessed health status = ‘poor’) | 0.106 | 0.139 | 0.236 | |
| Family ties index | Index of perceived ties and frequency of contact with family members not living in the household | 11.90 | 3.90 | 3.75 | |
| Crime victim | Categories of crime respondent was victimized within past year (0–4) | 0.306 | 0.278 | ||
| Ever lived elsewhere | =1 if ever lived in another community, 0 otherwise | 0.446 | |||
| Household characteristics | |||||
| Indigenous language use | Use of Indigenous language at home (1 = not at all, through 5 = all the time) | 3.26 | 3.75 | 4.70 | 2.42 |
| Adult females in household | Number of females aged 18 and over in the household | 1.09 | 1.09 | 1.01 | 1.24 |
| Adult males in household | Number of males aged 18 and over in the household | 1.20 | 1.18 | 1.10 | 1.35 |
| Teens in household | Number of teens aged 16–17 in the household | 0.196 | 0.421 | 0.128 | 0.256 |
| Elders in household | Number of elders aged 65 and over in the household | 0.230 | 0.131 | 0.153 | 0.040 |
| Non-Indigenous in household | =1 if a non-Indigenous person in the household, 0 otherwise | 0.137 | 0.044 | 0.172 | |
| No men in the household | =1 if no males over 16 in the household, 0 otherwise | 0.126 | 0.146 | 0.161 | 0.133 |
| Children under 16 | Number of children under 16 years of age in the household | 1.76 | 1.41 | 0.95 | 1.19 |
| Pre-school children | Number of children under 5 (under 6 in Canada) in the household | 0.534 | 0.320 | 0.217 | 0.406 |
| Pre-school children, no men | No males over 16 times number of children under 5 (6 in Canada) | 0.063 | 0.036 | 0.012 | 0.019 |
| School-age child | =1 if one or more children aged 6–14 living in the HH, 0 otherwise | 0.403 | |||
| Household size | Number of persons in the household | 5.06 | |||
| Persons per room | Household size divided by number of rooms | 0.320 | |||
| Lone female | Household size = 1 and female respondent | 0.013 | 0.033 | 0.012 | |
| Lone male | Household size = 1 and male respondent | 0.050 | |||
| Multi-generational household | At least three generations in the household | 0.047 | |||
| Household projected harvests | Contribution of individual and household characteristics to projected household harvests | 0.121 | 0.164 | 0.0929 | 0.110 |
| Household projected earnings | Contribution of individual and household characteristics to projected household earnings | 6558 | −9316 | 35,096 | |
| Log household projected earnings | Natural logarithm of household projected earnings | 1.093 | |||
| Place characteristics | |||||
| Total employment | Census employment in community, 2000 (000s) | 0.682 | |||
| Employment change | Percentage change of employment, 1990–2000 | 0.356 | |||
| Regional center | =1 if arctic community population > 1500 | 0.356 | 0.314 | 0.180 | |
| Coastal community | =1 if community is located on coast, 0 otherwise | 0.765 | 0.425 | ||
| Caribou using community | =1 if caribou regularly available to a community | 0.404 | |||
| Salmon using community | =1 if salmon regularly available to a community | 0.247 | 0.148 | ||
| Food cost index | Food cost relative to Ottawa (Canada DIAND Food Cost Survey) | 1.79 | |||
| Percent old housing | Percent of housing in the community built before 1970 | 0.141 | 0.134 | ||
| Nunavik region | Nunavik region relative to Nunatsiavut region | 0.219 | |||
| Nunavut region | Nunavut Territory relative to Nunatsiavut region | 0.596 | |||
| Inuvialuit region | Inuvialuit region relative to Nunatsiavut region | 0.087 | |||
| Log of full-time jobs | Natural logarithm of number of full-time jobs located in the community | 5.48 | |||
| Per-capita jobs | Employment divided by population | 0.217 | |||
| Per-capita private jobs | Private sector employment divided by population | 0.238 | |||
| Pct. Indigenous population | Indigenous people as percent of the population | 0.859 | |||
| Log of population | Natural logarithm of population (2002 Chukotka, 2004 Greenland) | 7.47 | 6.82 | ||
| Industrial community | =1 if established as a Soviet-era industrial town | 0.173 | |||
| Whaling community | =1 if whaling carried out in the community | 0.271 | |||
| Reindeer herding | =1 if reindeer herding carried out in the community | 0.501 | |||
| Log of total earnings | Natural logarithm of total earnings in the community, 2004 | 12.41 | |||
| Year-round air service | =1 if the community has year-round air service | 0.650 | |||
| Per-capita harvest earnings | Earnings from wild food harvests per person, 2004 | 3.23 | |||
| Percent of year iced-in | Percentage of time sea ice prevents water access to community | 0.147 | |||
| Grade 12 | =1 if local school through 12th grade | 0.680 | |||
| Town | =1 for residents of communities with population of 10,000 to 20,000 | 0.283 | 0.0716 | ||
| Iced-in regional center | Regional center times percentage iced in | 0.064 | |||
| Place projected harvests | Contribution of place characteristics to projected household harvests | 0.104 | 0.290 | 0.146 | 0.142 |
| Place projected earnings | Contribution of place characteristics to projected household earnings | 11,384 | 31,016 | 35,096 | |
| Log place projected earnings | Natural logarithm of place projected earnings | 0.836 | |||
Table A2.
Censored Regression Equations for Household Subsistence Harvest. Maximum likelihood estimates (t statistics in parentheses).
Table A2.
Censored Regression Equations for Household Subsistence Harvest. Maximum likelihood estimates (t statistics in parentheses).
| Variable Name | Arctic Alaska | Arctic Canada | Greenland | Chukotka |
|---|---|---|---|---|
| Constant | −0.561 | 0.0052 | −0.343 | −0.962 |
| (−3.46) | (0.02) | (−0.90) | (−3.92) | |
| Female | 0.0315 | −0.0748 | 0.0894 | −0.0559 |
| (0.79) | (−4.45) | (2.63) | (−1.84) | |
| Age | 0.0108 | 0.0064 | 0.0153 | −0.00678 |
| (1.81) | (2.13) | (2.63) | (−1.09) | |
| Age squared | −0.000162 | −5.58 × 10⁻⁵ | −0.000165 | 0.000022 |
| (−2.41) | (−1.54) | (−2.37) | (0.29) | |
| Education level | 0.0319 | −0.0128 | −0.0258 | 0.0459 |
| (1.54) | (−2.49) | (−1.70) | (3.90) | |
| Subsistence skills | 0.0135 | 0.023508 | 0.00616 | |
| (3.24) | (5.71) | (3.96) | ||
| Disabled | −0.0814 | −0.112 | 0.0147 | |
| (−1.58) | (−2.54) | (0.43) | ||
| Family ties index | 0.0248 | −0.0064 | 0.0191 | |
| (3.09) | (−0.40) | (1.11) | ||
| Indigenous language use | 0.0644 | 0.0202 | −0.0075 | 0.0468 |
| (3.83) | (2.41) | (−0.33) | (4.14) | |
| Adult females in household | 0.0675 | 0.0742 | 0.0001 | 0.0264 |
| (2.51) | (5.48) | (0.005) | (1.39) | |
| Adult males in household | 0.0417 | 0.0315 | 0.0437 | 0.0633 |
| (1.50) | (2.23) | (1.67) | (3.39) | |
| Teens in household | 0.0171 | 0.0799 | 0.0502 | 0.0038 |
| (0.46) | (5.59) | (1.23) | (0.13) | |
| Elders in household | 0.0753 | 0.111 | 0.122 | 0.036 |
| (1.72) | (4.55) | (2.60) | (0.55) | |
| Non-Indigenous in household | 0.00575 | −0.0696 | 0.0360 | |
| (0.14) | (−0.88) | (1.10) | ||
| No men in household | −0.141 | −0.174 | −0.232 | 0.0004 |
| (−1.94) | (−5.24) | (−3.88) | (0.01) | |
| Pre-school children | −0.0756 | 0.0240 | 0.0010 | −0.0408 |
| (−2.81) | (0.99) | (0.03) | (1.69) | |
| Pre-school children, no men | −0.0969 | −0.0571 | 0.0001 | −0.0013 |
| (−1.60) | (−1.10) | (0.00) | (0.01) | |
| Children under 16 | 0.0229 | −0.0111 | −0.0017 | 0.0394 |
| (1.82) | (−1.24) | (−0.11) | (2.48) | |
| School-age child | 0.0320 | |||
| (1.30) | ||||
| Household size | 0.0132 | |||
| (2.50) | ||||
| Total employment | −0.206 | |||
| (−2.04) | ||||
| Employment change | −0.0413 | |||
| (−0.52) | ||||
| Log of full-time jobs | −0.0834 | |||
| (−4.86) | ||||
| Per-capita jobs | 0.734 | |||
| (2.56) | ||||
| Per-capita private jobs | 0.688 | |||
| (2.83) | ||||
| Regional center | 0.136 | −0.0251 | 0.0405 | −0.433 |
| (0.84) | (−0.75) | (0.502) | (−4.98) | |
| Percent Indigenous population | 0.382 | |||
| (2.52) | ||||
| Food cost index | 0.164 | |||
| (1.77) | ||||
| Logarithm of population | −0.355 | 0.208 | ||
| (−2.92) | (6.87) | |||
| Log of total earnings | 0.226 | |||
| (2.27) | ||||
| Per-capita harvest earnings | −0.00714 | |||
| (−1.82) | ||||
| Percent of year iced-in | 0.234 | |||
| (1.96) | ||||
| Coastal community | 0.0972 | −0.0551 | ||
| (2.05) | (−1.25) | |||
| Caribou using community | 0.142 | −0.117 | ||
| (reindeer in Chukotka) | (3.15) | (−3.76) | ||
| Salmon using community | 0.109 | 0.110 | ||
| (2.28) | (2.47) | |||
| Whaling community | 0.0970 | |||
| (2.01) | ||||
| Industrial community | −0.0049 | |||
| (−0.10) | ||||
| Nunavik region | −0.184 | |||
| (−2.59) | ||||
| Nunavut region | −0.219 | |||
| (−2.70) | ||||
| Inuvialuit region | −0.250 | |||
| (−3.78) | ||||
| Town | −0.406 | |||
| (−5.62) | ||||
| Sigma | 0.362 | 0.476 | 0.414 | 0.239 |
| (23.31) | (55.38) | (27.49) | (22.38) | |
| Observations | 622 | 4295 | 938 | 447 |
| Log Likelihood | −377.1 | −3378 | −664.6 | −131.2 |
Table A3.
Censored Regression Equations for Household Earnings per Adult. Maximum likelihood estimates (t statistics in parentheses).
Table A3.
Censored Regression Equations for Household Earnings per Adult. Maximum likelihood estimates (t statistics in parentheses).
| Variable Name | Arctic Alaska (U.S. Dollars) | Arctic Canada (Cdn. Dollars) | Greenland (Danish Kronur) | Chukotka (Log Earnings, Rubles) |
|---|---|---|---|---|
| Constant | −18.2 | −33.5 | −733.8 | 1.950 |
| (−2.52) | (−4.41) | (−4.93) | (1.05) | |
| Female | −2.79 | 3.89 | 1.15 | −0.406 |
| (−1.61) | (7.33) | (0.09) | (−1.82) | |
| Age | 0.679 | 0.549 | 16.92 | 0.134 |
| (2.50) | (5.93) | (6.55) | (2.55) | |
| Age squared | −0.01 | −0.00479 | −0.200 | −0.001 |
| (−2.89) | (−4.35) | (−6.57) | (−1.95) | |
| Education level | 4.38 | 2.32 | 29.53 | 0.231 |
| (4.78) | (14.23) | (5.59) | (2.73) | |
| Subsistence skills | 25.90 | 1152.3 | −0.056 | |
| (0.14) | (0.81) | (−4.76) | ||
| Disabled | −2.21 | −55.63 | −0.512 | |
| (−0.93) | (−3.52) | (−2.03) | ||
| Family ties index | 0.652 | 9.539 | 0.028 | |
| (1.87) | (1.58) | 0.22) | ||
| Indigenous language use | −0.249 | −1.953 | −29.10 | −0.255 |
| (−0.33) | (−7.43) | (−4.06) | (−3.07) | |
| Adult females in household | 459.0 | −2915.1 | 12105 | −0.072 |
| (0.39) | (−7.04) | (1.14) | (−0.52) | |
| Adult males in household | −927.7 | −3953.7 | −35473 | −0.260 |
| (−0.75) | (−8.84) | (−2.88) | (−1.93) | |
| Teens in household | −1962.4 | −4591.5 | −41921 | −0.891 |
| (−1.23) | (−10.42) | (−2.68) | (−3.86) | |
| Elders in household | −4394.6 | 1693.2 | −25690 | 1.201 |
| (−2.22) | (2.26) | (−1.35) | (2.33) | |
| Non-Indigenous in household | 5125.4 | −14166 | 0.054 | |
| (3.13) | (−0.54) | (0.22) | ||
| No men in household | −5471.4 | −6372.3 | −96251 | −0.394 |
| (−1.72) | (−6.32) | (−4.27) | (−1.03) | |
| Pre-school children | 1709.4 | −39.6 | 100580 | 0.072 |
| (0.66) | (−0.02) | (2.21) | (0.40) | |
| Pre-school children, no men | 735.4 | 572.46 | 5770.9 | −0.063 |
| (1.33) | (2.07) | (1.01) | (−0.09) | |
| Children under 16 | −1533.6 | −2963.9 | −13687 | 0.099 |
| (−1.30) | (−3.88) | (−1.04) | (0.84) | |
| School-age child | −666.1 | |||
| (−0.86) | ||||
| Household size | 1550.4 | |||
| (9.48) | ||||
| Total employment | −13.43 | |||
| (−3.01) | ||||
| Employment change | −4.12 | |||
| (−1.17) | ||||
| Log of full-time jobs | −997.5 | |||
| (−1.85) | ||||
| Per-capita jobs | 64297 | |||
| (7.11) | ||||
| Per-capita private jobs | −451.9 | |||
| (−0.06) | ||||
| Regional center | 28,078 | 1398.9 | 12,967 | −1.594 |
| (3.97) | (1.35) | (0.43) | (−2.44) | |
| Percent Indigenous population | 7496.9 | |||
| (1.55) | ||||
| Food cost index | 6228.1 | |||
| (2.15) | ||||
| Logarithm of population | −102,030 | 0.414 | ||
| (−2.15) | (1.87) | |||
| Log of total earnings | 94,617 | |||
| (2.44) | ||||
| Per-capita harvest earnings | −1698.9 | |||
| (−1.11) | ||||
| Percent of year iced-in | 6583.2 | |||
| (0.14) | ||||
| Coastal community | 1680.9 | 0.530 | ||
| (0.80) | (1.65) | |||
| Caribou using community | 5207.3 | −0.652 | ||
| (reindeer in Chukotka) | (2.65) | (−2.82) | ||
| Salmon using community | 2012.8 | −0.793 | ||
| (0.97) | (−2.41) | |||
| Whaling community | −2.100 | |||
| (−5.88) | ||||
| Industrial community | −0.444 | |||
| (−1.10) | ||||
| Nunavik region | 6558.1 | |||
| (2.96) | ||||
| Nunavut region | 5009.1 | |||
| (1.98) | ||||
| Inuvialuit region | 2855.5 | |||
| (1.40) | ||||
| Town | −0.500 | |||
| (−0.93) | ||||
| Sigma | 16,298 | 16,546 | 129,480 | 1.762 |
| (32.55) | (92.30) | (32.70) | (26.30) | |
| Observations | 594 | 4490 | 690 | 424 |
| Log Likelihood | −6054 | −48,453 | −7499 | −806.3 |
Table A4.
Binomial Probit Equations for Migration Intent. Maximum likelihood estimates (t statistics in parentheses).
Table A4.
Binomial Probit Equations for Migration Intent. Maximum likelihood estimates (t statistics in parentheses).
| Variable Name | Arctic Alaska | Arctic Canada | Greenland | Chukotka |
|---|---|---|---|---|
| Household projected earnings | 2.471 × 10⁻⁵ | 2.836 × 10⁻⁵ | 1.275 × 10⁻⁶ | −0.0703 |
| (log earnings in Chukotka) | (1.88) | (5.81) | (1.00) | (0.71) |
| Household projected harvests | −1.416 | −6.905 | 1.472 | 0.5760 |
| (−2.34) | (−6.57) | (1.83) | (0.62) | |
| Place projected earnings | −1.354 × 10⁻⁵ | 1.900 × 10⁻⁵ | −8.524 × 10⁻⁶ | −0.6280 |
| (log earnings in Chukotka) | (−2.10) | (3.11) | (−1.74) | (−4.96) |
| Place projected harvests | −3.146 | −1.697 | 4.035 | 1.8103 |
| (−4.31) | (−2.67) | (3.52) | (2.22) | |
| Female | 0.134 | −0.269 | 0.050 | 0.883 |
| (1.07) | (−4.52) | (0.50) | (4.74) | |
| Age | −0.0252 | −0.0054 | −0.0240 | −0.040 |
| (−5.50) | (−2.44) | (−5.72) | (−5.42) | |
| Education level | 0.150 | |||
| (2.43) | ||||
| Disabled (poor health) | 0.792 | |||
| (3.89) | ||||
| Lone female | 0.747 | −0.290 | 0.174 | |
| (4.11) | (−0.97) | (0.29) | ||
| Lone male | 0.565 | |||
| (1.60) | ||||
| Adult females in household | 0.299 | −0.102 | ||
| (5.21) | (−1.15) | |||
| Adult males in household | 0.134 | −0.025 | ||
| (3.07) | (−0.26) | |||
| Teens in household | 0.315 | −0.066 | 0.447 | |
| (5.35) | (−0.48) | (2.19) | ||
| Elders in household | 0.151 | 0.265 | −0.118 | |
| (0.82) | (2.91) | (−0.94) | ||
| Multi-generational household | −0.335 | |||
| (−1.14) | ||||
| Non-Indigenous in household | 0.343 | |||
| (1.71) | ||||
| No men in the household | −0.510 | 0.354 | ||
| (−3.52) | (1.44) | |||
| Pre-school children, no men | −0.334 | −0.376 | ||
| (−2.32) | (−0.79) | |||
| Children under 16 | −0.0394 | 0.0263 | ||
| (−0.91) | (0.53) | |||
| Pre-school children | 0.0899 | 0.122 | −0.478 | |
| (1.64) | (1.11) | (−3.55) | ||
| School-age child | 0.0328 | |||
| (0.57) | ||||
| Crime victim | 0.173 | 0.146 | ||
| (2.14) | (2.34) | |||
| Persons per room | 0.130 | |||
| (2.06) | ||||
| Ever lived elsewhere | 0.278 | |||
| (2.31) | ||||
| Percent old housing | 0.784 | 0.795 | ||
| (3.00) | (1.36) | |||
| Food cost index | 0.478 | |||
| (5.01) | ||||
| Log of population | −0.253 | |||
| (−2.54) | ||||
| Industrial community | 1.497 | |||
| (4.99) | ||||
| Reindeer herding | −0.268 | |||
| (−1.57) | ||||
| Percent of year iced-in | −1.052 | |||
| (−2.32) | ||||
| Year-round air service | 1.547 | |||
| (2.77) | ||||
| Grade 12 | −0.374 | |||
| (−0.95) | ||||
| Town | 0.658 | |||
| (2.46) | ||||
| Iced-in regional center | −0.400 | |||
| (−1.91) | ||||
| Constant | 0.875 | −0.586 | 2.170 | 0.596 |
| (2.34) | (−1.69) | (1.20) | (0.44) | |
| Observations | 530 | 4210 | 928 | 447 |
| Log Likelihood | −318.7 | −2312.3 | −538.5 | −176.6 |
| Restricted Log L. | −364.4 | −2508.7 | −601.6 | −293.6 |
| Chi Squared | 91.4 | 392.7 | 126.2 | 23 |
References
- Nuttall, M.; Berkes, F.; Forbes, B.; Kofinas, G.; Vlassova, T.; Wenzel., G. Hunting, Herding, Fishing, and Gathering: Indigenous Peoples and Renewable Resource Use in the Arctic. In Arctic Climate Impact Assessment—Scientific Report; Cambridge University Press: Cambridge, UK, 2010; pp. 649–690. [Google Scholar]
- Sakakibara, C. Kiavaliakkikput Agviq (Into the Whaling Cycle): Cetaceousness and Climate Change among the Inupiat of Arctic Alaska. Ann. Assoc. Am. Geogr. 2010, 100, 1003–1012. [Google Scholar] [CrossRef]
- James, F.; Smit, B.; Wandel, J.; Allurut, M.; Shappa, K.; Ittusarjuat, H.; Qrunnut, K. Climate Change in the Arctic: Current and Future Vulnerability in Two Inuit Communities in Canada. Geogr. J. 2008, 174, 45–62. [Google Scholar]
- Dinero, S. “The Lord Will Provide”: The History and Role of Episcopalian Christianity in Nets’aii Gwich’in Social Development Arctic Village, Alaska. Indig. Nations Stud. J. 2003, 4, 3–28. [Google Scholar]
- Berger, T.R. Northern Frontier, Northern Homeland; Indian and Northern Affairs: Ottawa, ON, Canada, 1977. [Google Scholar]
- Rasmussen, R.O. Resource Changes and Community Response: The Case of Northern Fisheries. In Canada’s and Europe’s Northern Dimensions; Dey, A., Nuttall, M., Eds.; University of Oulu Press: Oulu, Finland, 2009; pp. 85–94. [Google Scholar]
- Thornton, T.F. Alaska Native Subsistence: A Matter of Cultural Survival. Cult. Surviv. Q. 1998, 22, 29–34. [Google Scholar]
- Case, D. Subsistence and Self-Determination: Can Alaska Natives Have a More Effective Voice? Colo. Law Rev. 1989, 60, 1009–1034. [Google Scholar]
- Kruse, J.; Poppel, B.; Abryutina, L.; Duhaime, G.; Martin, S.; Poppel, M.; Kruse, M.; Ward, E.; Cochran, P.; Hanna, V. Survey of Living Conditions in the Arctic (SliCA). In Barometers of Quality of Life around the Globe: How Are We Doing? Møller, V., Huschka, D., Michalos, A.C., Eds.; Social Indicators Research Series; Springer: Dordrecht, The Netherlands, 2009; Volume 33, pp. 107–134. [Google Scholar]
- Singh, I.; Squire, L.; Strauss, J. The Basic Model: Theory, Empirical Results, and Policy Conclusions. In Agricultural Household Models: Extension, Application and Policy; Singh, I., Squire, L., Strauss, J., Eds.; Johns Hopkins University Press: Baltimore, MD, USA, 1986; pp. 17–47. [Google Scholar]
- Huskey, L.; Berman, M.; Hill, A. Leaving Home, Returning Home: Migration as a Labor Market Choice for Alaska Natives. Ann. Reg. Sci. 2004, 38, 75–92. [Google Scholar] [CrossRef]
- Greenwood, M. Internal Migration in Developed Countries. In Handbook of Population and Family Economics; Rosenzweig, M., Stark, O., Eds.; Elsevier: Amsterdam, The Netherlands, 1997; pp. 647–720. [Google Scholar]
- Birger, P.; Kruse, J. The Importance of a Mixed Cash- and Harvest Herding Based Economy to Living in the Arctic: An Analysis Based on the Survey of Living Conditions in the Arctic (SliCA). In Quality of Life in the New Millenium: Advances in Quality-of-Life Studies, Theory and Research; Møller, V., Huscka, D., Eds.; Social Indicators Research Series; Springer: Dordrecht, The Netherlands, 2009; Volume 35, pp. 27–42. [Google Scholar]
- Chance, N. Subsistence Research in Alaska: Premises, Practices, and Prospects. Hum. Organ. 1987, 46, 85–89. [Google Scholar] [CrossRef]
- Wolfe, R.; Walker, R. Subsistence Economies in Alaska: Productivity, Geography, and Developmental Impacts. Arct. Anthropol. 1987, 24, 56–81. [Google Scholar]
- Langdon, S.J. Contemporary Alaska Native Economies; University Press of America: New York, NY, USA, 1986. [Google Scholar]
- Usher, P. The Household as an Economic Unit in Arctic Aboriginal Communities, and Its Measurement by Means of a Comprehensive Survey. Soc. Indic. Res. 2003, 61, 175–202. [Google Scholar] [CrossRef]
- Stammler, F. Reindeer Nomads Meet the Market: Culture, Property and Globalization at the End of the Land; Halle Studies in the Anthropology of Eurasia; Litverlag: Muenster, Germany, 2005; Volume 6. [Google Scholar]
- Ulvevadet, B.; Klokov, K. Family-Based Reindeer Herding and Hunting Economies, and the Status and Management of Wild Reindeer/Caribou Populations; Centre for Saami Studies, University of Tromsø: Tromsø, Norway, 2004. [Google Scholar]
- Langdon, S.J. The Integration of Cash and Subsistence in Southwest Alaska Yup’ik Eskimo Communities. Senri Ethnol. Stud. 1991, 30, 269–291. [Google Scholar]
- Condon, R.G.; Collings, P.; Wenzel, G. The Best Part of Life: Subsistence Hunting, Ethnicity, and Economic Adaptation among Young Adult Inuit Males. Arctic 1995, 48, 31–46. [Google Scholar] [CrossRef]
- Goldsmith, S. The Remote Rural Economy of Alaska; Institute of Social and Economic Research: Anchorage, AK, USA, 2007. [Google Scholar]
- Berman, M.; Nicolson, C.; Kofinas, G.; Tetlichi, J.; Stephanie Martin, S. Adaptation and Sustainability in a Small Arctic Community: Results of an Agent-Based Simulation Model. Arctic 2004, 57, 401–414. [Google Scholar] [CrossRef] [Green Version]
- Knapp, G.; Huskey, L. Effects of Transfers on Remote Regional Economies: The Transfer Economy in Rural Alaska. Growth Chang. 1988, 19, 25–39. [Google Scholar] [CrossRef]
- Forbes, B.; Stammler, F.; Kumpula, T.; Meschtyb, N.; Pajunen, A.; Kaarlejärvi., E. High Resilience in the Yamal-Nenets Social-Ecological System, West Siberian Arctic, Russia. Proc. Natl. Acad. Sci. USA 2009, 106, 22041–22048. [Google Scholar] [CrossRef] [Green Version]
- Harrison, G. Alaska’s Constitution: A Citizen’s Guide, 4th ed.; Alaska Legislative Affairs Agency: Juneau, AK, USA, 2002. [Google Scholar]
- Public Law 92-203. Alaska Native Land Claims Settlement Act (ANCSA) (18 December 1971). Available online: https://www.govinfo.gov/content/pkg/STATUTE-85/pdf/STATUTE-85-Pg688.pdf#page=1 (accessed on 18 June 2021).
- Alaska v. Native Village of Venetie Tribal Government, 522 U.S. 520 (1998): (ALASKA v. NATIVE VILLAGE OF VENETIE TRIBAL GOVERNMENT (96-1577) 101 F.3d 1286, Reversed). Available online: https://supreme.justia.com/cases/federal/us/522/520/ (accessed on 18 June 2021).
- Public Law 96-487. Alaska National Interest Lands Conservation Act (ANILCA). (2 December 1980). Available online: https://www.govinfo.gov/content/pkg/STATUTE-86/pdf/STATUTE-86-Pg1027.pdf (accessed on 18 June 2021).
- Public law 92-522. Marine Mammal Protection Act (MMPA) (October 21, 1972). Available online: https://www.govinfo.gov/content/pkg/STATUTE-86/pdf/STATUTE-86-Pg1027.pdf (accessed on 18 June 2021).
- Huntington, H.P. Wildlife Management and Subsistence Hunting in Alaska; University of Washington Press: Seattle, WA, UUA, 1992. [Google Scholar]
- Berger, T. Village Journey: The Report of the Alaska Native Review Commission; Hill and Wang: New York, NY, USA, 1985. [Google Scholar]
- Freeman, M.; Wein, E.; Keith, D. Recovering Rights: Bowhead Whales and Inuvialuit Subsistence in the Western Canadian Arctic; University of Alberta Press: Edmonton, AB, Canada, 1992. [Google Scholar]
- Nunavut Wildlife Management Board. The Nunavut Wildlife Harverst Study. Available online: https://www.nwmb.com/en/publications/harvest-study/1824-156-nwhs-report-2004-156-0003 (accessed on 25 August 2020).
- Heleniak, T.; Holzlehner, T.; Khlinovskaya, E. Der große Exodus: Demographische Trends an Russlands nördlicher Peripherie (The Great Exodus: Demographic Trends in Russia’s Northern Periphery). Osteuropa 2011, 61, 371–386. [Google Scholar]
- Klokov, K. Reindeer Husbandry in Russia. Int. J. Entrep. Small Bus. 2007, 4, 726–784. [Google Scholar] [CrossRef]
- Lyck, L.; Taagholt, J. Greenland—Its Economy and Resources. Arctic 1987, 40, 50–59. [Google Scholar] [CrossRef]
- Dahl, J. Identity, Urbanization, and Political Demography in Greenland. Acta Boreal. 2010, 27, 125–140. [Google Scholar] [CrossRef]
- De Jong, G. Expectations, Gender, and Norms in Migration. Popul. Stud. 2000, 54, 307–319. [Google Scholar] [CrossRef]
- Manski, C. The Use of Intentions Data to Predict Behavior: A Best-Case Analysis. J. Am. Stat. Assoc. 1990, 85, 934–940. [Google Scholar] [CrossRef]
- Ajzen, I.; Fishbein, M. Attitude-Behavior Relations: A Theoretical Analysis and Review of Empirical Research. Psychol. Bull. 1977, 84, 888–918. [Google Scholar] [CrossRef]
- Poppel, B.; Kruse, J.; Duhaime, G.; Abryutina, L. SLiCA Results; Institute of Social and Economic Research: Anchorage, AK, USA, 2007. [Google Scholar]


Publisher’s Note: MDPI stays neutral with regard to jurisdictional claims in published maps and institutional affiliations. |
© 2021 by the author. Licensee MDPI, Basel, Switzerland. This article is an open access article distributed under the terms and conditions of the Creative Commons Attribution (CC BY) license (https://creativecommons.org/licenses/by/4.0/).