Abstract
Personal security is one of the many factors that must be assessed comprehensively when planning an urban competitiveness strategy. The aim of this article is to assess the competitive position of the social environment of cities in terms of security with regard to time and other competing cities. Having conducted a systemic and comparative analysis of the concepts published in the scientific literature, we analysed the concepts of sustainable cities and the social environment, reviewed the particularities of urban competitiveness, conducted research into the methods of assessing urban competitiveness, and presented an integrated assessment model (MDK) of social environment competitiveness in terms of security in the Baltic capitals. The following research methodology was used: systemic and comparative analysis of concepts and methods published in the scientific literature, statistical processing and multicriteria assessment methods. The results of the study can be used as a tool to determine the competitive position of a city in terms of time and other competing cities, a tool to identify factors that strengthen or weaken the sustainable competitiveness of cities, a tool to justify strategic decisions of cities, and a tool to determine the effectiveness of the strategic decisions taken.
1. Introduction
More than half of the world’s population and most of the industry are concentrated in cities (Figure 1). Due to the fast process of urbanisation, cities have recently become the most significant centres of economic activity, innovation and culture, as well as objects that attract people and investments, both in the context of countries and individual regions.
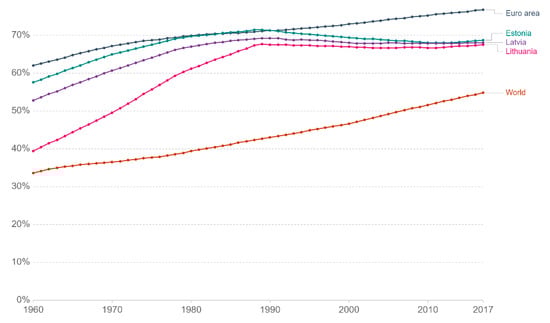
Figure 1.
Urbanisation in the period of 1960–2017 (https://ourworldindata.org/grapher/share-of-population-urban?tab=chart&country=OWID_WRL~Euro+area~LVA~LTU~EST, accessed on 7 April 2021).
The concept of urbanisation found its way into the discussions of researchers, politicians, strategists and entrepreneurs in the 20th century when the process of urbanisation became a significant factor in the changing economic and social environment. Arbušauskaitė and Juščenko [1] argue that urbanisation defines the increase in the population numbers living in urbanised areas. It is a process whereby people move to live in cities and other densely populated areas. This concept is integral to socio-economic development [2].
It has been noted that the urbanisation process differs across the board (Figure 1).
The data in Figure 1 demonstrate that the number of residents in urbanised areas increases at different rates. In 2017, 76.77% of the European population lived in cities (a difference of 14.68%), whereas the global trends demonstrated that urbanisation made up 54.83% (a difference of 21.21%).
The scientific literature on the processes of urbanisation and globalisation largely focuses on economic and demographic flows to cities [3].
There is much debate in the scientific literature with regard to the impact of the urbanisation process on urban economic development. Henderson et al. [4], Singhal et al. [5], and Xu and Watada [6] argue that this process positively affects the economic development of cities by underlining better opportunities to develop businesses, to increase productivity and to implement innovations, as well as better conditions for living, working, studying and recreation. However, Witcher [7] sees risks arising from the deteriorating ecological and social situation (e.g., social inequality, income disparity, poverty, etc.), the rising pollution and morbidity [3,8], shortages of water, food and spaces suitable for living, as well as the overconsumption of energy resources. Žalevičienė and Čiegis [9], Rutkauskas [10], Witcher [7], Zhao et al. [11], Ramanauskienė and Čiegis [12] emphasise the necessity of implementing sustainable urban development principles when developing cities and enhancing their competitiveness.
Melnikas argued that purposeful urban development and the urbanisation of territories that are focused on the implementation of standards and the realisation of expectations with regard to humanisation, democracy, ecology, life quality, economic welfare, security, social comfort, and sustainability condition the modernisation of contemporary society and the improvement of its socio-economic situation [13].
Why are some urbanised areas more densely populated than others? What causes the migration of residents from one area to another? Does ensuring physical security of individuals guarantee comprehensive security of all residents? In order to be competitive by attracting the most people, cities must identify the factors influencing people’s decisions, monitor these trends and make timely changes. Our hypothesis is that assessing the competitiveness of the urban social environment in terms of security must include a complex analysis that combines the factors determining the competitiveness of the urban social environment into a unified system. The aim of this article is to assess the competitive position of the social environment of the cities in terms of security with regard to time and other competing cities. The article consists of an introduction, three sections, a discussion, and general conclusions. The Section 2 analyses related literature and offers the definitions and analysis of the concepts of a sustainable social environment and its security, as well as urban competitiveness that is based on the principle of sustainable development. Competitiveness assessment shapes the concept of the city as a constantly changing and environmentally influenced environmental entity. We review the diverse and particular factors and assessment methods of urban competitiveness. In the Section 3, we form the research methodology. The Section 4 presents an empirical study of the integrated competitiveness assessment of the sustainable social environment in terms of security in the Baltic capitals. This empirical research into the competitiveness of the social environment in terms of security in the Baltic capitals was conducted using the MDK model [14], which determines urban competitiveness with regard to three levels, i.e., basic, developmental and interactional, which are structured in accordance with the sustainable development principles, i.e., economic, social and environmental ones. The conclusions summarise the results of the article.
2. Related Literature Analysis
Recognising that it is important to aim for sustainable socio-economic development that also considers ecological factors, authors of the article analysed the scientific literature on the concepts of sustainable cities and sustainable development. The scientific literature [9,11,15,16,17,18,19,20] defines a sustainable city as the improvement of life in the city that includes environmental, cultural, political, institutional, social and economic components without burdening future generations. The objective of urban sustainability is to reduce the consumption of natural resources and the production of waste, thus improving a city’s suitability for living and its ability to harmonise local, regional and global ecosystems [21].
2.1. Sustainable Social Environment and Its Security
The scientific literature offers a variety of definitions for a sustainable social environment. In their analysis of social infrastructure, Bruneckienė et al. [22] and Snieška and Zykienė [23] identified four sectors and assessed the following factors: public transport, public health and social security (public health and social security infrastructure), education and science (general, professional and higher education systems, research infrastructure), and public security infrastructure. In the category of social infrastructure, the researchers Snieška and Zykienė [23] included schools, social security and public health institutions, hospitals and all other institutions that ensure that the social needs are met, thus contributing to the growth of the national economic level due to the fact that the social infrastructure network creates the conditions for the country’s residents to acquire education, professional skills and qualifications that are then applied at work. In 2015, the United Nations General Assembly (the UN) approved 17 sustainable development goals whose main objective is to implement the set goals in accordance with the Sustainable Development Agenda 2030. The following social environment development goals are identified on the basis of the above document: to ensure a comprehensive, equal education that is of high quality and to encourage lifelong learning; to achieve gender equality; to reduce national and international inequality; to encourage peaceful and inclusive societies for sustainable development; to ensure equal opportunities for anyone to demand justice and to create efficient, responsible and inclusive institutions at all levels; to improve the means of implementation and to restore a global sustainable development partnership [24]. In their social environment analysis, Panda et al. [25] identify the following aspects: the opportunity to meet one’s basic needs; accommodation; public health; security; education; private capital; demography; poverty level; culture; recreational space; and the possibility to acquire credit. Činčikaitė and Paliulis [14] defined social environment in terms of the following factors: human capital; migration; a city’s social burden; urban security; community learning, partnership and activities; social, cultural and sports infrastructure; educational system; urban psychological climate; urban demographics situation; medical care infrastructure. The scientific literature analysis demonstrated that the urban social environment and the factors describing it have a variety of definitions. The security factor is generally understood as physical security that excludes personal psychological security.
A safe environment is the only appropriate environment in which the implementation and development of human rights and freedoms are possible. The feeling of security determines both the behaviour and quality of life of individuals and the social and political stability of the state, the confidence of the population in the legal and institutional mechanisms functioning in it [26].
The European Declaration of Urban Rights lists the right to security as the first one: the right “to a secure and safe town, free, as far as possible, and from crime, delinquency and aggression”. Physical security means being safe in any situation that could endanger the physical security of an individual—this may refer to crime and violence. A sense that the physical security is often compromised may have a bigger effect on the psychological well-being than the impact of any real danger (Figure 2).
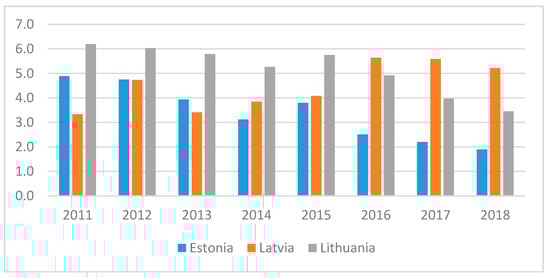
Figure 2.
Difference in psychological security (2011–2018).
In research on criminology and urban sociology, the fear of crime is increasingly understood in a broader context, as “criminal activities that are the cause of insecurity no longer explain this phenomenon” [27]. The research results revealed that the concept of fear of crime in the population often lies in their own unconscious fear and anxiety related to the feeling of socio-psychological insecurity and fear of the social world and the city in general [28,29].
According to Dzamalova et al. [30], the psychological security state at the level of the city is based on the psychological state of its individuals and is affected by environmental factors. In their research into the concept of psychological security, Wang et al. [31] identified that it may be defined in more than one way: one approach is—the four dimensions: street crime, emotional security, physical security, and property security; another—six dimensions: property security, personal security, traffic safety, medical security, food provisions, and employment security. According to the Wang et al. [31], Foster et al. [32], Prieto and Bishop [33], Martin et al. [34], and Tseng et al. [35], it may be said that psychological security is affected by social security, food availability and other related factors. Wang et al. [31] offer the following classification of social environment security: loyalty to the city, professional security, perception of social risk, and fear of technological innovation.
Newman et al. [36] and Chen et al. [37] describe psychological security at the company level. Psychological security is paramount at the team level, not the company one unless the company is small. These researchers distinguished two theories: social learning theory, to argue that supportive practices and relationships at work promote psychological security, and influence as learning, productivity, innovation, and creativity. This is achieved by facilitating the theory of information sharing, employee voice, feedback-seeking, experimentation [38,39] and social exchange, arguing that supportive practices and relationships can enhance psychological security and encourage employees to respond and achieve positive work outcomes [37].
Blynova et al. [40] distinguished three levels in the analysis of psychological security: social security—like today’s social technologies, social change affects the quality of life of a country’s population; social environment, family, immediate environment; the person and his or her own perception of security or insecurity. Social security takes an essential place in every person’s life and is an integral part of a democratic state. It is an integral part of a democratic state. Social support is described as a tool [41,42]. The study of the concept of social security is inseparable from the concept of the welfare state. The most common definition in the scientific literature is Esping-Andersen’s definition of the welfare state, which states that the welfare state can be understood as a commitment of the state “to maintain a certain minimum level of welfare for its citizens” [43]. The state social policy is a set of means of expression of the welfare state, reflecting the goals of social security of the population. It is recognised that better economically developed countries have greater opportunities not only to provide support to the poor but also to pursue preventive social policies that prevent impoverishment.
Aidukaitė et al.’s [43] research revealed that when assessing the volume of social benefits in the EU countries between the old and the new countries, significant differences can be seen. In the EU (27), social benefits accounted for 27.6% of the gross domestic product (GDP). In countries such as Denmark, Finland, and France, this share of aggregated expenditure was more than 30%. In Eastern European countries—Estonia, Latvia, Lithuania, and Romania—it was less than 15%. Lazutka et al. [41], Matulionytė and Navickė [42], Paškevičiūtė and Šileika [44] emphasise the feature of post-communist welfare states—low social benefits, which often do not ensure a minimum standard of living. Balvočiūtė [45] has noted that social security, the targeting and effectiveness of its benefits are the most important means of reducing poverty.
Akizu-Gardoki et al. [46] have noted that social security benefits are rising considering the average income from work, and the income from work is increasing depending on the education and work experience. Many personal, social and economic variables affect life earnings. However, social scholars have long acknowledged the primary role of education. The authors of [46] created a model that assesses the social security system by taking into account the different abilities of employees with low and high qualifications.
However, everyone is in agreement with regard to human resources being one of the key factors that affects the long-term growth of an economy. The economic welfare of any country depends on the income of its residents, i.e., family income, the priorities of the country’s residents and the abilities of these individuals [47]. Okunevičiūtė-Neverauskienė [48] highlighted the impact of the population’s age on the growth of the country’s or city’s economy and the simultaneous increase in their competitiveness. While a larger population that is of employable age undoubtedly creates a potential for a faster development of economy and a strengthening of the social care system, cities that are less attractive in terms of economic, social and cultural conditions face problems caused by emigration. The assessment of urban competitiveness should consider the structure of the employable population because, in the researcher’s view [49], work productivity is mostly affected by residents aged 30–44, whereas 50- to 64-year-olds have a positive effect and those over 65 have a negative effect. With the importance of the labour force constantly increasing, the quality of this labour becomes crucial.
Melnikas identified a new type of society known as the information society. It reflects the transformation of the society itself into a qualitatively new state, as new priority values that express a dominant tendency to create, distribute, use and update new knowledge establish themselves in the life of this society. This society experiences a perception that the key factor in further progress is its ability to initiate, create, distribute and implement the aspiration for new knowledge and the value of establishing these aspirations in all facets of life. This means that the information society, as a new type of society, focuses on essentially new values that cause substantial changes in the entire lifestyle system [13].
There is an extensive corpus of demographic literature on population mortality [50,51], birth-rate, changes in the family model [52,53], migration [54], and population aging [55]. However, research into the changes of the employable population in the context of the above topics is lacking. Average life expectancy, the probable rate of population mortality, is widely used to assess both the health of the population and the general level of public welfare [50]. Mortality and social development theorists generally consider mortality and the structure of mortality causes to be some of the most important indicators of societal development, whereas sudden changes in population and its structure are commonly linked to changes in mortality [56].
Community has always featured as one of the factors shaping lifestyle, sense of nationality, ethnic culture and the order of the state [57]. The competitiveness of community activities is based on the ability to cooperate by taking on the territorial competitiveness skills that include social competitiveness, environmental competitiveness, communication, motivation and commitment; monitoring and critical points; opportunities and information; culture; successful development; progress; and project activities.
In recent years, an increasing number of studies employed reliable demographic data to assess the demographic and economic losses caused by inequality in a population’s health [56].
According to the definition proposed by the World Health Organisation, the state of public health depends on four key factors that are distributed in the following approximate ratios: the role of the healthcare system—20%, environmental influence—20%; congenital factors—10%; lifestyle or a healthy lifestyle—50%. Ivanauskaitė [58] proposes that the health of a population should be evaluated using the following integrated indices: a healthy lifestyle index that incudes physical activity of the population (percentage of physically active people in the last week); percentage of daily smokers (over 15 years of age); alcohol consumption per capita in litres of pure (100%) alcohol; consumption of fresh vegetables and fruits. The second index is the health security level index, which includes healthcare cost per capita; number of doctors per one thousand people; hospital beds per one thousand people; medical diagnostic equipment inventory.
Many theoretical models of economics emphasise the impact that socio-economic factors, such as unemployment, income, and economic inequality, have on migration. Although the majority of emigrants are unskilled workers, the emigration flows of skilled professionals are also high. The decision to emigrate is usually based on economic motives and the incentive of personal or professional self-realisation. However, some emigrants have also identified social and legal insecurity as important factors affecting their migratory behaviour. These processes are increasingly influenced by international migration, which became an integral part of modern societies at the end of the 20th century and the beginning of the 21st century [59].
The concept of urban social environment is very broad and described with reference to a variety of factors. The authors describe the social environment through the following factors: human capital; migration; social burden on the city; urban security, community learning, partnership, and activism; social cultural and sports infrastructure, education, and training system; the psychological climate of the city; the demographic situation of the city; medical security infrastructure, authors of the article focus on the security aspect of the social environment. Security does not only refer to physical security, which is a popular object of discussion and analysis amongst researchers studying urban competitiveness. Authors of the article define security as physical security, public health, social security in cities, educational security, housing acquisition security, income security and psychological security.
2.2. Urban Competitiveness and Its Assessment
The authors of the article define urban competitiveness as the ability of cities to use certain available competitive factors that are created or drawn by the city to ensure the success of its economic, social and environmental system and to maintain and strengthen the city’s competitive position in relation to both the other competing cities and time. This definition allows urban competitiveness to be perceived as a continuous and self-reinforcing process, rather than a finite result, whereby the result also becomes an input that later determines the outcome [60].
Paliulytė [61] demonstrated that cities compete internationally, nationally and regionally. Scholars generally emphasise that cities compete over identical goals that include being attractive to businesses, residents, investments, tourists, national/international projects, etc. It is also important to recognise that cities are becoming more alike in some respects due to globalisation, opportunities afforded by information technology and telecommunications, as well as structural changes (e.g., integration into the EU). Due to the above similarities, urban competition increases further. Given this, Paliulytė [61] and Sinkienė [62] highlight the importance of identifying the specific area of urban competitiveness. Ni et al. [63] emphasised that urban competitiveness is based not on the individual competitive advantages but on their combined effect.
Smart cities [64,65,66,67,68,69] identify the following attributes of urban competition as a process: the ability to decode targeted information, quick and timely response to changes, deployment of innovative and creative solutions, continuous learning, employment of knowledge and networks, focus on smart specialisations, application of sustainable development principles.
The scientific literature does not offer a unified method or model to assess urban competitiveness. Rutkauskas assess the competitiveness of an area in terms of the competitiveness of the activity areas dominant in the country or region, economic relations, and the situation in terms of legal, financial, and environmental aspects, natural resources, and geographical position [10], according to some researchers [14,22,60,70,71,72,73] who assessed urban competitiveness using a set of indicators comprising a complex index.
Sinkienė [62] formulated urban competitiveness models based on a variety of urban competitiveness factors (fundamental and driving or input and outcome). When studying the concept of a smart city, Auci and Mundula [65] additionally assessed the city’s socio-economic issues by analysing individual indicators and by assessing their correlation [68] or by employing various mathematical functions. In addition, the assessment of smart cities often employs the analysis of good examples (cases). Aspects of sustainable development assessment that were studied by Ramanauskienė and Čiegis [12], Biermann et al. [74], Campagnolo et al. [75], Hak et al. [76], Shaaban and Scheffran [77], Shen and Yang [78], Wang et al. [79], and Xavier et al. [80] are those aspects that are directly or indirectly included as factors in the structure of the index, or created by focusing on sustainable urban development. Servetkienė [81] proposes that material welfare could be assessed using integrated indices: (1) index of economic conditions that covers the level of unemployment, employment, average annual rate of inflation, government debt as a percentage of Gross Domestic Product (GDP), tax burden assessment in the country, and the rating of favourable business conditions; (2) living standard index that is calculated by combining GDP per capita expressed in PPS, real volume index, the percentage of population at risk of poverty and social exclusion, ratio of the minimum to the average monthly earnings (AME), the ratio of the average pension to the AME, housing affordability (how many sqm can one person purchase with 12-month earnings), share of living costs (%) on food, housing, utilities, household savings per capita; (3) living conditions index assessed using parameters such as useful space per capita (sqm), housing amenities, share of the households with middle-level income in overcrowded housing, the number of individual cars, personal computers, mobile telephones per 1000 people; (4) differentiation index that is calculated by integrating the inequality (Gini) coefficient, income and consumption differentiation between I and V quintiles or I and X deciles [81]. Other researchers propose to calculate the societal development index (SDI) that includes eight indicators: level of unemployment (%); social security costs compared to GDP (%); poverty risk (%); average probable life expectancy; useful living space per capita, sqm; state and municipal budget allocated for education compared to GDP (%); ratio of research and technological development (RTD) costs to GDP (%); and the corruption perception index [12].
In summary, the scientific literature into the urban competitiveness assessment methods demonstrates that some authors assess urban competitiveness according to one or more indicators; others develop theoretical models of urban competitiveness by building sets of quantitative and qualitative indicators; others assess it using an index or formulate mathematical equations. The assessment of social environment competitiveness in the Baltic capitals will be conducted using the integrated assessment model of urban competitiveness that is based on the principles of sustainable development (MDK) [14]. Factors are grouped into three levels (I level—basic factors; II level—developmental factors; and III level—interactional factors). These factors are structured in accordance with the components of sustainable development (i.e., a vibrant and competitive economy, a healthy environment, social welfare, and ecology).
3. Methodology
Lithuania, Latvia, and Estonia are the three Baltic states that were selected for the study because they are not only neighbouring countries belonging to the Baltic region, but they also have a similar historical past, i.e., they were annexed by the Soviet Union and regained their independence in 1990–1991. After the restoration of independence, the Baltic states experienced a rise in economic problems and a decline in demographic indicators. In 2004, all three countries joined the European Union and the economic situation changed for the better. The growing competitiveness of the region has become one of the highest priorities of the Baltic states. Although the overall competitiveness of the region is rising, the competitiveness of Lithuania, Latvia and Estonia is not equal across the global market. In most world countries, their economically strongest cities are their capitals. Accordingly, this empirical study aims to determine the competitive position and dynamics of the social environment in terms of security in the Baltic capitals during the period of 2011–2019.
The assessment of the competitiveness of a sustainable social environment in terms of security will be carried out on the basis of the MDK model. This model identifies the following factors: basic factors, developmental factors and interactional factors. These factors are structured in accordance with the components of sustainable development.
Scientific literature analysis demonstrated that competitiveness may be assessed using one or several factors or indicators or, in an integrated way, taking into account a group of competitiveness factors. It should be noted that assessing competitiveness in terms of individual factors or indicators may only partly illuminate the issues of competitiveness and cannot guarantee comprehensive results. Accordingly, this assessment of urban social environment competitiveness in terms of security includes a group of interconnected factors.
Scientific literature analysis [67,82,83,84] demonstrated that multicriteria assessment methods can be successfully applied when assessing multidimensional sustainable development processes or socio-economic phenomena because they facilitate the tasks of selection, sorting, ranking, and description. Therefore, to provide the most objective and accurate assessment of the competitiveness of the urban social environment in terms of security, authors of the article chose several multicriteria assessment methods (SAW, COPRAS, and GM) and compared their results. The study was conducted using quantitative data only. An expert survey was not carried out in this research to avoid the influence of subjective opinions in the results of the research. As a result, authors of the article assigned equal weighting factors to all factors. The study consists of the following stages:
In the first stage, the urban social environment competitiveness is calculated in terms of security in accordance with the principles of sustainable development, using the multicriteria assessment method COPRAS.
Data are normalised using the Complex Proportional Assessment (COPRAS) complex proportional method [82,83,84] to transform them into a dimensionless form, using Formula (1):
where ωi—weight of the i-indicator; rij—normalised value of the i-indicator with regard to the j-object.
The priority of objects is then determined. The bigger the Qj, the higher the effectiveness (priority) of the alternative (2).
The utility degree Nj of the alternative aj is determined using Formula (3) as follows:
In the second stage, we calculate the urban social environment competitiveness in terms of security in accordance with the principles of sustainable development, using the multicriteria assessment method GM [85].
The geometric mean (GM) of the normalised indicator values is calculated using the following formula:
In the third stage, the urban social environment competitiveness is calculated in terms of security in accordance with the principles of sustainable development, using the multicriteria assessment method Simple Additive Weighting (SAW) [82,83,84]:
where Sj—multicriteria assessment value of the j-alternative; ωi—weight of the i-indicator (6); rij—normalised value of the i-indicator with regard to the j-alternative.
Initial data are normalised using Formula (7) [82,85]:
where rij—value of the i-indicator with regard to the j-object.
In the fourth stage, the multicriteria methods are compared by calculating the Pearson correlation coefficient and the competitiveness rating mean for the examined period (2011–2019).
4. Research
Studies found in the scientific literature lack a complex assessment of urban social environment competitiveness in terms of security. This article aims to assess cities not in terms of economic or environmental competitiveness, but to determine which city ranks best with regard to social environment competitiveness in terms of security in the Baltic capitals. Security does not only refer to physical security, which is a popular object of discussion and analysis amongst researchers studying urban competitiveness. The authors of the article define security as physical security, public health, social security in cities, educational security, housing acquisition security, income security and psychological security. The research uses the MDK model, which is based on the principles of programmatic goal management, thus making it possible to determine the interrelationships of different levels of factors and the impact on the goal. The use of programmatic targeted management principles provides an opportunity to predict the influence of factors and their importance in achieving the set goal. Additionally, after identifying the weakening/strengthening factors of the final goal, projects are initiated to strengthen or improve the result of the factor.
Analysis of the urbanisation processes in the Baltic capitals reveals that an increasing percentage of the population is living in the cities. However, analysing the dynamics of the city population reveals contrary trends.
Figure 3 demonstrates that the number of residents in Vilnius and Tallinn during the research period increased only slightly (in 2019, Tallinn’s population was more than 10% larger than in 2011, whereas Vilnius’ population increased by almost 3%). In Riga, the population decreased by almost 5%. When examining the population of the cities in terms of gender, in 2019, Tallinn had approximately 7% more men and women living in the city compared to 2011. In Vilnius, there was an increase of approximately 3% in men and approximately 2% in women. The number of men and women decreased in Riga during the examined period, where there was an approximate decrease of 4% in men and an approximate decrease of 5% in women.
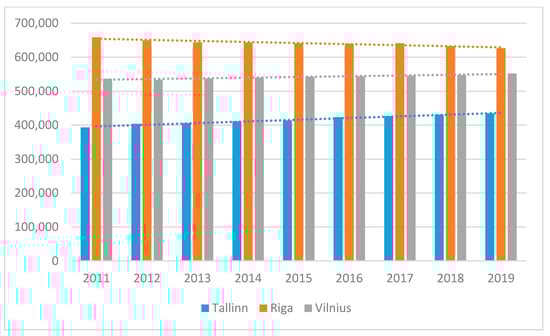
Figure 3.
Number of residents in the Baltic capitals in 2011–2019.
We draw the following conclusions with reference to age groups from 0 to 64: the number in the age group 20–24 is negative in all Baltic capitals (see Figure 4). This trend remains in Riga in the age group 15–54. Tallinn maintains a positive change in the population numbers in all age groups, excluding ages 20–24. Vilnius has a negative change in the population numbers in the age groups 15–24 and 45–54. With regard to crime, the crime rate dropped the most, i.e., by 70%, in Tallinn, as observed in 2019 in comparison with 2011. In Vilnius, it decreased by 30%. In Riga, crime rate is rising with a recorded 4% increase.
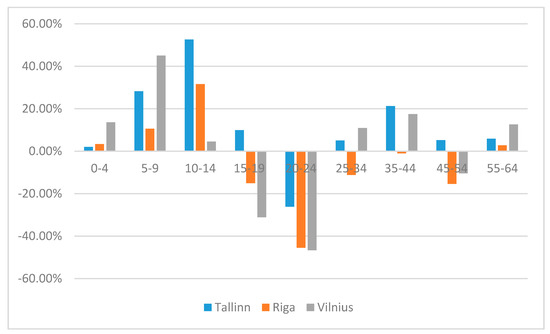
Figure 4.
Population changes with reference to age groups in the Baltic capitals in 2011–2019.
The assessment of the social environment competitiveness in terms of security in the Baltic capitals employed data from 2011–2019 as published by statistical databases (Eurostat and the databases from the Statistics Departments of Lithuania, Latvia and Estonia). Social environment competitiveness in terms of security in the Baltic capitals is assessed using statistical assessment methods. The results depend on the availability of information.
Value of the basic level is calculated using Formula (8):
where M110—factor value of the city’s demographic; M17—factor value of the social, cultural, and sports infrastructure; M19—factor value of the medical security infrastructure; M111—factor value of the educational system.
Data in Figure 5 demonstrate that, based on the basic level of the MDK model, Vilnius leads among the Baltic capitals in the period 2011–2019. By analysing which factors had the greatest impact on this result, it is noticeable that the factors strengthening Vilnius’ position are medical protection infrastructure and the education system. The focus of the urban strategy should be (in terms of the baseline) on the city’s demographic situation.
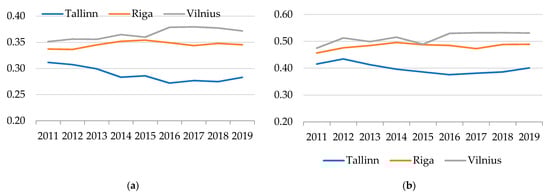
Figure 5.
Basic level assessment of the social environment in the Baltic capitals using COPRAS (a) and GM (b) methods.
The basic factors are those without which the city could not exist. They are of particular importance for the social development of the city. They include the city’s demographic situation, social, cultural, and sports infrastructure, medical protection infrastructure, education, and training system. The research results showed that Vilnius ranks first and Tallinn third in the analysis of the city’s competitive position by including the above-mentioned factors. Based on Figure 5a, according to the data, the competitive positions between Vilnius and Riga were very close and, since 2015, Vilnius has made a bigger gap from Riga. Analysing the possible reasons for this, it is noticeable that since 2015, the population in Vilnius (25–64 years) has started to increase, while in Riga this number has been decreasing. According to the analysis of the scientific literature, it is this age group that has the greatest impact on labour productivity.
Value of the developmental level is calculated using Formula (9):
where M212—factor value of the human capital; M213—factor value of migration; M215—factor value of urban security; M216—factor value of community learning, partnership, and activities; M214—factor value of the city’s social burden.
Data in Figure 6 demonstrate that Tallinn leads in the period of 2011–2019 using both SAW and GM methods. However, the GM method suggests that Vilnius takes the leadership position by a margin in the period of 2012–2014. Development factors are those that directly create the city’s well-being and, at the same time, through measures that allow the effective use of basic factors, shape the city’s competitiveness and include migration, urban security, community learning, partnerships, and active activities, the social burden on the city. Based on Figure 6a, it was observed that the competitive positions of Tallinn and Vilnius were similar in the period 2011–2014, and in 2015 there was the biggest gap between Tallinn and Vilnius. This is the decrease in the number of employees in Vilnius (about 4000 employees), while in Estonia, at the same time, there is an increase in the number of employees (about 26,000 employees). Of course, all factors contribute, but in 2015, the gap between Vilnius and Tallinn is affected by the change in the number of employees.
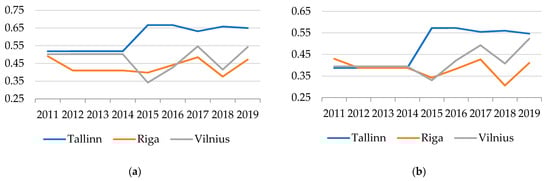
Figure 6.
Developmental level assessment of the social environment in the Baltic capitals using SAW (a) and GM (b) methods.
Based on the study results, it was observed that in 2011–2014, the competitive situation of all the capitals of the Baltic states was similar according to the GV method, but the situation changed after 2014. The reasons for this can be named the migration factor (migration balance in the period 2014–2019 is positive), security in the city, human capital factors.
Data in Figure 7 demonstrate that using different methods leads to different data. When using the COPRAS method, Vilnius leads in the period of 2011–2014, and Tallinn leads in the remaining period, whereas the SAW method suggests that Tallinn leads throughout the examined period (2011–2019). The use of programmatic targeted management principles provides an opportunity to predict the influence of factors and their importance in the positions of competitiveness between cities, and once the final goal weakening/strengthening factors are determined, projects are initiated to strengthen or improve the factors result. Additionally, since the study covers the period 2011–2019, not only attenuating or strengthening factors are identified, but also their changes over time.
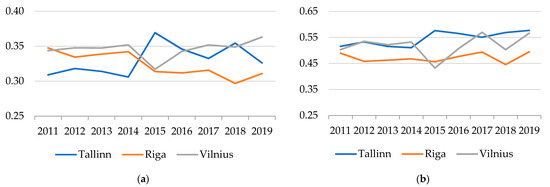
Figure 7.
Assessment of social environment competitiveness in terms of security in the Baltic capitals using COPRAS (a) and SAW (b) methods.
In order to determine the link between the different methods, authors of the article calculate their correlation (Table 1).

Table 1.
Social environment competitiveness values in terms of security in the Baltic capitals.
Data in Table 1 suggest that the strongest correlation is between the results produced by COPRAS and GM methods, whereas the results using COPRAS and SAW methods in the period of 2012–2014 show a very weak correlation.
Data in Table 2 demonstrate a difference in the ranking of the Baltic capitals with regard to their social environment competitiveness in terms of security.
Table 2.
Social environment competitiveness mean values in terms of security in the Baltic capitals and city ranking.
5. Discussion
The quality of life requirements in a contemporary city are integrally linked with a vibrant and competitive economy, a healthy environment, social welfare and ecology. Therefore, urban sustainable development principles are necessary for cities to become and remain competitive in the short and long term.
Cities are rated in accordance with indices that are obtained using different calculations. There are many of them and some are presented in Table 3 and Table 4.
Table 3.
Assessment of the Baltic capitals using various indices in 2021 1.
Table 4.
Assessment of the Baltic capitals using various indices in 2021 2.
Table 4 demonstrates that individual indices suggest different city ratings that depend on the purpose of the index, as well as the used indicators and methods.
Scientific sources also propose many assessment methods, complex indices and offer accounts of extensive research that includes research into smart cities, Lithuanian, Amsterdam and London case studies [73], assessment of urban competitiveness in Lithuania [14,22,86], integrated competitiveness assessment of the Baltic capitals that is based on sustainable development principles [60], ranking of priorities among the Baltic capital cities for the development of sustainable construction [83], Lisbon ranking for smart sustainable cities in Europe [87], a multicriteria evaluation of the European cities’ smart performance, considering economic, social and environmental aspects [88], in the search for the “Smart” source of the perception of quality of life in European smart cities [89], determining factors to become a sustainable smart city, an empirical study in Europe [90], and military and demographic interlinkages in the context of Lithuanian sustainability [91].
The existing methods for assessing urban competitiveness are not suited for the assessment of the social competitiveness of small cities (not included in the NUTS 2 classification) that are constantly changing and environmentally affected environmental entities nor for the identification of a set of factors that determine the social competitiveness of cities. The research results can be used as a means of determining a city’s competitive position in relation to time and other competing cities as a means of identifying factors that strengthen or weaken the sustainable competitiveness of cities, as a tool for justifying strategic urban decisions, and as a means of determining the effectiveness of the strategic decisions taken.
6. Conclusions
The increasingly faster process of urbanisation demands that cities ensure a vibrant economy, a healthy environment and social welfare. In order to be competitive by attracting the most people, cities must identify the factors influencing people’s decisions, monitor these trends and make timely changes.
When people consider living in a particular city, one of the most important factors affecting their decision is the feeling of security. Most scholars assessing the competitiveness of a territory define security as physical security or public health. However, the authors of the article expand the concept of security beyond physical security (i.e., crime rates) by including aspects of education, employment, housing, public health, the social welfare system, migration flows, and psychological security. Personal security is one of the many factors that must be evaluated in an integrated way when creating an urban competitive strategy.
The competitiveness of the urban social environment in terms of security is influenced by many factors. Analysing a single competitiveness factor cannot reflect all the issues of urban social environment competitiveness in terms of security. A comprehensive analysis of competitiveness requires a systemic examination of factors that are interconnected and that shape an integral socio-economic system of a city. The sum of their effects influences the overall competitiveness. Due to competitiveness covering many factors of competitiveness as well as their direct and indirect links, the analysis of the competitiveness issues requires a comprehensive approach. The implementation of sustainable development principles in the city is considered a necessary condition for the city to be competitive.
The assessment of the competitiveness of the social environment in terms of security in the Baltic capitals using the MDK model, which was based on the principle of programmatic targeted management, made it possible to predict the influence, importance, and changes in factors during the researched period.
This empirical research into the Baltic capitals demonstrated that the most competitive social environment in terms of security was found in Vilnius, based on the results using COPRAS and GM methods, and Tallinn, based on the SAW method.
The assessment of the competitiveness of the urban social environment in terms of security made it possible not only to assess the city’s competitive position and changes over time, but also to identify the city’s weaknesses and to strengthen the relevant factors at individual levels, which is crucial for future urban planning. The authors of the article presented an integrated assessment of the social environment competitiveness in terms of security in the Baltic capitals by detailing its levels (basic, developmental, interactional). Future research could include the assessment of economic environment competitiveness and environmental competitiveness. Furthermore, the authors of the article could assess urban competitiveness in certain periods, e.g., the economic crisis and specific events.
Author Contributions
Conceptualisation, R.Č. and I.M.-K.; methodology, R.Č.; software, R.Č.; validation, R.Č. and I.M.-K.; formal analysis, I.M.-K.; investigation, R.Č.; resources, R.Č. and I.M.-K.; writing—original draft preparation, R.Č.; writing—review and editing, I.M.-K.; visualisation, R.Č.; supervision, I.M.-K. Both authors have read and agreed to the published version of the manuscript.
Funding
This research received no external funding.
Institutional Review Board Statement
Not applicable.
Informed Consent Statement
Not applicable.
Data Availability Statement
The data of this study are available from the authors upon request.
Conflicts of Interest
The authors declare no conflict of interest.
References
- Arbušauskaitė, N.; Juščenko, A.L. The Social-Demographic Analysis of Cemetery Data: Particularity and Results. Reg. Form. Dev. Stud. 2013, 2, 6–17. [Google Scholar] [CrossRef][Green Version]
- Li, Y.; Qin, M. Study on urbanization process evaluation and provincial comparison. Grey Syst. Theory Appl. 2014, 4, 13–23. [Google Scholar] [CrossRef]
- Connolly, C.; Keil, R.; Ali, S.H. Extended urbanisation and the spatialities of infectious disease: Demographic change, infrastructure and governance. Urban Stud. 2021, 58, 245–263. [Google Scholar] [CrossRef]
- Henderson, J.V.; Storeygard, A.; Weil, D.N. Measuring Economic Growth from Outer Space. Am. Econ. Rev. 2012, 102, 994–1028. [Google Scholar] [CrossRef]
- Singhal, S.; Berry, J.; McGreal, S. A Framework for Assessing Regeneration, Business Strategies and Urban Competitiveness. Local Econ. J. Local Econ. Policy Unit 2009, 24, 111–124. [Google Scholar] [CrossRef]
- Xu, B.; Watada, J. Identification of regional urbanization gap: Evidence of China. J. Model. Manag. 2008, 3, 7–25. [Google Scholar] [CrossRef]
- Witcher, P. The World Urban Forum: Ideas on the Future of the World’s Cities; UN Chron: New York, NY, USA, 2006; Volume 2. [Google Scholar]
- Wolf, M. Rethinking Urban Epidemiology: Natures, Networks and Materialities. Int. J. Urban Reg. Res. 2016, 40, 958–982. [Google Scholar] [CrossRef]
- Žalevičienė, A.; Čiegis, R. Darnus miestų vystymasis ir europos sąjungos investicijų įsisavinimas. Manag. Theor. 2012, 1, 42–51. [Google Scholar]
- Rutkauskas, A.V. On the Sustainability OF Regional Competitiveness Development Considering Risk/Apie Regiono Konkurencingumo Plėtros Tvarumą Atsižvelgiant Į Riziką. Technol. Econ. Dev. Econ. 2008, 14, 89–99. [Google Scholar] [CrossRef]
- Zhao, C.-R.; Zhou, B.; Su, X. Evaluation of Urban Eco-Security—A Case Study of Mianyang City, China. Sustainability 2014, 6, 2281–2299. [Google Scholar] [CrossRef]
- Ramanauskienė, J.; Čiegis, R. Integruotas darnaus vystymosi vertinimas: Lietuvos atvejis. Vadyb. Moksl. Stud. Kaimo Verslų Infrastruktūros Plėtrai 2011, 2, 39–49. [Google Scholar]
- Melnikas, B. Urbanizacijos procesai šiuolaikinių globalizacijos, Europos integracijos ir žinių visuomenės kūrimo iššūkių kontekste. Theor. Pract. J. 2013, 2, 23–41. [Google Scholar]
- Činčikaitė, R.; Paliulis, N. Assessing Competitiveness of Lithuanian Cities. Econ. Manag. 2013, 18, 490–500. [Google Scholar] [CrossRef][Green Version]
- Wu, J. Urban ecology and sustainability: The state-of-the-science and future directions. Landsc. Urban Plan. 2014, 125, 209–221. [Google Scholar] [CrossRef]
- Wei, Y.; Huang, C.; Lam, P.T.; Yuan, Z. Sustainable urban development: A review on urban carrying capacity assessment. Habitat. Int. 2015, 46, 64–71. [Google Scholar] [CrossRef]
- Pivorienė, J. Global Education and Social Dimension of Sustainable Development. Soc. Ugdym. 2014, 39, 39–47. [Google Scholar] [CrossRef]
- Marin, C.; Dorobanţu, R.; Codreanu, D.; Mihaela, R. The Fruit of Collaboration between Local Government and Private Partners in the Sustainable Development Community Case Study: County Valcea. Acad. Econ. Stud. Rom. 2012, 15, 93–98. [Google Scholar]
- Cioca, L.-I.; Ivascu, L.; Rada, E.C.; Torretta, V.; Ionescu, G. Sustainable Development and Technological Impact on CO2 Reducing Conditions in Romania. Sustainability 2015, 7, 1637–1650. [Google Scholar] [CrossRef]
- Estêvão, R.S.; Ferreira, F.A.; Rosa, Á.A.; Govindan, K.; Meidutė-Kavaliauskienė, I. A socio-technical approach to the assessment of sustainable tourism: Adding value with a comprehensive process-oriented framework. J. Clean. Prod. 2019, 236, 117487. [Google Scholar] [CrossRef]
- Newman, P.; Kenworthy, J. Sustainability and Cities: Overcoming Automobile Dependence; Island Press: Washington, DC, USA, 1999; pp. 219–226. [Google Scholar]
- Bruneckiene, J.; Guzavicius, A.; Činčikaitė, R. Measurement of Urban Competitiveness in Lithuania. Eng. Econ. 2010, 21, 493–508. [Google Scholar]
- Snieška, V.; Zykiene, I. The Role of Infrastructure in the Future City: Theoretical Perspective. Procedia-Soc. Behav. Sci. 2014, 156, 247–251. [Google Scholar] [CrossRef][Green Version]
- Barbier, E.B.; Burgess, J.C. The Sustainable Development Goals and the systems approach to sustainability. Econ. Open-Assess. E-J. 2017. [Google Scholar] [CrossRef]
- Panda, S.; Chakraborty, M.; Misra, S. Assessment of social sustainable development in urban India by a composite index. Int. J. Sustain. Built Environ. 2016, 5, 435–450. [Google Scholar] [CrossRef]
- Melnikas, B.; Tumalavičius, V.; Šakočius, A.; Bileišis, M.; Ungurytė-Ragauskienė, S.; Giedraitytė, V.; Prakapienė, D.; Guščin-skienė, J.; Čiburienė, J.; Dubauskas, G.; et al. Saugumo iššūkiai: Vadybos tobulinimas, Vilnius, Lithuania. 2000, pp. 1–494. Available online: https://vb.mruni.eu/object/elaba:76330940/76330940.pdf (accessed on 20 June 2021).
- Michailovič, I. Nusikalstamumo baimės šiuolaikinėje miesto visuomenėje problematika. Teisės Probl. 2012, 77, 53–71. [Google Scholar]
- Glassner, B. The Culture of Fear: Why Americans are Afraid of the Wrong Things; Hachette: London, UK, 2010. [Google Scholar]
- Balčaitė, S. Miesto Baimės Teritorinė Raiška: Uždarų Gyvenviečių Sklaida Lietuvoje; Vilnius, Lithuania. 2020, pp. 29–44. Available online: http://www.demografija.lt/download/03Balcaite_2020.pdf (accessed on 20 June 2021).
- Dzhamalova, B.B.; Magomedov, B.B.; Amirkhanov, G.B.; Ramazanova, A.A.; Suleymanov, P.K. Anthropological mechanisms of self-management of personality behavior. Int. Rev. Manag. Mark. 2016, 6, 383–389. [Google Scholar]
- Wang, J.; Long, R.; Chen, H.; Li, Q. Measuring the Psychological Security of Urban Residents: Construction and Validation of a New Scale. Front. Psychol. 2019, 10, 2423. [Google Scholar] [CrossRef]
- Foster, S.; Hooper, P.; Knuiman, M.; Giles-Corti, B. Does heightened fear of crime lead to poorer mental health in new suburbs, or vice versa? Soc. Sci. Med. 2016, 168, 30–34. [Google Scholar] [CrossRef]
- Curiel, R.P.; Bishop, S. Modelling the fear of crime. Proc. R. Soc. A Math. Phys. Eng. Sci. 2017, 473, 20170156. [Google Scholar] [CrossRef]
- Martin, M.; Maddocks, E.; Chen, Y.; Gilman, S.; Colman, I. Food insecurity and mental illness: Disproportionate impacts in the context of perceived stress and social isolation. Public Health 2016, 132, 86–91. [Google Scholar] [CrossRef]
- Tseng, K.K.; Park, S.H.; Shearston, J.A.; Lee, L.; Weitzman, M. Parental Psychological Distress and Family Food Insecurity: Sad Dads in Hungry Homes. J. Dev. Behav. Pediatr. 2017, 38, 611–618. [Google Scholar] [CrossRef]
- Newman, A.; Donohue, R.; Eva, N. Psychological safety: A systematic review of the literature. Hum. Resour. Manag. Rev. 2017, 27, 521–535. [Google Scholar] [CrossRef]
- Chen, J.; May, D.R.; Schwoerer, C.E.; Augelli, B. Exploring the Boundaries of Career Calling. J. Career Dev. 2016, 45, 103–116. [Google Scholar] [CrossRef]
- Carmeli, A. Social Capital, Psychological Safety and Learning Behaviours from Failure in Organisations. Long Range Plan. 2007, 40, 30–44. [Google Scholar] [CrossRef]
- Liu, S.; Hu, J.; Li, Y.; Wang, Z.; Lin, X. Examining the cross-level relationship between shared leadership and learning in teams: Evidence from China. Leadersh. Q. 2014, 25, 282–295. [Google Scholar] [CrossRef]
- Blynova, O.Y.; Holovkova, L.S.; Sheviakov, O.V. Philosophical and Sociocultural Dimensions of Personality Psychological Security. Anthr. Meas. Philos. Res. 2018, 73–83. [Google Scholar] [CrossRef]
- Lazutka, R.; Žalimienė, L.; Skučienė, D.; Ivaškaitė-Tamošiūnė, V. Šumskaitė, Socialinė Parama Lietuvoje: Remiamųjų Padėtis ir Paramos Rezultatai; Socialinių Tyrimų Institutas: Vilnius, Lithuania, 2008. [Google Scholar]
- Matulionytė, R.; Navickė, J. Sąlygų griežtumas socialinės paramos sistemose: Lietuvos ir kitų Europos Sąjungos šalių palyginimas. Soc. Teor. Emp. Polit. Prakt. 2018, 16, 7. [Google Scholar] [CrossRef]
- Aidukaitė, J.; Bogdanova, N.; Guogis, A. Gerovės Valstybės Kūrimas Lietuvoje: Mitas ar Realybė? Lietuvos Socialinių Tyrimų Centras: Vilnius, Lithuania, 2012. [Google Scholar]
- Paškevičiūtė, A.; Šileika, J. Lietuvos Tapsmo Gerovės Valstybe Prieštaros. Ekon. Vadyb. Aktualijos Perspekt. 2013, 1, 8–19. Available online: https://etalpykla.lituanistikadb.lt/object/LT-LDB-0001:J.04~2013~1372367063976/ (accessed on 20 June 2021).
- Balvočiūtė, R. Ar socialinės išmokos mažina gyventojų skurdą? Poveikio lyginamoji analizė senosiose ir Rytų Europos šalyse. Soc. Teor. Emp. Polit. Prakt. 2019, 18, 23–45. [Google Scholar] [CrossRef]
- Akizu-Gardoki, O.; Bueno, G.; Wiedmann, T.; Lopez-Guede, J.M.; Arto, I.; Hernandez, P.; Moran, D. Decoupling between human development and energy consumption within footprint accounts. J. Clean. Prod. 2018, 202, 1145–1157. [Google Scholar] [CrossRef]
- Gižienė, Ž.; Simanavičienė, V. Žmogiškųjų išteklių ekonominis vertinimas. Econ. Manag. 2009, 14, 237–245. [Google Scholar]
- Laima Okunevičiūtė-Neverauskienė, A.P. Gyventojų užimtumo pokyčių diferenciacijos. Reg. Form. Dev. Stud. 2017, 3, 71–85. [Google Scholar]
- Poot, J. Demographic Change and Regional Competitiveness: The Effects of Immigration and Ageing; University of Waikato: Hamilton, New Zealand, 2007; p. 17. [Google Scholar]
- Grigoriev, V.M.; Jasilionis, P.; Stumbrys, D.; Stankūnienė, D.; Shkolnikov, V. Individualand area-level characteristics associated with alcohol-related mortality among adult Lithuanian males: A multilevel analysis based on census-linked data. PLoS ONE 2017, 12, e0181622. [Google Scholar] [CrossRef]
- Jasilionis, D.; Stankūnienė, V.; Maslauskaitė, A.; Stumbrys, D. Lietuvos Demografinių Procesų Diferenciacija; Lithuanian Social Research Centre: Vilnius, Lithuania, 2015. [Google Scholar]
- Stankūnienė, V.; Baublytė, M.; Žibas, K.; Stumbrys, D. Lietuvos Demografinė Kaita. Ką Atskleidžia Gyventojų Surašymai; Kaunas: Vilnius, Lithuania, 2016. [Google Scholar]
- Stankūnienė, M.; Maslauskaitė, V.; Baublytė, A. Ar Lietuvos Šeimos Bus Gausesnės? Lietuvos Socialinių Tyrimų Centras: Vilnius, Lithuania, 2013. [Google Scholar]
- Klüsener, S.; Stankūnienė, V.; Grigoriev, P.; Jasilionis, D. Emigration in a Mass Emigration Setting: The Case of Lithuania. Int. Migr. 2015, 4, 1–15. [Google Scholar]
- Kanopienė, S.; Mikulionienė, V. Gyventojų senėjimas ir jo iššūkiai sveikatos apsaugos sistemai. Gerontologija 2006, 7, 188–200. [Google Scholar]
- Daumantas, S. Demografinių Pokyčių Įtaka Lietuvos Darbo Ištekliams; Lietuvos Socialinių Tyrimų Centras: Vilnius, Lithuania, 2017; pp. 11–22. [Google Scholar]
- Pylipavičius, V. Bendruomeninio verslumo formavimas ir kaimo vietovių konkurencingumo stiprinimas. Ekon. Vadyb. 2011, 4, 169–178. [Google Scholar]
- Ivanauskaitė, T. Demografinių veiksnių poveikis darniam vystymuisi. Inf. Moksl. 2012, 62, 67–80. [Google Scholar] [CrossRef]
- Lekavičiūtė, E.; Žibas, K. Darbo migracijos procesai Lietuvoje. Liet. Soc. Raida 2017, 6, 54–69. [Google Scholar]
- Činčikaitė, R.; Meidute-Kavaliauskiene, I. An Integrated Competitiveness Assessment of the Baltic Capitals Based on the Principles of Sustainable Development. Sustainability 2021, 13, 3764. [Google Scholar] [CrossRef]
- Piliutytė, J. Miestų konkurencingumo koncepcija ir analizės lygmenys. Viešoji Polit. Adm. 2007, 19, 81–89. [Google Scholar]
- Sinkienė, J. Miesto konkurencingumo veiksniai. Viešoji Polit. Adm. 2008, 25, 68–83. [Google Scholar]
- Ni, P.; Kresl, P.; Li, X. China urban competitiveness in industrialization: Based on the panel data of 25 cities in China from 1990 to 2009. Urban Stud. 2014, 51, 2787–2805. [Google Scholar] [CrossRef]
- Anttiroiko, A.-V.; Valkama, P.; Bailey, S.J. Smart cities in the new service economy: Building platforms for smart services. AI Soc. 2014, 29, 323–334. [Google Scholar] [CrossRef]
- Auci, S.; Mundula, L. Smart Cities and a Stochastic Frontier Analysis: A Comparison among European Cities. 2012. Available online: http://ssrn.com/abstract=2150839Electroniccopyavailableat:https://ssrn.com/abstract=2150839Electroniccopyavailableat:http://ssrn.com/abstract=2150839https://ssrn.com/abstract=2150839Electroniccopyavailableat:http://ssrn.com/abstract=2150839 (accessed on 7 April 2021).
- Bakıcı, T.; Almirall, E.; Wareham, J. A Smart City Initiative: The Case of Barcelona. J. Knowl. Econ. 2013, 4, 135–148. [Google Scholar] [CrossRef]
- Bojic, I.; Lipic, T.; Podobnik, V. Bio-Inspired Clustering and Data Diffusion in Machine Social Networks. Computational Social Networks; Springer: London, UK, 2012; pp. 51–79. [Google Scholar]
- Caragliu, A.; Del Bo, C.F.M.; Nijkamp, P. Smart Cities in Europe. J. Urban Technol. 2011, 18, 65–82. [Google Scholar] [CrossRef]
- Fernandez-Anez, V.; Fernández-Güell, J.M.; Giffinger, R. Smart City implementation and discourses: An integrated conceptual model. The case of Vienna. Cities 2018, 78, 4–16. [Google Scholar] [CrossRef]
- Bruneckienė, J. Šalies Regionų Konkurencingumo Vertinimas Įvairiais Metodais: Rezultatų Analizė ir Vertinimas. Econ. Manag. 2010, 15, 25–31. [Google Scholar]
- Bruneckienė, J.; Činčikaitė, R. Šalies regionų konkurencingumo vertinimas regionų konkurencingumo indeksu: Tikslumo didinimo aspektas. Ekon. Vadyb. 2009, 14, 700–709. [Google Scholar]
- Pabedinskaitė, A.; Činčikaitė, R. Peculiarities of evaluating urban competitiveness. Manag. Eng. 2015, 1, 475–483. [Google Scholar]
- Pabedinskaitė, A.; Karlas, A.; Činčikaitė, R. Evaluation of smart cities. Manag. Eng. 2016, 1, 273–283. [Google Scholar]
- Biermann, F.; Kanie, N.; Kim, R.E. Global governance by goal-setting: The novel approach of the UN Sustainable Development Goals. Curr. Opin. Environ. Sustain. 2017, 26–27, 26–31. [Google Scholar] [CrossRef]
- Campagnolo, L.; Carraro, C.; Eboli, F.; Farnia, L.; Parrado, R.; Pierfederici, R. The Ex-Ante Evaluation of Achieving Sustainable Development Goals. Soc. Indic. Res. 2017, 136, 73–116. [Google Scholar] [CrossRef]
- Hák, T.; Janoušková, S.; Moldan, B. Sustainable Development Goals: A need for relevant indicators. Ecol. Indic. 2016, 60, 565–573. [Google Scholar] [CrossRef]
- Shaaban, M.; Scheffran, J. Selection of sustainable development indicators for the assessment of electricity production in Egypt. Sustain. Energy Technol. Assess. 2017, 22, 65–73. [Google Scholar] [CrossRef]
- Shen, J.; Yang, X. Analyzing Urban Competitiveness Changes in Major Chinese Cities 1995–2008. Appl. Spat. Anal. Policy 2014, 7, 361–379. [Google Scholar] [CrossRef]
- Wang, J.; Wei, X.; Guo, Q. A three-dimensional evaluation model for regional carrying capacity of ecological environment to social economic development: Model development and a case study in China. Ecol. Indic. 2018, 89, 348–355. [Google Scholar] [CrossRef]
- Xavier, A.; Freitas, M.D.B.C.; Fragoso, R.; Rosário, M.D.S. A regional composite indicator for analysing agricultural sustainability in Portugal: A goal programming approach. Ecol. Indic. 2018, 89, 84–100. [Google Scholar] [CrossRef]
- Servetkienė, V. Lietuvos Gyventojų Gyvenimo Kokybės Pokyčiai: Statistika ir Real Ybė. Soc. Innov. Glob. Growth 2012, 1, 792–815. Available online: https://etalpykla.lituanistikadb.lt/object/LT-LDB-0001:J.04~2012~1367189104253/ (accessed on 20 June 2021).
- Ginevičius, R.; Podvezko, V.; Mikelis, D. Quantitative Evaluation of Economic and Social Development of Lithuanian Regions. Ekonomika 2004, 65, 67–81. [Google Scholar] [CrossRef]
- Lazauskas, M.; Zavadskas, E.K.; Šaparauskas, J. Ranking of priorities among the baltic capital cities for the development of sustainable construction. E+M Èkon. Manag. 2015, 18, 15–24. [Google Scholar] [CrossRef]
- Zavadskas, E.K.; Turskis, Z. Multiple Criteria Decision Making (Mcdm) Methods in Economics: An Overview/Daugiatiksliai Sprendimų Priėmimo Metodai Ekonomikoje: Apžvalga. Technol. Econ. Dev. Econ. 2011, 17, 397–427. [Google Scholar] [CrossRef]
- Ginevičius, R.; Podvezko, V. The problem of compatibility of various multiple criteria evaluation methods. Bus. Theory Pract. 2008, 9, 73–80. [Google Scholar] [CrossRef]
- Bruneckiene, J.; Činčikaitė, R.; Kilijonienė, A. The Specifics of Measurement the Urban Competitiveness at the National and International Level. Eng. Econ. 2012, 23, 256–270. [Google Scholar] [CrossRef]
- Akande, A.; Cabral, P.; Gomes, P.; Casteleyn, S. The Lisbon ranking for smart sustainable cities in Europe. Sustain. Cities Soc. 2019, 44, 475–487. [Google Scholar] [CrossRef]
- Stanković, J.; Džunić, M.; Džunić, Ž.; Marinković, S. A Multi-Criteria Evaluation of the European Cities’ Smart Performance: Economic, Social and Environmental Aspects. J. Econ. Bus. 2017, 35, 519–550. [Google Scholar] [CrossRef]
- Bolívar, M.P.R. In the search for the ‘Smart’ Source of the Perception of Quality of Life in European Smart Cities. 2019, Volume 1, pp. 3325–3334. Available online: https://scholarspace.manoa.hawaii.edu/handle/10125/59768 (accessed on 7 April 2021). [CrossRef]
- Gil, M.T.N.; Carvalho, L.; Paiva, I. Determining factors in becoming a sustainable smart city: An empirical study in Europe. Econ. Sociol. 2020, 13, 24–39. [Google Scholar] [CrossRef]
- Meidutė-Kavaliauskienė, I.; Dudzevičiūtė, G.; Maknickienė, N. Military and Demographic Inter-Linkages in The Context of the Lithuanian Sustainability. J. Bus. Econ. Manag. 2020, 21, 1508–1524. [Google Scholar] [CrossRef]


Publisher’s Note: MDPI stays neutral with regard to jurisdictional claims in published maps and institutional affiliations. |
© 2021 by the authors. Licensee MDPI, Basel, Switzerland. This article is an open access article distributed under the terms and conditions of the Creative Commons Attribution (CC BY) license (https://creativecommons.org/licenses/by/4.0/).