Abstract
The purpose of this study is to analyze the scope of the expected improvement effect of office buildings and educational research facilities according to green remodeling. Thus, in order to quantitatively grasp the architectural performance of the existing buildings, the building thermal performance, the airtightness, the indoor environment, and the air quality were measured using equipment. The analysis indicated that the envelope performance and the indoor environment were unsatisfactory compared to the current legal standards, and for indoor air quality, CO2 and formaldehyde were measured to be dissatisfactory in some buildings. The energy analysis results indicated that the improvement range differed according to the renovation history for each building, resulting in differences in the energy-saving rate for each alternative. The reduction rates of primary energy consumption using energy simulation were 38.5–67.4% for office buildings and 23.7–66.3% for educational research facilities, and the payback periods were 14 to 27 years for office buildings and 12 to 30 years for educational research facilities. These results are expected to contribute to the activation of green remodeling because they can be used as indicators to predict the expected construction cost, the payback period, and the expected effect required for green remodeling.
1. Introduction
1.1. Background and Purpose
Since the industrial revolution, the average temperature of the Earth has continuously risen as the concentration of carbon dioxide in the atmosphere has increased due to human activities such as the combustion of fossil fuels and changes in land use [1]. South Korea is particularly vulnerable to an energy crisis because it uses a large amount of fossil fuel energy with a high environmental load and is highly dependent on foreign countries for its fossil fuel needs. Additionally, it gets very little of its power from new renewable energy sources [2]. Thus, in order to increase both the efficiency of energy usage and the utilization of new renewable energy sources and minimize greenhouse gas emissions, a road map was prepared that aims for a 37% reduction in greenhouse gas emissions compared to BAU (Business As Usual) by 2030 under the spirit of Low Carbon Green Growth. Furthermore, a basic plan for construction of green buildings that includes target setting and directions for promotion is established every five years under the Green Building Promotion Act [3]. In the first basic plan for green building, to fulfill the obligation to reduce greenhouse gases, the enhancement of the performance standard for each building part was prepared and operated. The area of building permits and construction has decreased since 2015, the number of buildings more than 20 years old since the completion of construction has increased, and the number of buildings with particularly weak insulation performance completed 30 years ago, accounts for about 37% of all buildings. Thus, improving the energy performance of existing buildings to reduce greenhouse gas emissions has become increasingly important. Thus, in order to revitalize the public/private green remodeling project, green building remodeling aging status evaluation and design consulting was conducted from 2015 to 2019 for public buildings with high energy consumption due to low building performance, in an attempt to reduce greenhouse gas emissions [4]. The IEA (International Energy Agency) has described the potential and importance of energy savings in existing buildings for greenhouse gas reduction. Further, in order to alleviate the financial burden of green remodeling, the IEA disclosed national policy contents that provide financial incentives to encourage voluntary green remodeling participation [5]. For low-carbon investment, building energy transition must account for greater advantages than simple macroeconomic considerations. The transition can have many important benefits in terms of factors such as values affecting health, medical expenses, and productivity, by improved air and indoor air quality, rises in property values, and reduced job changes among tenants [6]. Paul [7] considered the characteristics of aging buildings and emphasized the importance of energy audits and reporting of the audit results (such as audit procedures and methods, evaluation of the level of deterioration, and user characteristics). The same authors provided A Guide to Energy Audits as a part of the building technology program of the U.S. DOE (Department of Energy). The guide suggests detailed procedures such as conducting site surveys and data analysis, hiring an energy auditor, reporting, etc. [8]. The Energy Audit Reports comprise the results of the assessment of the level of deterioration of architecture, and MEP (Mechanical, Electrical, Plumbing), operational problems, and improvement directions for each area and component. Zenjun Ma conducted a study examining the methodology of an energy audit, building performance evaluation, economic analysis, energy-saving measurement, and verification for the energy remodeling of existing buildings [9], and there have been international efforts to reduce greenhouse gas emissions in building sectors with various studies such as the study by Emese which presented ways to optimize energy efficiency using simulation [10]. In addition, improving the energy efficiency of existing buildings is a top priority worldwide, and not considering energy efficiency is reported to be a major cause of poor performance in construction projects [11]. It has been shown that even improvements limited to certain parts and materials, as opposed to comprehensive improvements, have resulted in thermal bridges, resulting in significant reductions in energy consumption or no increase in thermal comfort [12].
In addition, the urbanization of modern society and the change in industrial structure have led to an increase in the number of people who spend most of their day in confined spaces such as offices and underground stations. According to the US Human Behavior Pattern Survey, adults spend about 87% of the day in buildings, offices, homes, and schools, and about 6% of the day in public transport or cars [13]. According to a survey conducted by the National Statistical Office in South Korea, the time spent indoors accounts for more than 70% of the day (the time spent indoors: 62.9%; the time spent in transportation vehicles: 7.2%). Accordingly, indoor air pollution problems have become social problems due to dust generated from building materials, furniture, wallpaper, pollutants from harmful components, and fine dust from outside [14]. Further, the indoor air quality (IAQ) of buildings has a great influence on the user’s health and work efficiency, and a long-term stay in a space with many pollutants is related to sick building syndrome [15]. Amirhosein et al. said that the proper application of a ventilation system could mitigate SBS related to indoor air quality, but the application can cause increased energy use [16]. However, it is possible to mitigate annual energy consumption through the Heat Exchanger Ventilation System (HRV, Heat recovery ventilation system) and the Economizer Control of HRV [17,18], or to reduce energy by mixing outdoor air, which is lower than indoor air, with indoor cooling load generated in the spring/autumn season, through the Economizer Control, in the business facilities in South Korea with distinct four seasons [19]. Additionally, changes in the indoor air quality according to the HRV application can be investigated and analyzed by measuring the changes of carbon monoxide (CO), carbon dioxide (CO2), total volatile organic compounds (TVOCs), nitrogen dioxide (NO2), ozone (O3), and radon before and after green remodeling through each technical equipment.
The market interest in remodeling existing buildings with a focus on energy performance depends on the return on investment, so extensive research has been conducted in the form of economic evaluations, which are performed using net present value (NPV) and cost-benefit analysis (B/C) [20]. Studies have shown that remodeling can still be cost-effective and environmentally friendly [21,22,23].
Therefore, in this study, using data on buildings that were remodeled as part of the first basic plan for green buildings (2015–2019), the change in energy performance before and after green remodeling as well as the expected economic effects of remodeling were assessed. This was done by measuring insulation, airtightness, and indoor air quality; the energy performance status of aged buildings; and ECO2, the building energy efficiency rating program. We determine that this data can be used as a foundation for those in charge of the green remodeling business planning in the public office buildings and educational facilities.
1.2. Literature Review
In Section 1.2.1, we examine the trait of energy reduction brought by green remodeling, which is being emphasized as an important GHG (Greenhouse Gases) reduction method. We also explain problems in green remodeling policy enforcement and supportive policy tools surrounding this energy reduction trait. In Section 1.2.2, we explain green remodeling policy of South Korea’s current old building, and support policies to activate green remodeling.
1.2.1. Reduction in Energy Consumption and Green Remodeling Policies
Green remodeling needs to be implemented approximately every 10 to 15 years to maintain the initial performance (reduction in energy usage) of a remodeled building [24]. The reduction in energy consumption observed in such a building may depend on construction quality, site environment, and operational patterns; no two green remodeled buildings are exactly the same [25]. That is, regular EER needs to be carried out in order to maintain the level of intended EER performance, and the actual effect of reduction in energy consumption through EER may vary according to the implementation of EER [26].
Previous studies on the reduction in energy consumption brought about by green remodeling have pointed out that the across-the-board implementation of green remodeling is important, wherein partial improvement in old facilities may encounter problems that make the intended effects of reduction in energy consumption impossible [27,28]. Similarly, the possible appearance of a “Rebound Effect” needs to be considered for the development of pertinent policies despite the partial improvement in the efficiency of energy consumption [28].
Due to the range of uncertainty in green remodeling, Sebi et al. [29] insisted on the necessity of additional policy tools such as subsidies to activate green remodeling projects. Among them, providing subsidies appears to be essential, but doing so may not be sufficiently attractive from the standpoint of the actual performers (the owners of private buildings). China also carried out a pilot project to revitalize the EER of old buildings in Shanghai, Shincheon, Tianjin, and Chongqing, wherein the country encountered problems having to do with the appropriate level of subsidy and economic feasibility of green remodeling [30].
Guo et al. [31] pointed out that local governments in China focused only on the green remodeling area allocated by the central government and did not consider the quality of green remodeling when implementing green remodeling policies. The authors also highlighted the importance of EER experts and performance evaluation of energy consumption in buildings.
Xin et al. [32] stated that systematic evaluation of energy consumption in buildings can be a good strategy to improve the performance and effectiveness of EER. Ciulla et al. [33] proposed that the evaluation of energy consumption in buildings could alleviate any doubts held by owners of old buildings regarding the quality and effectiveness of EER.
1.2.2. Green Remodeling Policies in South Korea
To reduce greenhouse gases, the energy efficiency of existing domestic buildings is an essential factor. Thus, the government and local governments are providing technical and financial support to improve the energy performance of existing buildings. However, at this point, it is difficult to implement and disseminate green remodeling in the private sector since it requires a high initial investment cost and its business feasibility review is not clear. Therefore, the mandatory zero-energy has been enforced for the existing old public buildings with more than 1000 m2 since 2020 and will have been enforced for the private building since 2025. Accordingly, to create promotional cases to spread to the private sector, the government and local governments are implementing policies to support the renovation of buildings shown in Table 1.

Table 1.
Green Remodeling Policy in South Korea.
2. Research Procedures and Methods
Most studies that demonstrate the effects of green modeling mainly focus on reduction in energy consumption and economic feasibility due to insulation, windows, doors, and MEP improvements [12,22,37]. There are also studies that analyze the improvements of indoor environment and comfort levels brought on by green remodeling, but it is limited to residential facilities [20,38]. A few non-residential buildings have been examined but it is limited to 1–3 building, making the examined pool small [12,26].
Therefore, this study has been implemented to plan a “Green Remodeling improvement module”, based on the analysis of not only the energy performance rate, but also the indoor environment and comfort level of 16 old public office and educational buildings.
We plan to analyze the reduction of energy consumption brought on by green remodeling old public office and educational buildings. In the existing building remodeling methodology in foreign countries, the first step is to set up the project goal and conduct a preliminary survey to understand and analyze building operation problems and users’ main interests. The second step is to diagnose building energy data and evaluate building performance. The third step is to evaluate and prioritize the performance of remodeling alternatives through energy simulation and economic analysis. The process of the domestic green remodeling process is similar to the typical foreign process, but service is conducted by additionally confirming the performance of health and safety as well as energy in the process of green remodeling to solve health problems such as seasonal fine dust and yellow dust along with safety problems due to the increased frequency of earthquakes. The buildings that were examined for the case reports were office buildings and educational research facilities, which are overrepresented in the aged current status evaluation and design consulting service of the public building green remodeling project. This evaluation was based on six comprehensive standards: green modeling feasibility, the ripple effect of the project, the performance improvement effect, safety enhancement, improvement of energy performance, and SOC (Social Overhead Capital) facilities for old age life. A field basic survey, measurement of building performance (envelope and air quality, etc.), user’s survey, derivation of improvement part, energy analysis, and feasibility study of the project were conducted according to the following procedures shown in Figure 1 to analyze the expected effects and current status by use.
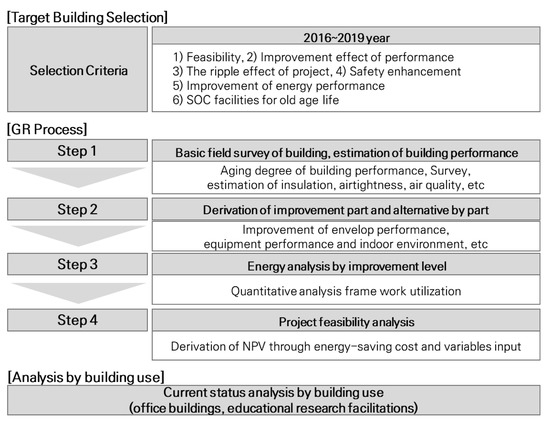
Figure 1.
Research Procedure and Green Remodeling Process.
2.1. Step 1: Basic Field Survey of Building and Estimation of Building Performance
In order to plan the reduction of the emission of greenhouse gases and energy consumption in old public buildings, it is prioritized to grasp the current status of the performance of the existing buildings. Prior to the survey, drawing and energy use data are secured, and a field basic survey plan is established. According to the field survey plan, construction, mechanical, and electrical engineers visually investigate the degree of aging of buildings’ interior/exterior finishing, heat source equipment, transport equipment, and lighting equipment, and regarding facility equipment, the excess of useful life provided by the Public Procurement Service is compared and considered. For the performance of building elements such as windows, exterior walls, and airtightness, which are difficult to visually inspect, as well as the indoor air quality and the comfort level, which affect the health of occupants, measurements will be taken using equipment that has been approved by the Ministry of Environment. To compare the additionally measured data with the actual satisfaction felt by the occupants, a survey was conducted, and surveys on the operation time, personnel changes, and increase or decrease of electronic devices were also conducted and used in the plan of the alternative.
2.2. Step 2: Derivation of Improvement Part and Alternative by Part
Based on the thermal transmittance, window performance, and indoor air quality data-derived drawings and measurements taken according to Step 1, alternative 1 is derived to comply with legal standards according to service performance base date, and alternative 2 shall also be derived in accordance with the response to the policy mandating zero energy for public buildings. The alternatives follow the standards for indoor air quality by use to improve items that directly affect the health of the occupants [39,40].
2.3. Step 3: Energy Analysis by Improvement Level
In order to predict the energy saving according to the derivation of green remodeling alternative, using an ECO2 program, a simulation based on ISO 13790, DIN V 18599, the performance is evaluated and compared with monthly energy demand before and after improvement of the building, energy measured according to system performance, and primary energy measured per unit area per year [41]. Thus, through a field survey of the existing building secured in Step 1, an energy analysis of the existing plan is conducted using the thermal transmittance and facility performance, and in this energy analysis reflecting the alternatives derived from each improvement part in Step 2, energy saving and changes in building energy efficiency rating are analyzed.
2.4. Step 4: Project Feasibility Analysis
By comparing and analyzing costs and benefits by converting them into monetary values, the feasibility of the public investment was determined by reviewing the feasibility of the project in terms of NPV (net present value) and B/C (benefit/cost) by setting 30 years as an analysis period for building projects, depending on the nature of the project based on the general methodology [42] of the preliminary feasibility study of public institutions.
The NPV equation, Equation (1), may be used to analyze the cash flows during the analysis period of the target building and the Full EER model as well as calculate the payback period by comparing the cash flows of the target building with those of each model [43].
Here, PF is the NPV that accumulates the initial investment cost according to the Full EER and the energy cost incurred during operation in the analysis period. The initial cost is the additional construction cost associated with performing the Full EER, and F is the energy consumption cost in the future. Finally, n is the analysis period for NPV calculation and Ir is the discount rate considering the rising energy price.
In Equation (2), Ir is a discount rate calculation method considering an increase in energy price, f is an inflation rate of energy, and r is a real discount rate. In this study, the discount rate considering the rise in energy prices is applied.
The B/C analysis is calculated by dividing the applied total benefit by the applied total cost after the total benefit and total cost were calculated by applying the social discount rate for each year. Equation (3), shown below, is used in B/C analysis. In this equation, the annual benefits (∆B) that will occur in the future are converted at a discount to the present price, and the additional cost of green remodeling (∆C) generated at this point is divided by the total benefit; if the result of the calculation exceeds 1, it is considered economically feasible.
Here, Bt: Present value of benefit, Ct: Present value of cost, r: Social discount rate (interest rate), and n: Analysis year
Based on saving-to-investment ratio (SIR) analysis, which evaluates profits through energy savings on investment costs such as green remodeling design and construction cost, Net Saving analysis selects a method that provides cash flow required for green remodeling before and after the project period.
2.5. Step 5: Analysis of Findings and Policy Suggestions
Based on the energy-saving effect and green remodeling investment cost derived through Steps 1 to 4 for the target buildings, the energy prediction savings and the expected investment cost ranges of public office buildings and educational research facilities are derived. In the discussion section, we explain the limitations of Korea’s green remodeling policy compared to other countries’ green remodeling policy cases, and propose a brief policy improvement direction using the results of this study.
3. A Preliminary Survey of Target Buildings and Selection of Optimal Alternatives
3.1. Overview of Target Buildings
From 2016 to 2019, based on their excessive energy consumption or low envelope performance, several public buildings were selected to improve their energy performance as a requirement [44]. Preliminary surveys have been conducted and alternatives have been suggested for green remodeling, and the overview of the target building is shown in Table 2. The selected buildings are classified into seven office buildings and nine educational research facilities. The total area of the selected office buildings ranges from 556 to 23,272 m2, and the main structure of the office buildings is a reinforced concrete structure that has aged for more than 20 to 30 years. The total area of the educational research facilities ranges from 1948 to 15,420 m2, and the main structures of the educational research facilities are a reinforced concrete structure, cement bricks, and a light weight steel frame that have aged for more than 20 to 30 years.
Table 2.
Target building overview and visual inspection.
3.2. Field Survey
Visual inspection was conducted on the building section (outdoor, indoor) and equipment section (machinery, electricity) of the target building. The results of the visual inspection were classified as good, normal, or poor, and the building sector was evaluated by expert judgment according to the frequency of cracks in the structure, dropping of and damage in the finishing materials, mold and condensation, window aging, and areas with poor airtightness performance. Further, for the mechanical parts in the equipment section, whether or not to replace the system was judged based on the useful lifetime of the system provided by the Public Procurement Service [45]. Electric parts were classified based on the LED replacement rate. The standard LED replacement rate of 80% means that LEDs are replaced in major rooms (office room, classroom, etc.) and are not replaced in spaces with low usage, such as warehouses. The criteria for visual inspection are shown in Table 3, visual inspection images according to the criteria are shown in Table 4, and the results reported for the target buildings according to the criteria are shown in Table 5. The results of evaluating the target buildings according to the visual standards showed that the target buildings were assessed to be 0% for good, 38% for normal, and 62% for poor regarding the exterior of the building; 0% for good, 19% for normal, and 81% for poor regarding the interior of the building; 6% for good, 31% for normal, and 63% for poor regarding the machinery in the equipment section; and 38% for good, 19% for normal, and 43% for poor regarding the electricity in the equipment section. According to the regulations on the promotion of rational energy use of public utilities and public institutions, the LED replacement was first carried out for lighting devices that are easy to construct, and the ratio of ‘good’ and ‘normal’ was found to be high. By contrast, for the improvement of the building sector with a large scope of construction, the improvement of Dryvit exterior wall finishing was mainly conducted in the early 2000s for the purpose of improving the exterior wall performance, but the proportion was very low.
Table 3.
Criteria for visual inspection of aging building.
Table 4.
Visual inspection images according as criteria.
Table 5.
Results of visual inspection in the building and the mechanical and electrical parts.
In order to grasp the conditions of old buildings according to the users of those buildings, a survey on the priorities of dissatisfaction and improvement was conducted. The items for dissatisfaction were presented as winter temperature/humidity, summer temperature/humidity, sound environment, light environment, air quality, and building cleanness, while the priority items for improvement were presented as window and wall insulation, lighting equipment, air conditioner, ventilator, exterior image, and solar radiation control device. The survey results are shown in Table 6. As the most dissatisfactory items for users of office buildings and educational research facilities, indoor air quality was the highest in both, with 42% and 56%, respectively. Thus, as for improvement, the request for improvement of ventilators was the highest with 42% for office buildings and 67% for educational research facilities.
Table 6.
Results of user survey for each building.
3.3. Building Performance Measurement Results
To quantitatively evaluate the conditions of the buildings, the envelope performance, the indoor environment, and the indoor air quality of the buildings were measured. Regarding the measured location, thermal transmittance, corresponding to the envelope performance, was measured in the North, where solar radiation was less affected, to minimize deviation, the window performance was measured by type according to the drawing, and the indoor environment and air quality were measured at 0.9 to 1.5 m away from the floor by applying the standard of the measurement point of the Office Air Management Directive after identifying the installation location through the consultation with the building staff. The measurement appearance is shown in Table 7, and the measurement results and criteria are listed in Table 8.
Table 7.
Measurement of Building Performance.
Table 8.
Result of measurement of building performance and indoor air quality.
The thermal transmittance, the envelope performance of the building, should be measured in the winter, when 15 °C of temperature difference between outdoor and indoor, the prerequisite for measurement, is met, to obtain stably measured reliable data. However, adjustment of the measurement period was inevitable, so when the outdoor temperature was 30 °C or higher during the daytime in the summer, the indoor cooling temperature was set to 18 °C to maximize the temperature deviation, and the measurements were derived. The measurements were 0.75–2.703 W/m2K for the office buildings and 0.335–4.691 W/m2K for the educational research facilities. Thus, in all buildings, the measurements did not satisfy the legal standard, 0.17–0.32 W/m2K of the regional thermal transmittance.
Due to the limitations in access control and cooperation with the measurement room, the measurements of heat transmission coefficient in buildings M12 and M15 were higher, wherein the difference in temperature between the indoor and outdoor environments was not maintained by the varying internal temperature.
Before the airtightness performance test, we conducted the airtightness performance test by enclosing the ceiling, lighting, and wall socket tightly, except for windows, using vinyl and tape. Images (e) and (f) of Table 7 are the preparation and measurement of airtightness performance tests, respectively. For airtightness performance, it was found that the performance of all buildings except for the M14 building was poor because the airtightness performance became significantly reduced due to the separation of window frames caused by the aging of windows, and the perforation of the window frames caused by the installation of coolant pipe. However, in the case of the M14 building, the windows were replaced and the indoor finish work was carried by the manager’s interest in energy saving to meet the standard.
To measure indoor comfort level (PMV PPD) for each measurement room, which is an indoor environment factor, the activity level (Met) was measured by setting it as 1.1 Met suitable for office work and 0.7 Clo of the amount of clothing; the predicted mean vote (PMV) was coded as +3 (hot), +2 (warm), +1 (slightly warm), 0 (normal), −1 (slightly cool), −2 (cool) and −3 (cold), and the range +0.5 to −0.5 was evaluated as a comfort zone. Out of the measured rooms, in the case of aging of buildings and facilities, it was measured to a level of hotness in the summer season beyond the level of satisfaction. For the indoor air quality measurement, carbon dioxide (CO2) was measured to exceed the standard in the office of the office building with high occupancy density, and in the lecture rooms and classrooms among educational research facilities, it was measured to meet the criteria by measuring the rooms in non-occupancy conditions during the vacation. On the other hand, in the reading room of the library, it was 3957 ppm, about four times higher than the standard (1000 ppm), which causes symptoms such as sleepiness, headaches, and dizziness [46]. Formaldehyde (HCHO) usually occurs in the placement of new furniture or adhesives such as glue, and adhesives around the measuring device and interior works caused the excess of standard in some rooms.
In the other items that measured indoor air quality, there was no item that greatly exceeded the standard. In the case of buildings with a high total volatile organic compounds (TVOC), the main cause is rooftop waterproofing work on the measurement day, and it is judged that high fine dust (PM2.5) in rooms was affected by the waste toner from the multi-function printer due to the limited measurement location. Thus, to increase the satisfaction of the indoor thermal environment and the air quality of the building, it is judged to be necessary to increase the envelope performance of the building and install a total heat exchanger.
3.4. Derivation of Alternatives by Improvement Part
The buildings and facilities presented in Table 5 were visually examined. The relatively large-scale buildings and facilities were measured at 62% without improvement, except for partial improvements in performance made for cases of mechanical and electrical facilities, which were accomplished relatively easily. According to the user survey results presented in Table 6, users expressed a high degree of dissatisfaction with the thermal environment and indoor air quality that necessitated improvements. This was attributed to the poor air quality that did not meet the limits set by the standards for indoor air quality and the poor performance of the building envelopes, as presented in Table 8.
Thermal environment, thermal bridge/airtightness, indoor comfort, indoor air quality, and maintenance were derived as improvement elements, while insulation, window, wind break structure, awning, air-conditioning, lighting, ventilation, etc. were derived as application elements, and the improvement elements according to the application elements were compared in Figure 2. The alternative criteria derived as the application elements are presented in Table 9, and the derived alternatives depend on the performance of existing buildings and estimated construction costs by building, but the alternatives were set in such a way as to comply with the thermal transmittance by each region of the building energy-saving design standards and the Passive House design standard (approximately 20% higher than the legal level), as well as regulations on the promotion of the rational energy use of public utilities and public institutions. Alternative 1 was derived to meet the legal standards for buildings and equipment, and Alternative 2 was derived to additionally install new renewable energy in accordance with the zero-energy mandatory policy in public institutions to meet the target of more than 20% energy self-sufficiency. Further, as the service is divided into aging current status evaluation building and the design consulting building, in the design consulting building, the criteria for the thermal transmittance in Alternative 2 were applied to the Passive Housing design standard.
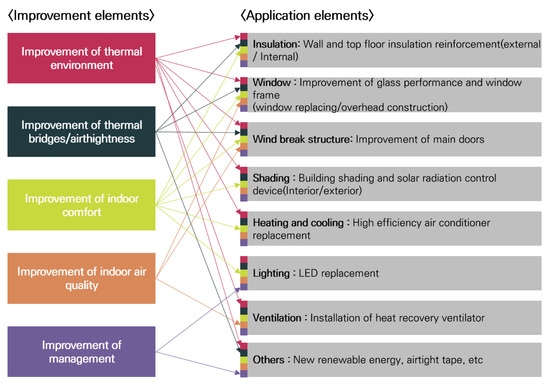
Figure 2.
Application elements according to improvement elements.
Table 9.
Alternative criteria by part.
3.5. Energy-Saving Analysis
To select the best alternative, an energy-saving analysis was conducted through energy simulation of before-improvement and each of Alternatives 1 and 2, and the results are shown in Table 10. Figure 3 is also a graph that matches the energy efficiency rating of buildings in South Korea based on energy analysis results. The energy analysis indicated that, for the office buildings, the primary energy per unit area per year before improvement was 277.2–361.1 kWh/m2y, while it was 100.2–222.1 kWh/m2y in Alternative 2, showing a 38.5–67.4% reduction rate. In addition, the educational research facilities showed a 23.7–66.3% reduction rate from 193.9–391.3 kWh/m2y before improvement to 86.1–290.8 kWh/m2y in Alternative 2. When converting the analyzed primary energy demand per unit area per year into building energy efficiency level, the grade of the office buildings was 1–1++ grade, rising by 2–3 grades compared to before improvement, and the grade of the educational research facilities was 2–1++ grade, rising by 1–5 grades. Alternative 2 was prepared to meet the standards of 1++ or higher building energy efficiency rate and 20% or higher energy self-sufficiency rate of buildings to prepare for the mandatory zero-energy policy for public buildings, but there were buildings with energy efficiency levels that did not meet 1++ grade due to excessive energy consumption caused by the 24-h operation of the computer room in the office buildings as well as the operation of many research equipment in the graduate school, and locations where the installation of new renewable energy was still too small to meet the energy self-sufficiency.
Table 10.
Energy-saving analysis for each building.
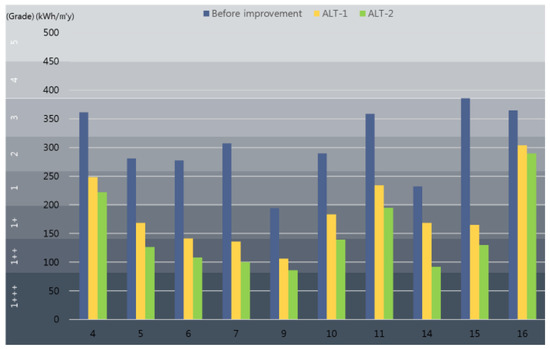
Figure 3.
The energy efficiency rating of buildings in South Korea based on energy analysis results.
3.6. Economic Analysis
To strengthen the preliminary feasibility review of the public institutions’ investment project and improve its financial soundness, an economic analysis was conducted, and shown in Table 11 are the results of the analysis of benefit/cost (B/C) and net present value (NPV), as well as the economic evaluation items of the preliminary feasibility survey, which were conducted by applying the discount rate in consideration of domestic seasonal electricity rates, interest rates, and increasing rates of energy cost [47]. If benefit/cost ≥ 1, it is judged to be economically feasible. M1-3 and M8 are not included in the project and no separate analysis has been conducted. Thus, in the process of calculating cost/benefit while performing the service, it was derived by applying and not applying construction costs to the total construction cost directly related to energy and the finishes of an envelope, which is an aesthetic element that has a small direct impact on energy but is an element that must be applied to energy-saving facilities. An economic analysis of Alt-2 showed that the ratio of benefit/cost in all buildings exceeded 1, and it was thus judged to be economically feasible. M11 with a B/C ratio higher than 3 had a high rate of installment of new renewable energy and LED replacement with a high energy-saving effect. M16 has a higher construction cost for new renewable energy than those of buildings and air conditioners. The payback periods were 14 to 27 years for office buildings and 12 to 30 years for educational research facilities. For buildings that took 12 to 22 years, the period was the payback period according to pure energy construction, not applying the construction cost for envelope finishing. In addition, the construction costs per unit area according to the green remodeling were 446,000 won/m2 for office buildings and 383,000 won/m2 for educational research facilities in the case with construction cost for an envelope, and they were 1,192,500 won/m2 for office buildings and 850,000 won/m2 for educational research facilities in the case without construction cost for an envelope. According to the construction cost analysis report for each type of public building [48], the new construction was found to be capable of improving energy performance at a construction cost of about 50%, with an average cost of 2,120,000 won/m2.
Table 11.
Economic Analysis by Building.
4. Discussion
South Korea presented the “2nd Basic Plan for Green Buildings (2020–2024)” to reduce greenhouse gases in buildings. The country proposed a goal of reducing greenhouse gas emissions from existing buildings by 9,459,000 tCO2 by 2030. However, there have been no active revitalizing policies such as detailed implementation approaches in France, Germany, China, etc. based on green remodeling policies for more than 20 years (the scope of green remodeling and obligations or recommendations thereof), with support for green remodeling construction costs [29].
In the analysis conducted in the present study, buildings used for public office and education exhibited a 20.6–67.4% reduction in energy consumption in terms of Alt-2. Based on this result, one may presume that the green remodeling of entire buildings for public office and education may not bring about a corresponding reduction in energy consumption. However, the results of 13 cases seem promising in terms of the potential reduction in energy consumption through implementation of green remodeling programs. Analysis of additional green remodeling case studies will enable prediction of a statistically significant reduction in greenhouse gas emissions from old buildings for public office and education. In addition, the expansion of such studies to buildings used for a variety of purposes will enable an estimation of the number of cases of green remodeling necessary to accomplish the goal of reducing greenhouse gas emissions via green remodeling of existing buildings in South Korea.
In addition, as mentioned in the literature review, green remodeling revitalizes the private sector, as France, Germany, the United States, and China provide the private sector with subsidies to alleviate the burden of construction costs for green remodeling [29,49]. China experienced problems in determining the appropriate level of subsidy and economic feasibility of green remodeling projects [30]. Currently, only technical support is provided for public buildings in South Korea, and the support (subsidy) for construction cost ceased in 2018 due to budget problems, while support for loan interest and low-interest loans are provided for private buildings. In the present study, the reduction in energy consumption and construction cost associated with green remodeling were analyzed. The total reduction in energy consumption in the period of operation after green remodeling can be calculated as the social cost (the cost for additional social benefits such as reduced greenhouse gas emissions and air pollution resulting from reduced production of energy [50]) to compensate for that cost with subsidies. The cost, to be converted into construction cost per area for green remodeling, can be exploited to determine the appropriate extent of subsidies.
Most studies on the subject of green remodeling focus only on improving energy consumption [51,52]. These studies may lead to the development of new business models. However, the present study intended to present the justification for green remodeling, which is as important as developing a business model. To this end, we measured the indoor air quality and derived factors for improvement through a user survey. The results of the present study could benefit operators and users of buildings if the plans are actually realized through construction. In the present study, we intended to present objective grounds for green remodeling to owners of buildings and public officials in charge of institutions so they can consider revitalization of the market of green remodeling. It may be best to consider the environmental and health issues related to fine particulates, greenhouse gas emissions, etc., rather than focusing purely on the business items related to green remodeling.
Thus, future studies will focus on changes in the thermal environment, indoor air quality, and health that users actually feel, as well as the savings brought about by reduced energy consumption. Since the results of analysis on energy consumption of buildings in South Korea are mainly obtained from the ECO-2 program (the program designed to determine the level of energy consumption efficiency), their practical applicability is limited. Therefore, as green remodeling cases increase, more studies will be implemented on economic feasibility and potential reduction in energy consumption based on actual solid data, not simulation studies.
5. Conclusions
This study investigated public office buildings and educational research facilities that conducted green remodeling design consulting. Visual inspection, building performance, indoor environment, and indoor air quality were surveyed and measured for a total of 16 buildings. Derivation of alternatives, energy performance, and an analysis of the results on the economic feasibility were conducted with a focus on energy saving.
(1) The target buildings are old buildings aged 18–42 years after their completion, which, as a result of visual inspection of the construction and equipment, were judged to be poor due to missing interior and exterior finishes, pollution, etc. In the machinery of the equipment sector, it was judged that ‘normal’ and ‘poor’ examples accounted for 50% and 50%, respectively, due to the replacement of some air conditioners, and in terms of electricity, it was judged that ‘good’ and ‘normal’ were 50% and 50%, respectively, due to many LED improvements which made it easy to perform for the purpose of improving energy efficiency.
(2) The results of measurement of envelope performance, indoor environment, and indoor air quality, which are factors influencing building performance and health, are as follows:
In terms of the envelope performance and the indoor environment of the building, thermal transmittance was 0.335–4.691 W/m2K, which did not meet the legal standards of local thermal transmittance (central 1: 0.17 W/m2K; central 2: 0.24 W/m2K; south: 0.32 W/m2K), and airtightness performance was 8.7–32.16 ACH, which is very poor airtightness performance. Thus, because it was hot in the summer and cold in the winter due to the building’s low envelope performance, PMV PPD, an indicator of the thermal comfort of occupants, was measured as ‘dissatisfaction’, except for in the rooms which have low occupancy density due to the specific nature of the work or because they deal with civil petitioners, in the case of office buildings. In the case of educational research facilities, because human body heat generation was not included due to the measurement taking place during vacation, it was measured as satisfaction in some rooms, but it was measured as dissatisfaction in the teacher’s room and in a reading room in the library.
Thus, depending on the operational status of the building, whether or not it could be occupied was identified, and the decision on the external insulation and internal insulation methods proceeded. Additionally, for the aging of air conditioners, the replacement of high-efficiency air conditioners was suggested as an alternative.
Regarding indoor air quality, rooms with high occupancy density in both public office and educational buildings, such as offices and reading rooms, had high CO2 levels. Rooms with low occupancy density, such as private rooms or the teacher’s office, had CO2 levels that falls within standards. In a reading room of the library, the measurement of CO2 was three to four times higher than the standard, which means that it was measured as ‘very poor’, and such levels could result in health damage such as shoulder stiffness or headache. This is due to the generation of carbon dioxide by breathing, due to the very high occupancy density caused by the small use area per person due to the nature of the reading room. Further, in the case of an office, because the rooms except for the private room have relatively high occupancy density, the measurement was one to two times higher than the standard, resulting in changes in conditions, such as feeling sleepy. That is, it was measured to the level which reduced the efficiency of work. In addition, in environments with adhesives such as new furniture, glue, and bonds, the formaldehyde levels exceeded the standard. In the case of the user survey, a high level of CO2, HCHO, etc. ranked first in dissatisfaction, similar to the result of the measurement of indoor air quality. Next, many complaints about indoor and outdoor temperature and humidity due to low building performance followed. Regarding the priority of improvement, like the rank of dissatisfaction, there were many requests for the improvement of ventilators as the top priority, followed by improvement requests for window and wall insulation. In order to solve the dissatisfaction and its causes, as identified through the user’s survey and the measurement of indoor air quality using the equipment, a heat recovery ventilator for improving ventilation performance was suggested as an alternative for creating a comfortable indoor environment.
(3) After deriving alternative plans based on legal and passive standards for each part, the ECO2 program was used to analyze the energy savings before and after the improvements. The results showed that public office buildings were able to save energy between 38.5% and 67.4% and educational buildings between 23.7% and 66.3%. Both types of building showed similar results, because the same heat transmission rate standards have been applied for buildings in the same region. Further, the result of the economic analysis shows that B/C ranges from 1.08 to 3.75, indicating that the green remodeling project is economically feasible.
Therefore, in terms of the green remodeling design consulting for old buildings, in the existing buildings, the performance measurement results using the visual inspection of buildings and equipment and the survey results were consistent with the improvement measures; there was a high demand for improvement in the indoor environment. Public office buildings have a high occupancy density among office spaces excluding private rooms, or a level that exceeds the carbon dioxide standard by about two times in a space where workers are concentrated, and increases to a level of three to four times the standard value in the reading room of a library among educational and research facilities. In addition, school buildings were measured during the vacation period and measured within the normal range, but in actual operation, it is predicted that the indoor air quality will be enough to reduce the concentration of the occupants in the classroom. Therefore, it suggests that not only energy savings in buildings but also health of occupants should be considered when green remodeling, and it is necessary to improve occupant’s productivity by reviewing and reflecting on improvement of indoor air quality. In this study, the improvement plan derived by reflecting this was shown to be feasible through economic feasibility due to energy saving effects. However, regarding the result derived through the simulation, it is difficult to induce attention to green remodeling from the building’s owner and the market with uncertainty about the actual energy-saving rate and high initial investment cost.
Therefore, the government needs the simulation and comparative analysis on actual energy saving as the research for identifying the effect of actual energy saving by type of buildings with financial support, as well as technical support for green remodeling of the public building [27]. In order to induce participation in the green remodeling of private buildings, the feasibility review is required to reflect the rise in real estate value and rent during the economic analysis. Additionally, the effect of preventing the inflow of external pollutants and improving the indoor air quality through ventilators by improving the airtightness performance occurring in the process of green remodeling on health conditions of occupants (cold, asthma, flu, allergy, etc.) should be accompanied by studies on annual hospital expenses and quality of life. The economic benefits of the productivity improvement caused by keeping from being absent due to diseases should also be studied. The results of these studies are expected to be useful data for promoting the proliferation of green remodeling in private buildings in the future.
Author Contributions
J.K., conceptualization, energy audit, energy simulation, green remodeling model development, and cost–benefit analysis, project administration; S.N., writing—original draft preparation, writing—review and editing, methodology, energy audit, proposal for improvement through analysis of indoor environment and indoor air quality; D.L., energy audit, data collection and analysis, writing—original draft preparation, writing—review and editing. All authors have read and agreed to the published version of the manuscript.
Funding
This research was supported by a grant (code 21AUDP-B151639-03) from Urban Architecture R&D Project Program funded by the Ministry of Land, Infrastructure and Transport of the Korean government.
Data Availability Statement
The data presented in this study are available on reasonable request from the corresponding author.
Conflicts of Interest
The authors declare no conflict of interest.
References
- Liang, J.; Qiu, Y.; James, T.; Ruddell, B.L.; Dalrymple, M.; Earl, S.; Castelazo, A. Do energy retrofits work? Evidence from commercial and residential buildings in Phoenix. J. Environ. Econ. Manag. 2018. [Google Scholar] [CrossRef]
- Joint Association of related Ministries, Amendment to the Basic Roadmap to Achieve the National Greenhouse Gas Reduction Targets in 2030. 2018. Available online: https://www.prism.go.kr/homepage/entire/researchDetail.do (accessed on 31 July 2018).
- Ministry of Land, Infrastructure and Transport, First Green Building Master Plan. 2014. Available online: http://www.molit.go.kr/USR/BORD0201/m_69/DTL.jsp?mode=view&idx=221898 (accessed on 30 December 2014).
- Ministry of Land, Infrastructure and Transport, Second Green Building Master Plan. 2019. Available online: http://www.molit.go.kr/USR/BORD0201/m_69/DTL.jsp?mode=view&idx=239593 (accessed on 16 December 2019).
- International Energy Agency. Policies Database. Available online: https://www.iea.org/policies?page=4&type=Voluntary%20approaches%2CMinimum%20energy%20performance%20standard (accessed on 30 November 2020).
- International Energy Agency. Perspectives for a Clean Energy Transition. The Critical Role of Buildings, Energy Transition Program Outlook to 2020; International Energy Agency: Paris, France, 2019. [Google Scholar]
- Clemet, P. Building Energy Retrofitting: From Energy Audit to Renovation Proposals—The Case of an Office Building in France. Master’s Thesis, KTH School of Architecture and the Built Environment, Stockholm, Sweden, 2012. Available online: http://www.diva-portal.org/smash/get/diva2:559213/FULLTEXT01.pdf (accessed on 8 October 2012).
- Baechler, M.; Strecker, C.; Shafer, J. A Guide to Energy Audits; Pnnl-20956; Pacific Northwest National Laboratory: Richland, WA, USA, 2011. [Google Scholar]
- Ma, Z.; Cooper, P.; Daly, D.; Ledo, L. Existing building retrofits: Methodology and state-of-the-art. Energy Build. 2012, 55, 889–902. [Google Scholar] [CrossRef]
- Bánóczy, E.; Szemes, P.T. Simulation-based optimization in energy efficiency retrofit for office building. In Proceedings of the 2014 IEEE/SICE International Symposium on System Integration, Golden, CO, USA, 13–15 December 2014; pp. 222–227. [Google Scholar] [CrossRef]
- Shao, Y.; Geyer, P.; Lang, W. Integrating requirement analysis and multi-objective optimization for office building energy retrofit strategies. Energy Build. 2014, 82, 356–368. [Google Scholar] [CrossRef]
- Casquero-Modrego, N.; Goñi-Modrego, M. Energy retrofit of an existing affordable building envelope in Spain, case study. Sustain. Cities Soc. 2019, 44, 395–405. [Google Scholar] [CrossRef]
- Klepeis, N.E.; Nelson, W.C.; Ott, W.R.; Robinson, J.P.; Tsang, A.M.; Switzer, P.; Behar, J.V.; Hern, S.C.; Engelmann, W.H. The National Human Activity Pattern Survey (NHAPS): A resource for assessing exposure to environmental pollutants. J. Expo. Sci. Environ. Epidemiol. 2001, 11, 231–252. [Google Scholar] [CrossRef] [PubMed]
- Korea Institute of Science and Technology Information, Focus Science. Available online: http://scent.ndsl.kr/site/main/archive/article/%ED%98%84%EB%8C%80%EC%9D%B8-%ED%95%98%EB%A3%A8-70-%EC%9D%B4%EC%83%81-%EC%8B%A4%EB%82%B4-%EC%83%9D%ED%99%9C-%E6%96%B0-%EA%B3%B5%EA%B8%B0%EC%A0%95%ED%99%94%EB%B2%95?cp=63&pageSize=8&sortDirection=DESC&listType=list&catId=11&artClass=100 (accessed on 30 November 2020).
- Kraus, M.; Šenitková, I.J. Level of Total Volatile Organic Compounds (TVOC) in the context of Indoor Air Quality (IAQ) in Office Buildings. In Proceedings of the IOP Conference Series: Materials Science and Engineering, Kazimierz Dolny, Poland, 21–23 November 2019; Volume 728. [Google Scholar]
- GhaffarianHoseini, A.; AlWaer, H.; Omrany, H.; GhaffarianHoseini, A.; Alalouch, C.; Clements-Croome, D.; Tookey, J. Sick building syndrome: Are we doing enough? Arch. Sci. Rev. 2018, 61, 99–121. [Google Scholar] [CrossRef]
- Jaber, S.; Ezzat, A.W. Investigation of energy recovery with exhaust air evaporative cooling in ventilation system. Energy Build. 2017, 139, 439–448. [Google Scholar] [CrossRef]
- Lim, F.-L.; Hashim, Z.; Said, S.M.; Than, L.T.-L.; Hashim, J.H.; Norbäck, D. Sick building syndrome (SBS) among office workers in a Malaysian university—Associations with atopy, fractional exhaled nitric oxide (FeNO) and the office environment. Sci. Total. Environ. 2015, 536, 353–361. [Google Scholar] [CrossRef]
- Son, J.-E.; Hyun, I.-T.; Lee, J.-H.; Lee, K.H. Comparison of Cooling-Energy Performance Depending on the Economizer-Control Methods in an Office Building. Korean J. Air-Cond. Refrig. Eng. 2015, 27, 432–439. [Google Scholar] [CrossRef][Green Version]
- McLeod, P.; Fay, R. The cost effectiveness of housing thermal performance improvements in saving CO2-e. Arch. Sci. Rev. 2011, 54, 117–123. [Google Scholar] [CrossRef]
- Ott, W.; Bolliger, R.; Ritter, V.; Citherlet, S.; Lasvaux, S.; Favre, D.; Périsset, B.; Almeida, M.G.; Ferreira, M.A.; Ferrari, S. Methodology for Cost-Effective Energy and Carbon Emissions Optimization in Building Renovation (Annex 56); Energy in Buildings and Communities Programme; Universidade do Minho: Braga, Portugal, 2014. [Google Scholar]
- Asdrubali, F.; Venanzi, D.; Evangelisti, L.; Guattari, C.; Grazieschi, G.; Matteucci, P.; Roncone, M. An Evaluation of the Environmental Payback Times and Economic Convenience in an Energy Requalification of a School. Buildings 2020, 11, 12. [Google Scholar] [CrossRef]
- Marrone, P.; Asdrubali, F.; Venanzi, D.; Orsini, F.; Evangelisti, L.; Guattari, C.; Vollaro, R.D.L.; Fontana, L.; Grazieschi, G.; Matteucci, P.; et al. On the Retrofit of Existing Buildings with Aerogel Panels: Energy, Environmental and Economic Issues. Energies 2021, 14, 1276. [Google Scholar] [CrossRef]
- Fabbri, M.; Volt, J.; de Groote, M. The Concept of the Individual Building Renovation Roadmap—An In-Depth Case Study of Four Frontrunner Projects; Buildings Performance Institute Europe: Brussels, Belgium, 2018; p. 82. [Google Scholar]
- Galvin, R.; Sunikka-Blank, M.M. Quantification of (p)rebound effects in retrofit policies—Why does it matter? Energy 2016, 95, 415–424. [Google Scholar] [CrossRef]
- Brom, P.V.D.; Meijer, A.; Visscher, H. Actual energy saving effects of thermal renovations in dwellings—longitudinal data analysis including building and occupant characteristics. Energy Build. 2019, 182, 251–263. [Google Scholar] [CrossRef]
- Kim, J.M.; Nam, S.H. IEQ and energy effect analysis according to empirical Full Energy Efficiency Retrofit in South Korea. Energy Build. 2021, 235, 110629. [Google Scholar] [CrossRef]
- Galvin, R.; Sunikka-Blank, M. Ten questions concerning sustainable domestic thermal retrofit policy research. Build. Environ. 2017, 118, 377–388. [Google Scholar] [CrossRef]
- Sebi, C.; Nadel, S.; Schlomann, B.; Steinbach, J. Policy strategies for achieving large long-term savings from retrofitting existing buildings. Energy 2018, 12, 89–105. [Google Scholar] [CrossRef]
- Hou, J.; Liu, Y.; Wu, Y.; Zhou, N.; Feng, W. Comparative study of commercial building energy-efficiency retrofit policies in four pilot cities in China. Energy Policy 2016, 88, 204–215. [Google Scholar] [CrossRef]
- Liu, G.; Tan, Y.; Li, X. China’s policies of building green retrofit: A state-of-the-art overview. Build. Environ. 2020, 169, 106554. [Google Scholar] [CrossRef]
- Xin, L.; Yan, D.; Yujia, T.; Neng, Z.; Zhe, T. Research on the evaluation system for heat metering and existing residential building retrofits in northern regions of China for the 12th five-year period. Energy 2014, 77, 898–908. [Google Scholar] [CrossRef]
- Ciulla, G.; Galatioto, A.; Ricciu, R. Energy and economic analysis and feasibility of retrofit actions in Italian residential historical buildings. Energy Build. 2016, 128, 649–659. [Google Scholar] [CrossRef]
- Korea Land & Housing Corporation, Public Project Overview. 2020. Available online: https://www.greenremodeling.or.kr/business/bus1000.asp (accessed on 30 November 2020).
- Korea Energy Agency, ESCO: Energy Service Company. 2020. Available online: https://www.energy.or.kr/web/kem_home_new/ener_efficiency/industry_04.asp (accessed on 30 November 2020).
- Seoul Metropolitan Government. 2020 Seoul City Building Energy Efficiency Project (BRP) Loan Support Plan, Notice No. 2020-6384; Seoul Metropolitan Government: Seoul, Korea, 2020. [Google Scholar]
- Liu, Y.; Liu, T.; Ye, S.; Liu, Y. Cost-benefit analysis for Energy Efficiency Retrofit of existing buildings: A case study in China. J. Clean. Prod. 2018, 177, 493–506. [Google Scholar] [CrossRef]
- Jacobs, D.; Wilson, J.; Tohn, E. Health and Home Upgrades. ASHRAE J. 2017, 59, 66–68. [Google Scholar]
- Enforcement Rule of the School Health ACT (2019). Available online: https://elaw.klri.re.kr/eng_mobile/viewer.do?hseq=24786&type=part&key=16 (accessed on 4 April 2021).
- Enforcement Rule of Indoor Air Quality Control ACT (2019). Available online: https://elaw.klri.re.kr/eng_service/lawView.do?hseq=41231&lang=ENG (accessed on 4 April 2021).
- Hoon, J.J. A Study on the Energy Performance Evaluation Criteria and Evaluation Tools of Domestic and Foreign Buildings, Ssangyong Engineering & Construction Technology Research Institute. 2017. Available online: https://www.ssyenc.co.kr/ko/management/tech_ssyenc.asp?menu=1&Year=2017&Season=010007&findtext= (accessed on 6 June 2017).
- Korea Development Institute. A Study on the Modification and Complementation of General Guidelines for the Implementation of Preliminary Feasibility Study for Public and Quasi-Government Projects, 2nd ed.; KDI: Sejong, Korea, 2018. [Google Scholar]
- Guardigli, L.; Bragadin, M.A.; Della Fornace, F.; Mazzoli, C.; Prati, D. Energy retrofit alternatives and cost-optimal analysis for large public housing stocks. Energy Build. 2018, 166, 48–59. [Google Scholar] [CrossRef]
- 2019 Public Building Green Remodeling Support Project, Korea Land & Housing Corporation, Publication No. 2019-44. Available online: https://www.greenremodeling.or.kr/board/boardView.asp?bid=notice&nSeq=2529&page=3&search=sTitle&searchString=&sType=#content (accessed on 11 January 2019).
- Service’s Useful Life, PPS, No.2018-14. Available online: https://www.pps.go.kr/kor/bbs/view.do?bbsSn=0001160368&key=00341 (accessed on 4 April 2021).
- Korea Centers for Disease Control and Prevention, Indoor Air Quality and Health Effects in Public Facilities. Available online: http://www.cdc.go.kr/board.es?mid=a20602010000&bid=0034&act=view&list_no=12194 (accessed on 30 November 2020).
- Kim, J.; Lee, J.; Lee, D. The Economic Comparision through LCC Analysis on each Graded Alternatives for Green Remodeling of Public Building. Korean J. Constr. Eng. Manag. 2018, 19, 38–49. [Google Scholar]
- Public Procurement Service, 2017 Analysis of Construction Expenses Classified by Public Facilities. Available online: http://pcae.g2b.go.kr/pbs/psa/psa0070/index.do (accessed on 30 November 2020).
- Kim, J.; Lim, S. A direction to improve EER (Energy Efficiency Retrofit) policy for residential buildings in South Korea by means of the recurrent EER policy. Sustain. Cities Soc. 2021, 72, 103049. [Google Scholar] [CrossRef]
- Kim, J. Economic Analysis of Zero Energy Building in South Korea. J. Archit. Inst. Korea 2020, 36, 147–157. [Google Scholar] [CrossRef]
- Basińska, M.; Kaczorek, D.; Koczyk, H. Economic and Energy Analysis of Building Retrofitting Using Internal Insulations. Energies 2021, 14, 2446. [Google Scholar] [CrossRef]
- Seeley, C.; Dhakal, S. Energy Efficiency Retrofits in Commercial Buildings: An Environmental, Financial, and Technical Analysis of Case Studies in Thailand. Energies 2021, 14, 2571. [Google Scholar] [CrossRef]


Publisher’s Note: MDPI stays neutral with regard to jurisdictional claims in published maps and institutional affiliations. |
© 2021 by the authors. Licensee MDPI, Basel, Switzerland. This article is an open access article distributed under the terms and conditions of the Creative Commons Attribution (CC BY) license (https://creativecommons.org/licenses/by/4.0/).