1. Introduction
The concept of waste is as old as humanity. With the spread of modernisation, the composition of waste is also constantly changing. Plastic, first produced in the middle of the 19th century, has become an integral part of our lives, and its use is constantly increasing as the population grows [
1]. Plastics made more and more simple and economical have actively contributed to the development of the packaging industry. Plastic packaging materials have many advantages: they are easy to form and have good water and aroma seals. The main disadvantage is that they do not degrade independently, and there are limitations to recycling [
2].
Directive 94/62/EC of the European Parliament and the Council of 20 December 1994 has already drawn attention to the proper management of packaging waste. An EU action plan for the circular economy has also been drawn up [
3]. In favour of the circular economy, the pursuit of recycling is no longer just a legal obligation but also in the self-interest of humanity [
4].
In the best case, disposable plastic packaging materials are recycled. At the same time, energy recovery is a less prioritised but still better solution than if they end up in landfills or, in the worst case, in nature. Furthermore, to increase recycling, a selective waste collection system has been introduced, where waste is sorted by the inhabitants according to material types.
Despite previous efforts, the appropriate recycling value has not yet been achieved in Hungary, as a significant part of beverage packaging waste is still placed in mixed containers, which will be used as alternative fuels, in the best case, and landfills, in the worst case.
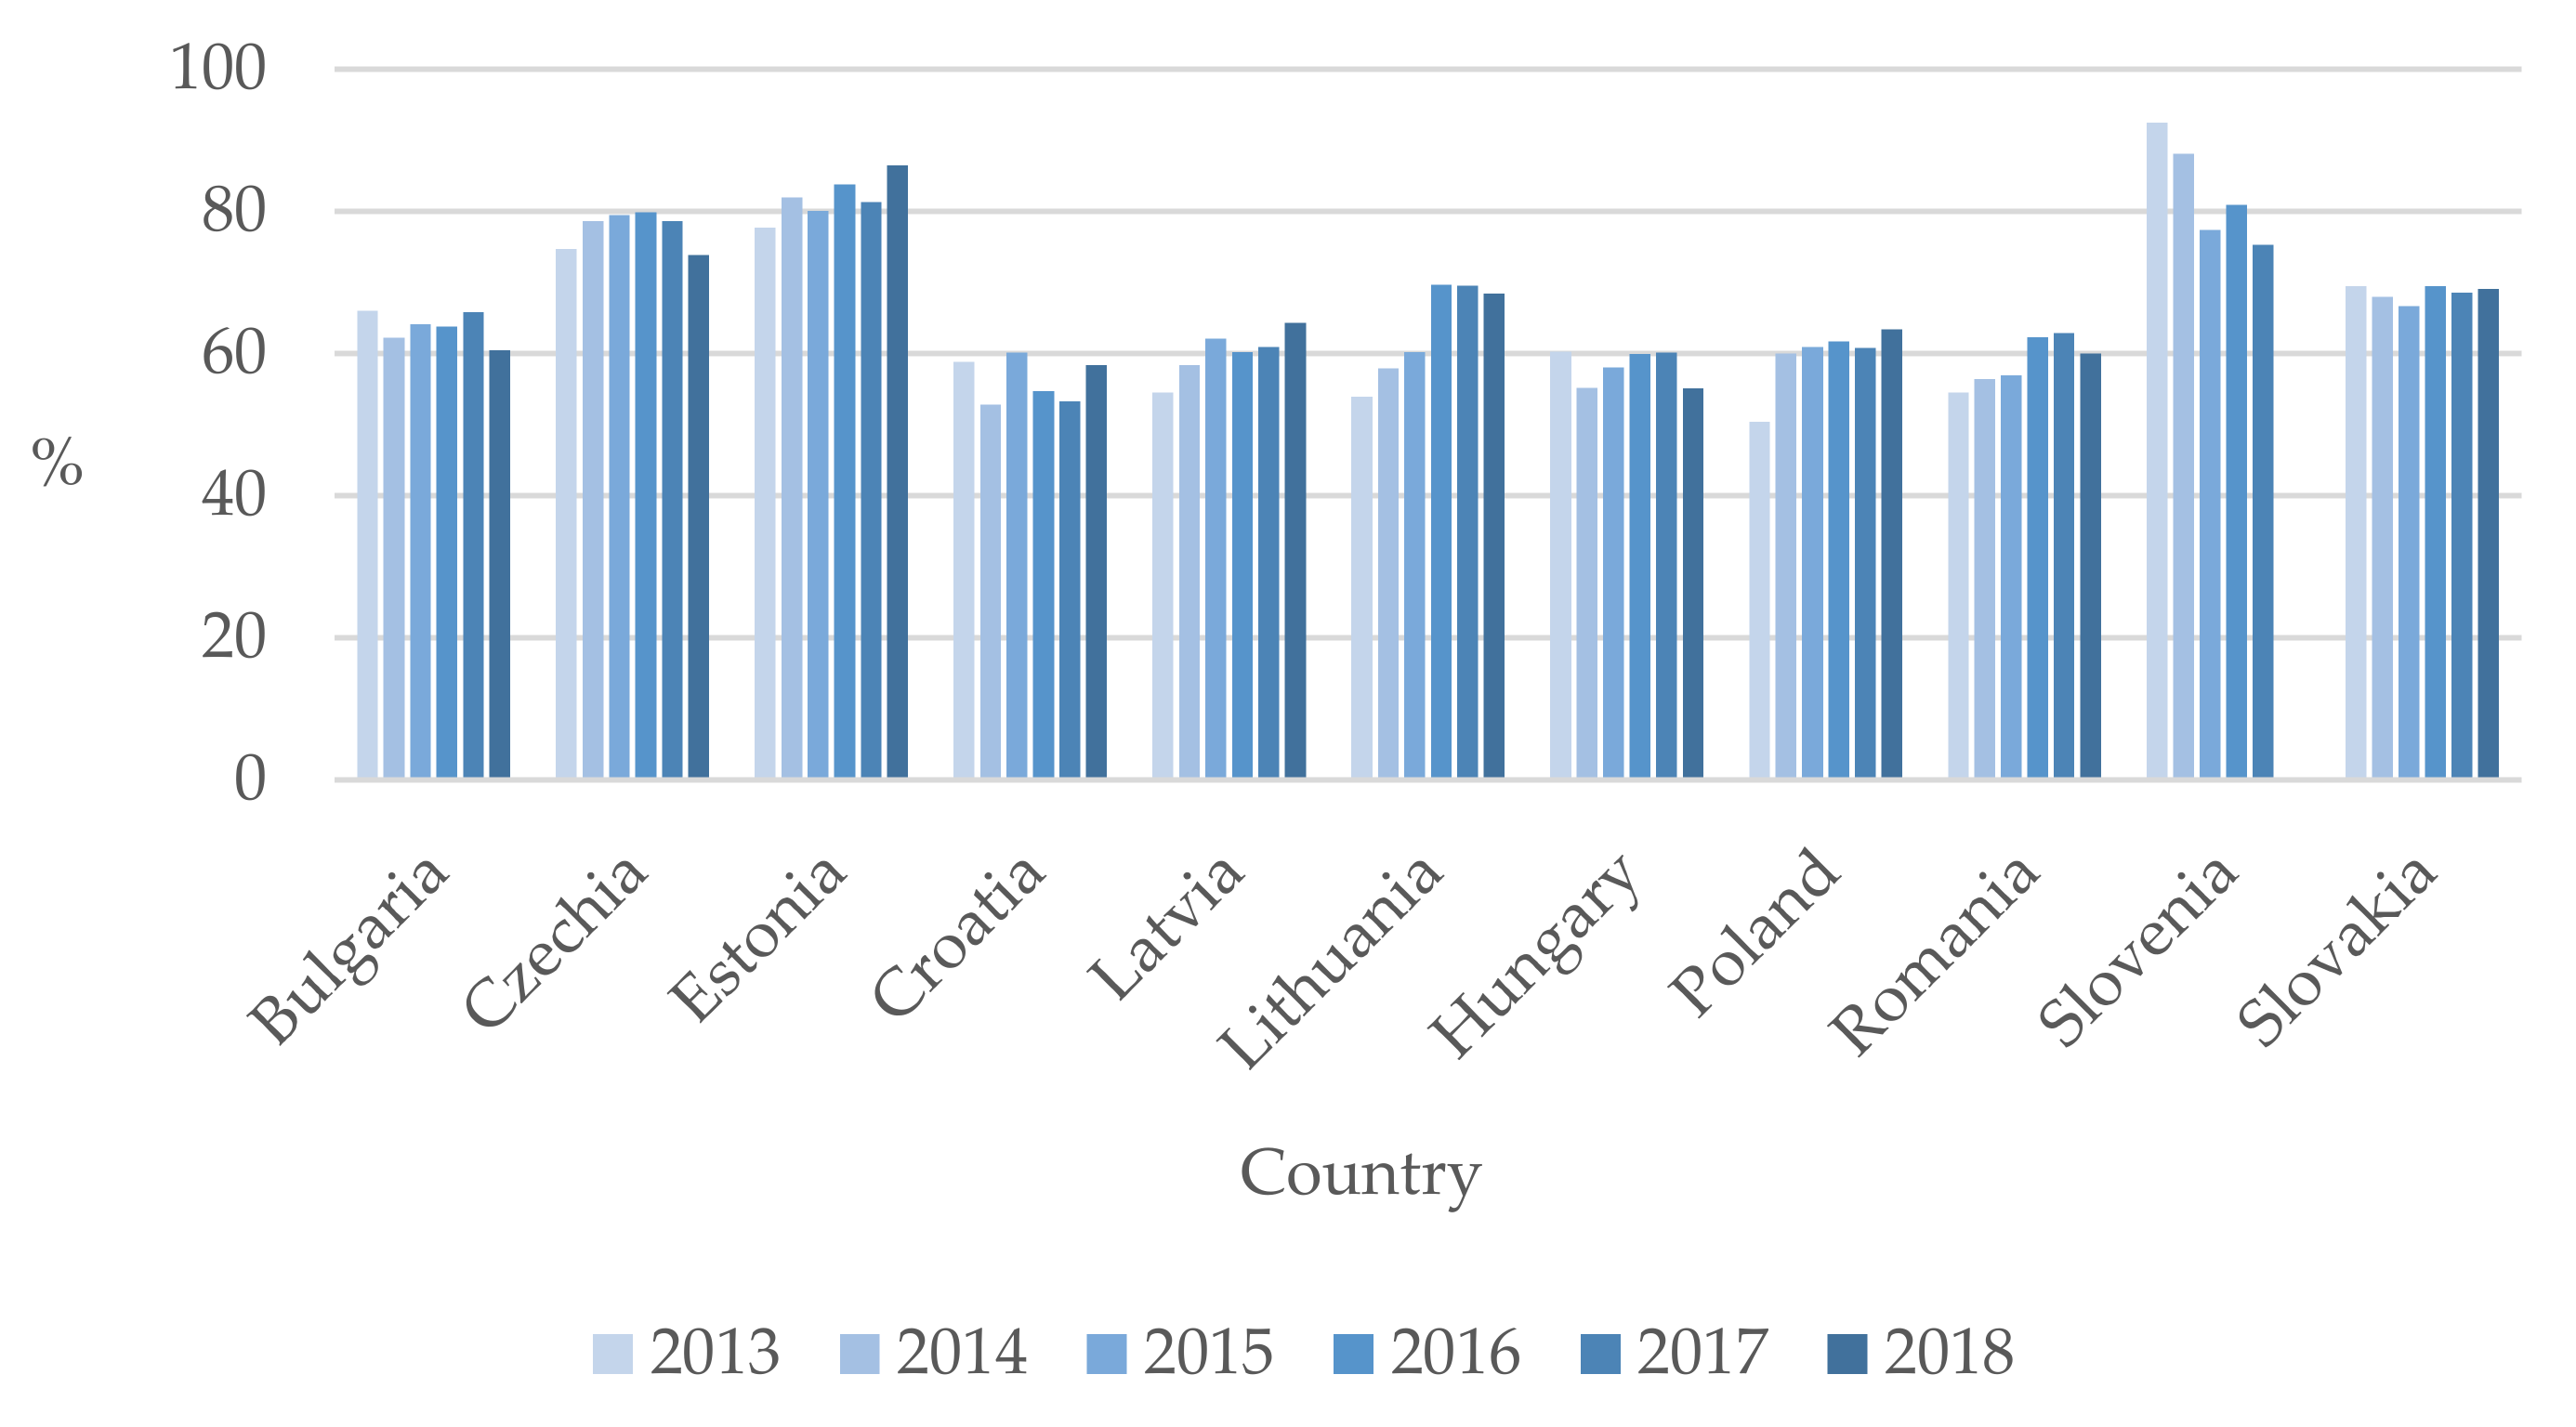
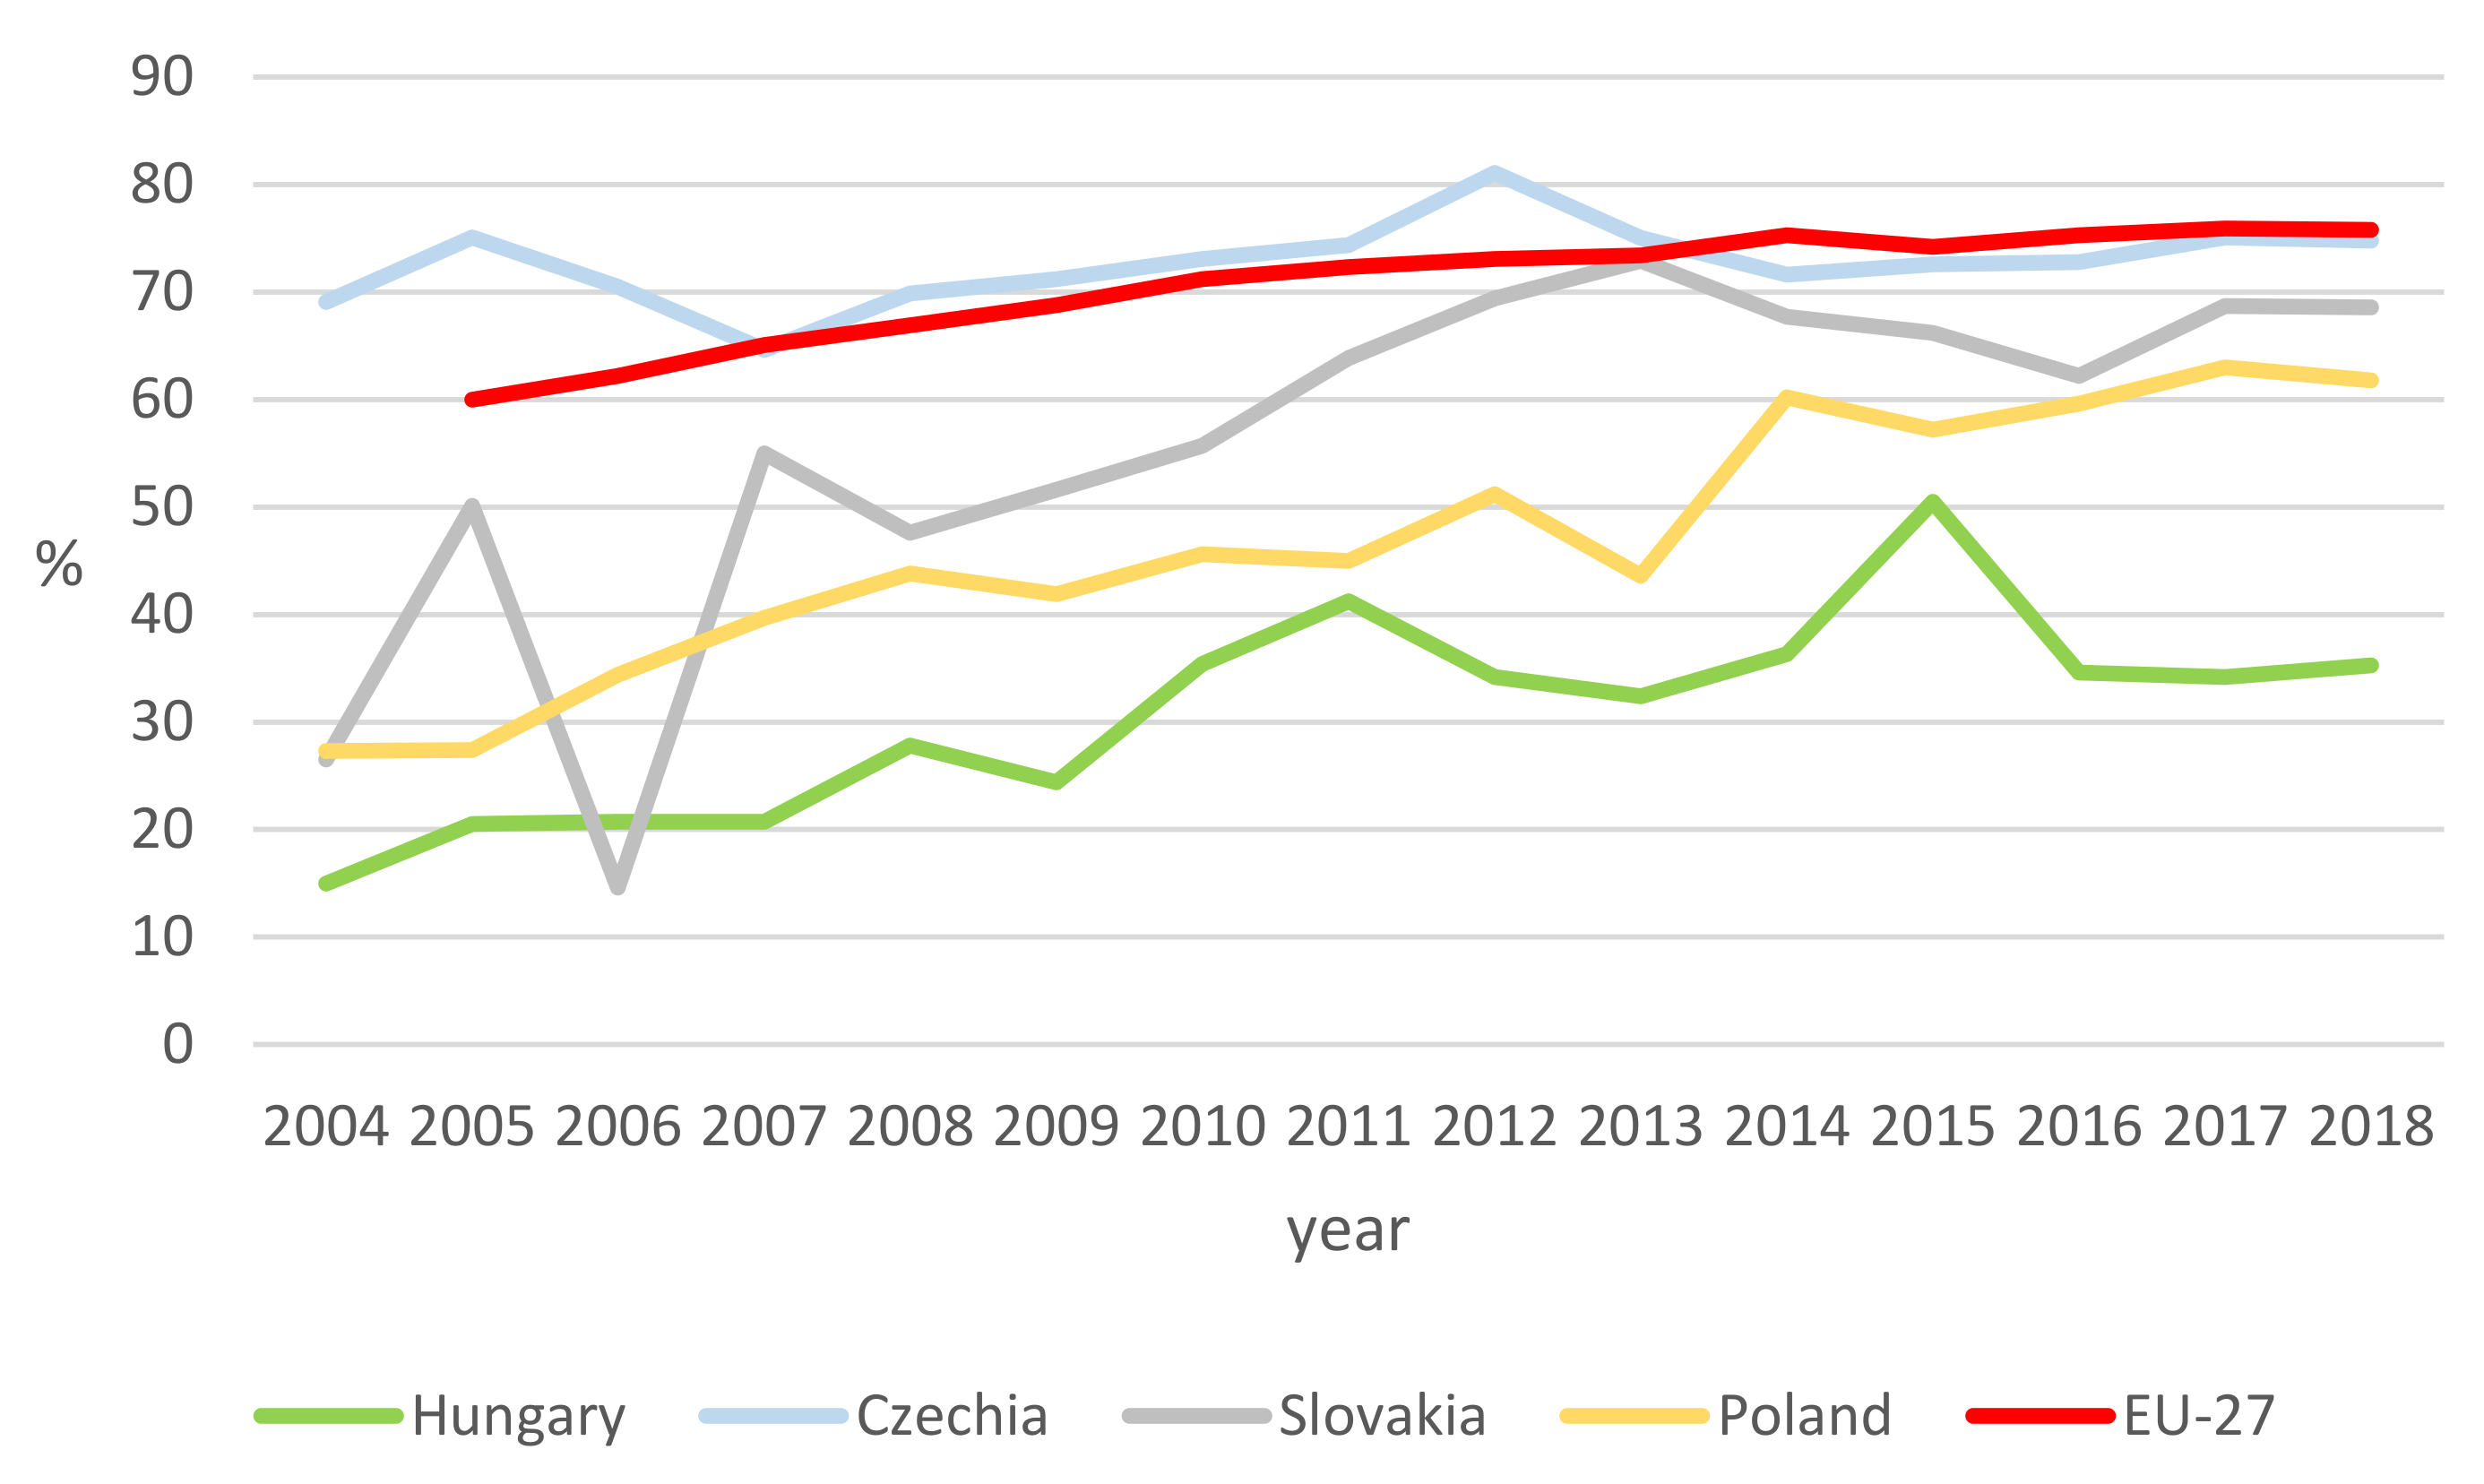
According to Eurostat, Belgium and Finland should recycle 100% of the packaging they produce by 2017, compared to an average of 80% in the EU [
5]. Examining Central and Eastern Europe (
Figure 1), we can state that the Czech Republic and Estonia reach the EU average, while in Hungary, 60% of the generated packaging materials were recycled in 2017.
The deposit fee system has already been introduced in many countries worldwide and led to increased recycling and pollution reduction. In addition, many studies have been conducted on the results of the systems developed in each country [
6,
7,
8,
9], and there are several review articles in the literature comparing the individual systems [
10,
11].
Finland has a long history of deposit systems for refillable bottles. The system was introduced for one-way glass beverage bottles in 2005 and plastic beverage bottles in 2008. Thanks to a well-chosen deposit fee, the redemption rate in both cases was over 90% by 2015 [
12]. In Germany, the redemption system has been effective since the early 2000s, covering metal and glass beverage bottles and plastic (PET) products [
10]. However, from 1 May 2006, retailers (excluding smaller retail outlets) must take back single-use beverage packaging, regardless of the retailer from which it was purchased. Thanks to the regulation, the redemption value for PET bottles has almost reached 100%.
According to the common solution, the deposit fee system consists of two parallel incentives [
6]. First, at the time of purchase, the deposit fee is included in the product’s price, thus indicating the financial burden associated with the reuse of packaging waste. Second, to encourage users, a fee is paid to them upon redemption. With this system, if the end user recovers his waste, he receives a deposit built into the price of the product, so he has no negative economic impact. The optimal amount of the deposit is a key issue for the viability of the system. A sufficiently high deposit fee increases collection efficiency, but above a certain value, it can decrease consumption.
The structure of the incentive scheme is the same in all schemes; the user pays the deposit fee and recovers it in the case of redemption. However, there are differences in the operating environment in each system. For example, Japanese and Chinese scientists distinguish three categories regarding the flow of matter and money [
11,
12,
13]. These are (a) the reverse logistics mode, such as in Germany; (b) the retail recycling mode, such as in Sweden and (c) the repo recycling mode, such as in South Australia.
It has been identified that the role and proper coherence of consumers, traders, recyclers and governments are key to the refund system’s functioning [
14,
15].
To achieve the goals set in the directive on the circular economy and the protection of our environment, the possibility of establishing a deposit fee system for one-way bottles in Hungary was raised.
Based on the literature, linked to the fact that a system can work well if accepted by society, we compiled a questionnaire system to determine the opinion of Hungarian citizens about support for the possible introduction of a deposit fee system.
The research subject is the deposit-refund system of beverage packaging (PET, glass and aluminium) in Hungary. The topicality of the study is given by the fact that the reform of this system is now planned in Hungary. For these changes, it is essential to consider the opinion of the population, which is examined in this study. The research aims to answer the research questions (Q) listed in
Table 1. This table also contains our hypotheses (H) related to the questions.
Based on our analyses, the hypotheses are acceptable. The other part of the study is composed of five sections.
Section 2 presents the recycling rates of certain types of waste in Hungary, compared to other nearby countries.
Section 3 describes the new redemption system planned in Hungary.
Section 4 summarises the questionnaire survey intended to seek public opinion on this planned system and the analysis method carried out on the results of this survey.
Section 5 contains the results based on which our hypotheses are accepted. Finally,
Section 6 discusses the results and their interpretations from previous studies and the working premises. Future research directions are also be highlighted in this section.
2. Recycling Rate of Priority Waste Streams in V4 Countries
As mentioned earlier, the Directive 94/62/EC on packaging and packaging waste has set a recycling rate of 22.5% for plastic packaging waste and 60% for glass and metal packaging waste in EU member states. These expectations will be tightened by 2025 and 2030 (2025: glass 70%, plastic 50%, ferrous metal 70%, aluminium 50%; 2030: glass 75%; plastic 55%, ferrous metal 80%, aluminium 60%).
Directive 2019/904/EU of the European Parliament and of the Council of 5 June 2019 on the reduction of the environmental impact of certain plastic products (“SUP Directive”) requires that the Member States need to ensure 77% separate collection and recycling of the plastic beverage bottles placed on the national market by 2025 and 90% by 2029 [
16]. In addition, Member States should ensure that 25% of PET bottles placed on the market in their territory are made from secondary raw materials from 2025 on, and 30% from 2030 on. The requirement applies to products with a capacity of up to three litres. As a means of achieving these objectives, the SUP Directive proposes introducing a redemption fee (deposit fee) or setting a separate collection target in the producer responsibility scheme.
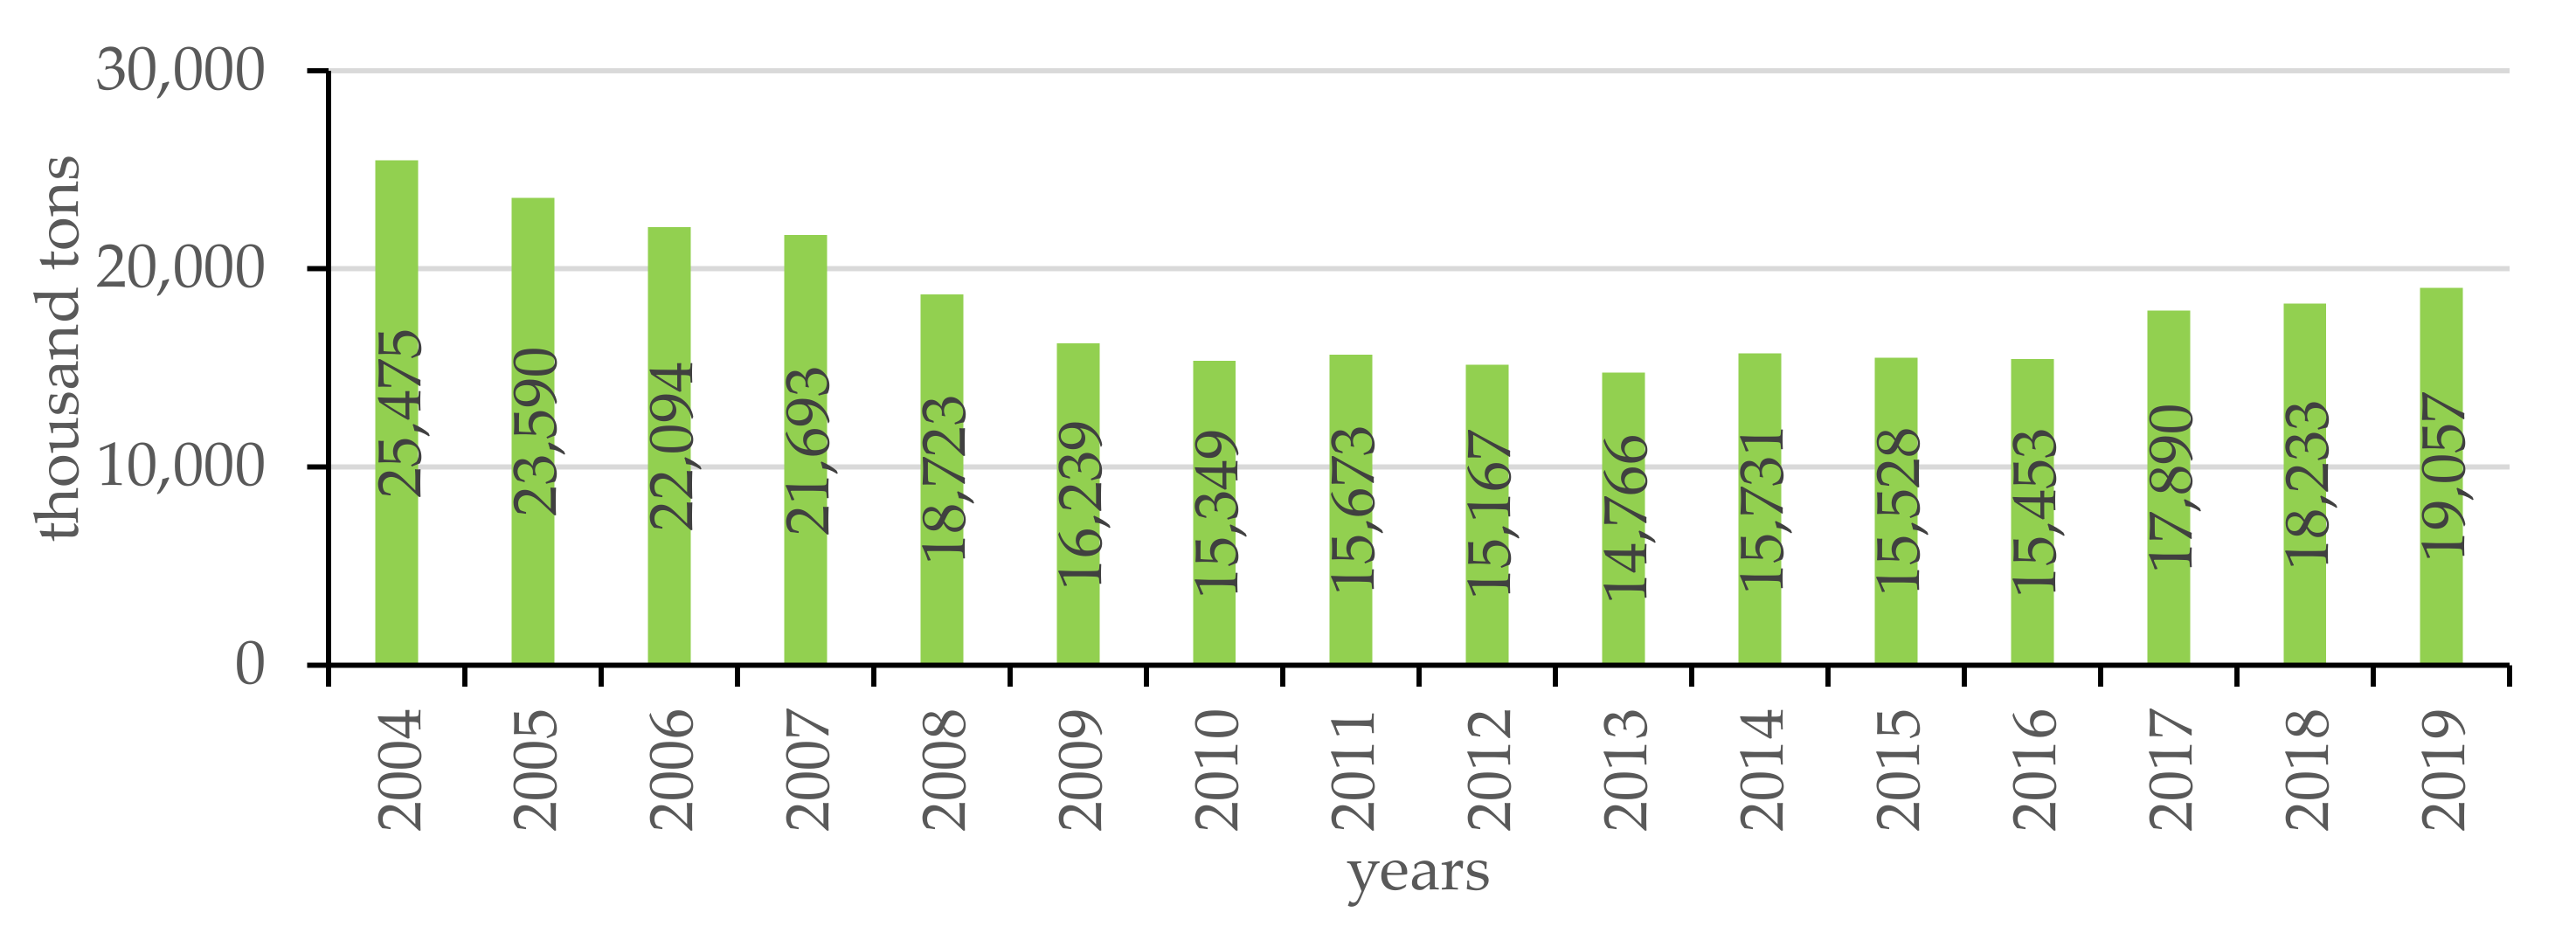
Figure 2 shows the total amount of waste generated in Hungary from 2014 to 2019, which changed only slightly between 2010 and 2016.
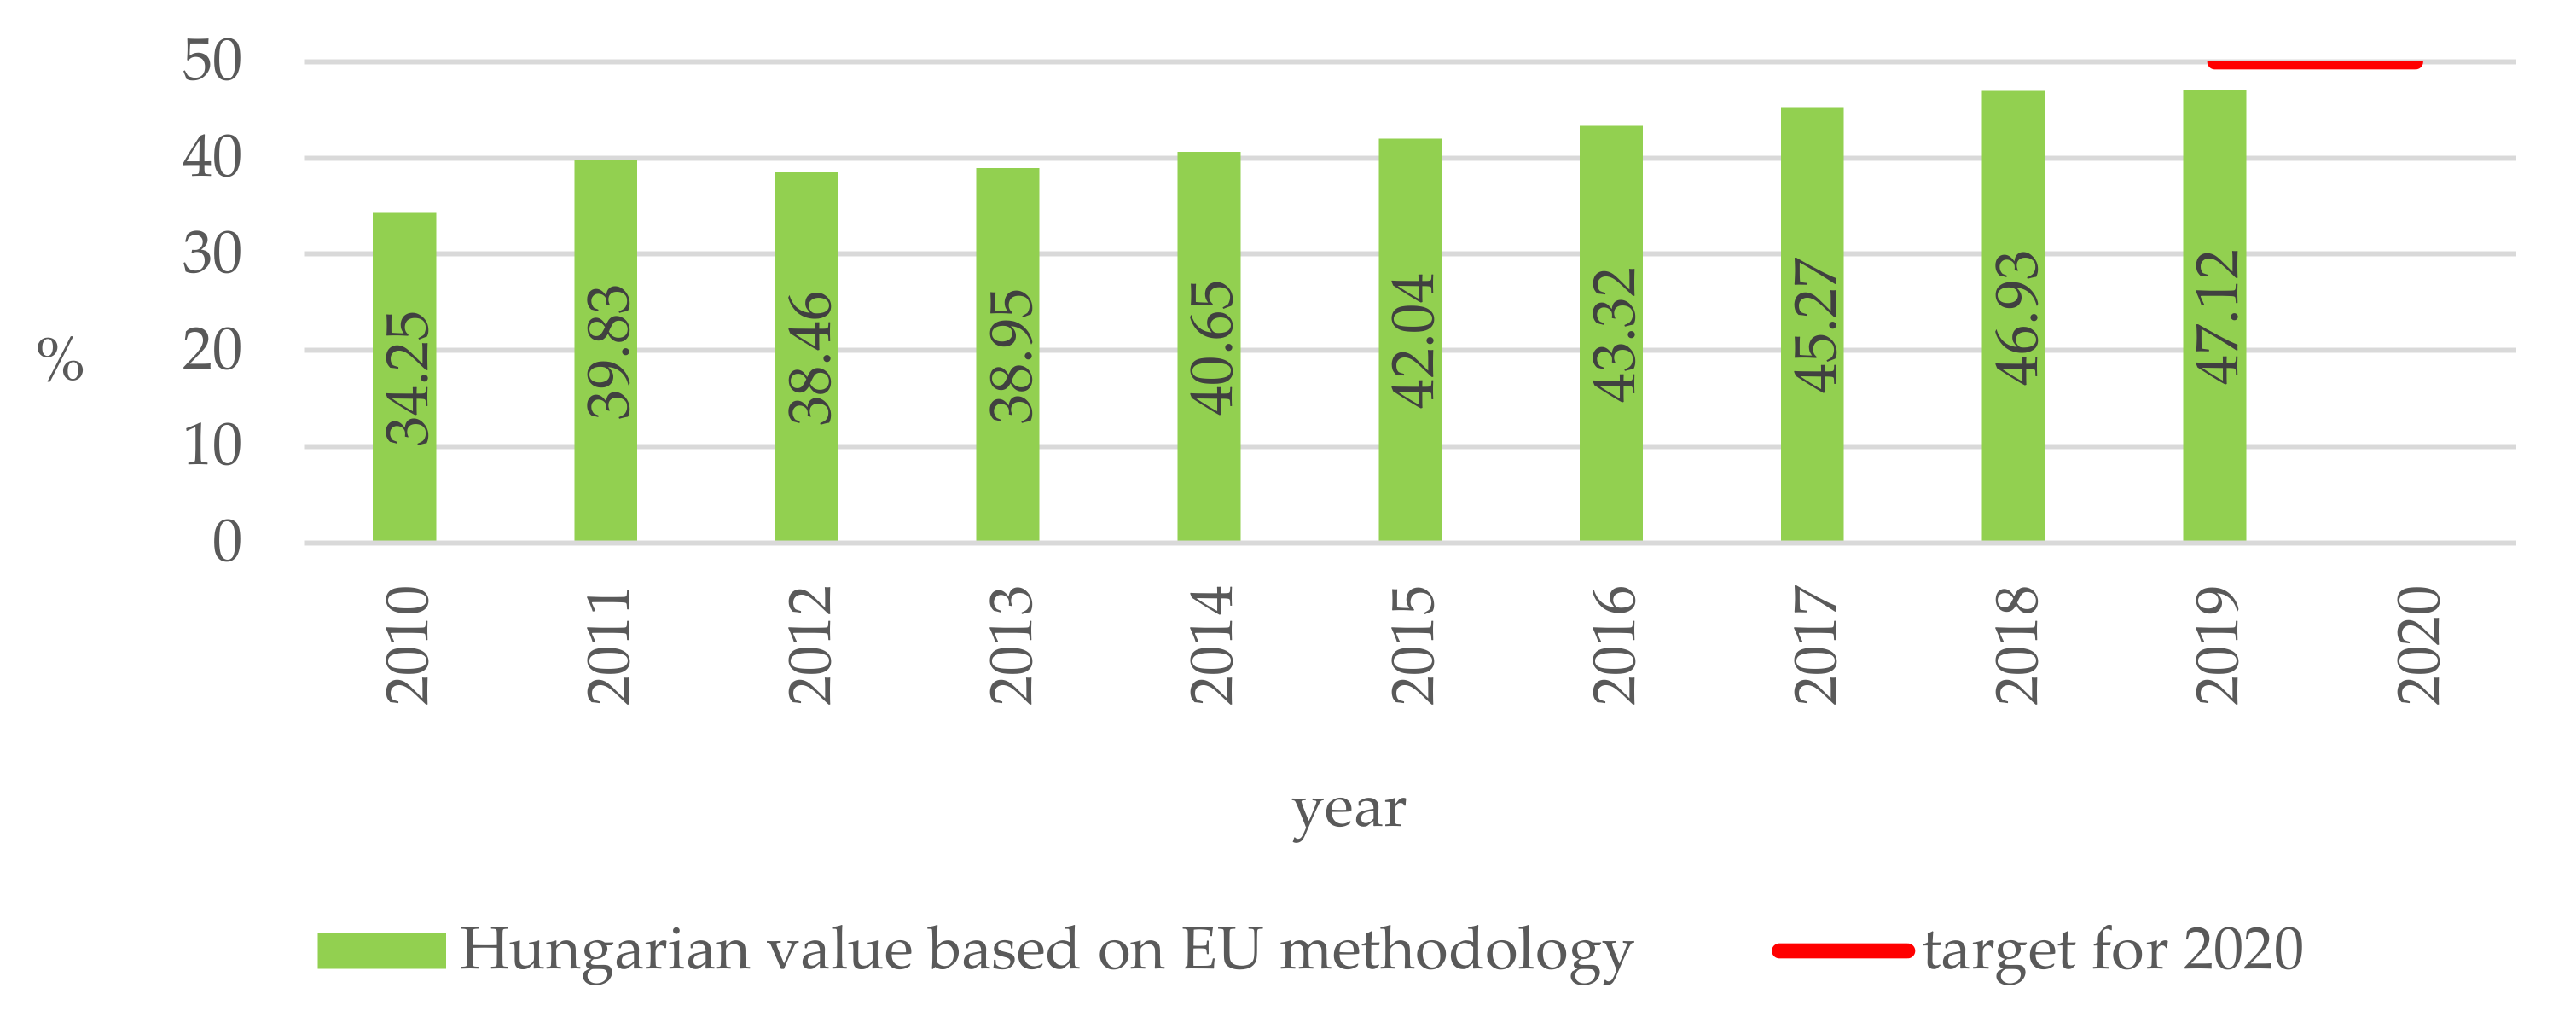
According to the previously revised EU directive target, the combined ratio of preparation and recycling of municipal and nonhousehold waste within municipal waste to at least paper, metal, plastic and glass waste by 2020 must be increased to at least 50% by weight [
18]. As early as 2018, seven EU countries exceeded the 50% target for recycling all municipal waste (
Figure 3). The EU target in Hungary is set in Act CLXXXV of 2012 on waste. Section 92 (1) of the Act on waste is also stated in [
19].
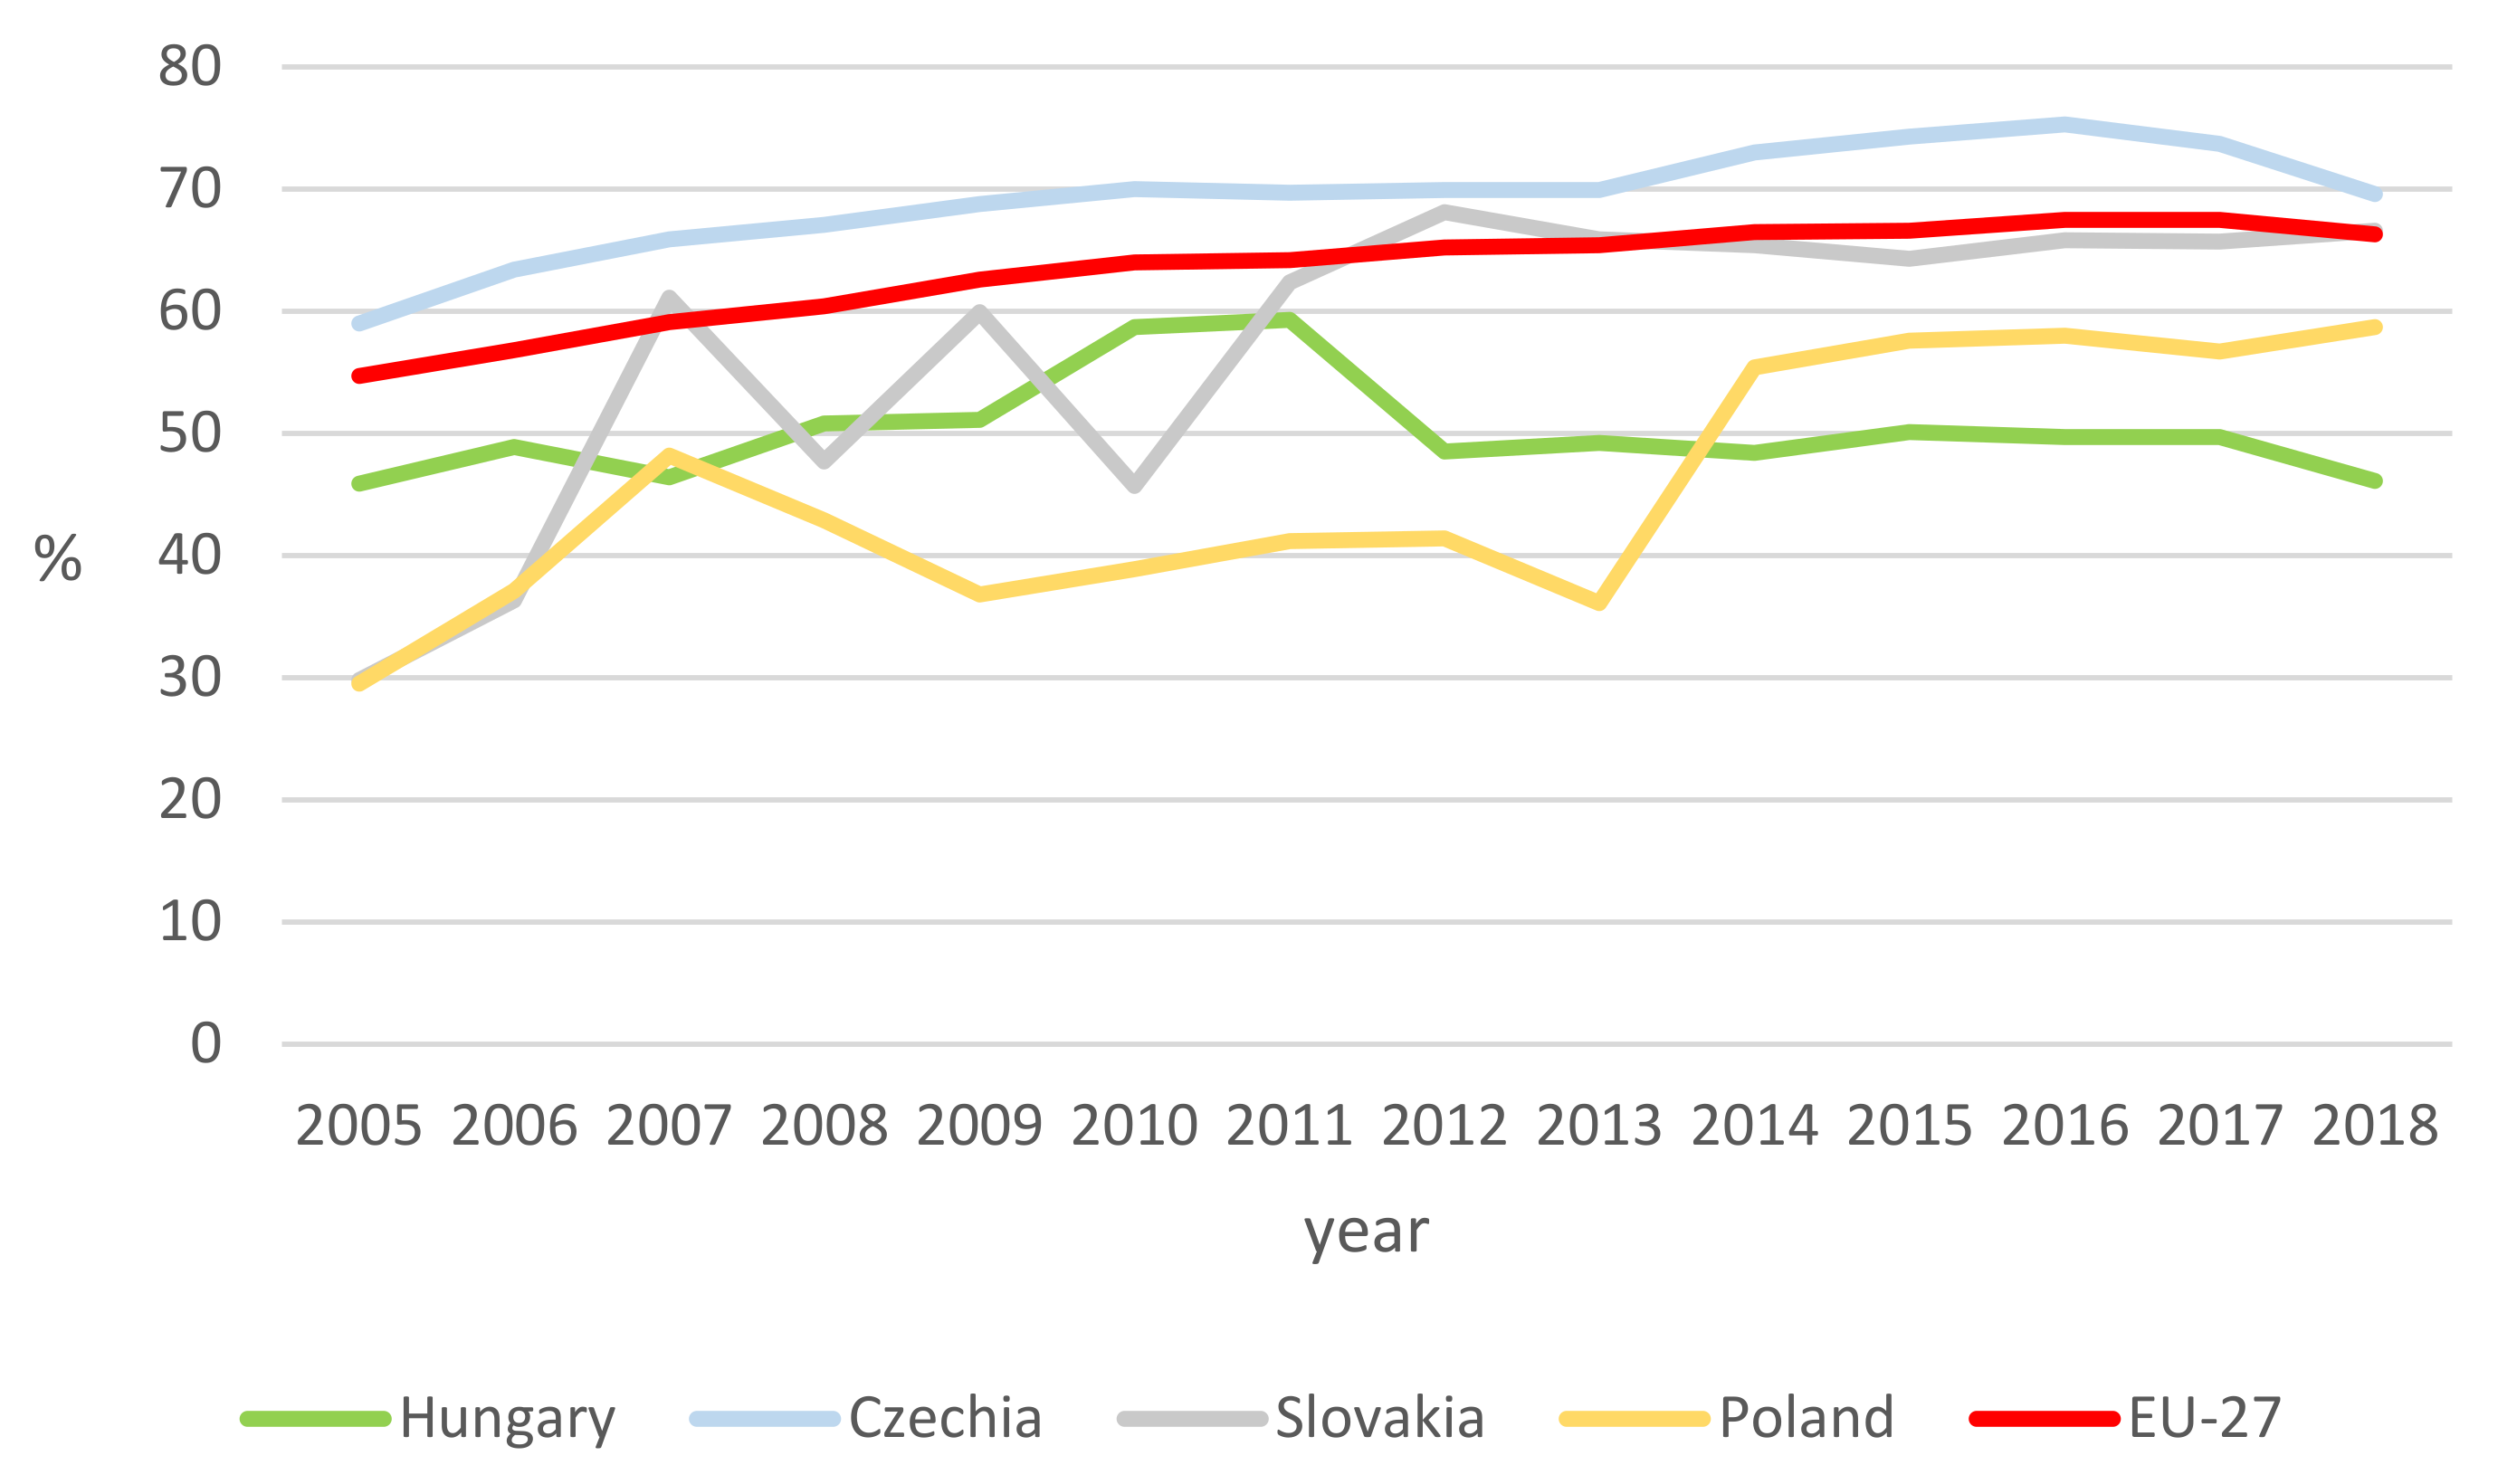
If we look at the recycling rate of all packaging waste in the V4 countries [
20], it can be seen that the V4 countries have undergone significant development in the recent period but are still below the EU average, except for the Czech Republic (
Figure 4).
Significantly better results can be seen in the recycling rates of individual packaging wastes (see
Figure 5,
Figure 6 and
Figure 7), but Hungary had to take targeted measures to meet EU standards.
Figure 5 shows that in plastic packaging waste, Slovakia and the Czech Republic have recently developed above the EU average, but the Hungarian indicators are still somewhat unfavourable.
The situation is somewhat better for the scrap metal shown in
Figure 6, although the statistics below apply not only to beverage packaging but to all metal packaging.
Regarding
Figure 7, it is clear that there is a significant underperformance in glass packaging, not reaching even half of the average of other V4 countries’ recycling performance.
3. The Planned New Hungarian Redemption System
Experience in Hungary shows that the planned target values of the SUP Directive cannot be achieved only by selective collection by the population or by nonencouraged, passive store take back.
In the domestic legal system, currently LXXXV of 2011 on environmental product charges, packaging is a product subject to a product fee. According to the provisions of this law, a product fee of HUF (HUF is the currency of Hungary) 57/kg must be paid for both metal beverage packaging and PET packaging, and HUF 19/kg for glass packaging, in the case of choosing collective performance [
23].
Directive 2018/851, amending Directive 2008/98/EC on waste, entered into force on 4 July 2018, requiring the Member States to comply with the basic requirements for extended producer responsibility schemes, with a deadline of 5 January 2023 [
24].
In Hungary, a complex but essential element of the extended producer responsibility system is regulating environmental product charges. A complete overhaul of this regulatory system is required by a set deadline. The directive requirements exclude the collection of fees for certain products to increase budget revenue through the extended producer responsibility scheme, while ensuring that producers bear all costs related to collecting and recycling waste from the product they produce.
In Hungary, the redemption system for beverage packaging is typically used voluntarily by manufacturers or distributors for refillable beverage packaging (multi-way beverage packaging). The introduction to the market as a “deposit-paying product” is regulated by Regulation 209/2005 on the rules for applying the deposit fee currently in force [
25]. Multipath packaging placed on the deposit system is exempt from the product fee obligation.
Table 2 summarises the estimated quantities of the leading beverage packaging in Hungary.
Based on the waste analysis results, the purity of separately collected waste generated by the population is not adequate to achieve an efficient recycling system. After sorting the separately collected municipal waste, 30–50% of it goes to landfill.
To meet the EU target values, the current collection system needs to be redesigned. In addition, more efficiency measures would presumably provide a solid basis for further treatment and recycling processes, thus contributing to achieving the EU objectives at the system level. Considering the above, in the winter of 2020, the Hungarian Parliament discussed a bill that would introduce the mandatory application of the redemption system beginning in the summer of 2023 to collect the amount of beverage packaging waste as cleanly as possible and significantly increase the recycling rate. Furthermore, if the law is passed, a pilot period of at least 1 year would be used to examine which redemption procedure methodology would be the most expedient, where and what type of redemption instruments should be used, what deposit fee should be applied, etc. This could also be the basis for implementing legislation.
The Hungarian concept for the planned design of the redemption system can be summarised as follows. The planned return system includes a return system for refillable (multi-way) and single-use (single-way) beverage packaging. This means that both beverage packaging circles will appear to consumers as a single system in the new set of rules. The bill creates a state monopoly on the redemption system, which ensures the operation of the redemption system by a single actor at the national level. The proposal set an obligation to hand over waste collected under the compulsory single-use return system for beverage packaging to a public waste management service provider to establish a uniform system. It is important to note that although this waste must be handed over to the public service operator, it is not considered as public service waste. The central coordination is performed by the National Clearing House to be established by the state, and the waste management authority performs the control of the participants of the system. The collection of disposable beverage packaging waste in commercial units by automatic or manual collection is provided by the state or an operator responsible for technical conditions and proper maintenance.
Returned and then compressed or uncompressed beverage packaging is buffered by vending machines or retailers. The waste is then taken over by the public service providers from the traders and then transported to their pretreatment sites. After pretreatment, the waste is sold to the raw material producers. The National Clearing House tracks the beverage packaging by identifying it and continuously collects the redemption fee through the merchants and, at the same time, refunds (credits) the redemption fee to the customers through the vending machines and terminals when redeeming the beverage packaging.
The identifier on the beverage packaging is the basis for billing, which allows for transparent and efficient operation. The identifier with the parameters specified by law in the state is affixed to the product by the manufacturer or, in the case of foreign production, by the first domestic distributor. The operator shall ensure that the identifier affixed to the products included in the redemption system can be read and identified by the receiving devices. The redemption fee is assigned to the ID when the distributor pays it to the National Clearing House.
4. Materials and Methods
To measure the public acceptance of the planned redemption system, we conducted a questionnaire in the summer of 2020 in Hungary. The first subchapter presents the questionnaire and the second, the methods of evaluating the completed questionnaires.
4.1. Data, Research Model
The data to be analysed come from a primary questionnaire survey completed for 1 month from mid-August 2020 to mid-September (12 August 2020 to 9 September 2020). We asked people to complete the questionnaire through several online platforms: through the higher and public education study system and through professional and news portals. The sample included responses from 20,430 people. The questionnaire included 24 questions that could be completed in approximately 10 min, ranging from questions about individuals’ environmental attitudes to their relationship to a new redemption system planned for the future. In the latter case, the questions concerned glass, PET and aluminium cans. It was not obligatory to answer all the questions, so it may happen during the presentation of the results that the distribution of the answers does not reach 100% due to the offered answer options for a given question.
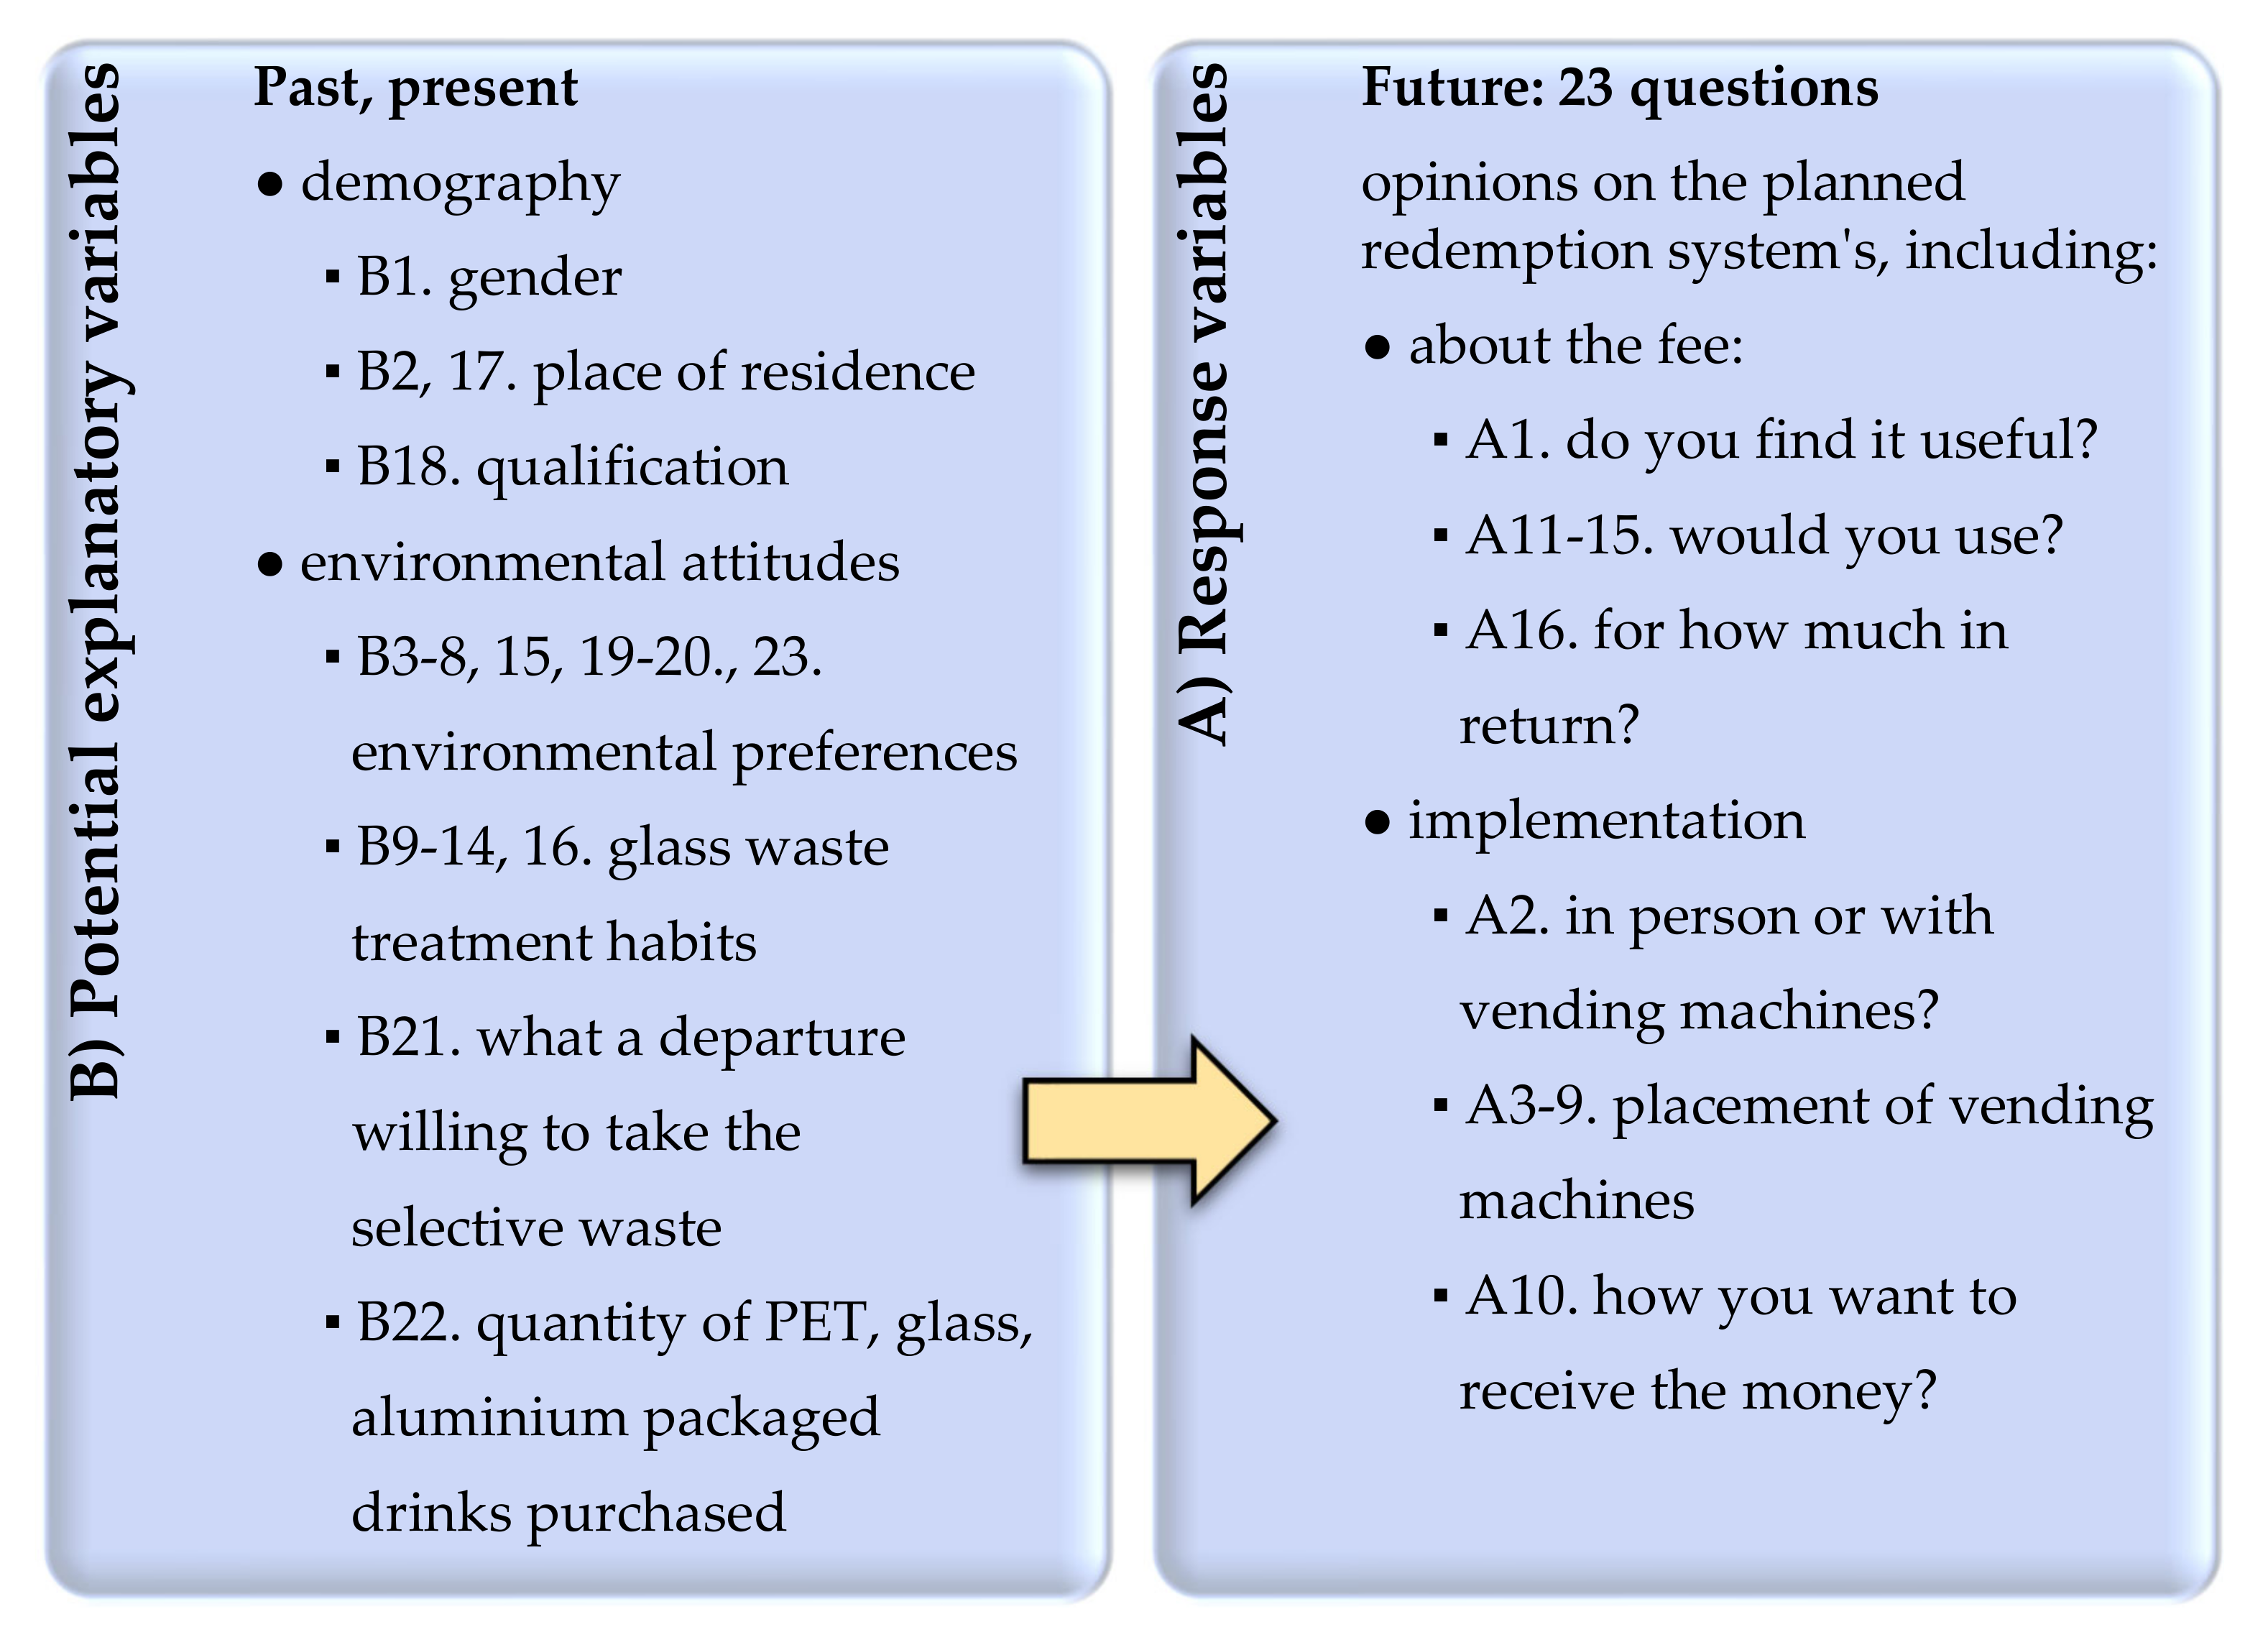
In the following, we present our research model illustrated in
Figure 8. First, we categorise the questions in the questionnaire by whether we consider them as indicators to be explained (abbreviated as A) or as potential explanatory variables (denoted by B).
Among the indicators abbreviated with A were the 16 questions that revealed opinions on the planned redemption system for PET bottles, bottles and aluminium cans in the future. (Full questions and answer options can be found in
Appendix A). Potential explanatory variables abbreviated with B included 23 questions. These represent demographic issues and individuals’ past and present environmental attitudes. (The exact questions and their answer options are listed in
Appendix B). Abbreviation of questions with A and B and numbering within these notations is required for later display of results.
In annexes, A and B questions were grouped not only according to whether they belonged to category A or B of the research model but also according to their level of measurement. This determines the type of analyses that can be interpreted. Although the questionnaire included 24 questions, from the perspective of the analysis (due to the multiple-choice questions), 16 variables were explained, and 23 explanatory variables (39 in total) were included in our research model. Each was a closed question.
The arrow in the research model indicates our research question, i.e., whether the answers to the B questions significantly influence the responses to the A questions and how strong the relationship is between them.
4.2. Data Analysis Method
Descriptive statistics and relationship analysis were used as research methods. For each question, we present the mode of answers, i.e., the most common answer. Since no question can be measured on the highest level (ratio) scale, other descriptive statistics cannot be interpreted (e.g., mean, standard deviation). However, among the answers to the 39 closed questions listed in the previous section, a total of (39 ∙ 38/2 =) 741 relationship tests can be performed. We focus on those that can be measured between the 16 variables to be explained and the 23 potential explanatory variables. This means (16 ∙ 23 =) 368 relationship tests.
The level of measurement of the questions determines what indicator can be used to quantify the relationship between them. In each case, treating the variables at a nominal level, we examine the association relationships between them using Cramer’s V, ranging from 0 to 1. In cases where both the variable considered and the variable to be explained can be measured on an ordinal scale, Kendall’s tau (τ) is applied to quantify the rank correlation, taking a value from −1 to 1. All results are interpreted at a significance level of 5%. In the case of significant relationships, the absolute value of the indicator gives the strength of the relationship [
26]: below 0.2, we can speak of a weak connection; from 0.7, we can speak of a strong relationship and between these two numbers, a medium relationship is indicated. Since Kendall’s tau can take both positive and negative values, the sign of this τ can also be interpreted here, which gives the direction of the relationship.
5. Results
In
Section 5.1, the modes (the most frequently answered answers to each question) are described, and in
Section 5.2, the results of the relationship tests are presented.
5.1. Typical Responses
We first present the typical (most common) answers to each question for the explanatory (B) and then the explained (A) indicators. A total of 55.1% of the sample were women (B1), about 26.7% of them live in the capital, Budapest (B17), and 43.3% have a degree (B18). Environmental protection is significant for 77.2% (B19) of them, 81.2% agree that waste should be reduced in Hungary (B20) and 70.4% say that recycling is more advantageous than landfilling (B23). The respondents considered most important the following three:
69.2%: pollution of rivers, lakes, nature reserves (B3);
72.2%: a significant number of single-use plastic devices (B4);
57.5%: overpacking of goods (B5).
It is interesting to note that the majority (63.8%) did not rank among the three most important the two relevant characteristics for the present research: the small number of landfills (B6) or misleading information on recycling (B7).
Concerning glass bottles, 4.5% of the sample stated that they do not buy such a product (B14), 9.9% of respondents do not collect it selectively and put it in the mixed bin (B13). Instead, 34.2% of respondents place it in a selective trash can at home (B12), 32.8% use glass waste collectors set in or next to grocery stores (B9), 29.6% take it to a waste collection island (B10) and 6.1% to a waste yard (B11).
In the following, we move on to the presentation of the variables to be explained (A). Respondents favour automatic redemption machines (64.2%) rather than redemption points that require a personal presence (A2). Most people (33.0%) would like to receive money for redemption in cash (A10).
The answers to further questions confirm that a new redemption system has a meaning, so our hypothesis H1 is acceptable, according to which the reform of the beverage redemption system has a raison d’être in Hungary, as the majority of the population would use it. We still mention the most common answers. In Hungary, 58.0% believes that the cause of today’s most enormous pollution comes from the waste of beverage bottles/cans from illegal littering (B8). A total of 27.6% of the respondents fully, and 25.7% mostly, would facilitate collection in households if a redemption fee had to be paid in the store at the time of purchase, which would be returned to them when the empty bottles and boxes were redeemed (A1).
Concerning the automatic return systems (A3–9) to be set up in different locations, the majority would prefer them to be
According to 73.1% of respondents, a redemption system should still be introduced even if the manufacturers include it in their products’ price (A11). A total of 67.2% consider the moderate increase of the purchased products’ price to maintain the redemption system to be acceptable (A12), as this is good for our environment in the long run. Ultimately, they recover the difference if the bottle/box is returned (A11). If a redemption fee were introduced, the majority (71.2%) would not change their purchasing habits but would stay with the products currently purchased and redeem the bottles (A13). A total of 71.8% would collect packaging in their household if the state paid for its redemption, and 8.5% would make it dependent on the deposit fee (A14). A total of 60.1% would take the packaging back in exchange for the deposit; if the product is taken back to the usual store, an additional 13.0% of people, in this case, are also affected by the amount of the deposit (A15).
Perhaps the most surprising result of the survey is that most people (28.4%) would be willing to return the packaging even if they only receive the lowest amount—between HUF 10 and 20. However, the more that is paid for the returned packaging, the more likely the new return system will be popular (A16).
Table 3 shows the demographic characteristics of the respondents grouped according to how they answered the most important question to be explained, i.e., whether they would collect the packaging in their household if the state paid for their redemption. The most common features were highlighted against a dark background. The vast majority were those who gave a definite yes to collecting the packaging if the state paid for it: 47.8% were women, 21.78% were in the capital (Budapest), 22.25% were living in cities and 37.20% were in college or graduated from university. The fewest were those who would not return packaging even if they paid for it (only 1.07% of the sample). There were more who make this dependent on how much they would receive for redemption.
Among those who answered in the affirmative yes to the question of whether they would redeem the beverage packaging of their households if the state paid, the proportion of women and graduates was outstanding. Therefore, based on
Table 3, our hypothesis H2 is partially acceptable, according to which typically female graduates would return beverage packaging. In H2, we also assumed that the type of settlement is irrelevant. However,
Table 3 shows that those who would undoubtedly take advantage of the opportunities provided by the new system typically live in cities.
5.2. Relationship Analyses
Table 4 contains the numerical results of the association relationship analysis (between variables A and B) indicated in the research model, i.e., the Cramer’s V values.
Table 4 shows the result, which is very rare in questionnaire surveys, that all the examined relationships are significant. In addition, each shows at least a moderately strong relationship (0.2 ≤ Cramer index < 0.7). Strong relationships can also be observed (where the Cramer index is at least 0.7). This means that each of the explanatory variables we potentially handle actually affects, and at least moderately strongly, all of the variables we want to explain (related to the planned redemption system in the future).
In the following, we move from the presentation of the association relationships quantified by Cramer’s V to the relationships that can also be interpreted as rank correlations (possible between the variables A and B measured on the order scale). The correlation studies between these questions were also included in
Table 4. However, we interpreted the answers to the questions at a nominal level. Thus, the results in
Table 5 also consider that a ranking can be established in the answers to the questions involved, and a relationship is sought between them. For example, we could determine “the more/less…, the more/less” kind of statements based on these correlations. Of the 24 relationship analyses performed, only one was nonsignificant (abbreviated as n.s. in
Table 5) among the answers to the following two questions:
A14. Would you collect the packaging in your household if the state paid for its redemption? (1: no, 2: may depend on how much you pay for it, 3: yes)
B18. Highest level of education (1: primary school, 2: secondary school (grammar school, vocational secondary school, vocational school), 3: currently in higher education, 4: college/university, 5: postgraduate qualification)
Thus, it cannot be significantly stated that the lower (higher) someone’s education, the more or less they would collect packaging in their household if the state paid for their redemption.
All other relationships are significant. The background colour of the cells shows their strength in
Table 5. Darker cells indicate a stronger connection. Of the 23 significant relationships, one can be called moderately strong (τ = 0.224). Namely, the more true that a household is used to exchanging used empty bottles in the store (B16), the more packaging would be collected if the state would pay for their redemption (A14). The other 22 significant relationships can only be described as weak (τ < 0.2), but in any case, it is essential to note that they also show a meaningful relationship. Based on their sign, the following conclusions can be made.
If the government were to pay for the redemption of packaging, households would be more likely to collect packaging (A14) or more likely to return it to their usual business (A15), and they would be more willing to do so in exchange for a lower fee (A16).
the glasses are usually returned (B16);
live in a smaller settlement (B17);
consider that the protection of the environment important (B19);
agree that waste should be reduced in Hungary (B20);
a more distant collection point is also suitable for them (B21);
fewer packaged beverages are purchased on a weekly average by them (B22);
they consider recycling more beneficial than landfilling (B23).
In the case of education (B18), we have already seen that this does not significantly affect whether someone would collect redeemable packaging if the state paid for it (A14). However, it can also be said about education that it is negatively related, on the one hand, to the probability of redemption at the usual business (A15) and, on the other hand, to the amount for which the packaging would be redeemed (A16). That is, the lower (higher) someone’s education, the more (less) they would take the packaging to the usual business, and the higher (lower) amount they would expect in return.
Based on the results of the relationship analyses, part of hypothesis H3—except in one case—is acceptable, according to which both demographic characteristics and environmental attitudes of individuals influence their perceptions of the planned new system. The exception is that education does not significantly affect whether they would live with the new system. The second part of H3 concerned the strength of significant relationships, and we hypothesised that the relationships were strong. This hypothesis can be accepted partly because not all relationships are strong. Still, it has been found that we can talk about at least moderately strong relationships (if we deal with the answers to all questions on a nominal level). However, if we look for a connection between the order of the answers, only weak connections can be detected in most cases.
6. Discussion
The literature studies confirmed that there has been a significant improvement in the collection of selective waste in the EU Member States and in the V4 countries, based on the proportions of packaging material measured in mixed waste, but that the targets have not yet been met. We expect the collection system to collect larger amounts of packaging waste. We presented the conditions and operation of such a system, and we examined the social acceptance of the redemption system using a questionnaire method. Based on the evaluated questionnaires, it can be seen that the protection of the environment is of paramount importance to the Hungarian population. For this purpose, positive feedback was received regarding the redemption system. However, interesting conclusions could be drawn regarding, e.g., how and where the redemption would take place to the degree or place of residence (e.g., ordinary business or other). It is also clear that the refund fee is an important factor in the incentive, even if it is small (this is also an important issue for the scheme’s functioning). The public agreed that the system was necessary, although its value should be included in the product’s price.
The challenge of setting new ambitious targets and reaching them is inevitable to protect the environment and lower pollution. Packaging material is present in a vast amount of waste that has already appeared everywhere (soil, water, air). Recycling is key to reaching the circular economy’s goal and can only be possible by supportive collection—as seen in
Section 2. For the deposit-refund system, there have already been positive examples resulting in an already high recycling ratio in Europe, but in the case of the V4 counties, there is still a considerable lag; on average, the recycling rate is slowly raising, but in many cases (countries, materials), it is still stagnating or decreasing.
For this reason, the primary goal of this study was to examine how a redemption system would be welcomed by the Hungarian population and to propose the research questions. The expected answers (Hypotheses) [
27,
28] confirmed by scientific correlation methods that the Hungarian population significantly welcomes the system. However, the results are much more than this conformation. The study already highlights important facts by the answers that decision makers must consider to reach the best result in the collection of packaging materials.
The realisation of such a system depends on details that are already significantly present in the answers, such as the preferred location of the reception point, the types of redemption, the measure (also sensitiveness) of the redemption fee and the possible change in habits of consumption. Therefore, to benefit from the results and give a scientific basis for constructing the Hungarian system, we are continuously improving the questionnaire of the 2020 survey and regularly preparing a study to follow the changes in the trends.
According to the present study results, we also plan to examine the financial feasibility and establish the possible realisation models (needed administrative background, investment in machines, logistic calculation for location).
We would like to continue our research: first of all, we would like to examine the results that the so-called system of collection points, which is planned to be launched in 2021 in Hungary, can achieve. According to the most important waste streams, the essence of this would be that the items that have become redundant could be disposed of at a specific location in each major settlement. This is likely to affect the secondary market of certain packaging materials also covered by the redemption scheme.
On the other hand, our research focuses on only one slice of the Hungarian waste management system. As a completely new model will be introduced in the Hungarian waste management system (the so-called concession model), we would also like to examine what obligations the legislator sets for the future concessionaire about collection and what waste management results can be expected from them.
Finally, a longer-term indicator of our research is a technical, economic, sectoral, social and, last but not least, sustainability study of the redemption methodology in the new concession model previously mentioned.
Author Contributions
Conceptualisation, A.B., R.K., A.S., Z.P.L. and Z.B.; methodology, Z.B.; software, Z.B.; validation, Z.B.; formal analysis, Z.B.; investigation, Z.B.; resources, A.B., A.S., R.K., Z.P.L. and Z.B.; data curation, Z.B.; writing—original draft preparation, A.B., A.S., R.K., Z.P.L. and Z.B.; writing—review and editing, A.B., R.K., A.S., Z.P.L. and Z.B.; visualisation, A.B. and Z.B; supervision, A.B., R.K., A.S., Z.P.L. and Z.B.; project administration, A.B., R.K., A.S. and Z.P.L.; funding acquisition, A.B., R.K. and Z.P.L. All authors have read and agreed to the published version of the manuscript.
Funding
This work was supported by the TKP2020-IKA-07 project financed under the 2020-4.1.1-TKP2020 Thematic Excellence Programme by the National Research, Development and Innovation Fund of Hungary.
Institutional Review Board Statement
Not applicable.
Informed Consent Statement
Not applicable.
Acknowledgments
This publication/research has been professionally supported by the National Research, Deveopment and Innovation Office through the project nr. 2019-1.3.1-KK-2019-00015, titled “Establishment of a circular economy-based sustainability competence center at the University of Pannonia”.
Conflicts of Interest
The authors declare no conflict of interest.
Appendix A. Response Variables (A)
Variables measurable on a nominal scale:
A1. In your opinion, would it help with collection in households if a redemption fee had to be paid in the store at the time of purchase, which would be returned to you when the empty bottles and boxes were redeemed? (depends on the amount of the redemption fee, no, only partially, mostly yes, fully)
A2. Which redemption method do you support? (automatic redemption machines, redemption points requiring personal presence)
A3–9. If redemption machines were to be deployed, should they be set up in the following locations? (Yes, No)
- ◦
A3. In shopping malls/malls
- ◦
A4. In department stores (Tesco, Auchan,…)
- ◦
A5. Gas stations
- ◦
A6. At major public transport hubs
- ◦
A7. In larger public and educational institutions
- ◦
A8. Food in retail units
- ◦
A9. In drugstores, pharmacies
A10. How would you most like to receive the money you received for the redemption? (in a voucher redeemable at the point of redemption; in cash; via a smartphone application to a bank account; on a point-of-sale card that I can use anywhere)
A11. Do you think that a redemption system should be introduced even if the manufacturers included the cost of this in the product’s price? (no, not at all; yes, because we do good to our environment in the long run, and ultimately I get the difference back if I take the bottle/box back)
A12. Do you consider it acceptable that the price of purchased products should increase moderately to maintain the redemption system? (no, I do not consider the price increase acceptable despite the environmental objectives; yes, because in the long run, it is to protect the environment, and I will get the difference back if I replace the bottle/box)
A13. If a redemption fee is introduced, which of the following statements would be most true for you? (I would stay with the products I was currently buying and redeem the bottles; I would stay with the products I now purchased but would not redeem the bottles; I would buy the cheaper one; I would instead choose a similar product with nonredemption packaging if any)
Variables measurable on an ordinal scale:
A14. Would you collect the packaging in your household if the state paid for its redemption? (1: no, 2: may depend on how much you pay for it, 3: yes)
A15. If the product with a redemption fee is taken back to the usual store during the purchase, would you return it in exchange for the redemption fee? (1: I am not interested in this question, 2: I would not take it back and I would not collect it selectively, 3: I would not take it back, I would use the selective collection, 4: it depends on the amount of the redemption fee and the location of the redemption point, 5: yes)
A16. In case of collection through a redemption system, for what amount of redemption fee (HUF: Hungarian forint) would you be willing to take the emptied beverage packaging to the redemption point and redeem it? (1: 10–20 HUF, 2: 20–30 HUF, 3: 30–40 HUF, 4: 40–50 HUF, over 5: 50 HUF)
Appendix B. Potential Explanatory Variables (B)
Variables measurable on a nominal scale:
B1. Gender (male, female)
B2. Place of residence (county)
B3–7. Which of the following do you classify as the three most important? (Yes No)
- ◦
B3. Pollution of rivers, lakes, nature reserves.
- ◦
B4. The significant number of disposable plastic devices.
- ◦
B5. Excessive packaging of goods.
- ◦
B6. The small number of landfills.
- ◦
B7. Misleading information on recycling.
B8. What do you think is causing the most significant pollution in Hungary today? (beverage bottles/cans from illegal littering; illegally dumped livestock waste; illegally dumped construction/demolition waste; illegally treated green waste)
B9–14. You usually place waste glass packaging emptied in your household in the following places (Yes No)
- ◦
B9. Grocery stores or near in glass waste bin
- ◦
B10. Garbage collection island
- ◦
B11. To the landfill
- ◦
B12. Selective trash at my household
- ◦
B13. I do not collect it selectively; I put it in the mixed trash
- ◦
B14. I do not buy such a product
B15. Which solution do you consider to be the most environmentally friendly? (separate collection (redemption system); selective collection (home, collection island); disposal in mixed waste)
Variables measurable on an ordinal scale:
B16. Do you return, or does another member of your household return used empty bottles back to the store? (1: we do not generate such waste, 2: no, because it is not worth it, 3: occasionally yes, 4: yes, always)
B17. Place of residence—the type of the settlement (1: other territorial deliminations, 2: municipality, 3: large village, 4: town, 5: town of county rank, 6: capital city)
B18. Qualification (1: primary school, 2: secondary school, 3: student in higher education, 4: college/university, 5: postgraduate)
B19. How important do you think environmental protection is? (1: not very important, 2: rather important, 3: very important)
B20. Do you agree that the amount of landfilled waste in Hungary should be reduced and recycled as much as possible? (1: no, 2: partially, 3: fully)
B21. How far would you be willing to travel from your home on foot to take the emptied bottles and boxes to a collection point? (Up to 1: 100 m, up to 2: 300 m, up to 3: 500 m, 4: up to a distance of up to 500 m, 5: no matter because I drive)
B22. On average, how many drinks do you buy in plastic or glass bottles or metal cans (PET, glass, aluminium) in total per week? (1: no pieces above 2: 1–3, 3: 3–6, 4: 6–10, 5: 10)
B23. In your opinion, from an environmental sustainability point of view, is the recycling or recovery of waste preferable to landfilling? (1: not at all, 2: maybe, 3: clearly yes)
References
- PlasticsEurope. Plastics—The Facts 2013. An Analysis of European latest Plastics Production, Demand and Waste Data. Available online: https://www.plasticseurope.org/application/files/7815/1689/9295/2013plastics_the_facts_PubOct2013.pdf (accessed on 29 March 2021).
- Awaja, F.; Pavel, D. Recycling of PET. Eur. Polym. J. 2005, 41, 1453–1477. [Google Scholar] [CrossRef]
- European Commission. Closing the Loop—An EU Action Plan for the Circular Economy COM/2015/0614 Final. Communication from the Commission to the European Parliament, the Council, the European Economic and Social Committee and the Committee of the Regions. Brussels, 2.12.2015. 2015. Available online: https://eur-lex.europa.eu/legal-content/EN/TXT/HTML/?uri=CELEX:52015DC0614&from=EN (accessed on 29 March 2021).
- Beamer, K.; Tuma, A.; Thorenz, A.; Boldoczki, S.; Kotubetey, K.; Kukea-Shultz, K.; Elkington, K. Reflections on Sustainability Concepts: Aloha ʻĀina and the Circular Economy. Sustainability 2021, 13, 2984. [Google Scholar] [CrossRef]
- Eurostat. Available online: https://ec.europa.eu/eurostat/databrowser/view/ENV_WASPAC__custom_921402/default/table?lang=en (accessed on 7 May 2021).
- Lavee, D. A cost-benefit analysis of a deposit–refund program for beverage containers in Israel. Waste Manag. 2010, 30, 338–345. [Google Scholar] [CrossRef] [PubMed]
- Linderhof, V.; Oosterhuis, F.H.; van Beukering, P.J.H.; Bartelings, H. Effectiveness of deposit-refund systems for household waste in the Netherlands: Applying a partial equilibrium model. J. Environ. Manag. 2019, 232, 842–850. [Google Scholar] [CrossRef]
- Amano, M. PET Bottle System in Sweden and Japan: An Integrated Analysis from a Life-Cycle Perspective. Master’s Thesis, Lund University, Lund, Sweden, 2004. Available online: https://www.lumes.lu.se/sites/lumes.lu.se/files/amano_michiko.pdf (accessed on 7 May 2021).
- Walls, M. Deposit-Refund Systems in Practice and Theory. Resources for the Future Discussion Paper 2011, 11–47. [Google Scholar] [CrossRef]
- CM Consulting Inc; Reloop Platform. Deposit Systems for One-Way Beverage Containers: Global Overview 2016. 2017. Available online: https://www.cmconsultinginc.com/wp-content/uploads/2017/05/BOOK-Deposit-Global-24May2017-for-Website.pdf (accessed on 29 March 2021).
- Zhou, G.; Gu, Y.; Wu, Y.; Gong, Y.; Mu, X.; Han, H.; Chang, T. A systematic review of the deposit-refund system for beverage packaging: Operating mode, key parameter and development trend. J. Clean. Prod. 2020, 251, 119660. [Google Scholar] [CrossRef]
- Ettlinger, S. Deposit Refund System (and Packaging Tax) in Finland. This Case Study Was Prepared as Part of the Study’ Capacity Building, Programmatic Development and Communication in the Field of Environmental Taxation and Budgetary Reform’, Carried out for DG Environment of the European Commission during 2016–2017 and Led by the Institute for European Environmental Policy. 2016. Available online: https://ieep.eu/uploads/articles/attachments/9d526526-d22b-4350-a590-6ff71d058add/FI%20Deposit%20Refund%20Scheme%20final.pdf?v=63680923242 (accessed on 29 March 2021).
- Tasaki, T.; Numata, D.; Matsumoto, T.; Tojo, N.; Reframing the Concept of Collection Systems with Economic Incentives. Based on the Review of Deposit-Refund Systems and Point Systems. Research Report from the National Institute for Environmental Studies, Japan 2010, No. 205. Available online: https://www.nies.go.jp/kanko/kenkyu/enpdf/r-205-2010-e.pdf (accessed on 29 March 2021).
- Hua Zhong, H.; Zhao, C. E-waste Deposit system under EPR in China: A VIew from Closed-Loop Supply Chain. In Proceedings of the International Conference on Services Systems and Services Management (ICSSM12), Shanghai, China, 2-4 July 2012; pp. 239–243. [Google Scholar]
- Muranko, Z.; Tassell, C.; van der Laan, A.Z.; Aurisicchio, M. Characterisation and Environmental Value Proposition of Reuse Models for Fast-Moving Consumer Goods: Reusable Packaging and Products. Sustainability 2021, 13, 2609. [Google Scholar] [CrossRef]
- Directive (EU) 2019/904 of the European Parliament and of the Council of 5 June 2019 on the Reduction of the Impact of Certain Plastic Products on the Environment. Available online: https://eur-lex.europa.eu/legal-content/EN/TXT/HTML/?uri=CELEX:32019L0904&from=HU (accessed on 29 March 2021).
- Innovációs és Technológiai Minisztérium (ITM) Egységes Hulladékgazdálkodási Információs Rendszer (EHIR). National Environmental Information System, Waste Management Data. Available online: http://web.okir.hu/en/ehir (accessed on 29 March 2021).
- Eurostat. Waste Targets. Available online: https://ec.europa.eu/eurostat/web/waste/targets (accessed on 29 March 2021).
- A hulladékról szóló 2012. évi CLXXXV. Törvény. Available online: https://net.jogtar.hu/jogszabaly?docid=a1200185.tv (accessed on 29 March 2021).
- Lacko, R.; Hajduová, Z.; Zawada, M. The Efficiency of Circular Economies: A Comparison of Visegrád Group Countries. Energies 2021, 14, 1680. [Google Scholar] [CrossRef]
- Eurostat. Recycling Rate of Packaging Waste by Type of Packaging (CEI_WM020). Available online: http://appsso.eurostat.ec.europa.eu/nui/submitViewTableAction.do (accessed on 29 March 2021).
- Eurostat, Packaging Waste by Waste Management Operations and Waste Flow (ENV_WASPAC). Metthodology. Available online: https://ec.europa.eu/eurostat/cache/metadata/EN/env_waspac_esms.htm (accessed on 29 March 2021).
- Évi LXXXV. Törvény a Környezetvédelmi Termékdíjról. 2011. Available online: https://net.jogtar.hu/jogszabaly?docid=a1100085.tv (accessed on 29 March 2021).
- Directive (EU) 2018/851 of the European Parliament and of the Council of 30 May 2018 amending Directive 2008/98/EC on Waste. Available online: https://eur-lex.europa.eu/legal-content/EN/TXT/HTML/?uri=CELEX:32018L0851&from=HU (accessed on 29 March 2021).
- 209/2005. (X. 5.) Kormány Rendelet a Betétdíj Alkalmazásának Szabályairól. Available online: https://net.jogtar.hu/jogszabaly?docid=a0500209.kor (accessed on 29 March 2021).
- Sajtos, L.; Mitev, A. SPSS Kutatási és Adatelemzési Kézikönyv; Alinea: Budapest, Hungary, 2007. [Google Scholar]
- Abejón, R.; Laso, J.; Margallo, M.; Aldaco, R.; Blanca-Alcubilla, G.; Bala, A.; Fullana-i-Palmer, P. Environmental impact assessment of the implementation of a Deposit-Refund System for packaging waste in Spain: A solution or an additional problem? Sci. Total Environ. 2020, 721, 137744. [Google Scholar] [CrossRef]
- Puigvert, M.R.; Ayuso, S.; Bala, A.; Fullana-i-Palmer, P. What factors determine attitudes towards the implementation of a packaging deposit and refund system? A qualitative study of the perception of Spanish consumers. J. Environ. Manag. 2020, 270, 110891. [Google Scholar] [CrossRef] [PubMed]
| Publisher’s Note: MDPI stays neutral with regard to jurisdictional claims in published maps and institutional affiliations. |
© 2021 by the authors. Licensee MDPI, Basel, Switzerland. This article is an open access article distributed under the terms and conditions of the Creative Commons Attribution (CC BY) license (https://creativecommons.org/licenses/by/4.0/).


