
Dynamic Changes of Local Climate Zones in the Guangdong–Hong Kong–Macao Greater Bay Area and Their Spatio-Temporal Impacts on the Surface Urban Heat Island Effect between 2005 and 2015


Abstract
1. Introduction
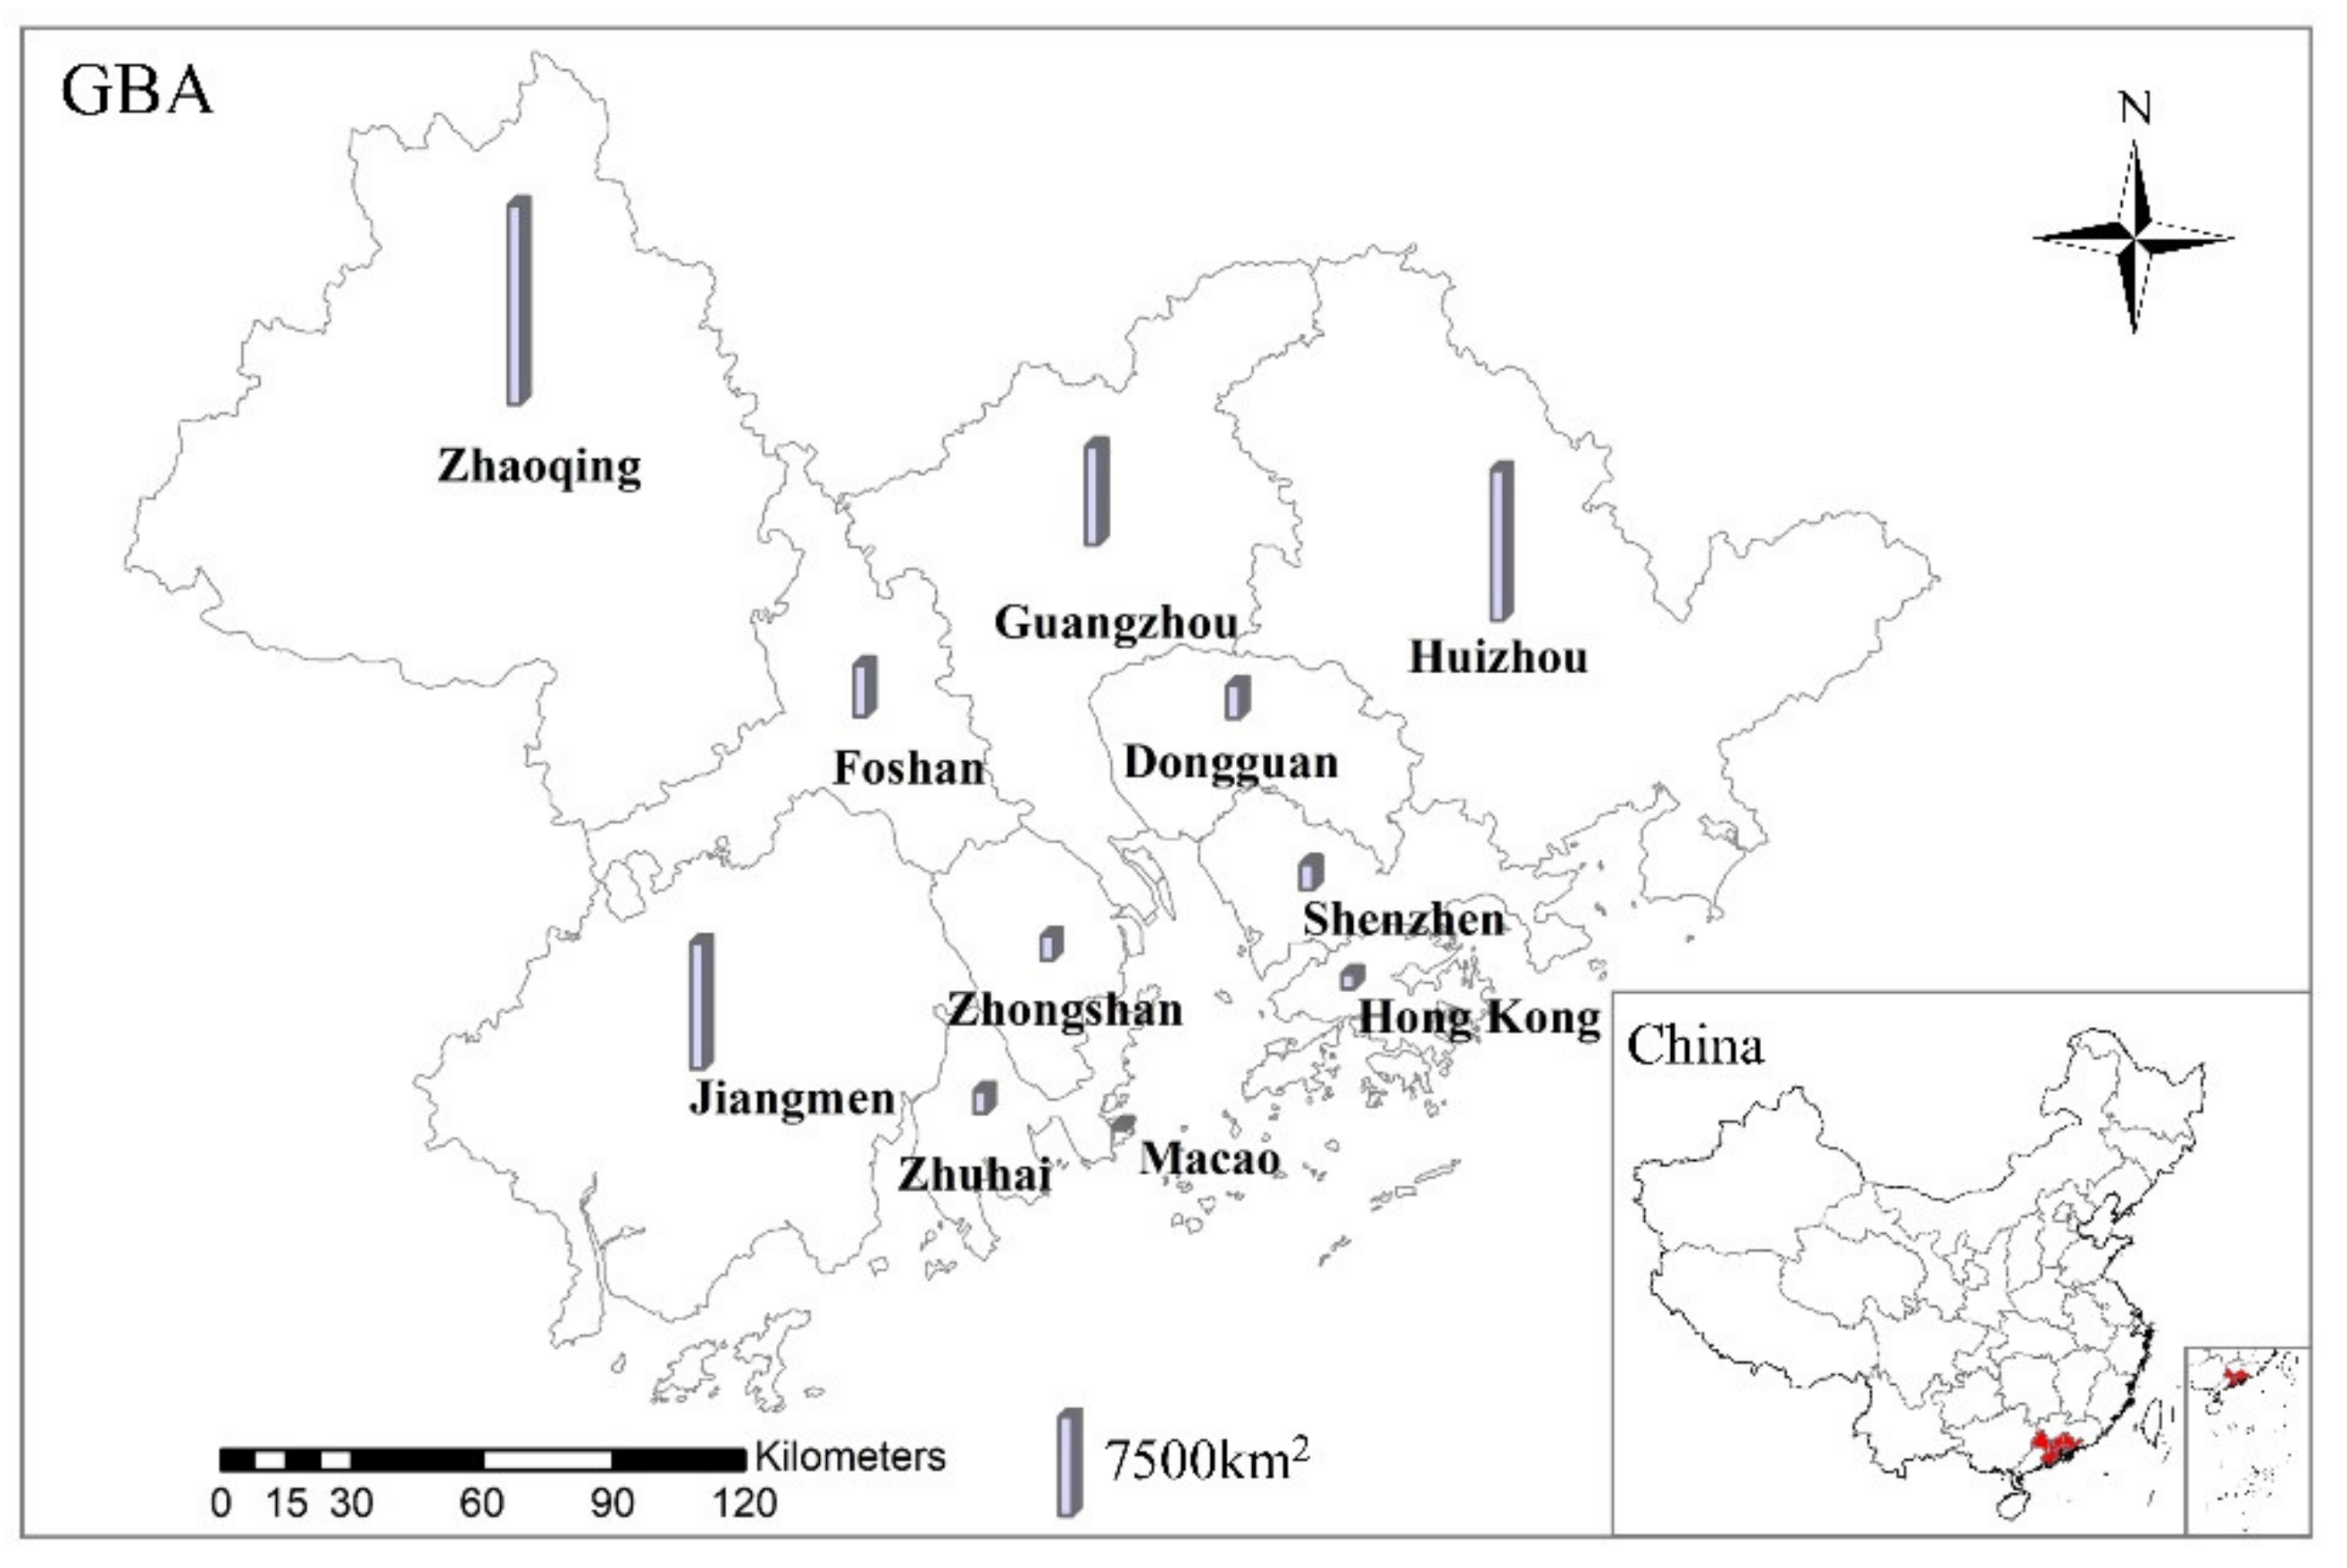
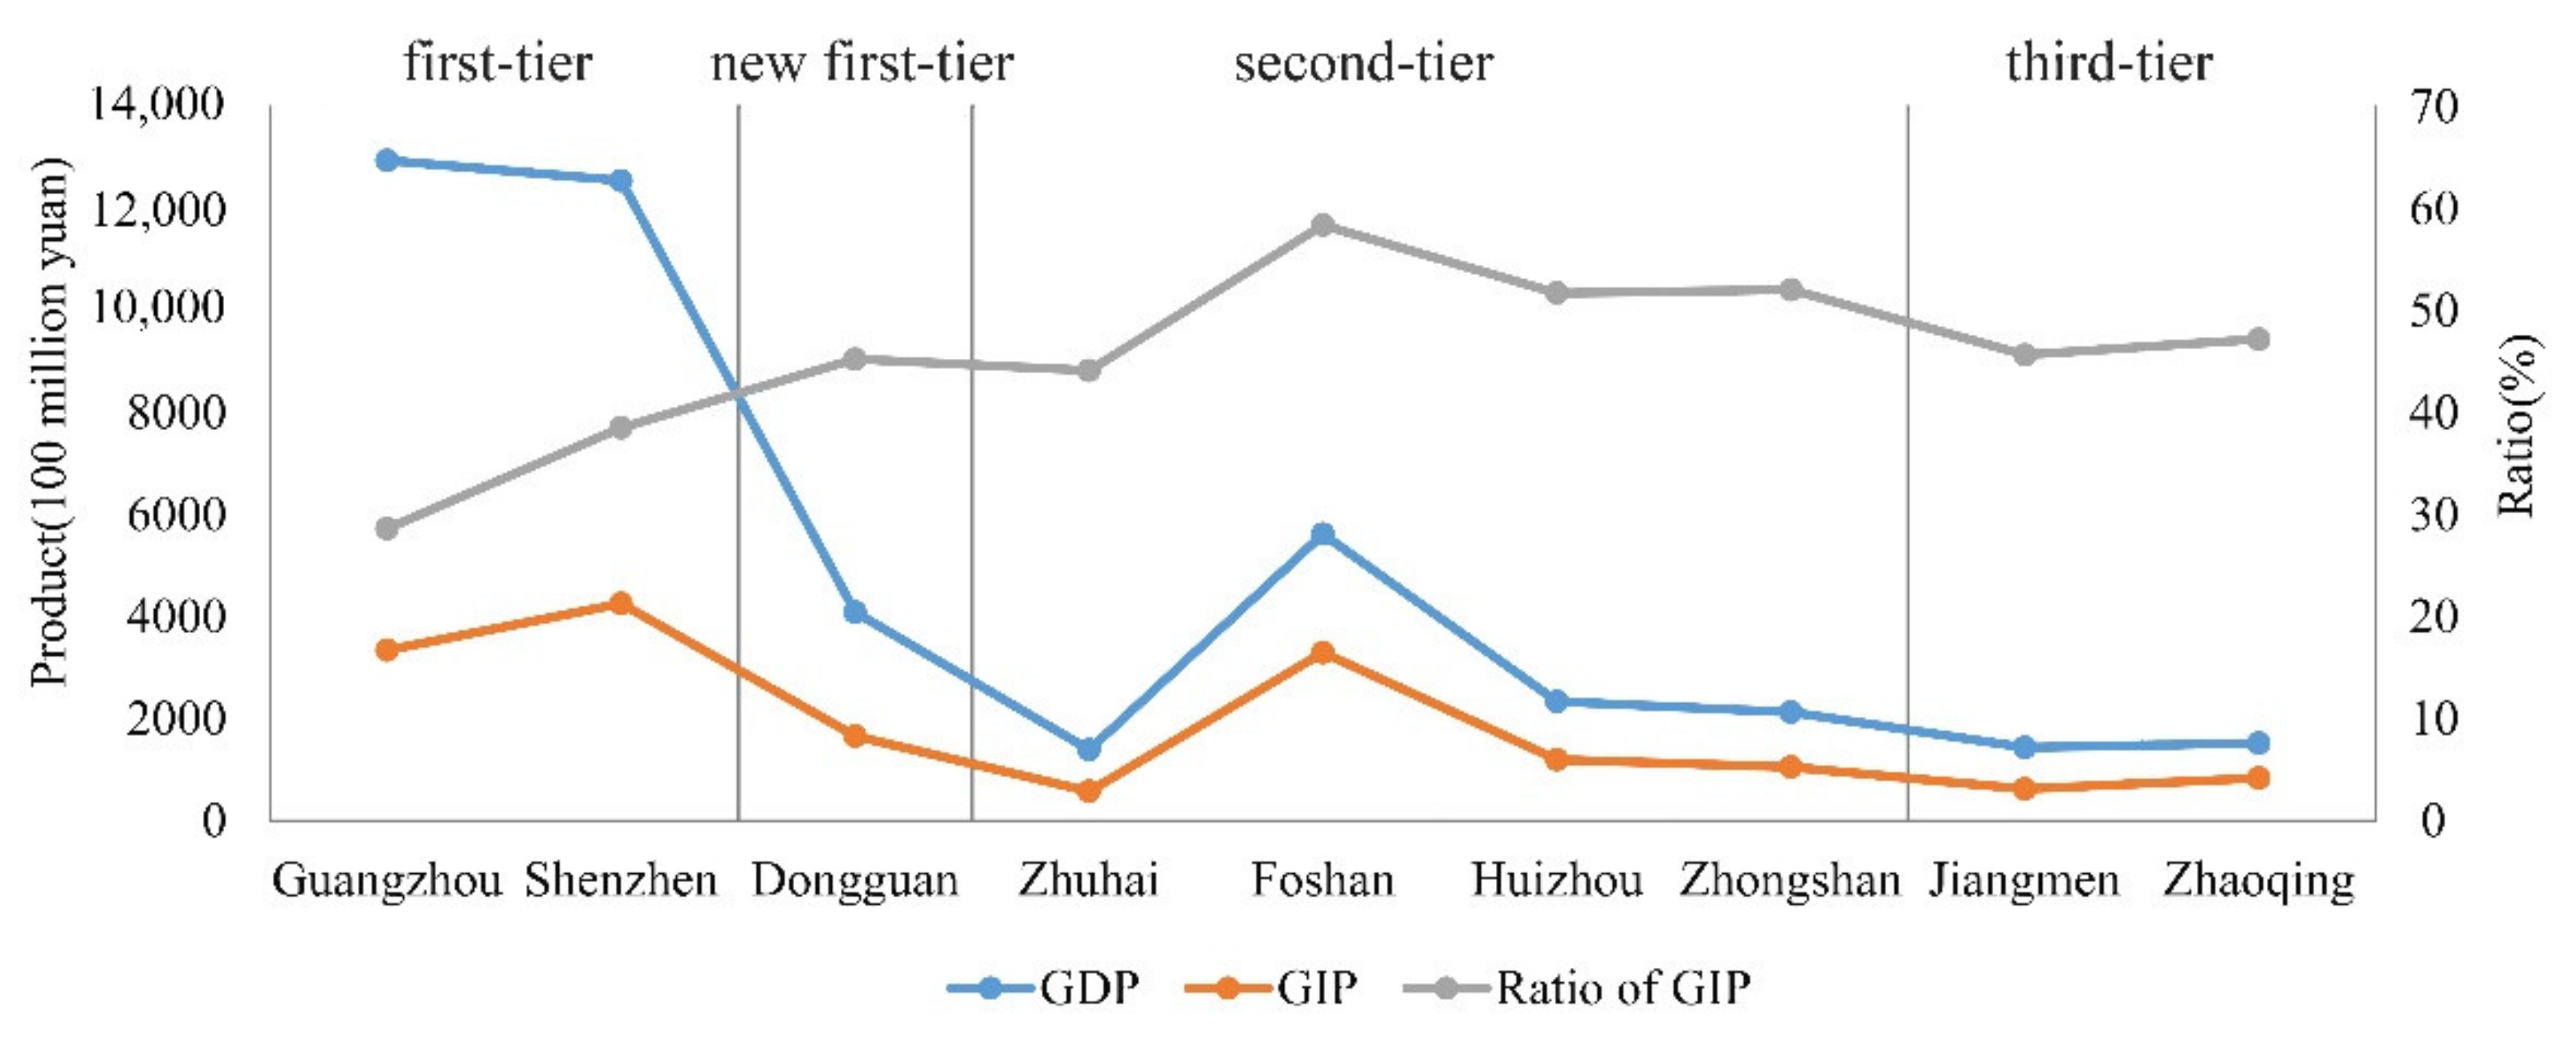
2. Study Area
3. Methods
3.1. LST Retrieval
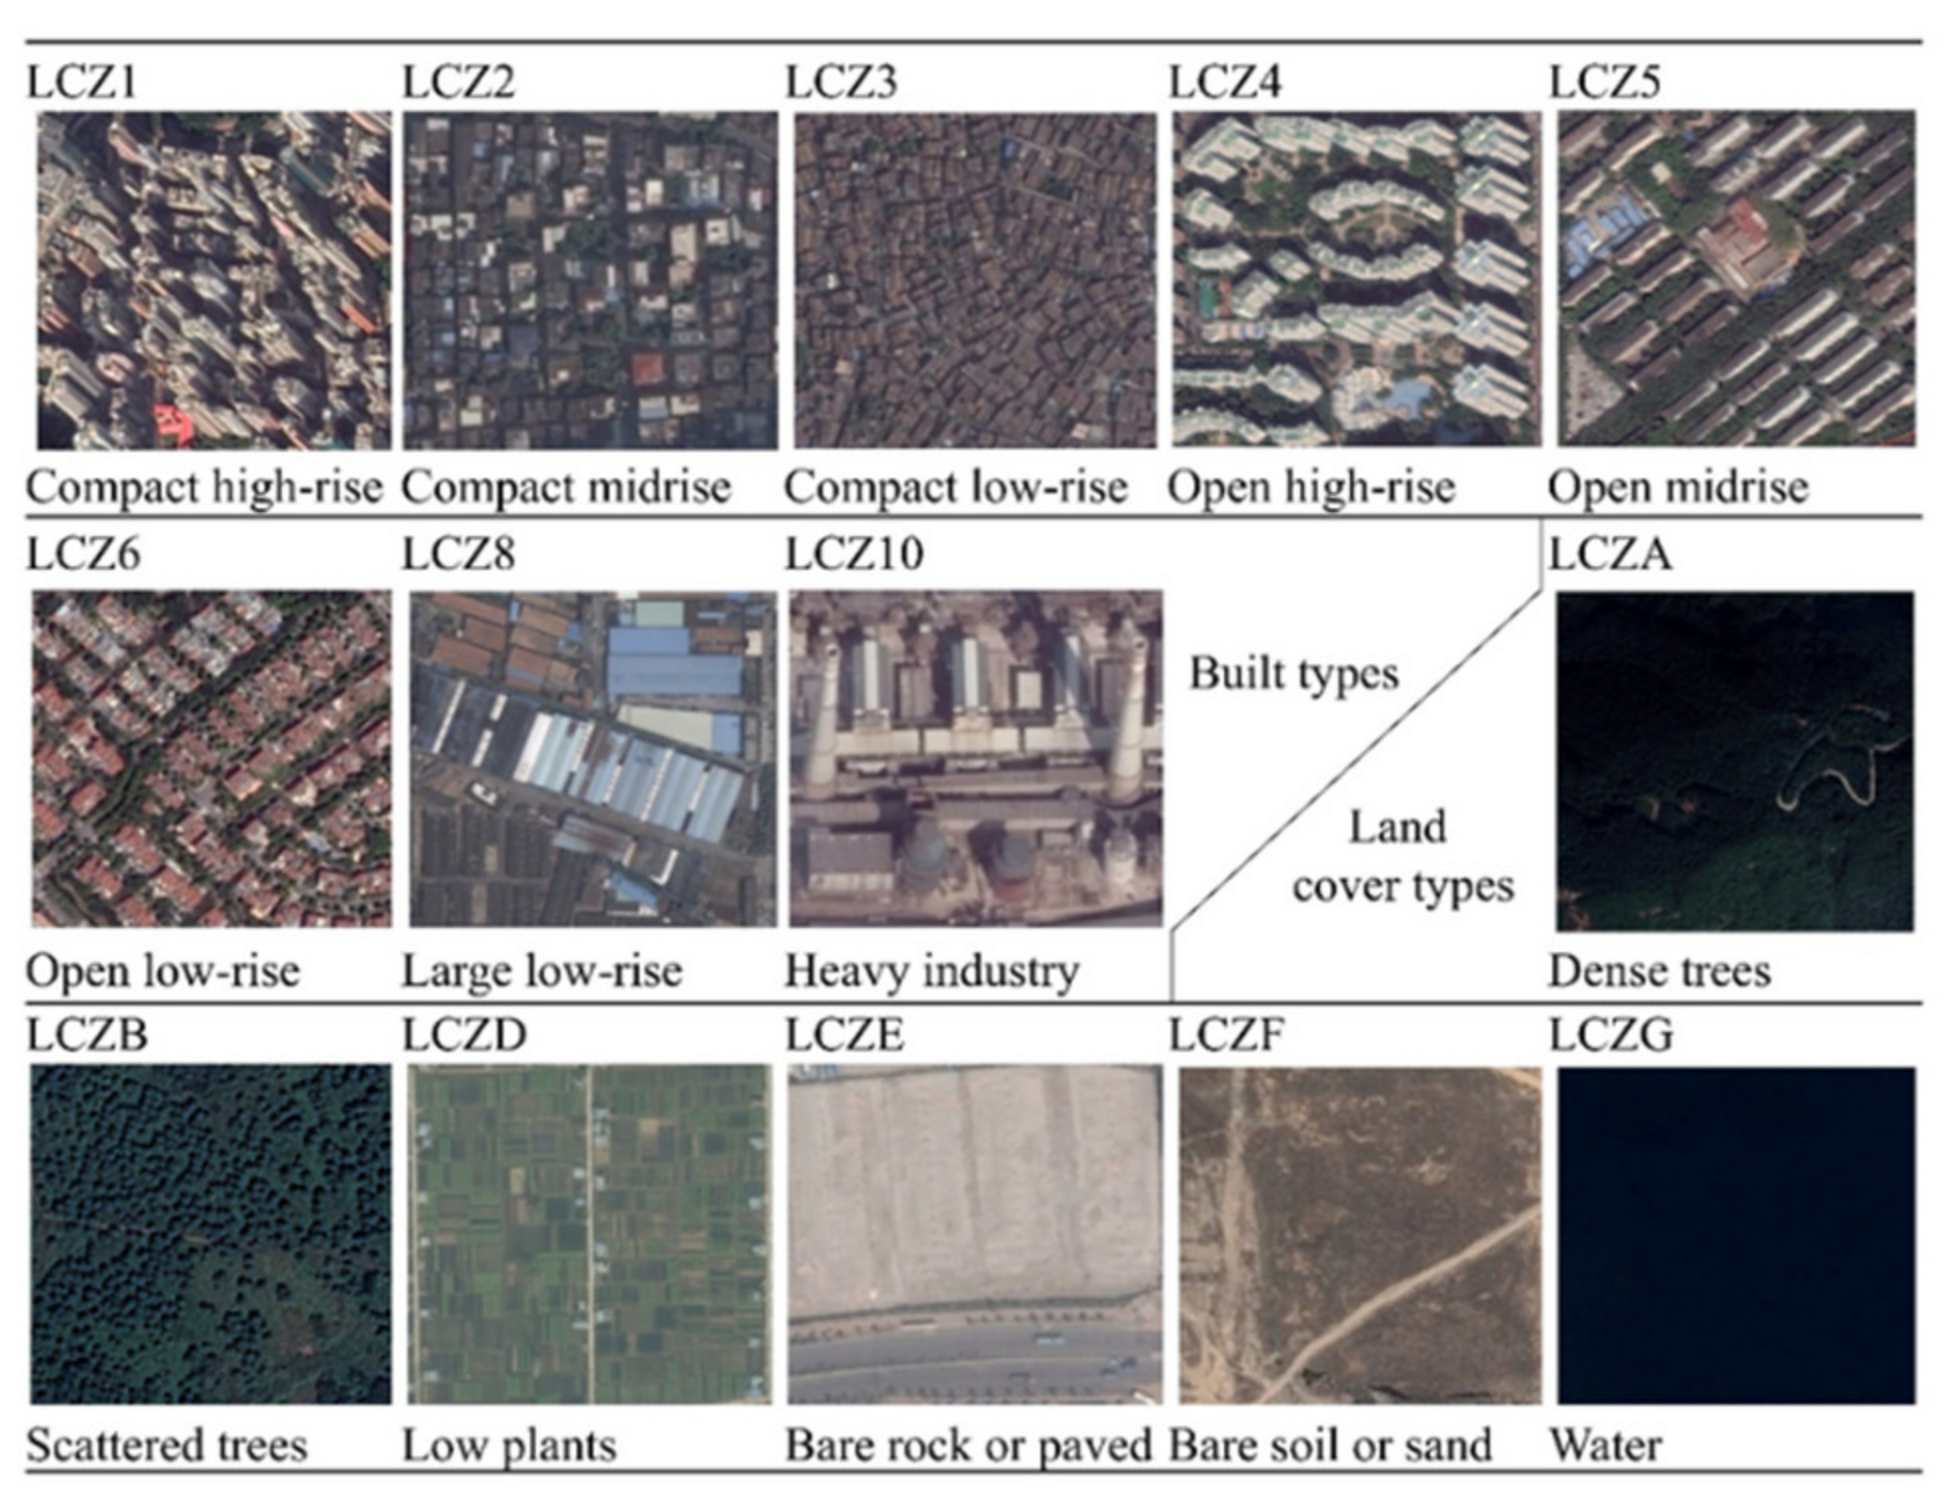
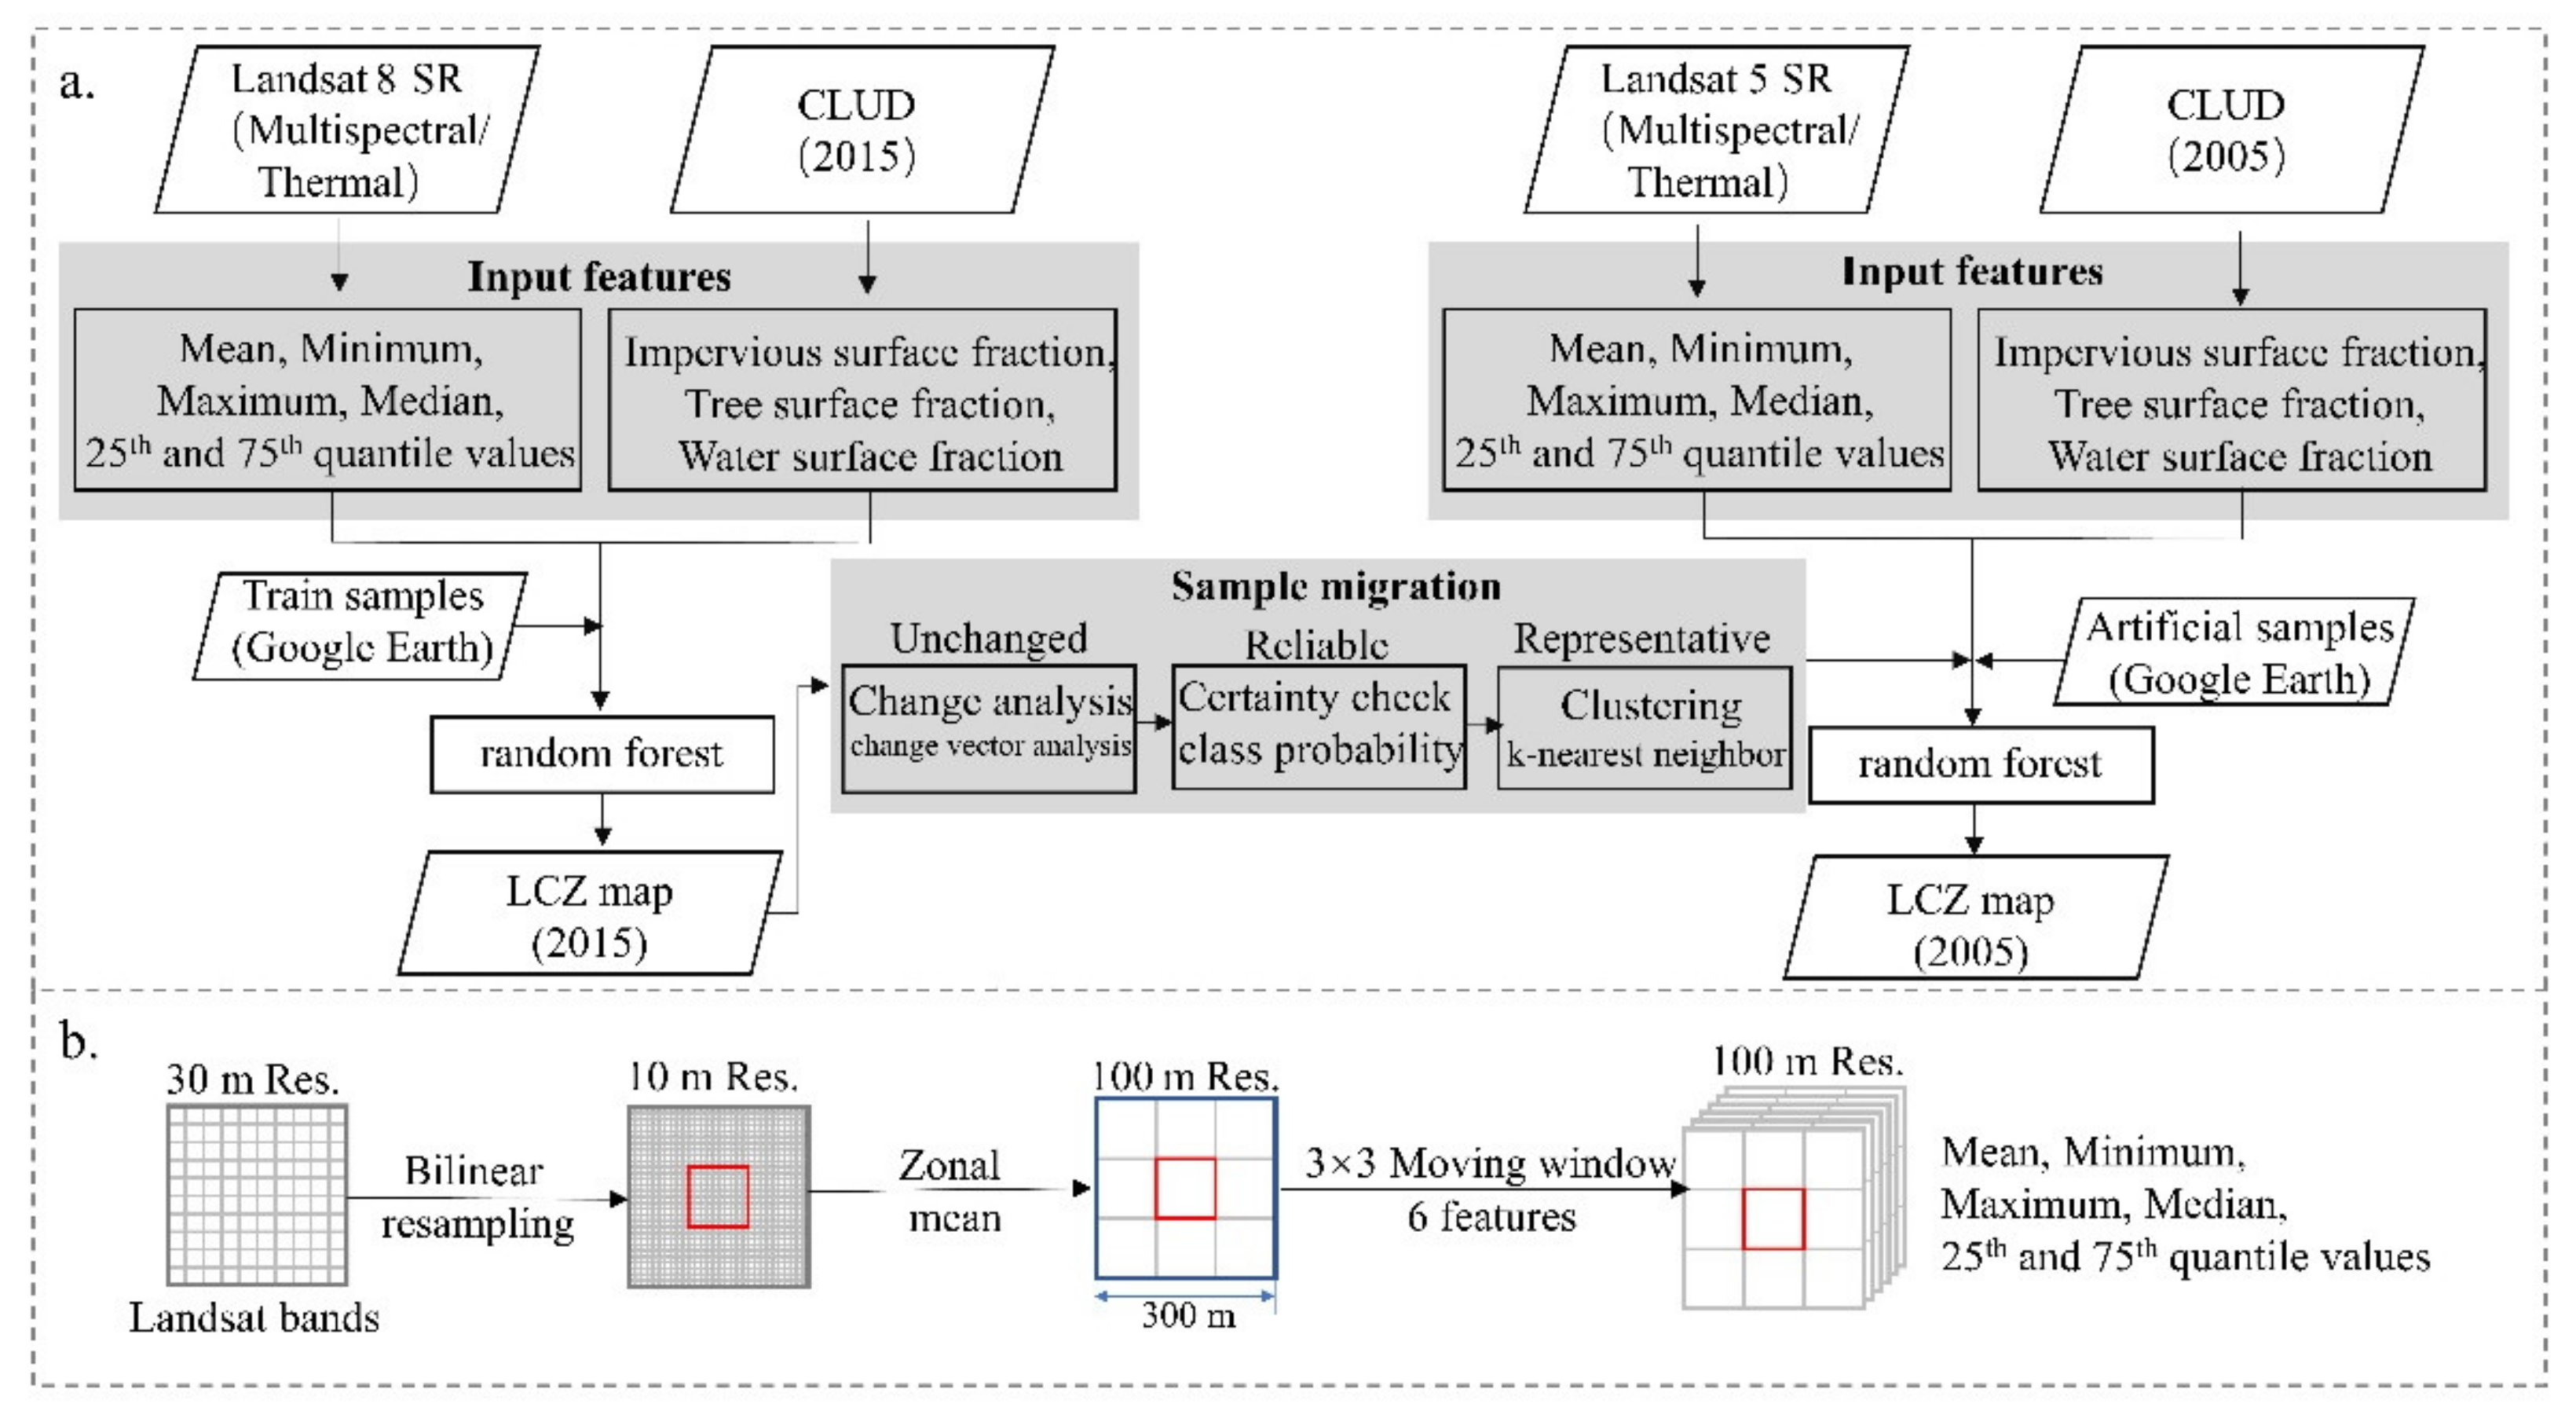
3.2. Time-Series LCZ Mapping
- (1)
- Unchanged: the change vector analysis (CVA) method was applied to determine whether a pixel had changed using the multispectral and thermal infrared bands of the two time phases [52,53]. The gray values of a pixel for 2005 and 2015 were, respectively, described by and , where represents the number of bands. The change vector was described as:The change magnitude was calculated by:A greater change magnitude corresponds to a higher possibility of image change. When the change intensity exceeds a specific threshold, it can be treated as a changed pixel.
- (2)
- Reliable: in a region where the images had not changed, only the positions with higher reliability in the time 1 image classification could be considered as samples for time 2. The reliability of a pixel was measured by the classification probability of the image [54], and the classification certainty of pixel was defined as:where are descending probabilistic outputs; refers to the number of probabilistic outputs.
- (3)
- Representative: the candidate samples were further refined according to their representativeness in order to reduce the redundancy. Specifically, on the basis of the invariability and reliability of the samples, the k-nearest neighbor algorithm was adopted to further select representative samples [55].
3.3. Analysis of the LCZ and LST Changes
4. Results and Discussion
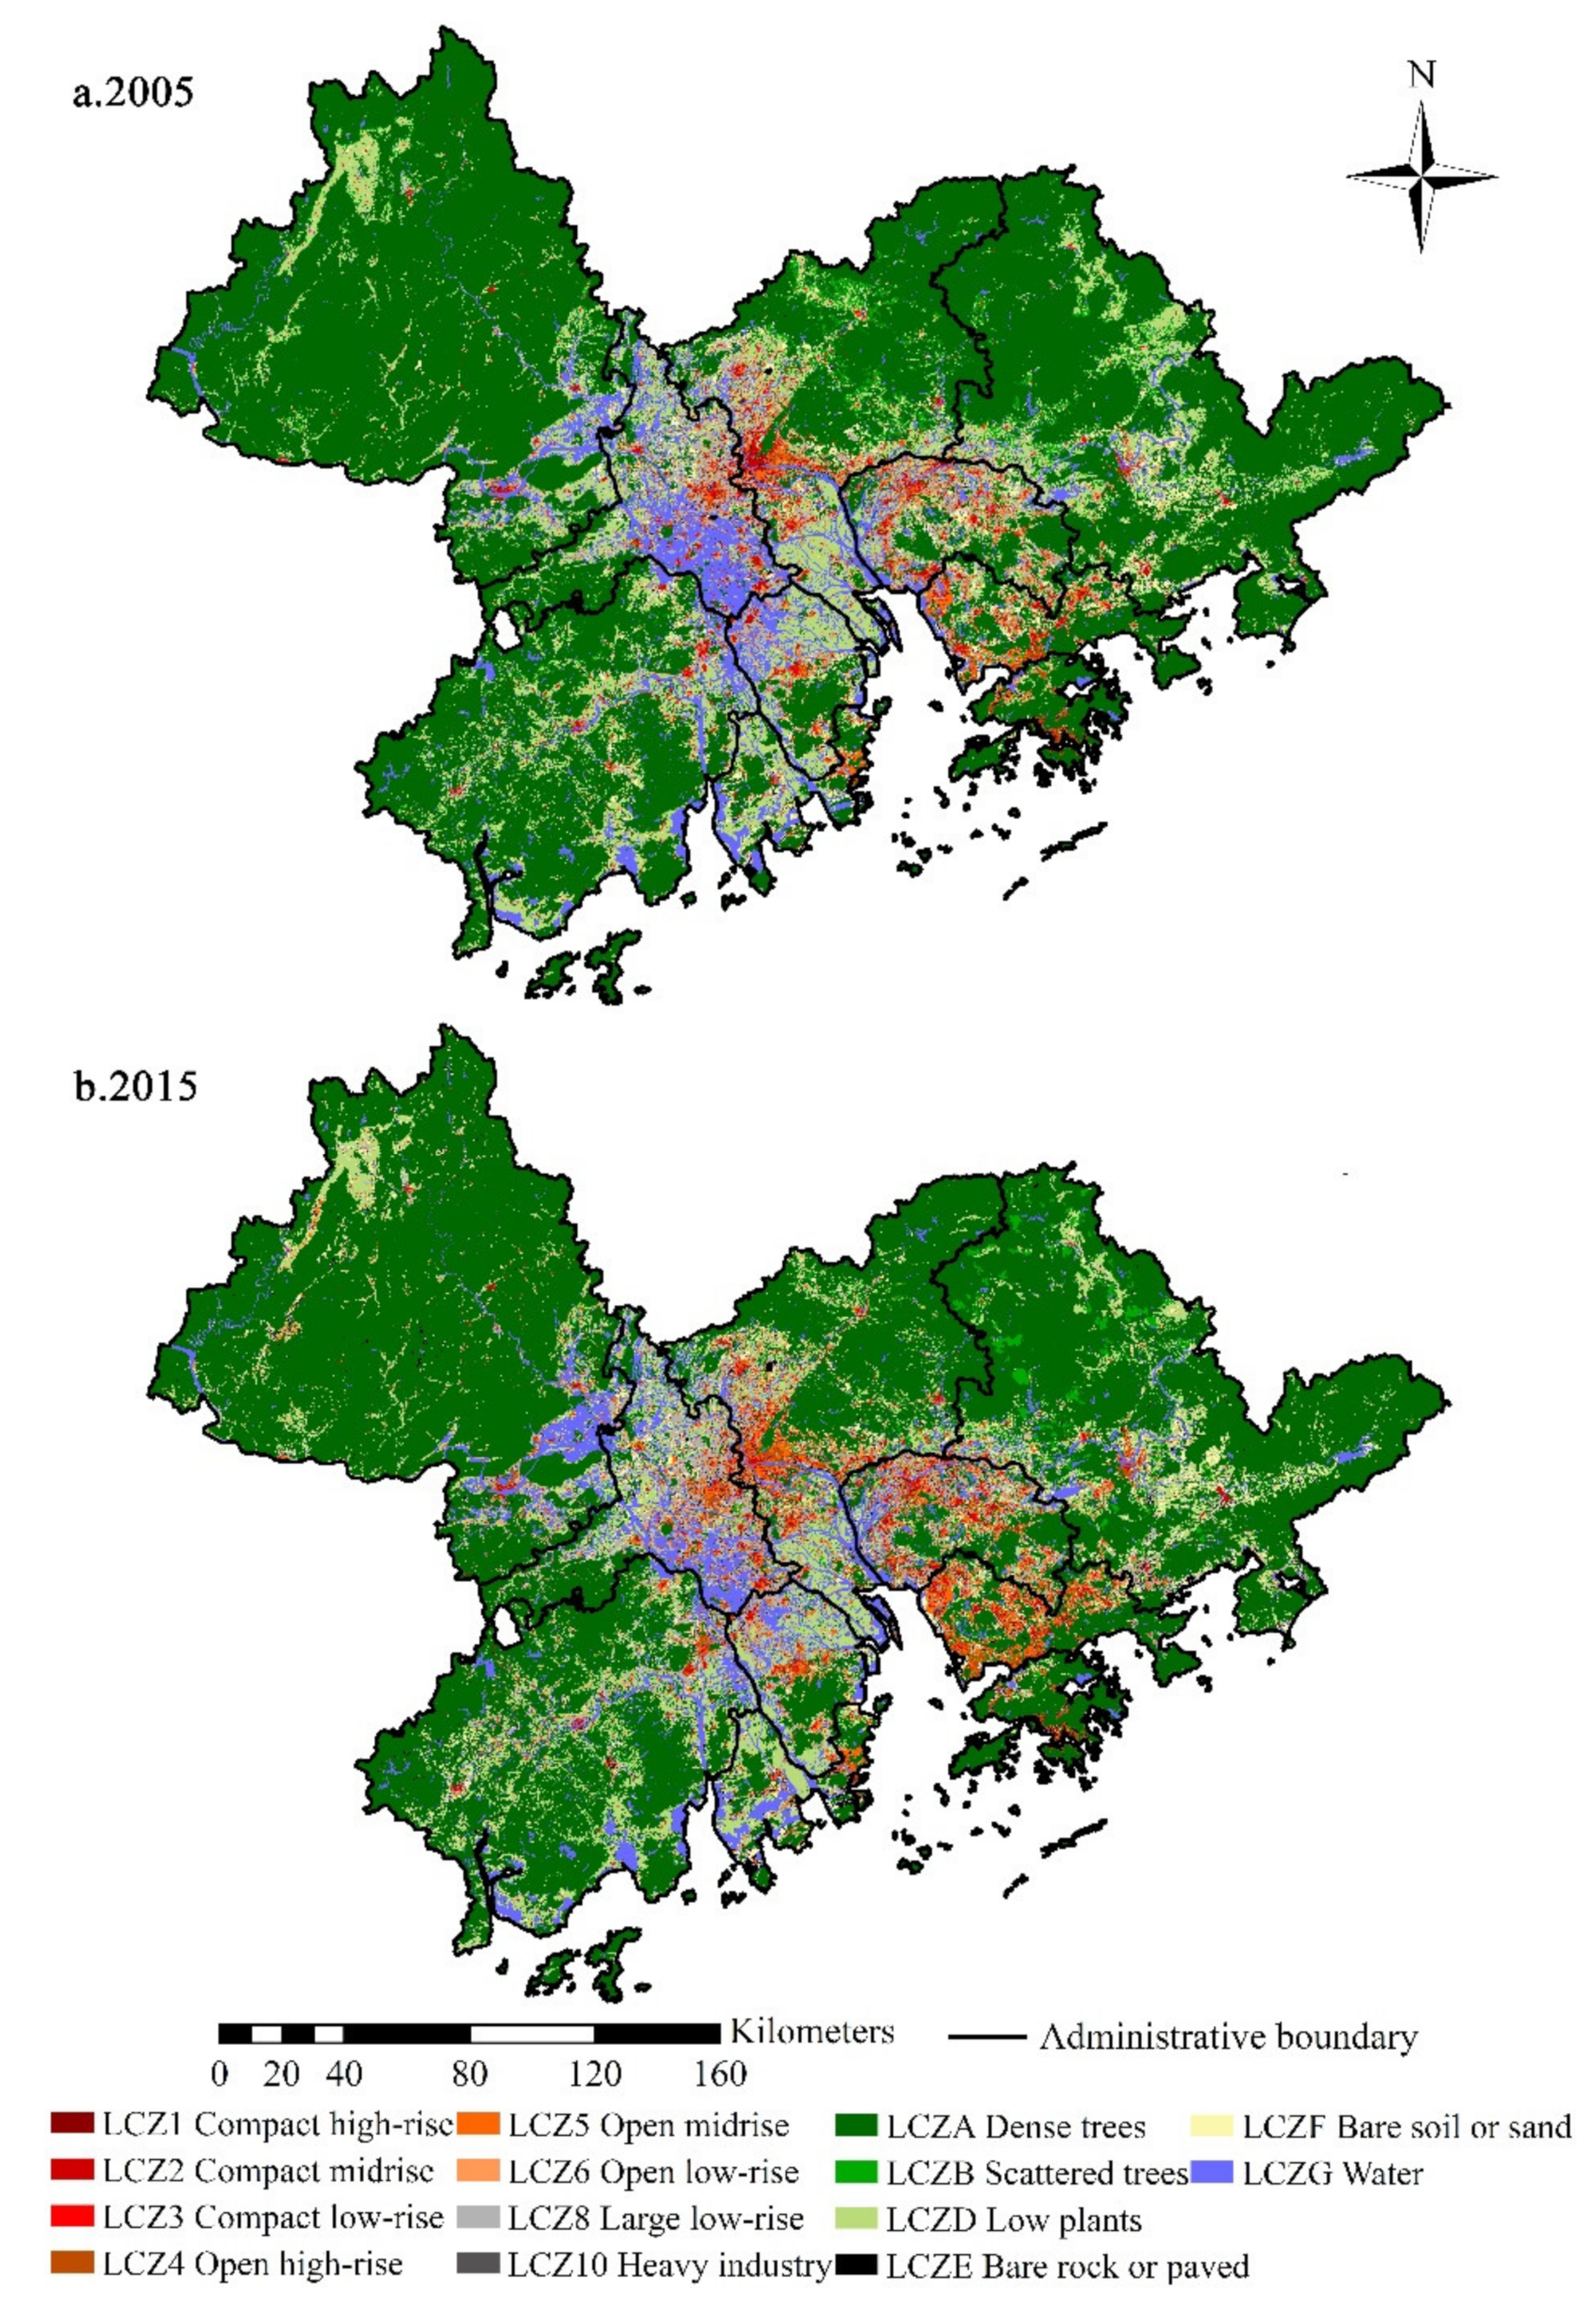
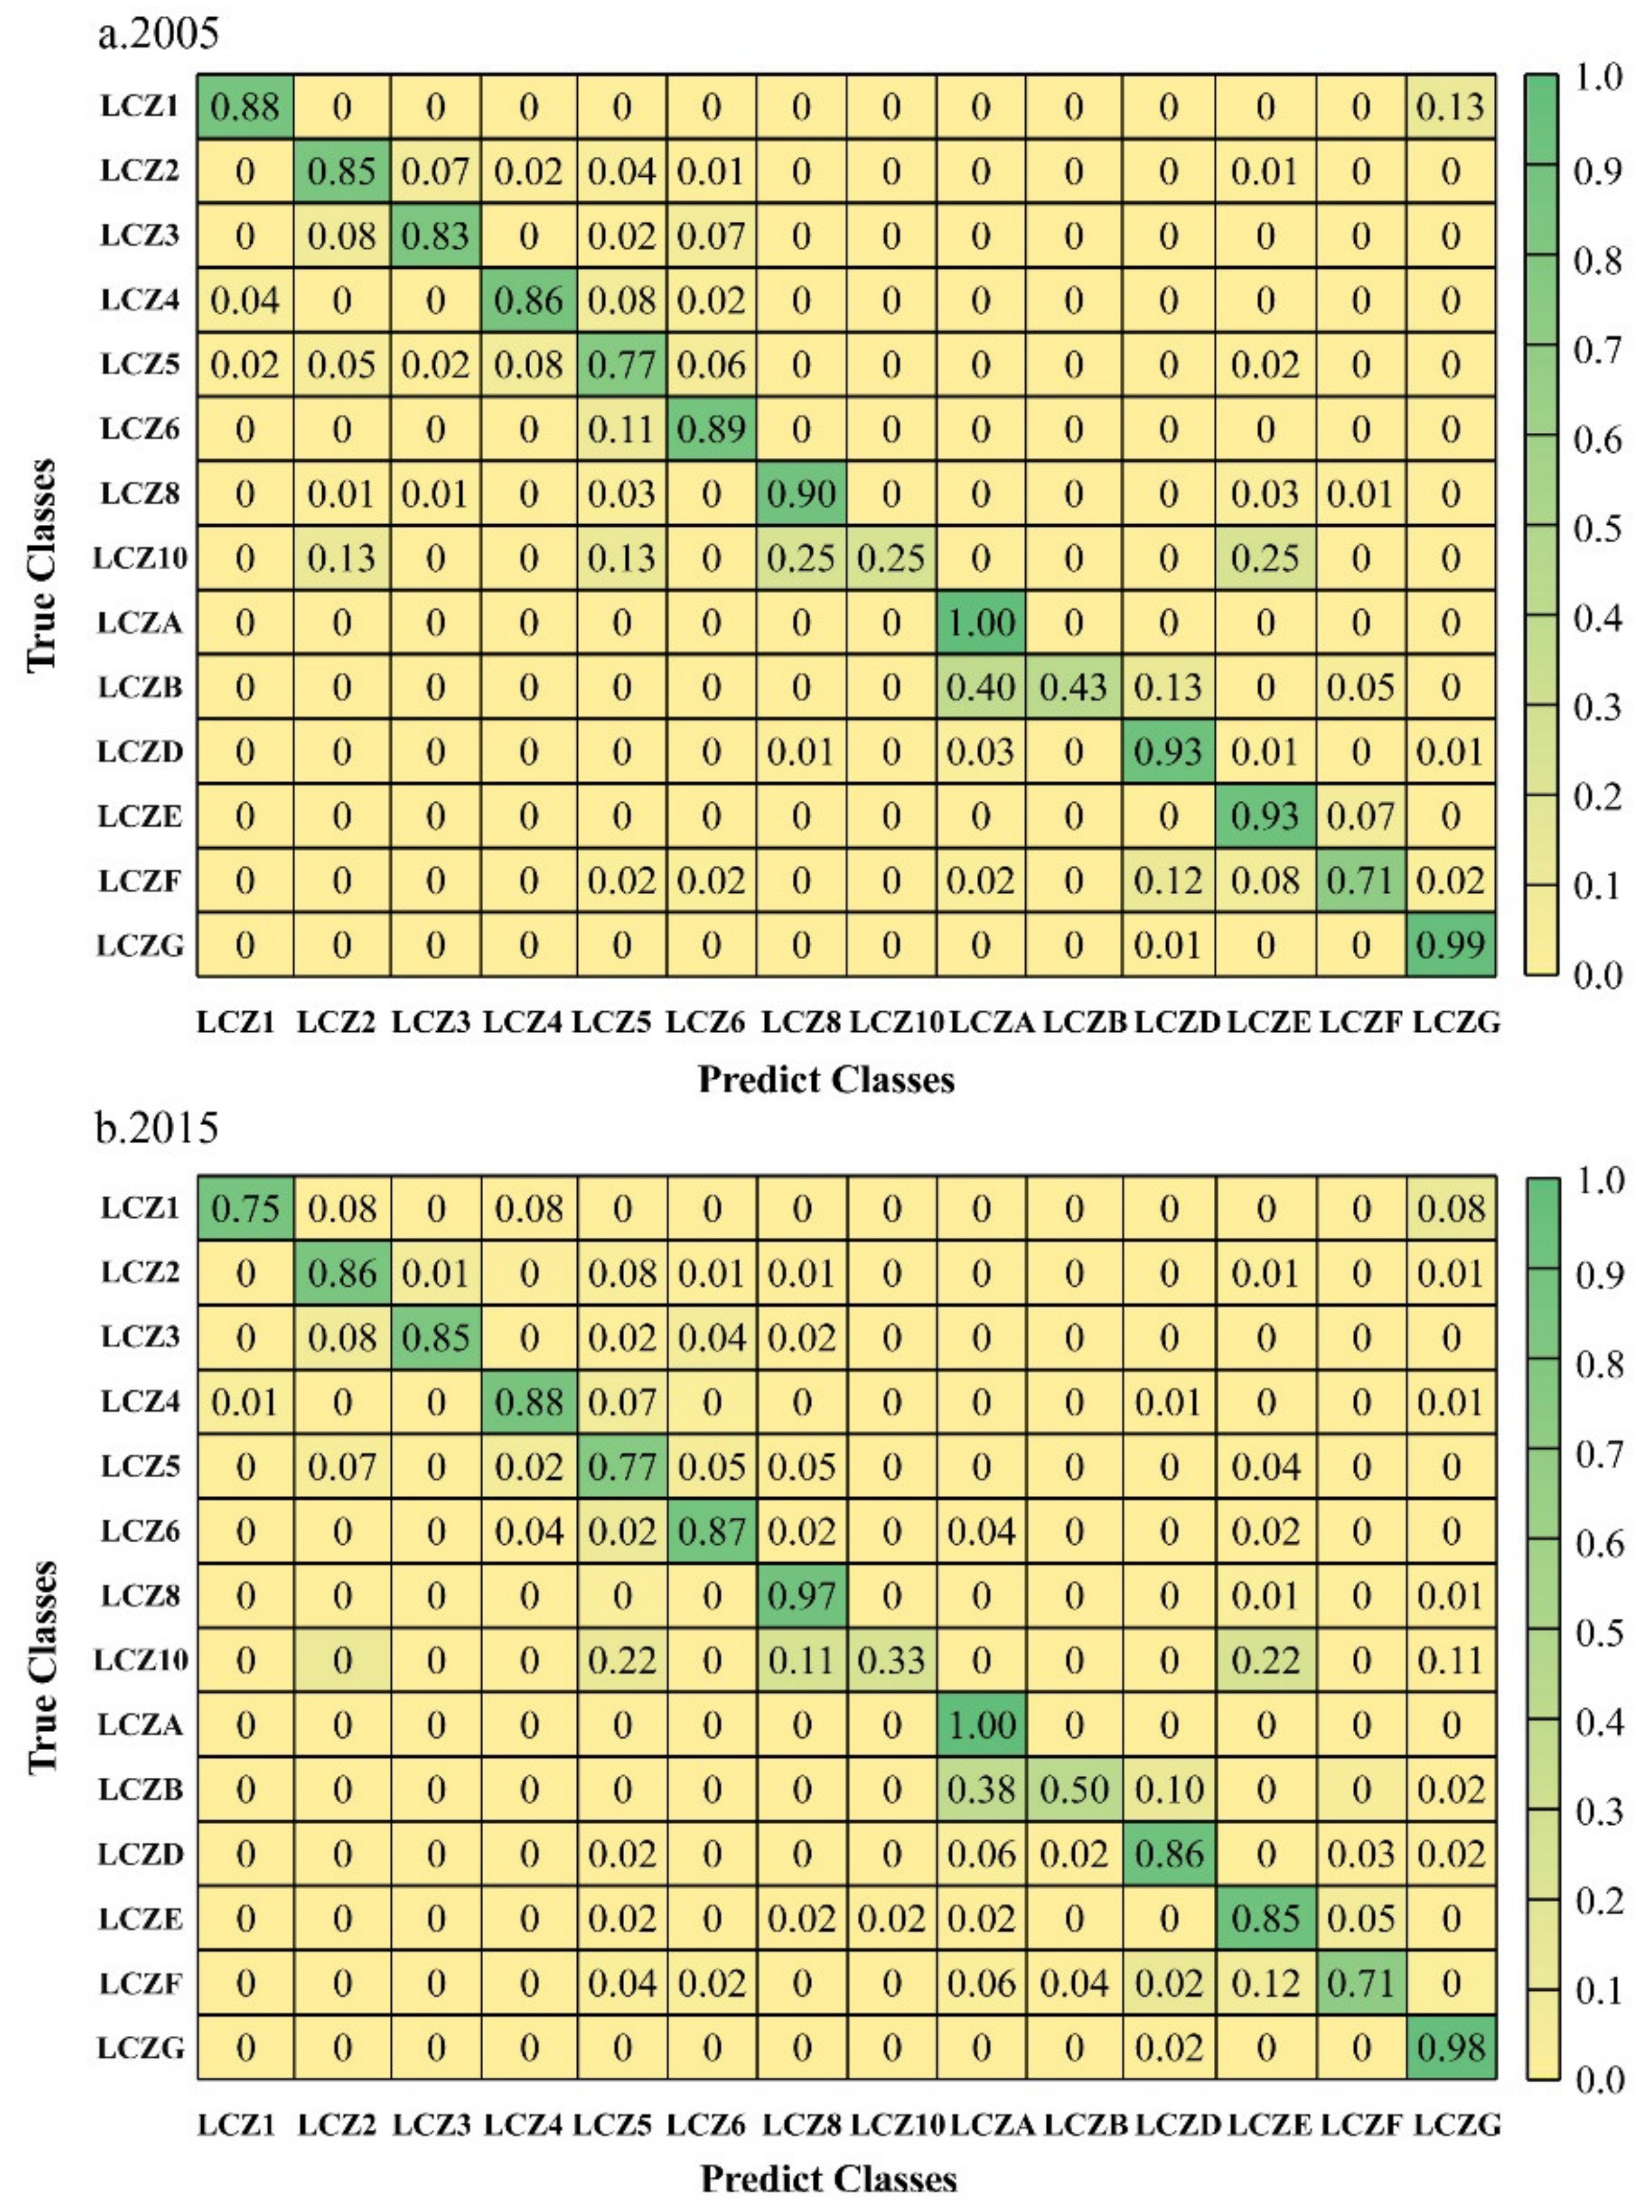
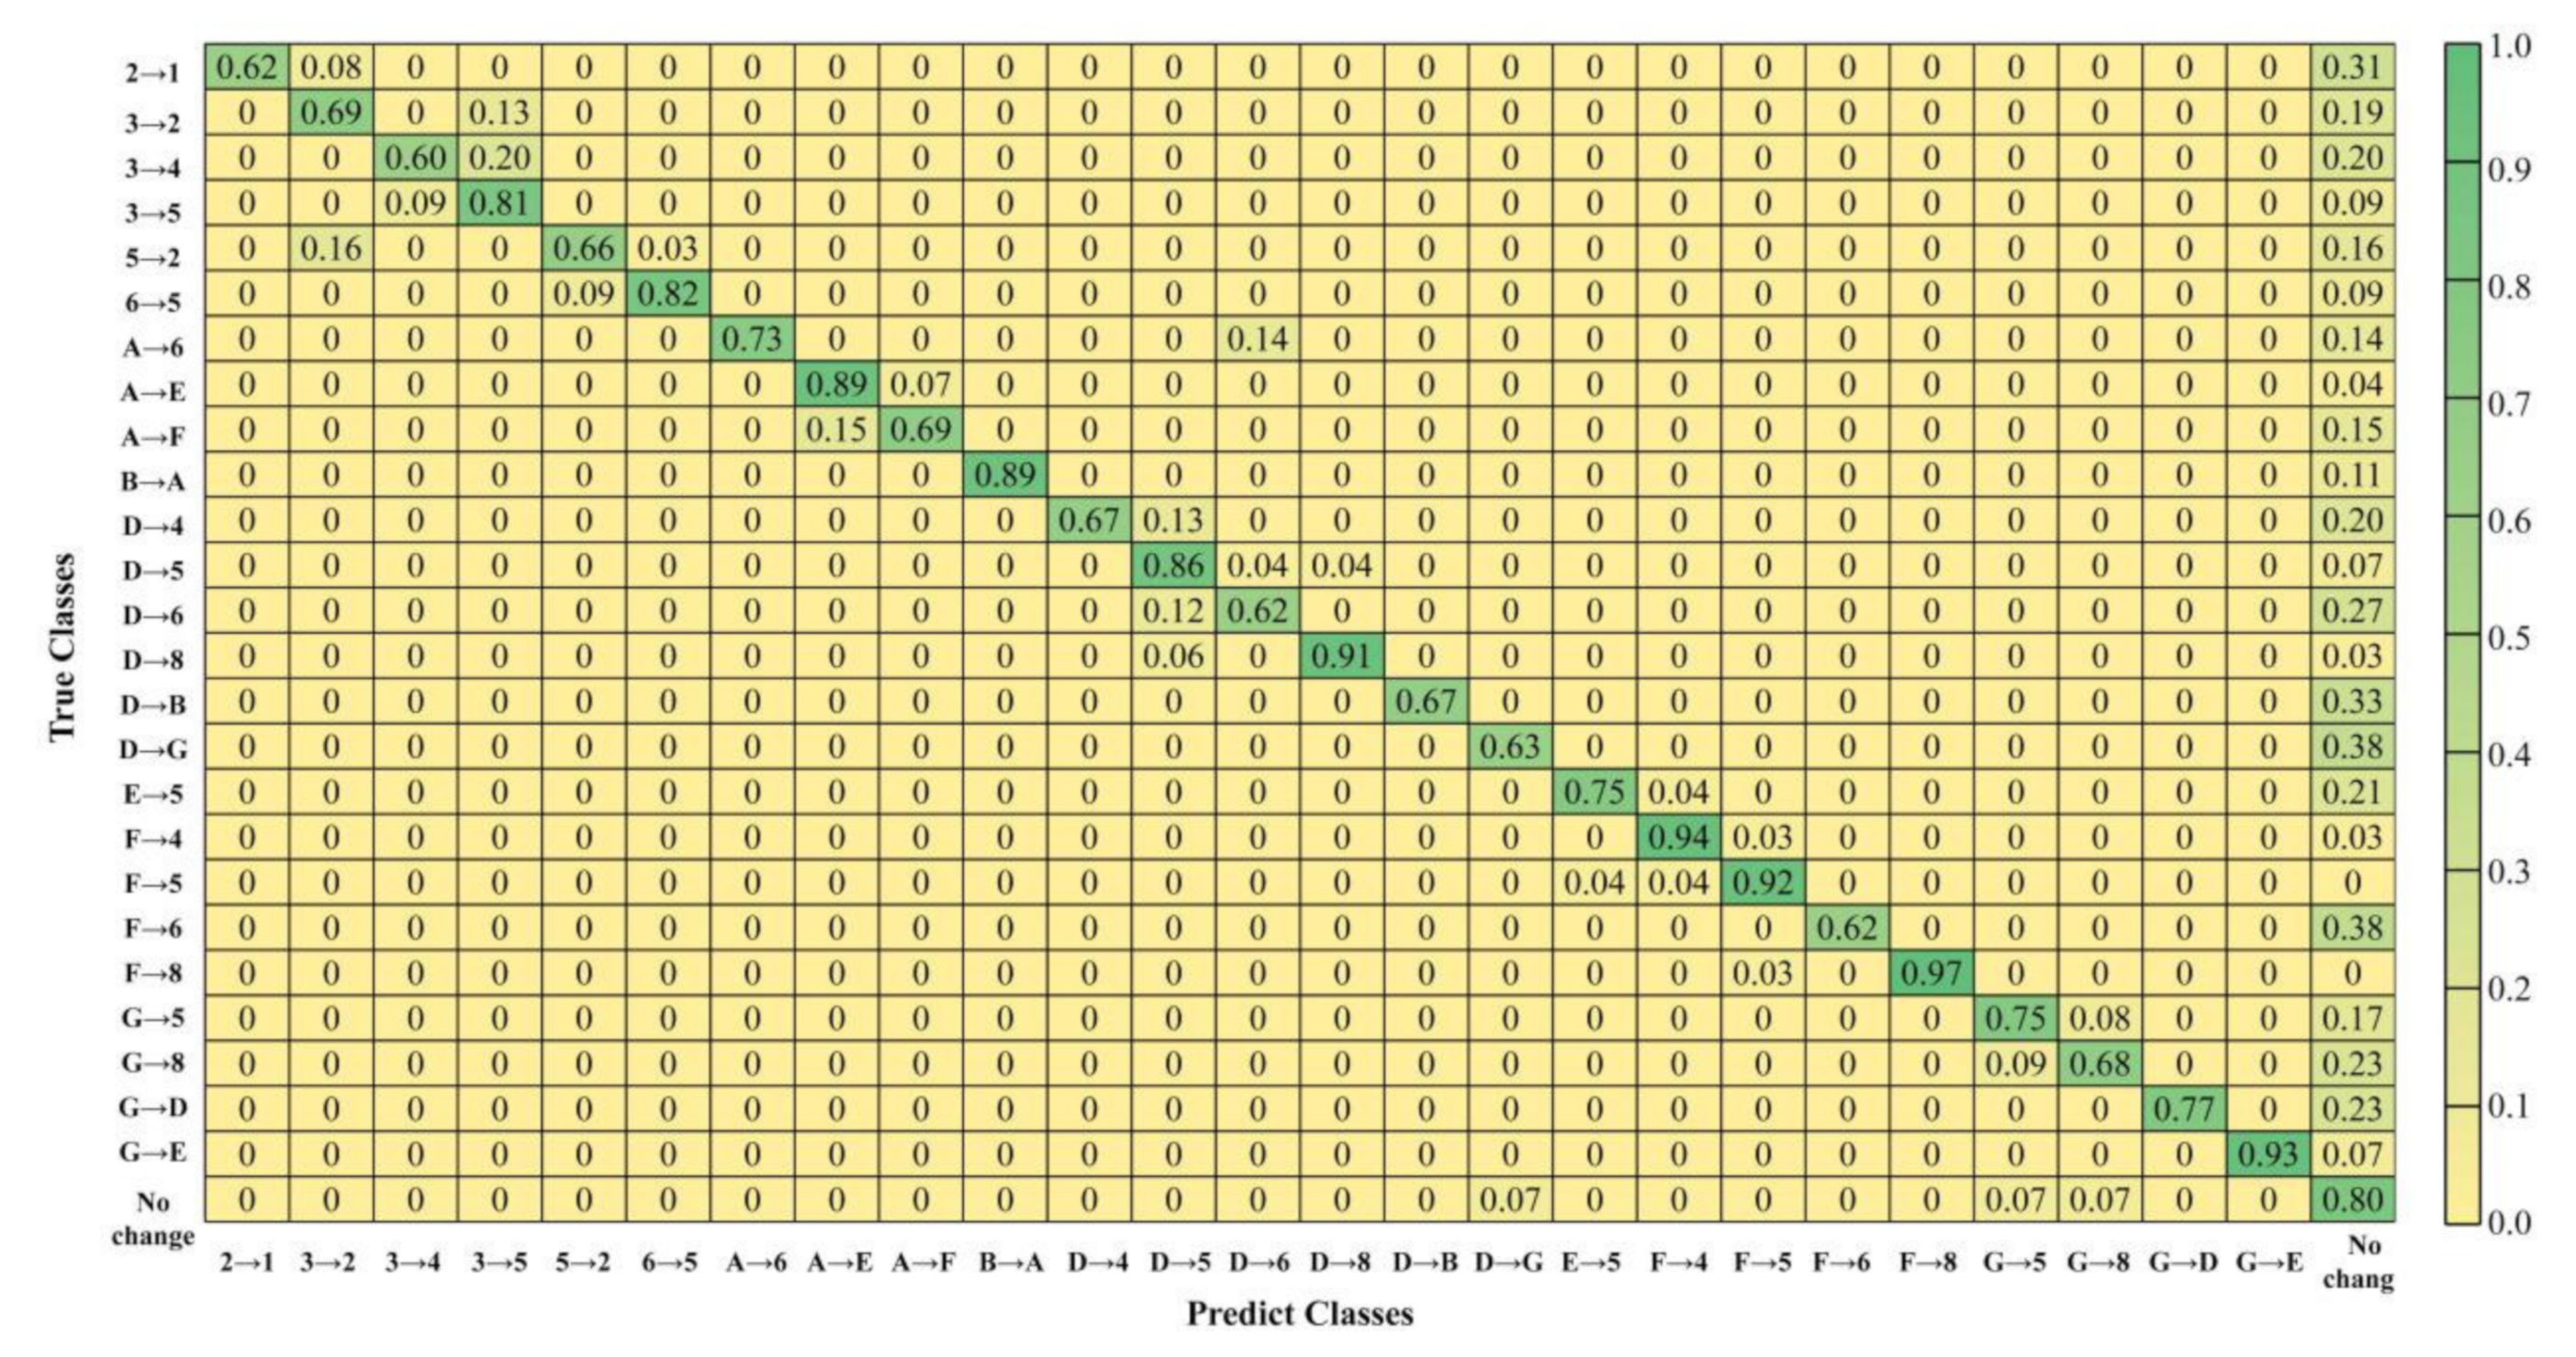
4.1. LCZ Classification Results and Analysis of the LCZ Changes
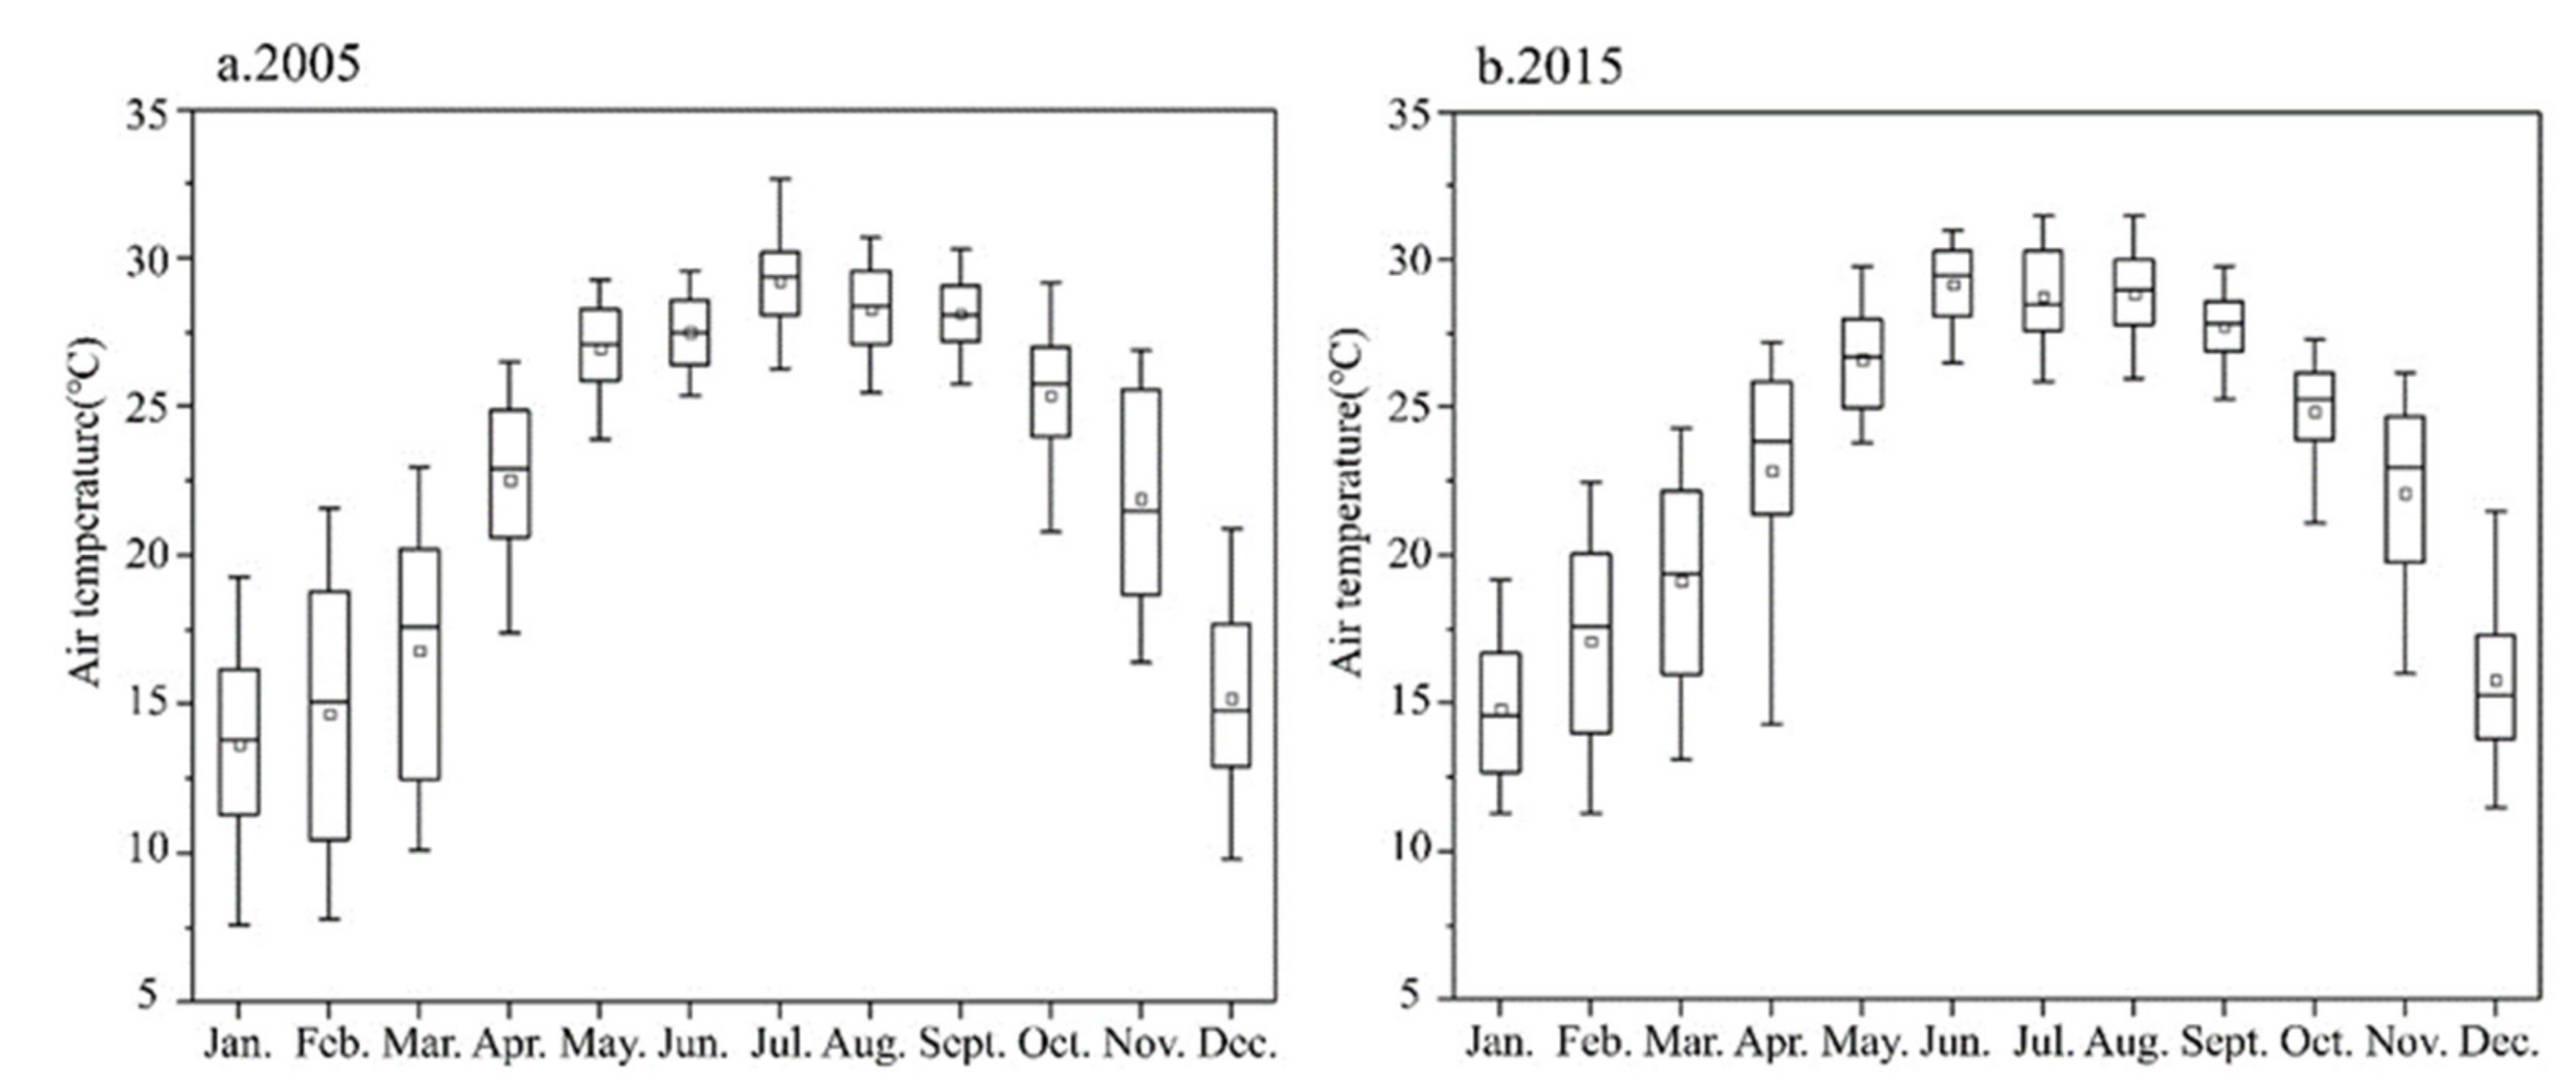
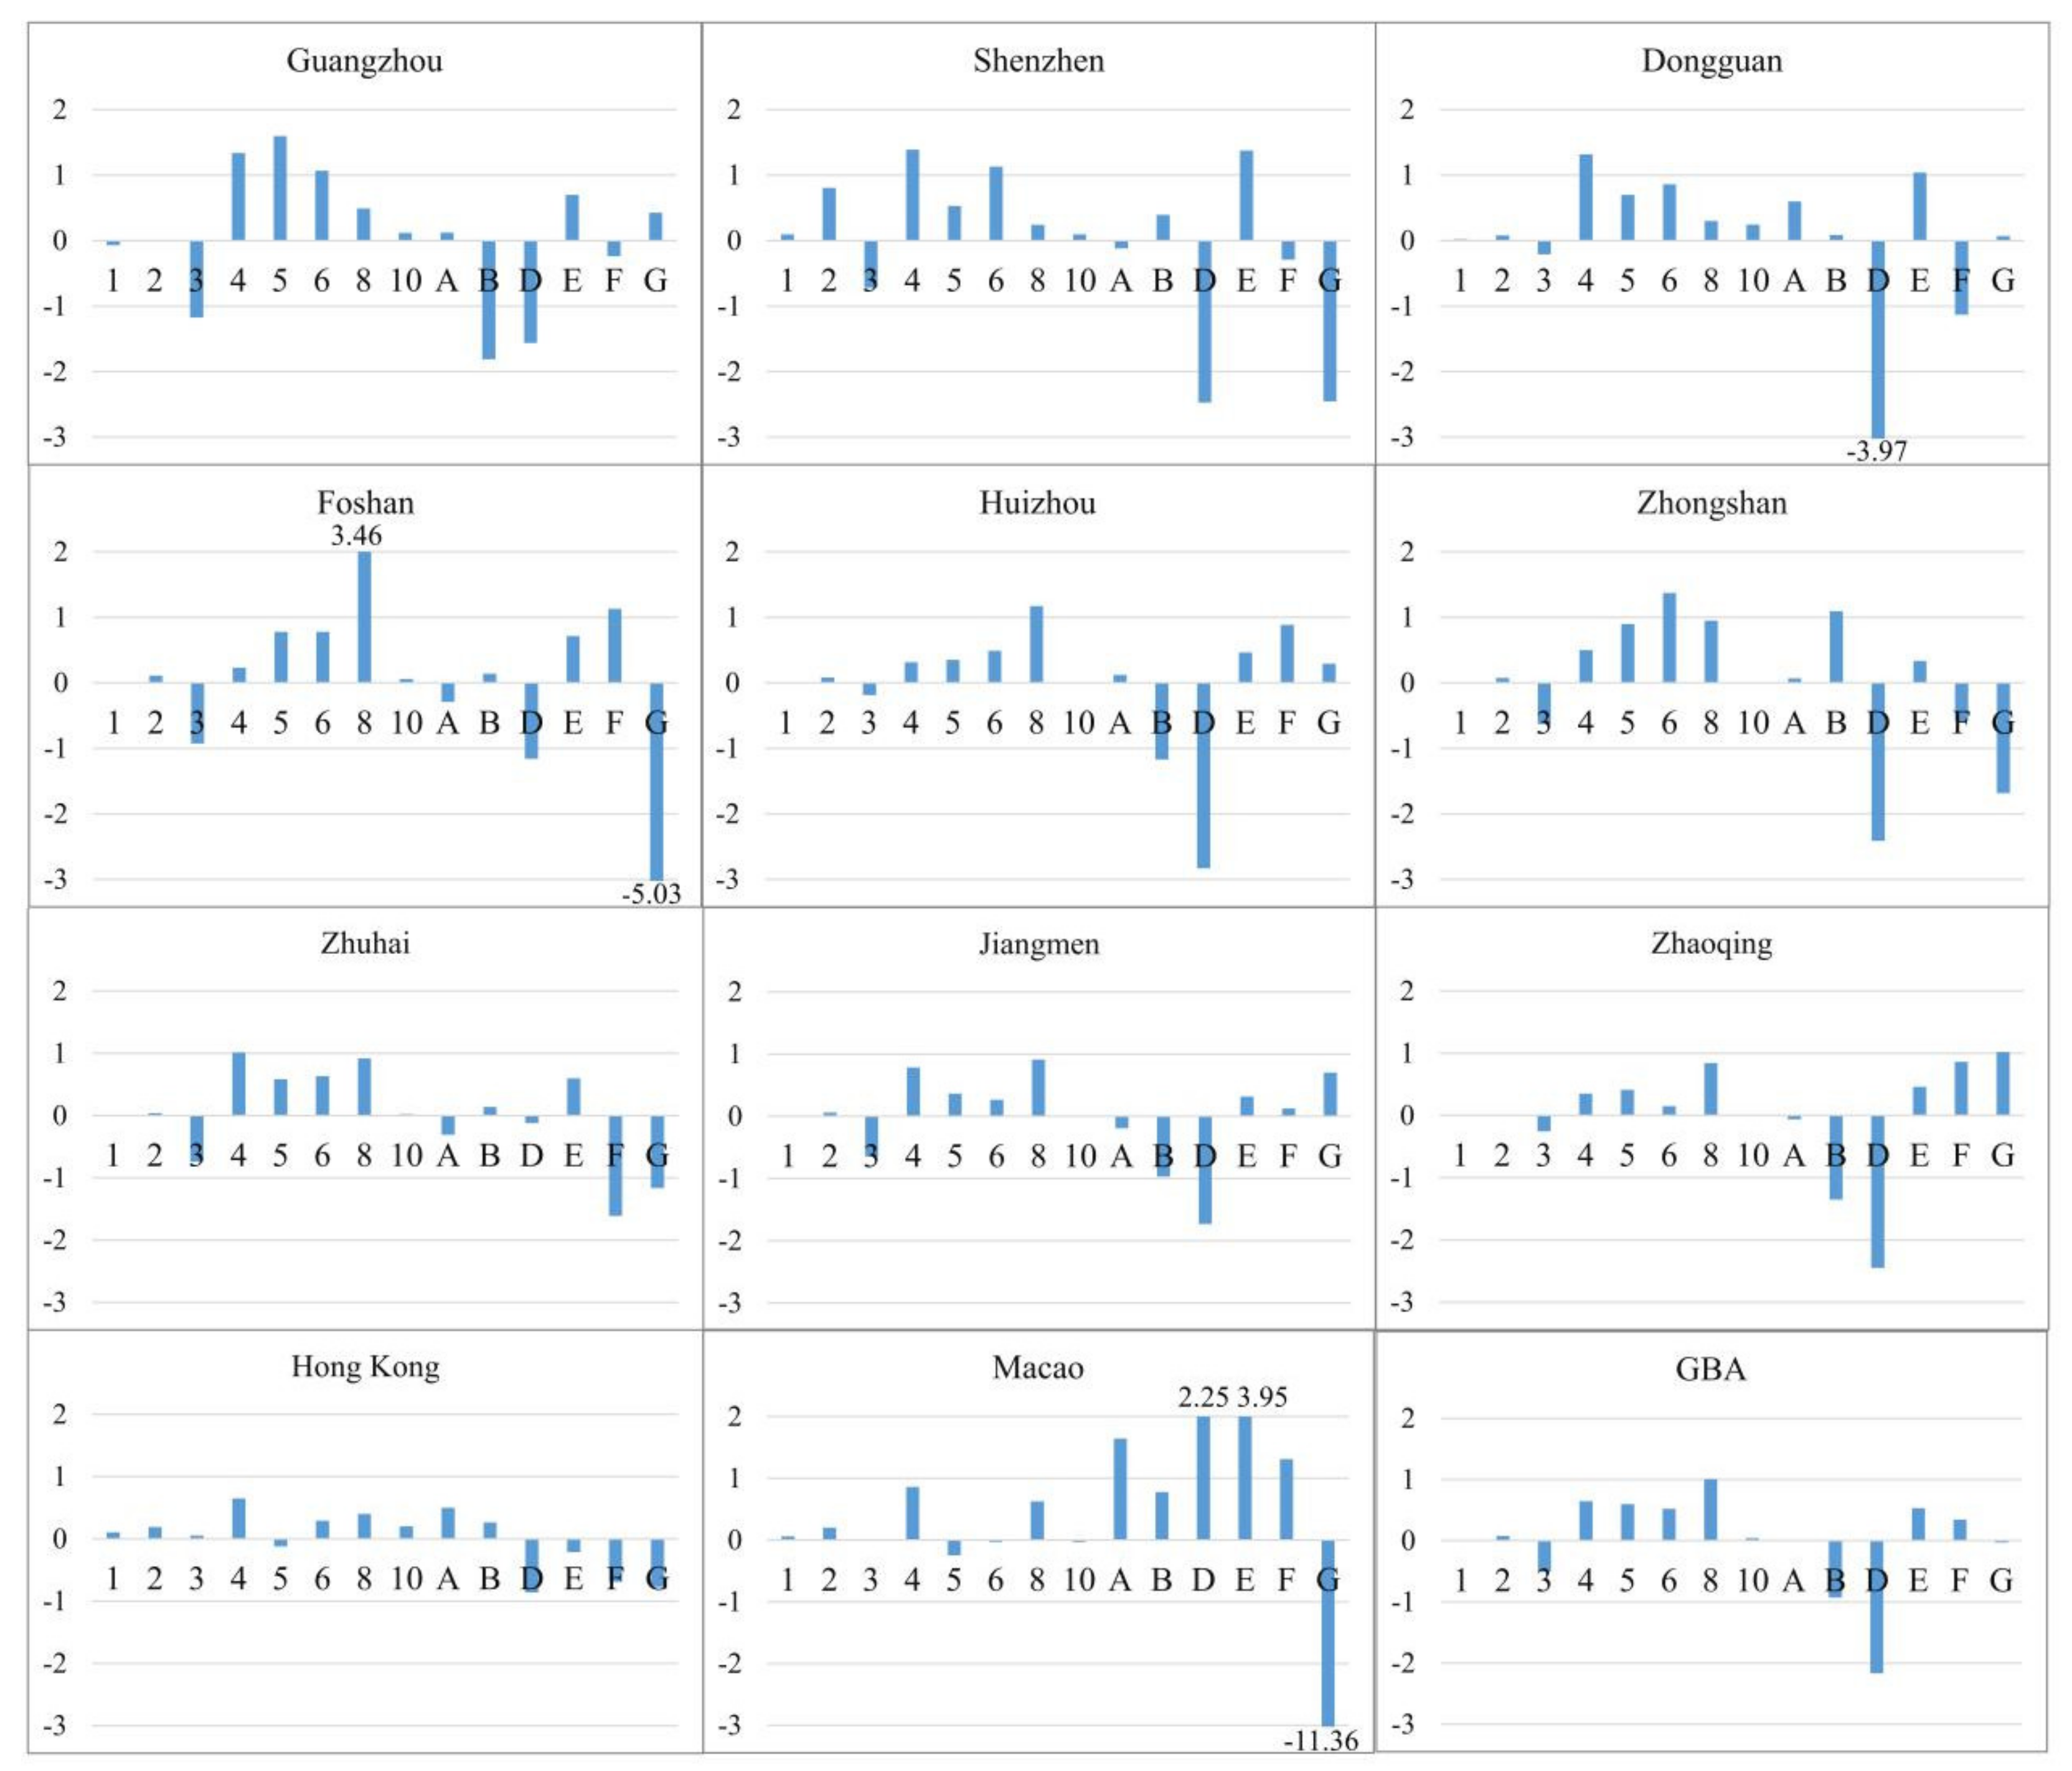
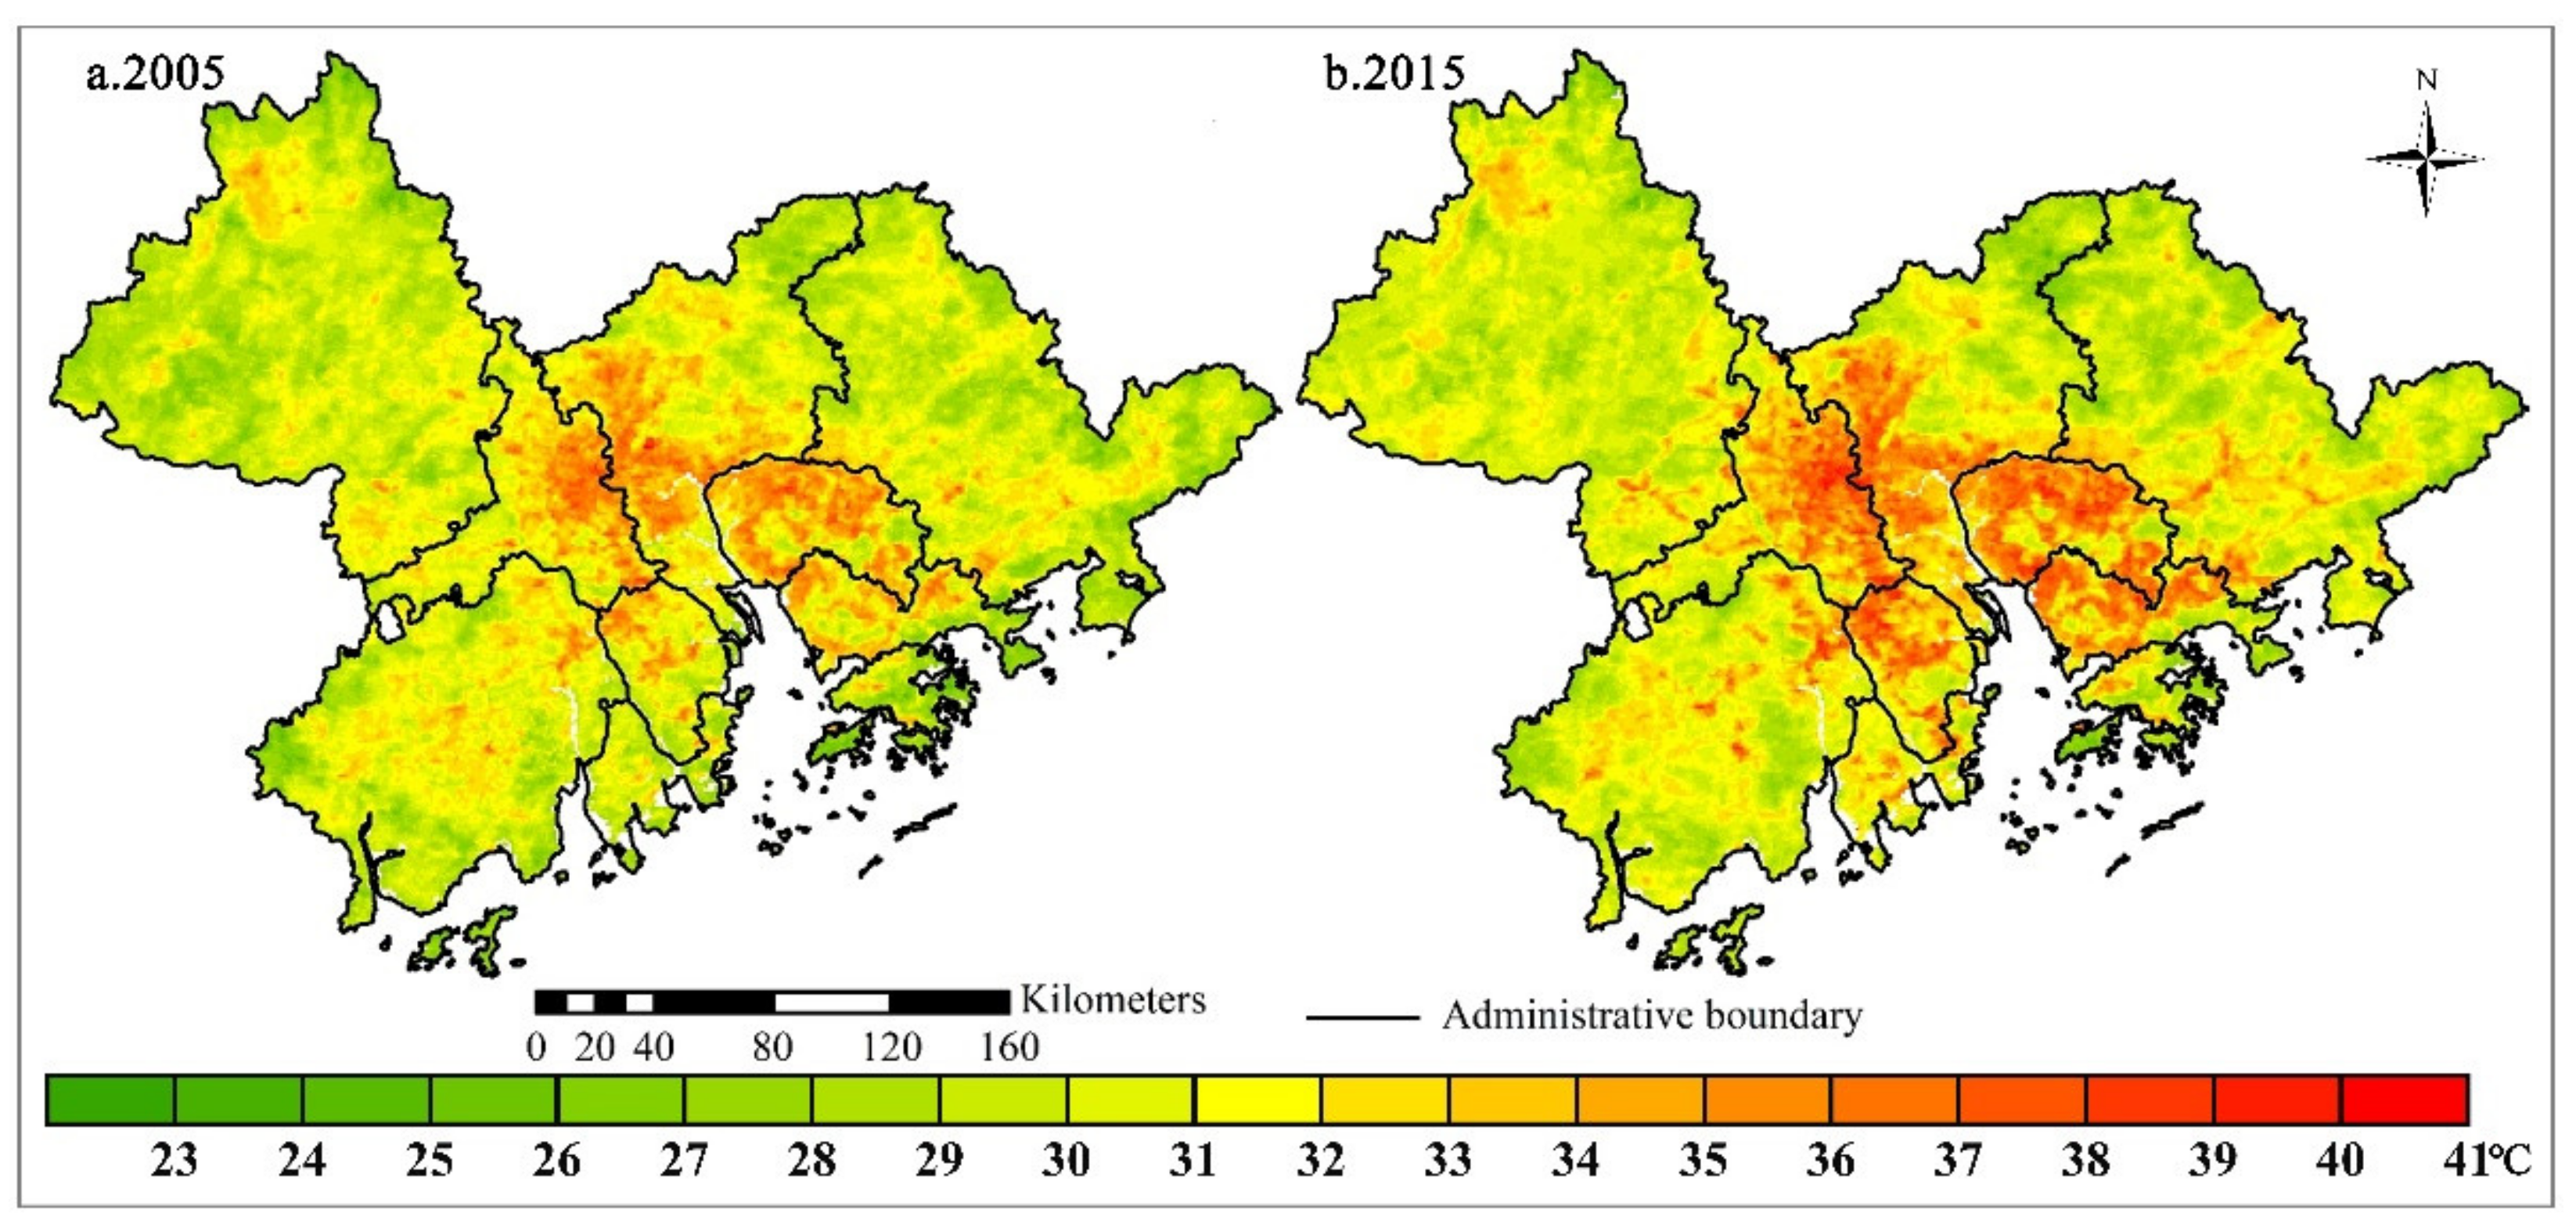
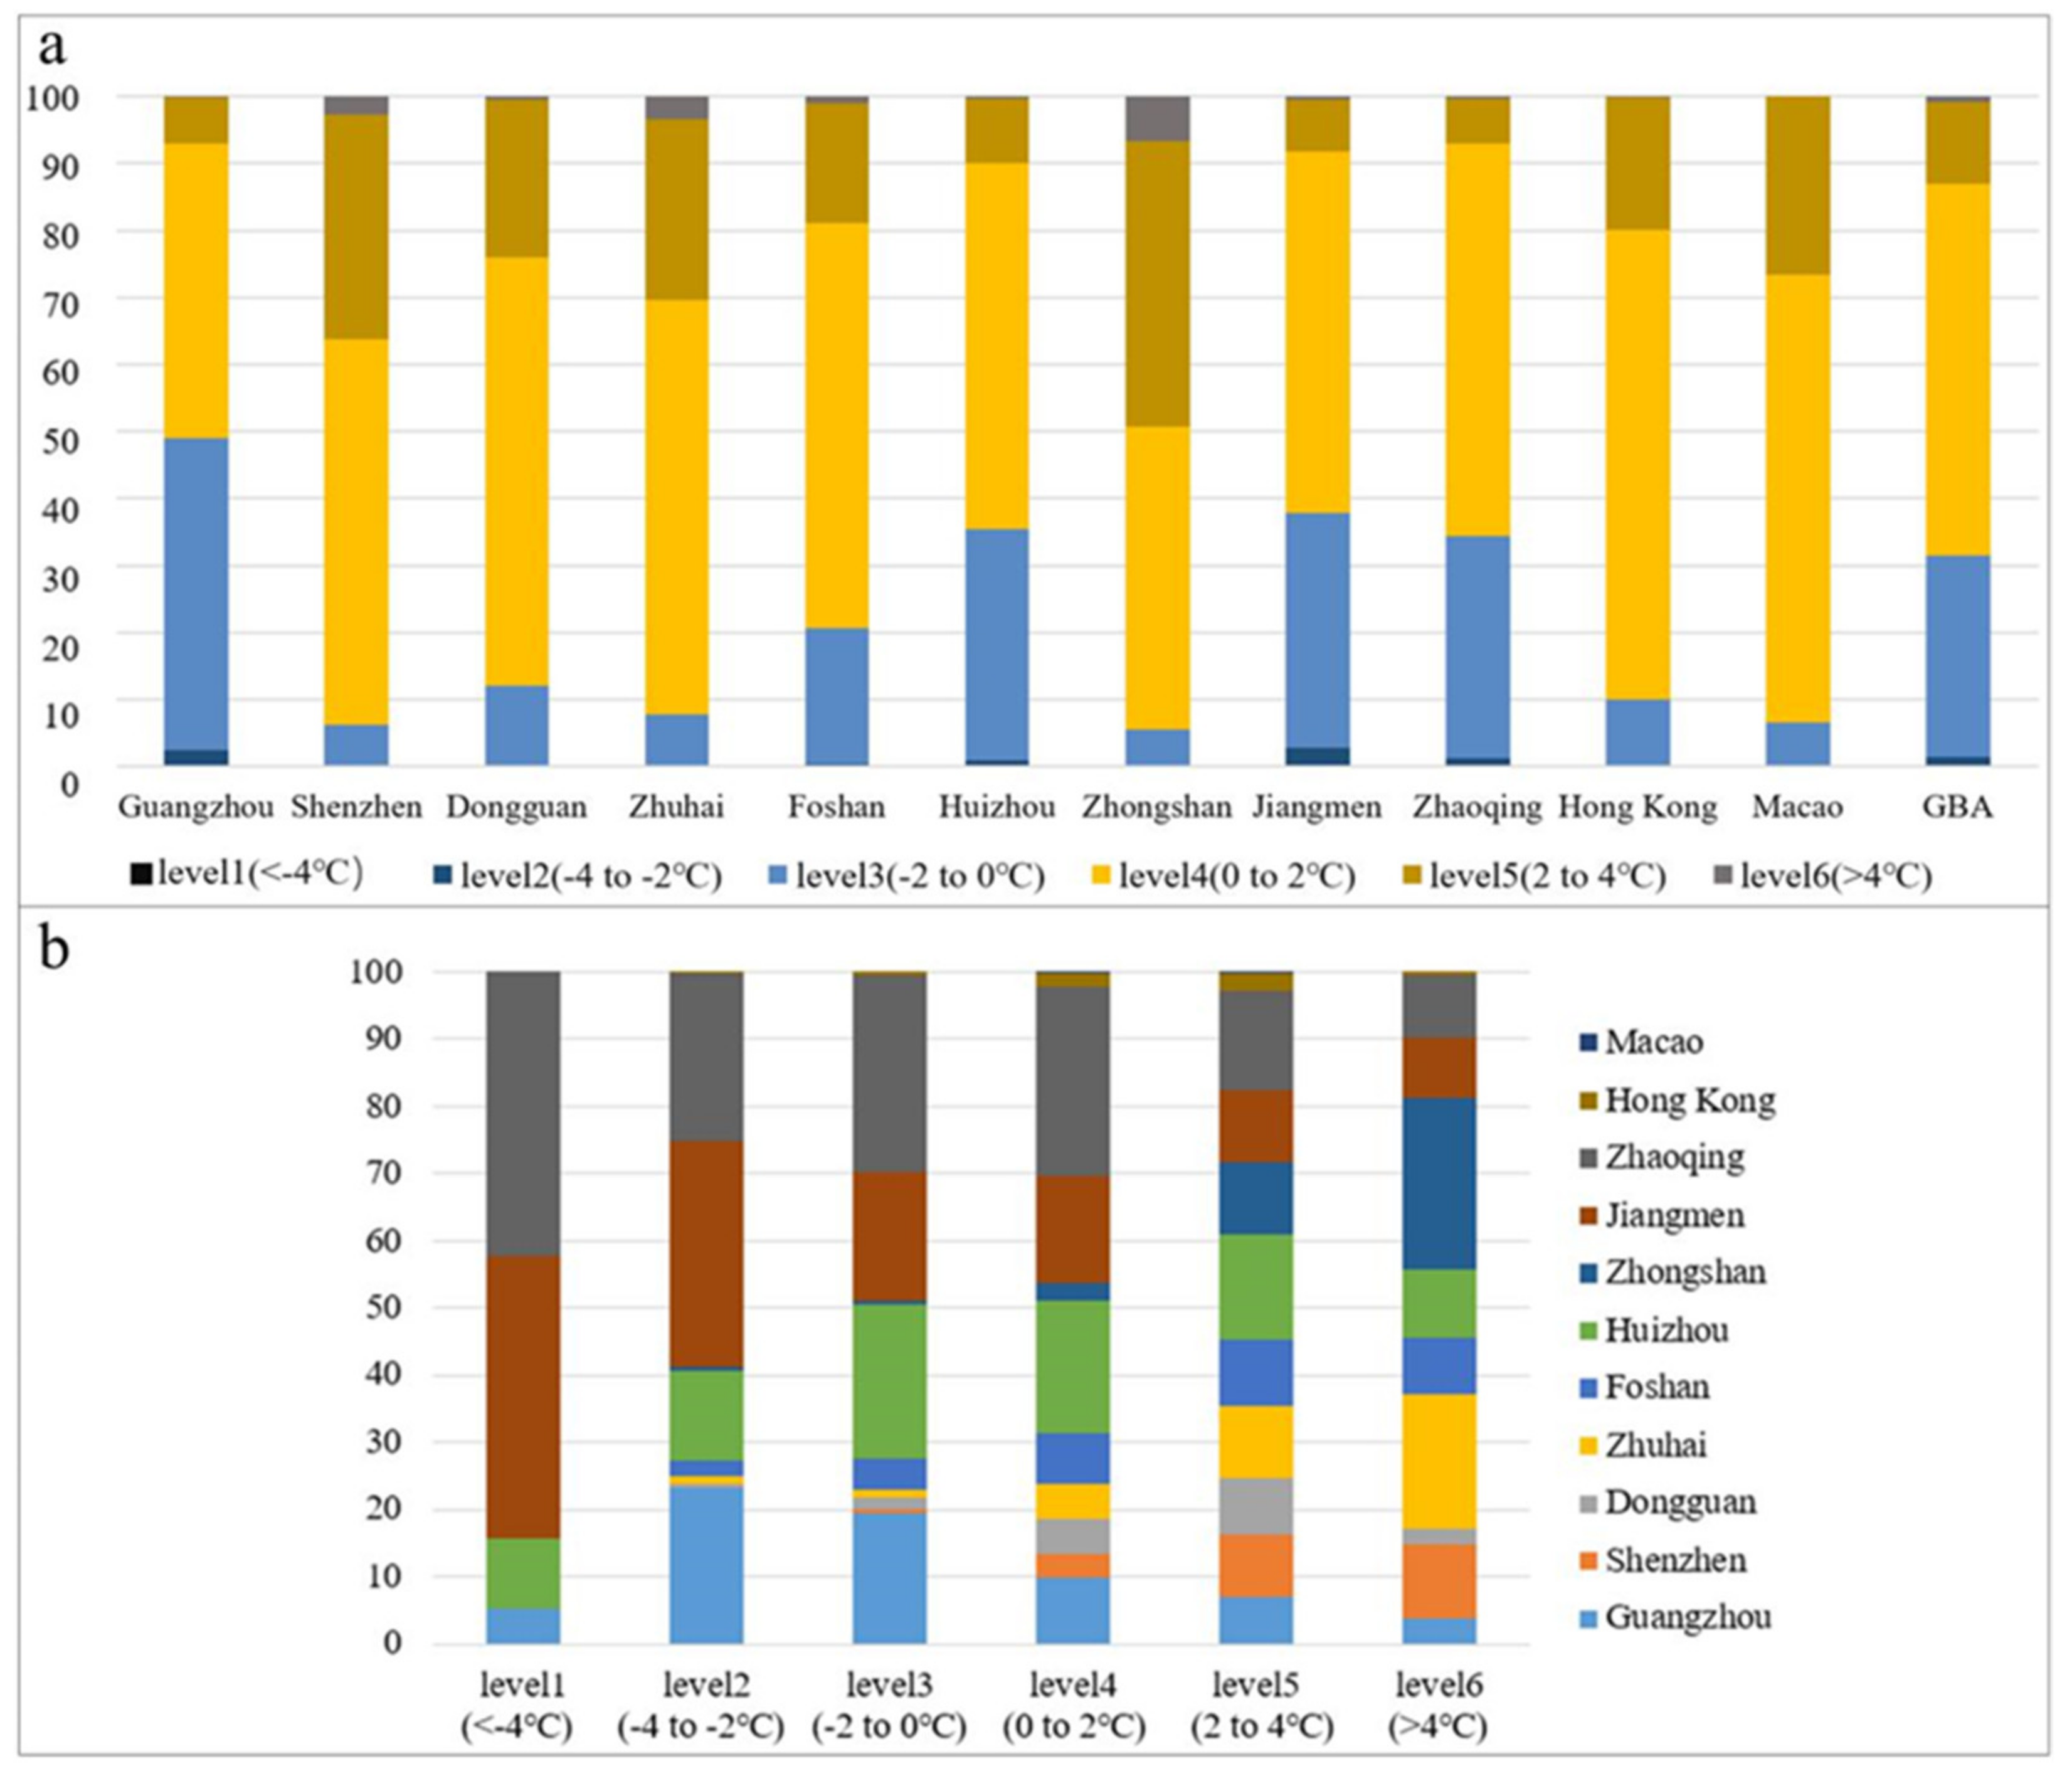
4.2. LST Variation Analysis
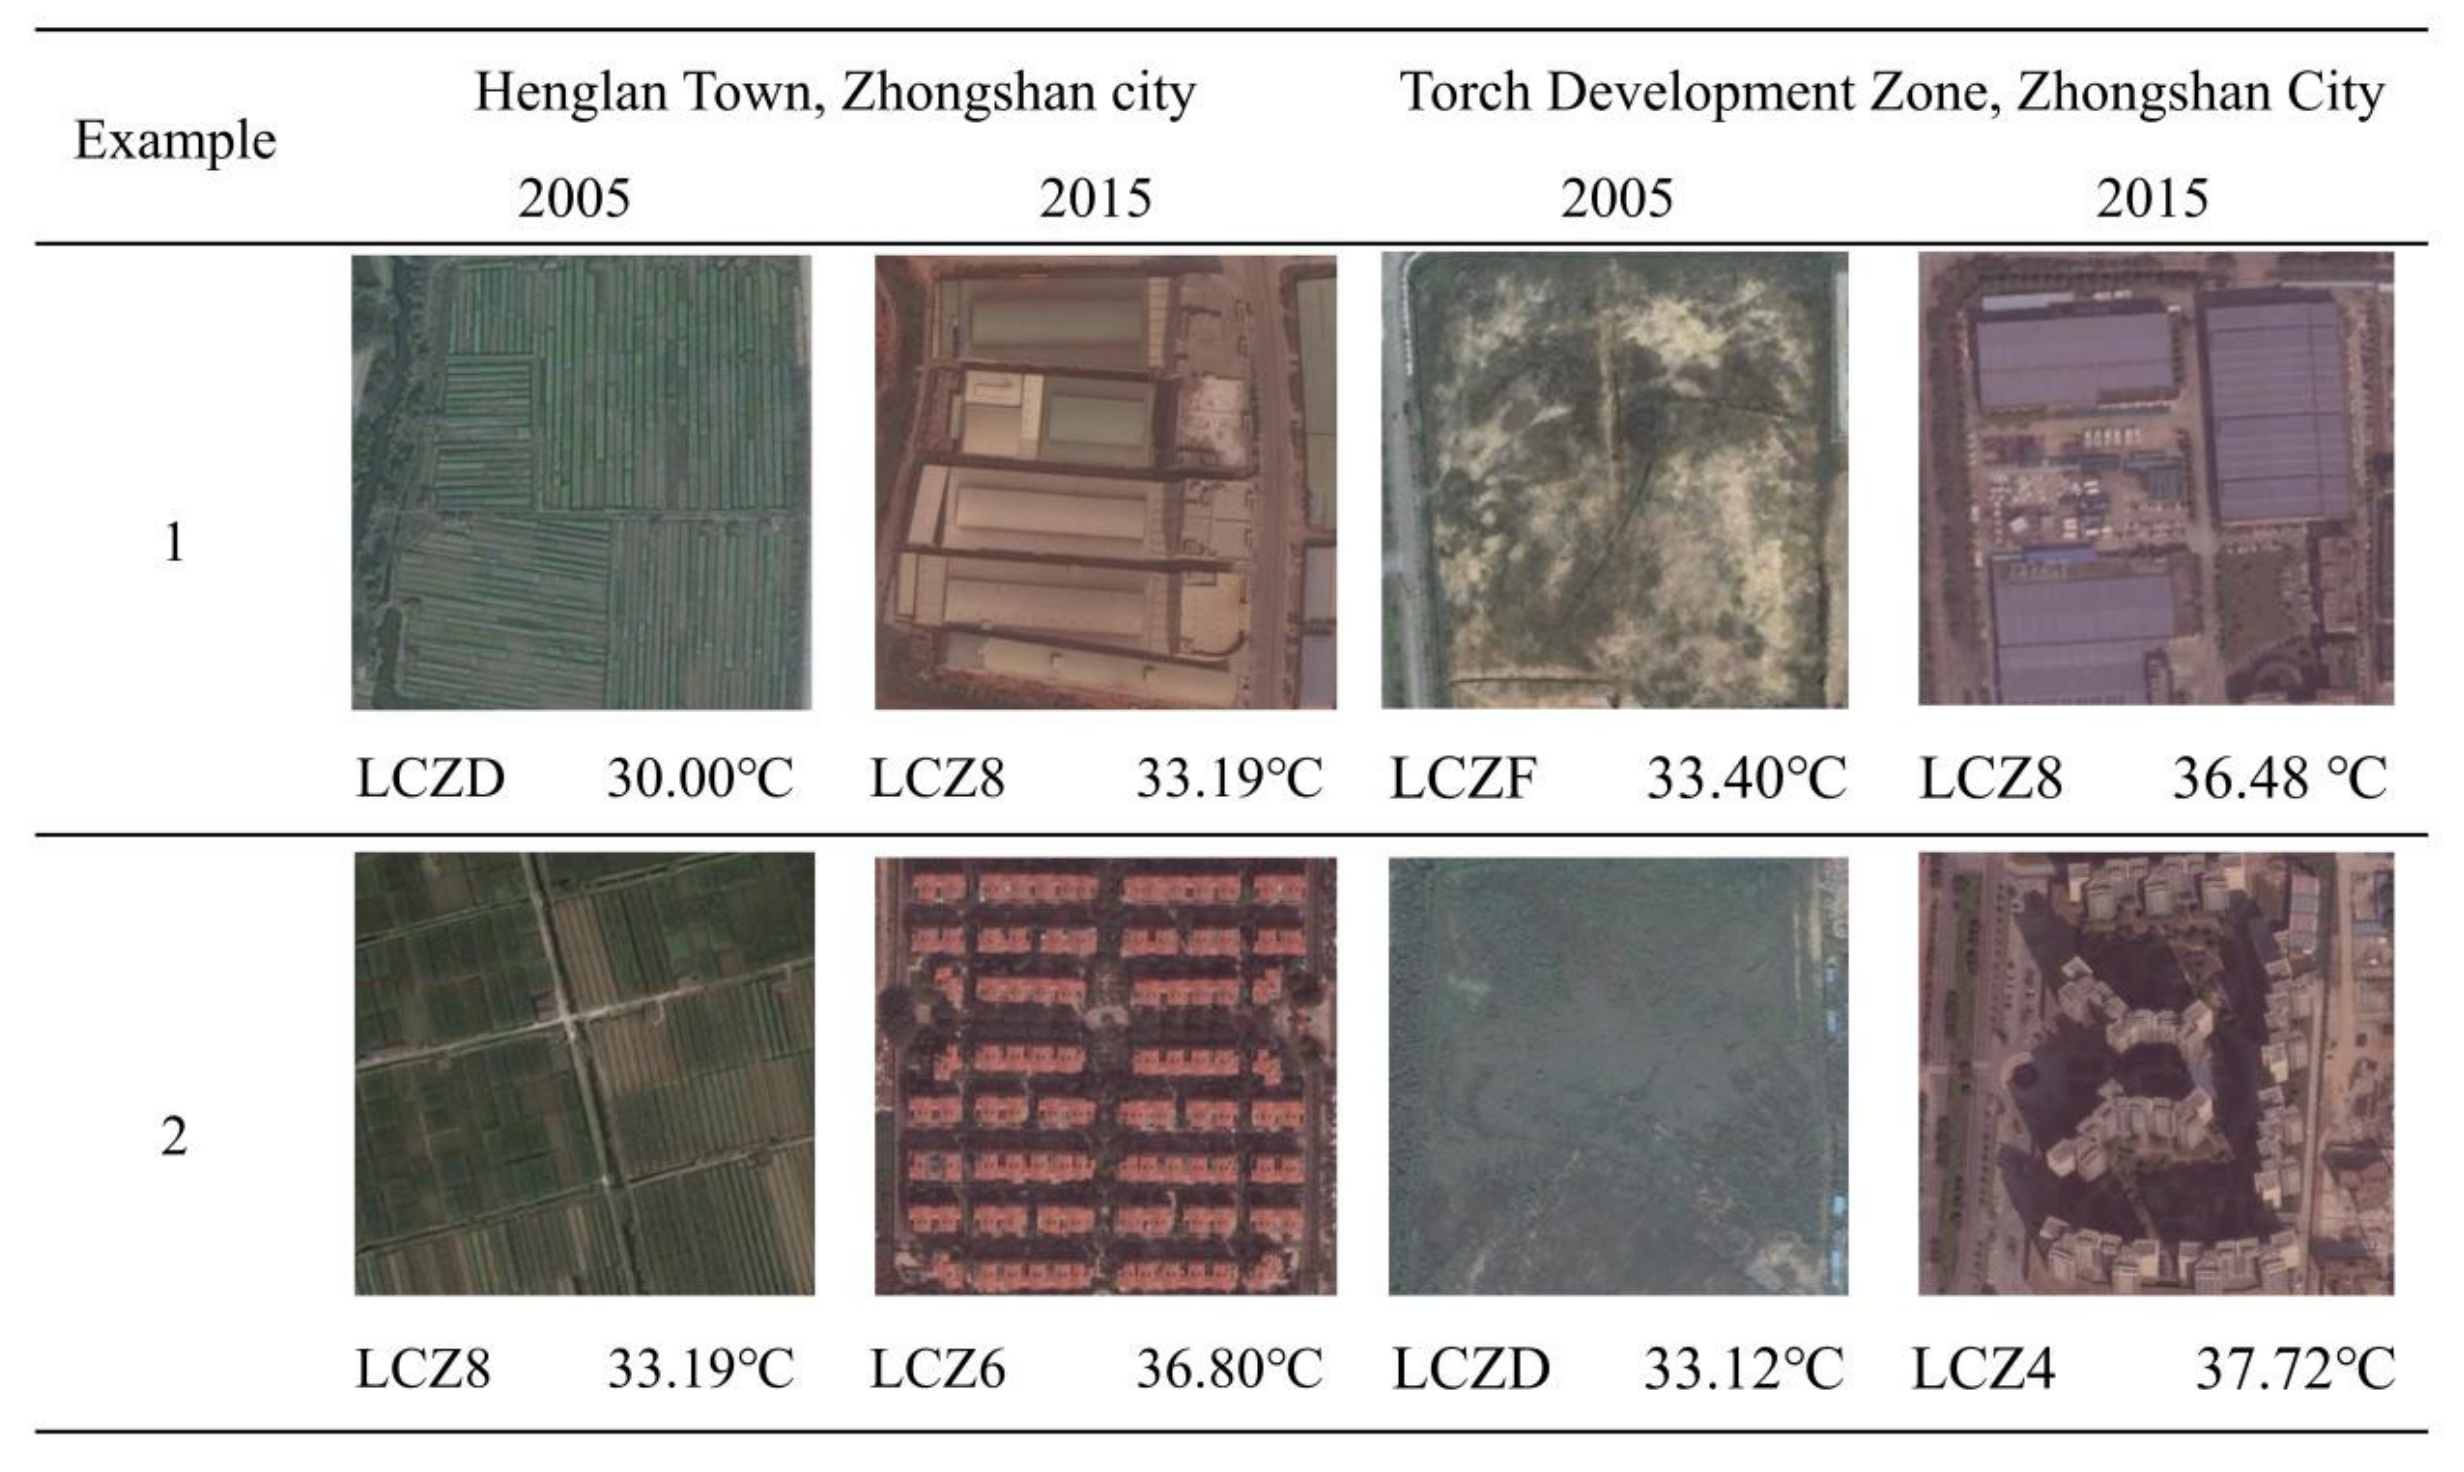
4.3. Influence of LCZ Changes on LST Changes
5. Conclusions
Author Contributions
Funding
Institutional Review Board Statement
Informed Consent Statement
Data Availability Statement
Acknowledgments
Conflicts of Interest
References
- Athukorala, D.; Murayama, Y. Spatial Variation of Land Use/Cover Composition and Impact on Surface Urban Heat Island in a Tropical Sub-Saharan City of Accra, Ghana. Sustainability 2020, 12, 7953. [Google Scholar] [CrossRef]
- Li, X.; Gong, P. Urban growth models: Progress and perspective. Sci. Bull. 2016, 61, 1637–1650. [Google Scholar] [CrossRef]
- Yang, J.; Wu, T.; Gong, P. Implementation of China’s new urbanization strategy requires new thinking. Sci. Bull. 2017, 62, 81–82. [Google Scholar] [CrossRef]
- Sadiq Khan, M.; Ullah, S.; Sun, T.; Rehman, A.U.; Chen, L. Land-Use/Land-Cover Changes and Its Contribution to Urban Heat Island: A Case Study of Islamabad, Pakistan. Sustainability 2020, 12, 3861. [Google Scholar] [CrossRef]
- Zhao, X.; Liu, J.; Bu, Y. Quantitative Analysis of Spatial Heterogeneity and Driving Forces of the Thermal Environment in Urban Built-up Areas: A Case Study in Xi’an, China. Sustainability 2021, 13, 1870. [Google Scholar] [CrossRef]
- Teedon, P.; Gugler, J. The Urban Transformation of the Developing World. Geogr. J. 1997, 163, 306. [Google Scholar] [CrossRef][Green Version]
- Wang, C.; Middel, A.; Myint, S.W.; Kaplan, S.; Brazel, A.J.; Lukasczyk, J. Assessing local climate zones in arid cities: The case of Phoenix, Arizona and Las Vegas, Nevada. ISPRS J. Photogramm. Remote Sens. 2018, 141, 59–71. [Google Scholar] [CrossRef]
- Stewart, I.D.; Oke, T.R. Local climate zones for urban temperature studies. Bull. Am. Meteorol. Soc. 2012, 93, 1879–1900. [Google Scholar] [CrossRef]
- Liu, L.; Lin, Y.; Liu, J.; Wang, L.; Wang, D.; Shui, T.; Chen, X.; Wu, Q. Analysis of local-scale urban heat island characteristics using an integrated method of mobile measurement and GIS-based spatial interpolation. Build. Environ. 2017, 117, 191–207. [Google Scholar] [CrossRef]
- Huang, X.; Wang, Y. Investigating the effects of 3D urban morphology on the surface urban heat island effect in urban functional zones by using high-resolution remote sensing data: A case study of Wuhan, Central China. ISPRS J. Photogramm. Remote Sens. 2019, 152, 119–131. [Google Scholar] [CrossRef]
- Du, H.; Zhou, F.; Li, C.; Cai, W.; Jiang, H.; Cai, Y. Analysis of the Impact of Land Use on Spatiotemporal Patterns of Surface Urban Heat Island in Rapid Urbanization, a Case Study of Shanghai, China. Sustainability 2020, 12, 1171. [Google Scholar] [CrossRef]
- Son, N.T.; Chen, C.F.; Chen, C.R. Urban expansion and its impacts on local temperature in San Salvador, El Salvador. Urban Clim. 2020, 32, 100617. [Google Scholar] [CrossRef]
- Fu, P.; Weng, Q. A time series analysis of urbanization induced land use and land cover change and its impact on land surface temperature with Landsat imagery. Remote Sens. Environ. 2016, 175, 205–214. [Google Scholar] [CrossRef]
- Hua, L.; Zhang, X.; Nie, Q.; Sun, F.; Tang, L. The Impacts of the Expansion of Urban Impervious Surfaces on Urban Heat Islands in a Coastal City in China. Sustainability 2020, 12, 475. [Google Scholar] [CrossRef]
- Ma, Y.; Zhao, M.; Li, J.; Wang, J.; Hu, L. Cooling Effect of Different Land Cover Types: A Case Study in Xi’an and Xianyang, China. Sustainability 2021, 13, 1099. [Google Scholar] [CrossRef]
- Meng, Q.; Zhang, L.; Sun, Z.; Meng, F.; Wang, L.; Sun, Y. Characterizing spatial and temporal trends of surface urban heat island effect in an urban main built-up area: A 12-year case study in Beijing, China. Remote Sens. Environ. 2018, 204, 826–837. [Google Scholar] [CrossRef]
- Shen, H.; Huang, L.; Zhang, L.; Wu, P.; Zeng, C. Long-term and fine-scale satellite monitoring of the urban heat island effect by the fusion of multi-temporal and multi-sensor remote sensed data: A 26-year case study of the city of Wuhan in China. Remote Sens. Environ. 2016, 172, 109–125. [Google Scholar] [CrossRef]
- Yang, J.; Jin, S.; Xiao, X.; Jin, C.; Xia, J.C.; Li, X.; Wang, S. Local climate zone ventilation and urban land surface temperatures: Towards a performance-based and wind-sensitive planning proposal in megacities. Sustain. Cities Soc. 2019, 47, 101487. [Google Scholar] [CrossRef]
- Bechtel, B.; See, L.; Mills, G.; Foley, M. Classification of local climate zones using SAR and multispectral data in an arid environment. IEEE J. Sel. Top. Appl. Earth Obs. Remote Sens. 2016, 9, 3097–3105. [Google Scholar] [CrossRef]
- Pokhrel, R.; Ramírez-Beltran, N.D.; González, J.E. On the assessment of alternatives for building cooling load reductions for a tropical coastal city. Energy Build. 2019, 182, 131–143. [Google Scholar] [CrossRef]
- Richard, Y.; Emery, J.; Dudek, J.; Pergaud, J.; Chateau-Smith, C.; Zito, S.; Rega, M.; Vairet, T.; Castel, T.; Thévenin, T.; et al. How relevant are local climate zones and urban climate zones for urban climate research? Dijon (France) as a case study. Urban Clim. 2018, 26, 258–274. [Google Scholar] [CrossRef]
- Chen, X.; Xu, Y.; Yang, J.; Wu, Z.; Zhu, H. Remote sensing of urban thermal environments within local climate zones: A case study of two high-density subtropical Chinese cities. Urban Clim. 2020, 31, 100568. [Google Scholar] [CrossRef]
- Nassar, A.K.; Blackburn, G.A.; Whyatt, J.D. Dynamics and controls of urban heat sink and island phenomena in a desert city: Development of a local climate zone scheme using remotely-sensed inputs. Int. J. Appl. Earth Obs. Geoinf. 2016, 51, 76–90. [Google Scholar] [CrossRef]
- Vandamme, S.; Demuzere, M.; Verdonck, M.; Zhang, Z.; Coillie, F.V. Revealing Kunming’s (China) historical urban planning policies through local climate zones. Remote Sens. 2019, 11, 1731. [Google Scholar] [CrossRef]
- Das, M.; Das, A. Assessing the relationship between local climatic zones (LCZs) and land surface temperature (LST)—A case study of Sriniketan-Santiniketan Planning Area (SSPA), West Bengal, India. Urban Clim. 2020, 32, 100591. [Google Scholar] [CrossRef]
- Dian, C.; Pongrácz, R.; Dezső, Z.; Bartholy, J. Annual and monthly analysis of surface urban heat island intensity with respect to the local climate zones in Budapest. Urban Clim. 2020, 31, 100573. [Google Scholar] [CrossRef]
- Wang, R.; Cai, M.; Ren, C.; Bechtel, B.; Xu, Y.; Ng, E. Detecting multi-temporal land cover change and land surface temperature in Pearl River Delta by adopting local climate zone. Urban Clim. 2019, 28, 100455. [Google Scholar] [CrossRef]
- Ziaul, S.; Pal, S. Analyzing control of respiratory particulate matter on Land Surface Temperature in local climatic zones of English Bazar Municipality and Surroundings. Urban Clim. 2018, 24, 34–50. [Google Scholar] [CrossRef]
- Nurwanda, A.; Honjo, T. The prediction of city expansion and land surface temperature in Bogor City, Indonesia. Sustain. Cities Soc. 2020, 52, 101772. [Google Scholar] [CrossRef]
- Zhang, W.; Huang, B.; Luo, D. Effects of land use and transportation on carbon sources and carbon sinks: A case study in Shenzhen, China. Landsc. Urban Plan. 2014, 122, 175–185. [Google Scholar] [CrossRef]
- Fang, X.; Fan, Q.; Liao, Z.; Xie, J.; Xu, X.; Fan, S. Spatial-temporal characteristics of the air quality in the Guangdong−Hong Kong−Macau Greater Bay Area of China during 2015–2017. Atmos. Environ. 2019, 210, 14–34. [Google Scholar] [CrossRef]
- Zhou, Y.; Shan, Y.; Liu, G.; Guan, D. Emissions and low-carbon development in Guangdong–Hong Kong–Macao Greater Bay Area cities and their surroundings. Appl. Energy 2018, 228, 1683–1692. [Google Scholar] [CrossRef]
- Yang, C.; Zhang, C.; Li, Q.; Liu, H.; Gao, W.; Shi, T.; Liu, X.; Wu, G. Rapid urbanization and policy variation greatly drive ecological quality evolution in Guangdong–Hong Kong–Macau Greater Bay Area of China: A remote sensing perspective. Ecol. Indic. 2020, 115, 106373. [Google Scholar] [CrossRef]
- Tan, Z.; Lau, K.K.; Ng, E. Planning strategies for roadside tree planting and outdoor comfort enhancement in subtropical high-density urban areas. Build. Environ. 2017, 120, 93–109. [Google Scholar] [CrossRef]
- Liu, L.; Lin, Y.; Xiao, Y.; Xue, P.; Shi, L.; Chen, X.; Liu, J. Quantitative effects of urban spatial characteristics on outdoor thermal comfort based on the LCZ scheme. Build. Environ. 2018, 143, 443–460. [Google Scholar] [CrossRef]
- Yang, Z.; Chen, Y.; Zheng, Z.; Huang, Q.; Wu, Z. Application of building geometry indexes to assess the correlation between buildings and air temperature. Build. Environ. 2020, 167, 106477. [Google Scholar] [CrossRef]
- Guo, G.; Zhou, X.; Wu, Z.; Xiao, R.; Chen, Y. Characterizing the impact of urban morphology heterogeneity on land surface temperature in Guangzhou, China. Environ. Model. Softw. 2016, 84, 427–439. [Google Scholar] [CrossRef]
- Li, W.; Cao, Q.; Lang, K.; Wu, J. Linking potential heat source and sink to urban heat island: Heterogeneous effects of landscape pattern on land surface temperature. Sci. Total Environ. 2017, 586, 457–465. [Google Scholar] [CrossRef]
- Peng, J.; Jia, J.; Liu, Y.; Li, H.; Wu, J. Seasonal contrast of the dominant factors for spatial distribution of land surface temperature in urban areas. Remote Sens. Environ. 2018, 215, 255–267. [Google Scholar] [CrossRef]
- Guo, G.; Wu, Z.; Chen, Y. Complex mechanisms linking land surface temperature to greenspace spatial patterns: Evidence from four southeastern Chinese cities. Sci. Total Environ. 2019, 674, 77–87. [Google Scholar] [CrossRef]
- Liu, S.; Shi, Q. Local climate zone mapping as remote sensing scene classification using deep learning: A case study of metropolitan China. ISPRS J. Photogramm. Remote Sens. 2020, 164, 229–242. [Google Scholar] [CrossRef]
- Yoo, C.; Han, D.; Im, J.; Bechtel, B. Comparison between convolutional neural networks and random forest for local climate zone classification in mega urban areas using Landsat images. ISPRS J. Photogramm. Remote Sens. 2019, 157, 155–170. [Google Scholar] [CrossRef]
- Cai, M.; Ren, C.; Xu, Y.; Dai, W.; Wang, X.M. Local Climate Zone Study for Sustainable Megacities Development by Using Improved WUDAPT Methodology—A Case Study in Guangzhou. Procedia Environ. Sci. 2016, 36, 82–89. [Google Scholar] [CrossRef]
- Yang, G.; Zhao, Y.; Xing, H.; Fu, Y.; Liu, G.; Kang, X.; Mai, X. Understanding the changes in spatial fairness of urban greenery using time-series remote sensing images: A case study of Guangdong–Hong Kong–Macao Greater Bay. Sci. Total Environ. 2020, 715, 136763. [Google Scholar] [CrossRef]
- Wu, P.; Tang, Y.; Dang, M.; Wang, S.; Jin, H.; Liu, Y.; Jing, H.; Zheng, C.; Yi, S.; Cai, Z. Spatial-temporal distribution of microplastics in surface water and sediments of Maozhou River within Guangdong–Hong Kong–Macao Greater Bay Area. Sci. Total Environ. 2020, 717, 135187. [Google Scholar] [CrossRef]
- Wan, Z. New refinements and validation of the MODIS Land-Surface Temperature/Emissivity products. Remote Sens. Environ. 2008, 112, 59–74. [Google Scholar] [CrossRef]
- Duncan, J.M.A.; Boruff, B.; Saunders, A.; Sun, Q.; Hurley, J.; Amati, M. Turning down the heat: An enhanced understanding of the relationship between urban vegetation and surface temperature at the city scale. Sci. Total Environ. 2019, 656, 118–128. [Google Scholar] [CrossRef]
- Yang, Q.; Huang, X.; Tang, Q. The footprint of urban heat island effect in 302 Chinese cities: Temporal trends and associated factors. Sci. Total Environ. 2019, 655, 652–662. [Google Scholar] [CrossRef]
- Zhao, G.; Gao, H.; Cai, X. Estimating lake temperature profile and evaporation losses by leveraging MODIS LST data. Remote Sens. Environ. 2020, 251, 112104. [Google Scholar] [CrossRef]
- Kuang, W.; Zhang, S.; Li, X.; Lu, D. A 30-meter resolution national urban land-cover dataset of China, 2000–2015. Earth Syst. Sci. Data Discuss. 2019, 1–33. [Google Scholar] [CrossRef]
- Huang, X.; Xia, J.; Xiao, R.; He, T. Urban expansion patterns of 291 Chinese cities, 1990–2015. Int. J. Digit. Earth 2019, 12, 62–77. [Google Scholar] [CrossRef]
- Du, P.; Wang, X.; Chen, D.; Liu, S.; Lin, C.; Meng, Y. An improved change detection approach using tri-temporal logic-verified change vector analysis. ISPRS J. Photogramm. Remote Sens. 2020, 161, 278–293. [Google Scholar] [CrossRef]
- Johnson, R.D.; Kasischke, E.S. Change vector analysis: A technique for the multispectral monitoring of land cover and condition. Int. J. Remote Sens. 2010, 19, 411–426. [Google Scholar] [CrossRef]
- Yager, R.R. On the specificity of a possibility distribution. Read. Fuzzy Sets Intell. Syst. 1992, 50, 279–292. [Google Scholar] [CrossRef]
- Rajadell, O.; Garcia-Sevilla, P.; Dinh, V.C.; Duin, R.P.W. Improving hyperspectral pixel classification with unsupervised training data selection. IEEE Geoence Remote. Sens. Lett. 2013, 11, 656–660. [Google Scholar] [CrossRef]
- Maimaitiyiming, M.; Ghulam, A.; Tiyip, T.; Pla, F.; Latorre-Carmona, P.; Halik, Ü.; Sawut, M.; Caetano, M. Effects of green space spatial pattern on land surface temperature: Implications for sustainable urban planning and climate change adaptation. ISPRS J. Photogramm. Remote Sens. 2014, 89, 59–66. [Google Scholar] [CrossRef]
- Li, W.; Bai, Y.; Chen, Q.; He, K.; Ji, X.; Han, C. Discrepant impacts of land use and land cover on urban heat islands: A case study of Shanghai, China. Ecol. Indic. 2014, 47, 171–178. [Google Scholar] [CrossRef]
- Pan, W.; Du, J. Impacts of urban morphological characteristics on nocturnal outdoor lighting environment in cities: An empirical investigation in Shenzhen. Build. Environ. 2021, 192, 107587. [Google Scholar] [CrossRef]
- Akila, M.; Earappa, R.; Qureshi, A. Ambient concentration of airborne microbes and endotoxins in rural households of southern India. Build. Environ. 2020, 179, 106970. [Google Scholar] [CrossRef]
- Liu, Q.; Zhang, S.; Zhang, H.; Bai, Y.; Zhang, J. Monitoring drought using composite drought indices based on remote sensing. Sci. Total Environ. 2020, 711, 134585. [Google Scholar] [CrossRef]
- Lan, Y.; Zhan, Q. How do urban buildings impact summer air temperature? The effects of building configurations in space and time. Build. Environ. 2017, 125, 88–98. [Google Scholar] [CrossRef]
- Yue, W.; Liu, X.; Zhou, Y.; Liu, Y. Impacts of urban configuration on urban heat island: An empirical study in China mega-cities. Sci. Total Environ. 2019, 671, 1036–1046. [Google Scholar] [CrossRef]
- Estoque, R.C.; Murayama, Y.; Myint, S.W. Effects of landscape composition and pattern on land surface temperature: An urban heat island study in the megacities of Southeast Asia. Sci. Total Environ. 2017, 577, 349–359. [Google Scholar] [CrossRef]
- Peng, J.; Xie, P.; Liu, Y.; Ma, J. Urban thermal environment dynamics and associated landscape pattern factors: A case study in the Beijing metropolitan region. Remote Sens. Environ. 2016, 173, 145–155. [Google Scholar] [CrossRef]


| Training Samples | Test Samples | |||||
|---|---|---|---|---|---|---|
| 2015 | 2005 | 2015 | 2005 | |||
| Manual | Manual | Automatic | Total | |||
| LCZ1 | 583(50) | 630(40) | 9 | 639 | 12 | 8 |
| LCZ2 | 2533(253) | 2171 | 2171 | 86 | 85 | |
| LCZ3 | 1182(194) | 1283 | 1283 | 52 | 60 | |
| LCZ4 | 4354(229) | 2105(41) | 2204 | 4309 | 68 | 51 |
| LCZ5 | 3954(252) | 1986 | 1986 | 57 | 65 | |
| LCZ6 | 3627(196) | 2206 | 2206 | 55 | 44 | |
| LCZ8 | 6660(200) | 4431 | 4431 | 77 | 71 | |
| LCZ10 | 806(30) | 762(29) | 9 | 771 | 9 | 8 |
| LCZA | 13,971(210) | 20,054 | 20,054 | 74 | 73 | |
| LCZB | 1961(175) | 1072 | 1072 | 42 | 40 | |
| LCZD | 7290(188) | 10,845 | 10,845 | 63 | 69 | |
| LCZE | 4072(152) | 1539(82) | 191 | 1730 | 41 | 42 |
| LCZF | 5214(202) | 3412 | 3412 | 52 | 49 | |
| LCZG | 12,678(178) | 11,862 | 11,862 | 66 | 70 | |
| Total | 68,885(2509) | 5036(192) | 61,735 | 66,771 | 754 | 735 |
| Metric (Abbreviation) | Calculation | Description |
|---|---|---|
| Percentage of landscape (PLAND) | Measures the proportional abundance of each class in the landscape (unit: %). | |
| Edge density (ED) | Measures the shape complexity and isolation degree (unit: m/ha). | |
| Largest patch index (LPI) | Measures the dominance of each class in the landscape (unit: %). | |
| Aggregation index (AI) | Measures the degree of spatial aggregation (unit: %). |
| PLAND | ED | LPI | AI | |
|---|---|---|---|---|
| LCZ1 | 0.038 | 0.043 | 0.041 | 0.012 |
| LCZ2 | 0.128 ** | 0.019 | 0.048 * | 0.026 |
| LCZ3 | 0.058 * | −0.013 | 0.041 | 0.037 |
| LCZ4 | 0.242 ** | 0.192 ** | 0.116 ** | 0.062 ** |
| LCZ5 | 0.23 ** | 0.129 ** | 0.113 ** | 0.032 |
| LCZ6 | 0.099 ** | 0.051 * | 0.075 ** | 0.021 |
| LCZ8 | 0.175 ** | 0.036 ** | 0.079 ** | 0.018 |
| LCZ10 | 0.064 ** | 0.077 ** | 0.079 ** | 0.101 ** |
| LCZA | −0.069 ** | −0.11 ** | −0.262 ** | −0.052 * |
| LCZB | 0.188 ** | 0.039 | 0.139 ** | 0.188 ** |
| LCZD | −0.015 | −0.043 ** | −0.024 | |
| LCZE | 0.102 ** | 0.118 ** | 0.077 ** | 0.06 ** |
| LCZF | 0.073 ** | 0.024 | −0.014 | −0.007 |
| LCZG | −0.013 | −0.125 ** | −0.088 ** | −0.075 ** |
| p | <0.01 | <0.01 | <0.01 | <0.01 |
| R2 | 0.229 | 0.188 | 0.204 | 0.067 |
| Adjusted R2 | 0.224 | 0.182 | 0.198 | 0.059 |
Publisher’s Note: MDPI stays neutral with regard to jurisdictional claims in published maps and institutional affiliations. |
© 2021 by the authors. Licensee MDPI, Basel, Switzerland. This article is an open access article distributed under the terms and conditions of the Creative Commons Attribution (CC BY) license (https://creativecommons.org/licenses/by/4.0/).
Share and Cite
Lu, Y.; Yang, J.; Ma, S. Dynamic Changes of Local Climate Zones in the Guangdong–Hong Kong–Macao Greater Bay Area and Their Spatio-Temporal Impacts on the Surface Urban Heat Island Effect between 2005 and 2015. Sustainability 2021, 13, 6374. https://doi.org/10.3390/su13116374
Lu Y, Yang J, Ma S. Dynamic Changes of Local Climate Zones in the Guangdong–Hong Kong–Macao Greater Bay Area and Their Spatio-Temporal Impacts on the Surface Urban Heat Island Effect between 2005 and 2015. Sustainability. 2021; 13(11):6374. https://doi.org/10.3390/su13116374
Chicago/Turabian StyleLu, Yang, Jiansi Yang, and Song Ma. 2021. "Dynamic Changes of Local Climate Zones in the Guangdong–Hong Kong–Macao Greater Bay Area and Their Spatio-Temporal Impacts on the Surface Urban Heat Island Effect between 2005 and 2015" Sustainability 13, no. 11: 6374. https://doi.org/10.3390/su13116374
APA StyleLu, Y., Yang, J., & Ma, S. (2021). Dynamic Changes of Local Climate Zones in the Guangdong–Hong Kong–Macao Greater Bay Area and Their Spatio-Temporal Impacts on the Surface Urban Heat Island Effect between 2005 and 2015. Sustainability, 13(11), 6374. https://doi.org/10.3390/su13116374